Abstract
Interest in mobile short-video platforms (MSVP) as a new social network service tool has surged in recent years. However, only a few studies have focused on MSVP users’ post-acceptance behavior. To clarify this issue of sustainable usage, this study analyzed users’ post-acceptance habit formation by incorporating perceived interactivity and perceived enjoyment into the expectation-confirmation theory of the information system continuance (ECT-IS) model using structural equation modelling. We developed and distributed an online questionnaire and collected 219 valid responses from Chinese MSVP users. Our results show that satisfaction is the foremost factor in determining users’ habit formation as it completely mediates the influence of confirmation and perceived interactivity. We also show that perceived enjoyment positively influences habit formation directly and indirectly. Nonetheless, we note that sustainable usage should form the basis of continuous satisfaction from user experience due to a few missing links with regard to modulation in habitual usage. Therefore, we suggest that MSVPs should enhance their content recommendation algorithms using technologies such as deep-learning forecasting to improve users’ satisfaction by increasing perceived enjoyment. We also show that the influence of perceived interactivity on habit formation is effective only when fully mediated by satisfaction. Thus, we recommend that MSVPs should diversify their interaction mechanisms, for instance, by introducing mass creators that promote users’ habit formation by enhancing their satisfaction on the platform.
1. Introduction
The widespread coverage of 4G networks and the popularity of smart mobile terminal devices have impacted people’s daily life, social interaction, and entertainment. According to the 46th Statistical Report on China’s Internet Development Status, released by China Internet Network Information Center(CNNIC), as of June 2020, the number of internet users in China reached 940 million, an increase of 36.25 million from March 2020, with an internet penetration rate of 67.0%, compared with March 2020 (Figure 1). The popularization of mobile internet and reduction in traffic charges have guaranteed users a faster internet access experience. Diversified segmentation becomes the new normal when people use online media to create and share a large amount of scattered information. The most popular form is the mobile short-video type of entertaining or informative content. Users can break time and space barriers to browse and watch these videos. During the COVID-19 pandemic, mobile short-video content has dominated with its ability to engage users in a virtual environment, its content diversity and vivid information. China is no exception to this trend, as most Chinese and global users cannot imagine a day without watching these short videos.
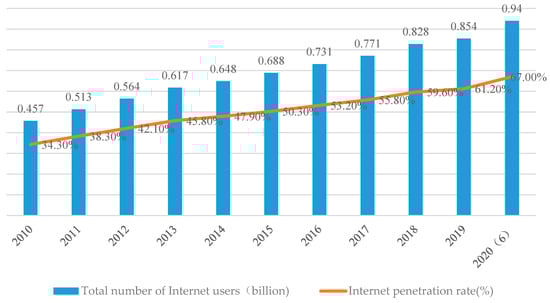
Figure 1.
Scale of Chinese Internet users and Internet penetration rate before June 2020.
The development of China’s mobile short-video platform (MSVP) began in August 2013 with the built-in “Miaopai” short video sharing function launched by Micro-blog [1]. Since them, many short-video platforms have emerged, such as TikTok (known as “DouYin” in China), and Kwai (KuaiShou). Figure 2 shows that MSVP users’ growth rate exceeded 100% in 2017–2018. However, after 2018, this rate began to decline and was only 25% in 2019. With the market trend close to saturation, MSVPs are now facing the challenge of retaining existing users instead of planning expansion. For MSVPs, finding factors that influence users’ habit formation is the most important mission for future sustainable management, keeping users’ retention rate as high as possible. Why are MSVP users leaving these platforms, as shown in Figure 2? During the COVID-19 pandemic, MSVPs could have emerged as an alternative to the more user-friendly online education platforms, and thus the appropriate evaluation of users’ post-adoption behavior is becoming key to sustainable management of online education. Sustainability is not only related to environmentally-friendly economic activity, but to continuous performance among participating economic agents. In this paper, we define sustainable management using the latter perspective. As shown in Figure 2, China’s MSVP is still increasing its users, but the growth rate is rapidly dropping, and thus sustainable governance in the future is doubtful. If online education becomes the popular, MSVPs can be used during the Covid-19 pandemic era, and thus the sustainable governance of MSVPs could become much a much important issue in our society.
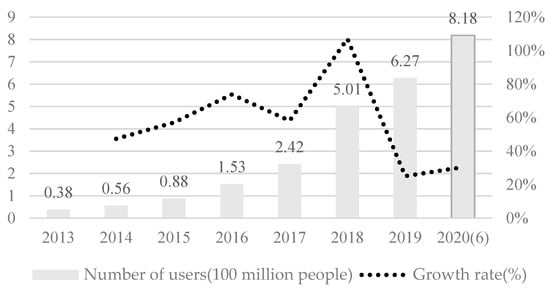
Figure 2.
China’s mobile-short-video platforms (MSVP) user trend (2013–2020) (Source: http://www.cnnic.net.cn/hlwfzyj/). Accessed on the date of 13 May 2020.
For this evaluation, we first clarify the difference between users’ pre-adoption and post-adoption behavior. The eventual success and long-term viability or sustainability of an information system (IS) depends on its continuous use rather than [its] first-time use [1]. Prior research on MSVPs focused on users’ pre-adoption behavior [2,3,4]. For example, Wang [3] studied the impact of humor and camera views on people’s adoption of mobile short-video apps. However, China’s MSVP industry has reached saturation and requires a new approach for another take-off based on users’ loyalty. In addition, previous research on IS users ignored the special characteristics of different ISs, such as perceived usefulness, which is the most important factor in all IS-related studies [5,6]. Perceived usefulness interacts with confirmation and user satisfaction to determine users’ continuous usage [7]. Unfortunately, people are in the “countdown era” for accessing information with characteristics of strong visualization, content entertainment, and high interactivity, due to the lack of habitual loyalty. Therefore, perceived enjoyment and perceived interactivity are increasingly important factors that may determine users’ post-adoption behavior, especially for mobile apps [8,9,10]. This study attempts to incorporate perceived interactivity and perceived enjoyment into the previous continuous use theory to replace perceived usefulness, so as to understand the influencing factors exclusive to MSVPs in terms of habit formation (i.e., continuous usage).
This study contributes to the literature in the following ways. First, it examines users’ behavior from a post-adoption perspective; this provides a unique overview of users’ continuous use of MSVP instead of its pre-adoption, which is of significance to further improve the theoretical framework of IS user behavior. Second, the mobile short-video industry is attracting investment from major internet giants, and research on mobile video has strong practical significance for the diverse potential it holds in online education and other on-line businesses. Thus, we incorporate perceived enjoyment and perceived interactivity into the expectation–confirmation theory of information system continuance (ECT-IS) theory to analyze the influencing factors and their interaction in determining MSVP users’ habit formation. Third, since users’ loyalty to their habitual usage is the key for sustainable MSVP management, we offer practical suggestions to help mobile short video developers better understand users’ needs, so as to improve the existing design and ensure appropriate functional directions for the content of MSVPs.
The remainder of this paper is organized as follows. In Section 2, we review previous research studies adopted in this study; in Section 3, we define the key concepts in the study, propose hypotheses, and present our research model; in Section 4, we analyze the questionnaire data of the model and its results; in Section 5, we conclude the study offering practical implications and suggestions.
2. Literature Review
2.1. Theory of Reasoned Action (TRA)
The research object of our study is to analyze the behavioral process of MSVP users that forms usage habits, which is an aspect of user behavior. There are fruitful theories that may be applicable to our research, such as uses and gratifications theory [11,12], the theory of Etiquettes [13], etc. Yet, we must take into account that human behavior with information technology is mainly divided into two stages: pre-acceptance and post-acceptance, and our research focused mainly on the post-acceptance behavior of MSVP users. Therefore, we relied upon the ECT-IS theory to study this behavior. Furthermore, ECT-IS can find its roots in the theory of reasoned action (TRA) and technology acceptance theory (TAM). Therefore, this section first introduces TRA, which studies human behavior, then technology acceptance theory (TAM), and finally ECT-IS theory.
TRA, proposed by Fishbein [14], was first applied to predict and explain certain behaviors of people with new IS technology. As shown in Figure 3, the theory suggests that people’s behavior is largely influenced by their own rational behavioral intentions. Behavioral intention is the intensity of an individual’s willingness to engage in certain behaviors. When people demonstrate strong willingness to engage in a certain behavior, it can be inferred that they will actually engage in this behavior. Behavioral intention can be traced back to behavioral attitudes and subjective norms. Behavioral attitudes refer to people’s feelings about and evaluation of certain behaviors such as those with positive or negative connotations, and subjective norms refer to behavioral motivations formed by external social and environmental pressures when people engage in certain behaviors [15].
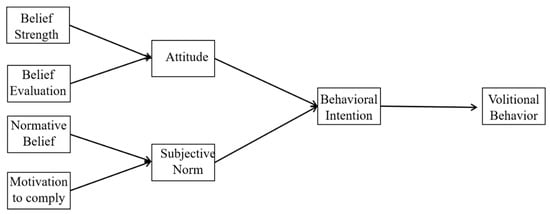
Figure 3.
Theory of reasoned action.
2.2. Technology Acceptance Model (TAM)
Davis [16] proposed the TAM based on the basis of TRA and specifically tailored it to predict and explain initial user experience, particularly in ISs. Figure 4 illustrates the key structure of TAM. It shows that perceived usefulness and perceived ease of use are two important factors, and the former refers to the degree to which users perceive the usefulness of a system or technology to improve their productivity. A high user perceived usefulness score indicates that users believe that the new IS technology can improve their productivity; ease of use refers to how simple it is for users to operate a system [16]. The higher the perceived usefulness of an IS, the stronger the rationale for users to apply the IS, and the easier it becomes for users to accept the system.
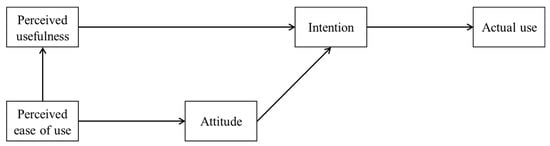
Figure 4.
Technology acceptance model (TAM).
2.3. Expectation–Confirmation Model of Is Continuance
The TAM model focuses exclusively on users’ initial adoption, but ignores people’s continued use behavior after adoption. To gauge consumers’ post-adoption or repeat purchase behavior, the expectation-confirmation theory (ECT) was proposed [17,18,19]. Part 1 of Figure 5 illustrates the key structure and relationships of the ECT. This model examines the interrelationship between pre-behavior (expectation) and post experience (repeat purchase behavior) rather than the formation of pre-adoption behavior. Pee et al. [20] adopted this theory and found that, when consumers’ previous expectations about a product are met, their willingness to make repeat purchases of the product will be enhanced. Fu’s [21] research on public transport passengers’ perception and behavior posited the same conclusion.
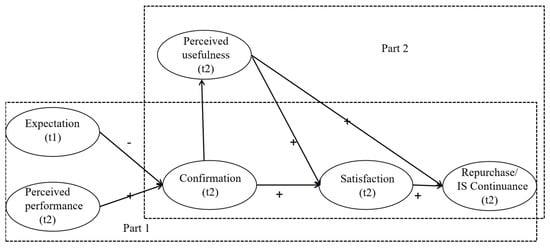
Figure 5.
Expectation–Confirmation Theory (ECT) to ECT-IS (of the Information System). Part 1 shows expectation-confirmation theory; Part 2 exemplifies the concept of the post-acceptance model of IS continuance (ECT-IS Model). Note: t1 = pre-adoption variables; t2 = post-adoption variables.
Bhattacherjee [1] suggested that users’ continued use of ISs is similar to consumers’ repeat purchase behavior because both decisions follow an initial (acceptance or purchase) decision, and are influenced by users’ initial (IS or product) experience. According to Bhattacherjee, this ECT-IS theory posits that users may initially have low usefulness perceptions of a new IS because they are uncertain of what to expect from its use, but they still want to accept it. People’s perception of usefulness is constantly adjusted by the confirmation experience [22]. The influence of confirmation on perceived usefulness implies that rational users may try to reduce this dissonance by distorting or modifying their perceptions to be more consistent with reality. Lee [23] expanded this ECT-IS theory to analyze the factors influencing continuous use of web-based services and suggested that perceived usefulness is the most important factor in determining continuous usage behavior. Moreover, using the ECT-IS model, Yang [24] verified that satisfaction, perceived usefulness, and perceived entertainment significantly influence users’ continued use of content aggregation applications (apps). Lee [25] verified that perceived usefulness has a significant impact on the intention of using traditional video sites such as YouTube. In addition, Mantymaki [26] used this theory and verified that perceived enjoyment has the greatest impact on the continued use of social network users, rather than satisfaction. Zhao and Lu [27] used ECT-IS to explore factors affecting micro-blogging service satisfaction and continuance intention and found that perceived interactivity has a profound influence on satisfaction.
Similar to the above-mentioned IS applications, MSVPs focus particularly on the entertainment aspect of video content and interaction between users. The influence of social media on users is mainly reflected in behavior and emotion. Slater et al. [28] studied the changes in people’s emotional exposure to high-quality content. They believed that acute exposure to parody images led to increased body satisfaction and positive mood (happiness) compared to exposure to ideal celebrity images alone [28]. MVSPs provide much life-like content, which can change people’s emotions subconsciously.
MVSP is a social software with short videos as its core. The way people present themselves on social media is very different from traditional social software. On Facebook and other social software, users mainly display themselves through self-information disclosure and text information, thus constructing online self-identity, but communication ability is very limited. MSVP users mainly present themselves in the form of short videos, which is more intuitive in building self-identity and has stronger communication ability [29]. This study has adopted the ECT-IS model, with perceived enjoyment and perceived interactivity, to examine the post-adoption habit formation behavior of MSVP users.
3. Research Model and Hypotheses
3.1. Confirmation, Perceived Enjoyment, Perceived Interactivity, and Satisfaction
Confirmation is defined as the extent to which an individual’s actual experience is consistent with his or her initial expectation. Since we are evaluating the determinants of habitual use of MSVPs, our initial input is confirmation of the gap between the expected and realized experience. Bhattacherjee and Festinger [30] suggested that users may experience cognitive dissonance if their pre-acceptance usefulness is disconfirmed during actual use. To reduce this dissonance, users adjust their expectations to make them consistent with the actual situation. Confirmation increases the perception of enjoyment, while disconfirmation diminishes it. Perceived enjoyment is defined as the degree of satisfaction of intrinsic motivation in the interaction between users and the internet [31]. Perceived interactivity is defined as the extent to which users perceive their experience of interpersonal interactions [32,33]. Oghuma [34] verified that people constantly adjust their expectations for entertainment, security, and usability, based on actual conditions when they use mobile instant messaging. The same cognitive dissonance occurs in the case of MSVP users, who adjust their expectations for interactivity and entertainment based on actual experience; hence we hypothesize that:
Hypothesis 1 (H1).
Confirmation is positively associated with users’ perceived enjoyment of MSVP use.
Hypothesis 2 (H2).
Confirmation is positively associated with users’ perceived interactivity of MSVP use.
Satisfaction is the feeling users experience with the performance prior to IS use [35,36]. According to ECT, users’ expectations are either met or exceeded during the usage process. The degree of expectation confirmation will directly increase users’ satisfaction with this type of commodity/information technology application. For example, when people’s expectations for mobile fintech payment services are met during use, their satisfaction will increase [37,38]. Similarly, when people use MSVPs, confirmation occurs, and users’ satisfaction increases; thus, we hypothesize that:
Hypothesis 3 (H3).
Users’ extent of confirmation is positively associated with their satisfaction with MSVP use.
3.2. Perceived Enjoyment, Satisfaction, and Habit Formation
Lieberman first proposed the concept of enjoyment (playfulness) in 1977 [39]. Entertainment is the subjective feeling of personal interaction generated by users interacting with computers. Moon [31] developed the concept of playfulness into perceived enjoyment (playfulness) and defined the latter as the degree of satisfaction of intrinsic motivation in the interaction between users and the internet.
Most people use MSVPs for entertainment. Perceived enjoyment is defined as the extent to which the activity of using the technology is perceived to be enjoyable in its own right, apart from any performance consequences that may be anticipated [40]. For example, research on social networking service (SNSs) has discussed the important role of perceived enjoyment in determining usage behaviors [41,42]. A user’s perceived enjoyment comes from the person’s interaction with environmental factors on websites. Many post-adoption studies [43] also confirmed the positive relationship between perceived enjoyment and satisfaction. When users experience entertainment while using MSVPs, they feel satisfied with the constant use of this app. After a period of repetitive behavior, the behavior of using MSVPs with perceived enjoyment will become a subconscious action; hence we hypothesize that:
Hypothesis 4 (H4).
Users’ perceived enjoyment of MSVPs, based on their experience, positively influences their satisfaction.
Hypothesis 5 (H5).
User’s perceived enjoyment with MSVP use positively influences MSVP usage habit formation.
3.3. Perceived Interactivity, Satisfaction, and Habit Formation
Interactivity is an important feature of SNSs such as MVSPs: people use ICT to achieve efficient person-to-person communication, to share their life experiences and information, and to receive responses from others [44]. Chang [9] analyzed the impact of perceived interactivity on the continued use of social networking sites. The results indicate that perceived interactivity positively influences social gratification. Zhao [45] analyzed the role of perceived interactivity in the case of micro-blogging service satisfaction and continuance intention and found that perceived interactivity is positively related to micro-blogging service users’ satisfaction, which further significantly influences their continuance intention.
The design of MSVPs that enable users to interact with content creators and friends also reflects the importance of MVSPs with regard to interactivity. These interactivity mechanisms encourage users to believe that their interaction is being used as feedback, such that it may enhance their satisfaction during repeated use of MSVPs. When their actions constantly interact with feedback, they will be more willing to participate in the use of MSVPs, continue to use behaviors repeatedly, and finally form the habit of using MSVPs; thus, we hypothesize that:
Hypothesis 6 (H6).
Users’ perceived interactivity of MSVPs, based on their experience, positively influences their satisfaction.
Hypothesis 7 (H7).
User’s perceived interactivity with MSVP use positively influences their MSVP usage habit formation.
3.4. Satisfaction and Habit Formation
Habit was originally conceptualized as a non-reflective and repetitive behavior in studies related to medical care [46,47]. Later, Saba et al. [44] defined “habit” as a behavior that is in some way automatic, or due to awareness of the subject, or as a frequently repeated past behavior. Verplanken [48] further suggested that habit formation is a learned sequence of acts that have become automatic responses to specific cues and are functional in achieving certain goals or end states.
In the context of information technology use, habit describes the extent to which users respond to certain situations instinctively when using a particular IS [49]. According to this definition, habit becomes a non-rational automatic behavior in using an IS technology, where its extent can be strengthened or weakened. When using social media or networks, various needs can be quickly met by certain functional designs; therefore, habitual behavior can occur under certain circumstances [50,51]. Briefly, habits can be influenced by other factors as automatically activated behaviors. In particular, Limayem et al. [52] identified user satisfaction as the key antecedent of IS habit formation. Once MSVP users successfully achieve their goals using the service, they tend to unconsciously repeat the MSVP usage behavior for cues pertaining to the same context and related goals. Thus, user satisfaction with MSVP usage is expected to be closely associated with habitual use. Hence, we hypothesize that:
Hypothesis 8 (H8).
Level of satisfaction with MSVP use positively influences users’ MSVP habit formation.
Previous studies found that age, gender, game experience, and in-app expense may influence users’ online usage habits [53]. As a new type of social tool, age structure, gender, frequency of use, and the short video platform may impact the formation of a habit. In this study, to better evaluate usage behavior, we consider gender, age, platform, and frequency as the control variables. Based on the hypotheses, we propose our research model in Figure 6.
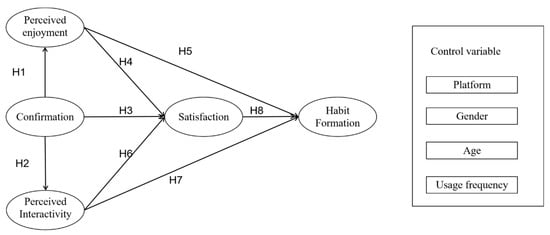
Figure 6.
Research model.
4. Data and Empirical Results
4.1. Data
To test the model and hypotheses, we employed an online questionnaire distribution platform—Wenjuanxing—to distribute our questionnaire and collect data in China for the period May–June, 2020 (Details on Appendix A). This website is open to public response, and thus can avoid any bias in region, or other user-related characters. If the user responds correctly without any systematic error, he or she will get little remuneration, which will enhance the response rate. Thus, as shown in Table 1, the distribution of the respondents is diverse, without any bias in the population. A total of 305 questionnaires were collected, but due to the lack of some missing values, only 219 valid questionnaires were finally obtained (effective recovery rate 71%). Table 1 summarizes the demographic information of the respondents.

Table 1.
Demographic profile of respondents.
We adapted all measurement items, including the following five constructs: perceived enjoyment, satisfaction, confirmation, perceived interactivity, and habit formation. Measurement items were adopted for each construct, and all items were measured on a 7-point Likert scale ranging from “strongly disagree” (1) to “strongly agree” (7). As we require users with experience in using short video platforms, if a respondent selects “never used,” the survey is designed to drop the sample automatically.
The age distribution shows that the survey respondents were predominantly between 19–25 years old, with this group accounting for 78.36% of the total sample. Respondents aged 26–30 years accounted for 11.15%. The overall age of the respondents is relatively young, which is reasonable because young people are more inclined to accept MSVPs. From the perspective of educational attainment, 62.62% of the respondents possess a bachelor’s degree or above, indicating that highly educated people are more likely to accept new things. According to occupation distribution, most of the respondents were either students or office workers, which also conforms to the choice of MSVPs by these target users.
From the analysis of respondents’ use of MSVPs (Table 2), 61.64% use mobile short videos every day, indicating a very high mobile short video usage frequency. Most of the respondents (36.07%) use MSVPs 10–30 min daily, followed by respondents (27.21%) with more than 60 min. The usage pattern conforms to fragmented usage habits. Many users generally open their mobile short videos during their leisure time, browse, like, comment, or share videos of interest.
Table 2.
Descriptive statistics on the basic usage patterns of MSVP users.
4.2. Reliability and Validity
SPSS 25.0 and AMOS 24.0 were used to conduct structural equation modeling (SEM). First, reliability analysis was conducted to test the consistency and stability of the measurement results. The higher the consistency, the higher the reliability of the questionnaire. We assessed the reliability of the four constructs using Cronbach’s α. Table 3 shows that each factor loading is above 0.7, which is the recommended value for Cronbach’s α [54]. We also calculated composite reliability (CR), an alternative to Cronbach’s α. The results confirm the validity of the Cronbach’s α test, as all the CRs are higher than 0.7.
Table 3.
Individual item reliability of potential user group.
We tested the model for validity as shown in Table 4. We first tested the construct validity of the model using average variance extracted (AVE). The results indicate that the model variables are accurate, as all AVEs are above 0.5. On this basis, we evaluated the discriminant validity of the latent variables, which indicates the extent to which independent evaluation methods show divergent measurements of different traits and whether concepts or measurements that are supposed to be unrelated are, in fact, unrelated. Discriminant validity of the factors was evaluated by comparing the square root of AVEs and construct correlations, as suggested by Fornell [55]. Table 4 shows that the model is valid in the discriminant validity test.
Table 4.
Discriminant validity test.
Finally, we test the goodness-of-fit of our model. We used confirmatory factor analysis (CFA) to test the measurement model. Table 5 shows the results. Most of the different overall goodness-of-fit indices meet the recommended criteria, indicating that the goodness-of-fit of the measurement model is acceptable.
Table 5.
Goodness-of-fit test.
4.3. Hypothesis Testing
Figure 7 shows the path analysis of the SEM. First, among the control variables, the impact of frequency of usage ((b = 0.2, p < 0.001) on habit formation is significant. Chun-Hsiung et al. [56] also reached the same conclusion in their study of habit formation in augmented reality (AR) games, although differences in gender, age, and platform have little effect on habit formation. It is noteworthy that the role of frequency of usage is significant for habitual use. Most users are not sensitive about brands such as “TikTok”; rather, they use the same MSVPs without much differentiation between these and others, implying that if the U.S. President Donald Trump bans TikTok from the U.S. market and/or global markets, users will not hesitate to transfer to other MSVPs because there is no psychological barrier about a specific MSVP brand.
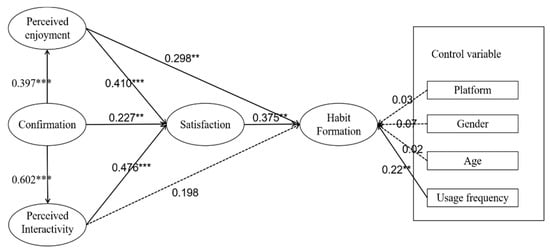
Figure 7.
Path analysis of the research model. Notes: ** p < 0.01; *** p < 0.001.
Besides, as hypothesized, all standardized beta coefficients (b) are positive in the research model. Specifically, there is a discernable relationship between confirmation and perceived enjoyment (b = 0.602, p < 0.01) and perceived interactivity (b = 0.397, p < 0.001). Thus, H1 and H2 are supported, indicating that MSVP users will adjust their previous expectations for entertainment and interactivity according to their actual usage. Hypothesis 3 between expectation confirmation and satisfaction (b = 0.227, p < 0.01) is also supported. That is, when users’ expectation of MSVP is confirmed, their satisfaction with it will increase significantly. Perceived enjoyment also has a strong effect on users’ satisfaction (b = 0.41, p < 0.001) and habit formation (b = 0.30, p < 0.01); thus, H4 and H5 are also supported. Perceived interactivity also has a strong effect on users’ satisfaction (b = 0.476, p < 0.001), thereby H6 is supported. Surprisingly, the impact of perceived interactivity on habit formation is insignificant (b = 0.198, p > 0.05), and H7 is not supported. The rejection of a positive relationship between perceived interactivity and habit formation may be ascribed to the lack of interactivity mechanisms among MSVPs. Currently, main interactivity mechanisms are employed to check points such as the number of likes, comments, and shares, which may be ineffective in arousing users’ interests in actively using these functional designs and assisting in habit formation. Nonetheless, the settings of these interactive mechanisms can produce a pleasurable end-user experience. Thus, besides watching videos, users’ satisfaction can be improved to some extent, and this explains the significant relationship between perceived interactivity and satisfaction only via satisfaction. H8 is supported, indicating that user satisfaction positively influences user’s habit formation (b = 0.375, p < 0.01). In order to determine the primary reason for H7 being rejected, we examine the role of satisfaction as the mediator in our model in the next section.
4.4. Mediation Analysis
The path analysis only revealed the significance of the relationship between each pair of variables. However, given that there are several intermediate variables between confirmation and habit formation, the mediation effects of these intermediate variables are still unclear, especially in determining users’ habit formation. Therefore, we conduct a mediation effect analysis on the variables related to habit formation. Unfortunately, the traditional approach using path analysis for the role of the mediatory variable did not work well in our research, resulting in much lower goodness-of-fit indices. Hence, we adopted the more complex, but much more reliable coefficient estimates simulation approach.
To analyze the mediation effect, we adopted the bootstrapping and product-of-coefficients approach, as recommended by MacKinnon [57], where the bootstrapping process is employed to simulate the distribution of the mediation effect estimation. If the bootstrapped confidence interval (CI) (both bias-corrected 95% CI and percentile 95% CI) of the point estimate of the indirect effect through the proposed mediator does not include zero, the mediation effect is significant [58]. If the direct effect exists under the premise of this mediation effect, then the intermediate variable has a “partial mediation” effect; if no direct effect exists, the intermediate variable plays a role of “complete mediation.”
Table 6 shows the mediation effect analysis of all paths related to habit formation, where the total effect in path analysis is decomposed into indirect effect, which stands for the causality related to the mediation of an intermediate variable, and direct effect. First, we observe that satisfaction and perceived enjoyment are complete mediation variables between confirmation and habit formation. However, no mediation effect exists for perceived interactivity as an intermediate variable between confirmation and habit formation. In addition, satisfaction is also a complete mediation variable for the relationship between perceived interactivity and habit formation, but it is a partial mediation variable between perceived enjoyment and habit formation.
Table 6.
Mediation effect analysis.
5. Discussion and Conclusions
With the saturation of the MSVP market, how to retain existing users is becoming a focal point for the sustainable management of MSVPs. To this end, this study has focused on the habit formation of MSVP users in China.
Our results show that perceived enjoyment and satisfaction have a significant and direct influence on users’ habit formation, whereas confirmation and perceived interactivity have no direct influence on habit formation; however, they can affect habit formation via user satisfaction. Nonetheless, perceived interactivity has no significant effect on satisfaction, implying that this variable is the Achilles’ heel for the sustainable management of MSVPs. Users are much more sensitive to a lack of “perceived” interactivity on the platform, and did not feel satisfied with the videos of a specific brand or company. This is also indicated in the evaluation results of the control variables, where frequency is the only variable showing a strong tendency toward habit formation. This implies that no specific company has market leadership due to a lack of “perceived” interactivity. Most users can easily switch from their habitual platform such as TikTok to another without any automatic reaction on reuse. Nonetheless, users showed a strong tendency to use MSVPs, implying that they are keen to continue watching short videos, but they want MVSPs to respond on feedback from the users. Without any market-oriented efforts on “perceived” interactivity, the current success of MSVPs is not sustainable, as shown in Figure 2. At the initial stage, users were quite surprised with these short videos because most of the content is made by involving another user, and the videos seem more emotionally charged, with high levels of satisfaction. However, after initial use, MVSPs should obtain more market-oriented feedback from the users of MSVPs.
How can MVSPs improve their perceived interactivity? Three practical suggestions must be addressed while enhancing the entertainment aspect of users’ experience. First, diversifying the video content, that is, organizing video creation competitions on various topics in order to extend the scope of the video content to a specific field. Second, introducing professional content creators, such as actors, singers, athletes, professors, and folk artists. Professional content creators can diversify the content of MSVPs’ short-video databases while improving video quality. In addition, MSVPs can provide more incentives to mass video creators, such as coupons, special gifts, and even cash, so as to satisfy their sense of gain when they increase their interaction with the platform; MSVPs can also develop social-media-like small applications to arrange users into social groups centered on the short video content so as to enhance MSVPs’ social attributes. Third, MSVPs’ recommendation algorithms must be enhanced to accurately promote content that is tailored to the interests of individual users, and more artificial intelligence technologies may be used in accurate recommendations. In this way, MSVPs can be used to improve users’ satisfaction by increasing their perceived enjoyment. Moreover, they can be used in new blue ocean supplementary tools for online education.
Specifically, this seems important during the COVID-19 pandemic because remote teaching has become much more popular, but most of these online educational types of content represent a top-down approach adopted by lecturers, that is, without feedback from students. Students can be easily engaged in video content, rather than text-oriented information transfer from lecturers to students. Therefore, MVSPs can emerge as an impressive source of future online education if the platforms do better than listen to the voices of users and encourage open voluntary participation so that users can create their own educational content. We show that satisfaction is a complete mediation variable influencing the path of confirmation habit formation and perceived interactivity–habit formation. It is also a partial mediation variable influencing the perceived enjoyment–habit formation path. In this context, satisfaction is the most important factor in determining people’s habit formation in using MSVPs [59].
In addition, it is interesting to find that, among the control variables, frequency of use ((b = 0.2, p < 0.001) is the only variable that has a significant impact on habit formation. Other variables such as gender, age, and even platforms such as TikTok have no significant effect on habit formation. This result explains why the wide-spread adoption of MSVPs occurred within such a short time, as the habit formation mechanism exhibits no difference between users with varying gender and age attributes. Moreover, it also explains the diversification of MSVP products in China—there are tens of MSVPs operating in China—as users are indifferent to any difference in platforms. The study result also questions the effectiveness of the wide-spread administrative prohibition in countries such as the US and India of Chinese TikTok. As users’ high frequency usage has caused heavy reliance on the MSVP, banning TikTok may have a short-term impact because most users do not demonstrate loyalty toward a single brand such as TikTok, and thus effortlessly transfer to another platform. Like a mouse hunt game, if the US hits one mouse, another mouse will be launched in the market without any difficulty.
This work may also be subject to some limitations. First, more factors that influence the habit formation process, such as perceived usefulness, need to be addressed to comprehensively examine the determinants of habit formation among users of MSVPs. In addition, perceived usefulness of a system or technology in improving users’ productivity may lead to biases in the conclusions of the hypothesis of perceived usefulness on emotional benefits, which need to be discussed in future studies. Second, while the survey users are all Chinese, MSVPs such as TikTok and Kwai are already in the process of globalization. It is worth studying whether different cultural backgrounds will affect user experience, which requires cross-country multi-sample research in the future. Finally, MSVP is still in continuous integration with other industries, and there may be more possibilities in the future, which require further theoretical research.
Author Contributions
The authors contributed to each part of the paper by: conceptualization, Y.C.; methodology, M.C.; software, F.Y.; validation, Y.C.; formal analysis, M.C.; investigation, H.W.; resources and data curation, M.C.; writing—original draft preparation, M.C.; writing—review and editing, Y.C.; supervision, H.W.; project administration, Y.C.; funding acquisition H.W. All authors have read and agreed to the published version of the manuscript.
Funding
This study was supported by the Korea Foundation in 2018; and the National Research Foundation of Korea (Grant No. NRF-2019R1A2C1005326).
Data Availability Statement
Not applicable.
Conflicts of Interest
The authors declare no conflict of interest.
Appendix A
Table A1.
Questionnaire.
Table A1.
Questionnaire.
| Variable | Questions | References |
|---|---|---|
| Confirmation | Q1: The content quality of the mobile short video app is better than expected. | [1] |
| Q2: The interaction design and impact of the mobile short video app is better than expected. | ||
| Q3: Overall, the mobile short video app is better than expected. | ||
| Q4: Overall, my expectations for using this mobile short video app have all been met after use | ||
| Perceived enjoyment | Q5: The diversity of short video content on this mobile short video app can arouse my interest | [43,60] |
| Q6: When using this mobile short video app, I enjoy it very much | ||
| Q7: Watching and shooting short videos with this mobile short video app will make it more enjoyable for me. | ||
| Perceived interactivity | Q8: My uploaded and reposted videos and comments on this mobile short video can also get interactive feedback from others. | [9] |
| Q9: For some interesting content on this video, I will like, repost, comment, and see others’ interactions. | ||
| Q10: I will actively use this mobile short video app to shoot and upload short videos. | ||
| Satisfaction | Q11: I think using this mobile short video app is a wise decision. | [1] |
| Q12: Compared with other mobile social apps, I am more than satisfied with this mobile short video app. | ||
| Q13: My needs are met when using this short video app | ||
| Q14: After using this mobile short video app, I feel very satisfied. | ||
| Habit | Q15: Itis natural for me to use this mobile short video app. | [50,51] |
| Q16: Under special circumstances, using this mobile short video app is my obvious choice. | ||
| Q17: I am habituated to using mobile short video apps. | ||
| Q18: In the past week, the frequency of using this mobile short video app is almost the same as before. |
References
- Bhattacherjee, A. Understanding information systems continuance: An expectation-confirmation model. MIS Q. 2001, 25, 351–370. [Google Scholar] [CrossRef]
- Wang, Y. Influence of camera view on TikTok users’ presence, immersion, and adoption intent. Comput. Hum. Behav. 2020. [Google Scholar] [CrossRef]
- Jasperson, J.; Carter, P.E.; Zmud, R.W. A Comprehensive conceptualization of post-adoptive behaviors associated with information technology enabled work systems. MIS Q. 2005, 29, 525. [Google Scholar] [CrossRef]
- Hsu, M.-H.; Yen, C.-H.; Chiu, C.-M.; Chang, C.-M. A longitudinal investigation of continued online shopping behavior: An extension of the theory of planned behavior. Int. J. Hum. Comput. Stud. 2006, 64, 889–904. [Google Scholar] [CrossRef]
- Chou, C.-H.; Chiu, C.-H.; Ho, C.-Y.; Lee, J.-C. Understanding Mobile apps continuance usage behavior and habit: An Expectance-Confirmation Theory. In Proceedings of the PACIS 2013, Jeju, Korea, 18–22 June 2013; p. 132. [Google Scholar]
- Lin, C.-P.; Tsai, Y.H.; Chiu, C.-K. Modeling customer loyalty from an integrative perspective of self-determination theory and expectation–confirmation theory. J. Bus. Psychol. 2009, 24, 315–326. [Google Scholar] [CrossRef]
- Hsiao, C.-H.; Chang, J.-J.; Tang, K.-Y. Exploring the influential factors in continuance usage of mobile social Apps: Satisfaction, habit, and customer value perspectives. Telemat. Inform. 2016, 33, 342–355. [Google Scholar] [CrossRef]
- Nysveen, H.; Pedersen, P.E.; Thorbjørnsen, H. Intentions to use mobile services: Antecedents and cross-service comparisons. J. Acad. Mark. Sci. 2005, 33, 330–346. [Google Scholar] [CrossRef]
- Chang, C.-M. Understanding social networking sites continuance. Online Inf. Rev. 2018, 42, 989–1006. [Google Scholar] [CrossRef]
- Shiau, W.-L.; Luo, M.M. Continuance intention of blog users: The impact of perceived enjoyment, habit, user involvement and blogging time. Behav. Inf. Technol. 2013, 32, 570–583. [Google Scholar] [CrossRef]
- Quan-Haase, A.; Young, A.L. Uses and gratifications of social media: A comparison of facebook and instant messaging. Bull. Sci. Technol. Soc. 2010, 30, 350–361. [Google Scholar] [CrossRef]
- Ruggiero, T.E. Uses and gratifications theory in the 21st century. Mass Commun. Soc. 2017, 3, 36–70. [Google Scholar] [CrossRef]
- Edosomwan, S.; Prakasan, S.K.; Kouame, D.; Watson, J.; Seymour, T. The history of social media and its impact on business. J. Appl. Manag. Entrep. 2011, 16, 79–91. [Google Scholar]
- Fishbein, M.; Ajzen, I. Belief, Attitude, Intention, and Behavior: An Introduction to Theory and Research; Adison-Wesley: Reading, MA, USA, 1975. [Google Scholar]
- Zheng, S.; Cheng, Y.; Ju, Y. Understanding the intention and behavior of renting houses among the young generation: Evidence from Jinan, China. Sustainability 2019, 11, 1507. [Google Scholar] [CrossRef]
- Davis, F.D. Perceived usefulness, perceived ease of use, and user acceptance of information technology. MIS Q. 1989, 13, 319–340. [Google Scholar] [CrossRef]
- Oliver, R.L. Cognitive, affective, and attribute bases of the satisfaction response. J. Consum. Res. 1993, 20, 418–430. [Google Scholar] [CrossRef]
- Oliver, R.L. A cognitive model of the antecedents and consequences of satisfaction decisions. J. Mark. Res. 1980, 17, 460–469. [Google Scholar] [CrossRef]
- Dabholkar, P.A.; Shepherd, C.; Thorpe, D.I. A comprehensive framework for service quality: An investigation of critical conceptual and measurement issues through a longitudinal study. J. Retail. 2000, 76, 139–173. [Google Scholar] [CrossRef]
- Pee, L.; Jiang, J.; Klein, G. Signaling effect of website usability on repurchase intention. Int. J. Inf. Manag. 2018, 39, 228–241. [Google Scholar] [CrossRef]
- Fu, X.-M.; Zhang, J.-H.; Chan, F.T. Determinants of loyalty to public transit: A model integrating satisfaction-loyalty theory and expectation-confirmation theory. Transp. Res. Part A Policy Pract. 2018, 113, 476–490. [Google Scholar] [CrossRef]
- Pepitone, A.; Festinger, L. A theory of cognitive dissonance. Am. J. Psychol. 1959, 72, 153. [Google Scholar] [CrossRef]
- Lee, Y.; Kwon, O. Intimacy, familiarity and continuance intention: An extended expectation–confirmation model in web-based services. Electron. Commer. Res. Appl. 2011, 10, 342–357. [Google Scholar] [CrossRef]
- Yang, G. An empirical study on continuance intention of mobile reading service—To content aggregation APP as an example. J. Mod. Inf. 2015, 35, 57–63. [Google Scholar]
- Lee, D.Y.; Lehto, M.R. User acceptance of YouTube for procedural learning: An extension of the technology acceptance model. Comput. Educ. 2013, 61, 193–208. [Google Scholar] [CrossRef]
- Mantymaki, M.; Merikivi, J. Investigating the Drivers of the Continuous Use of Social Virtual Worlds. In Proceedings of the 2010 43rd Hawaii International Conference on System Sciences, Koloa, Kauai, HI, USA, 5–8 January 2010; IEEE: Washington, DC, USA, 2010; pp. 1–10. [Google Scholar]
- Zhao, L.; Lu, Y. Perceived interactivity: Exploring factors affecting micro-blogging service satisfaction and continuance intention. In Proceedings of the Pacific Asia Conference on Information Systems, PACIS, Taipei, Taiwan, 9–12 July 2010; p. 93. [Google Scholar]
- Slater, A.; Cole, N.; Fardouly, J. The effect of exposure to parodies of thin-ideal images on young women’s body image and mood. Body Image 2019, 29, 82–89. [Google Scholar] [CrossRef] [PubMed]
- Zhao, S.; Grasmuck, S.; Martin, J. Identity construction on Facebook: Digital empowerment in anchored relationships. Comput. Hum. Behav. 2008, 24, 1816–1836. [Google Scholar] [CrossRef]
- Bhattacherjee, A. Social Science Research: Principles, Methods, and Practices. Ph.D. Thesis, University of South Florida, Tampa, FL, USA, 2012. [Google Scholar]
- Moon, J.-W.; Kim, Y.-G. Extending the TAM for a World-Wide-Web context. Inf. Manag. 2001, 38, 217–230. [Google Scholar] [CrossRef]
- Thorson, K.S.; Rodgers, S. Relationships between blogs as EWOM and interactivity, perceived interactivity, and parasocial interaction. J. Interact. Advert. 2006, 6, 5–44. [Google Scholar] [CrossRef]
- Thorson, G. Reproductive and larval ecology of marine bottom invertebrates. Biol. Rev. 1950, 25, 1–45. [Google Scholar] [CrossRef]
- Oghuma, A.P.; Libaque-Saenz, C.F.; Wong, S.F.; Chang, Y. An expectation-confirmation model of continuance intention to use mobile instant messaging. Telemat. Inform. 2016, 33, 34–47. [Google Scholar] [CrossRef]
- Yeh, R.C.; Lin, Y.-C.; Tseng, K.-H.; Chung, P.; Lou, S.-J.; Chen, Y.-C. Why do people stick to play social network sites? An extension of expectation-confirmation model with perceived interpersonal values and playfulness perspectives. In Advanced Methods for Computational Collective Intelligence; Katarzyniak, R., Thanh Nguyen, N., Trawinski, B., Jo, G.S., Eds.; Springer International Publishing: Geneva, Switzerland, 2013; Volume 457, pp. 37–46. [Google Scholar]
- Tam, C.; Santos, D.; Oliveira, T. Exploring the influential factors of continuance intention to use mobile Apps: Extending the expectation confirmation model. Inf. Syst. Front. 2020, 22, 243–257. [Google Scholar] [CrossRef]
- Kumar, R.R.; Israel, D.; Malik, G. Explaining customer’s continuance intention to use mobile banking apps with an integrative perspective of ECT and Self-determination theory. Pac. Asia J. Assoc. Inf. Syst. 2018, 10, 5. [Google Scholar] [CrossRef]
- Kim, S.H.; Bae, J.H.; Jeon, H.M. Continuous intention on accommodation apps: Integrated value-based adoption and expectation–confirmation model analysis. Sustainability 2019, 11, 1578. [Google Scholar] [CrossRef]
- Lieberman, J.N. Playfulness: Its Relationship to Imagination and Creativity; Academic Press: Cambridge, MA, USA, 2014. [Google Scholar]
- Lee, M.K.; Cheung, C.M.; Chen, Z. Acceptance of Internet-based learning medium: The role of extrinsic and intrinsic motivation. Inf. Manag. 2005, 42, 1095–1104. [Google Scholar] [CrossRef]
- Van Der Heijden, H.; Verhagen, T.; Creemers, M. Understanding online purchase intentions: Contributions from technology and trust perspectives. Eur. J. Inf. Syst. 2003, 12, 41–48. [Google Scholar] [CrossRef]
- Han, B.; Windsor, J. User’s willingness to pay on social network sites. J. Comput. Inf. Syst. 2011, 51, 31–40. [Google Scholar]
- Shiau, W.-L.; Luo, M.M. In Continuance Intention of Blog Users: The Impact of Perceived Enjoyment and User Involvement. In Proceedings of the Pacific Asia Conference on Information Systems, PACIS, Taipei, Taiwan, 9–12 July 2010; p. 85. [Google Scholar]
- Gikas, J.; Grant, M.M. Mobile computing devices in higher education: Student perspectives on learning with cellphones, smartphones & social media. Internet High. Educ. 2013, 19, 18–26. [Google Scholar] [CrossRef]
- Zhao, L.; Lu, Y. Enhancing perceived interactivity through network externalities: An empirical study on micro-blogging service satisfaction and continuance intention. Decis. Support Syst. 2012, 53, 825–834. [Google Scholar] [CrossRef]
- Felton, A.; Lindbladh, M.; Brunet, J.; Fritz, Ö. Replacing coniferous monocultures with mixed-species production stands: An assessment of the potential benefits for forest biodiversity in northern Europe. For. Ecol. Manag. 2010, 260, 939–947. [Google Scholar] [CrossRef]
- Lindbladh, E.; Lyttkens, C.H. Habit versus choice: The process of decision-making in health-related behaviour. Soc. Sci. Med. 2002, 55, 451–465. [Google Scholar] [CrossRef]
- Verplanken, B.B.; Aarts, H.H. Habit, attitude, and planned behaviour: Is habit an empty construct or an interesting case of goal-directed automaticity? Eur. Rev. Soc. Psychol. 1999, 10, 101–134. [Google Scholar] [CrossRef]
- Limayem, M.; Hirt, S.G.; Chin, W.W. Intention Does not Always Matter: The Contingent Role of Habit on IT Usage Behavior. In Proceedings of the 9th European Conference on Information Systems, Global Co-Operation in the New Millennium, Bled, Slovenia, 27–29 June 2001. [Google Scholar]
- Ouellette, J.A.; Wood, W. Habit and intention in everyday life: The multiple processes by which past behavior predicts future behavior. Psychol. Bull. 1998, 124, 54. [Google Scholar] [CrossRef]
- Naab, T.K.; Schnauber, A. Habitual initiation of media use and a response-frequency measure for its examination. Media Psychol. 2014, 19, 126–155. [Google Scholar] [CrossRef]
- Limayem, M.; Hirt, S.G.; Cheung, C.M. How habit limits the predictive power of intention: The case of information systems continuance. MIS Q. 2007, 31, 705–737. [Google Scholar] [CrossRef]
- Hsiao, K.-L.; Chen, C.-C. What drives in-app purchase intention for mobile games? An examination of perceived values and loyalty. Electron. Commer. Res. Appl. 2016, 16, 18–29. [Google Scholar] [CrossRef]
- Fornell, C.; Larcker, D.F. Evaluating structural equation models with unobservable variables and measurement error. J. Mark. Res. 1981, 18, 39–50. [Google Scholar] [CrossRef]
- Fornell, C.; Larcker, D.F. Structural Equation Models with Unobservable Variables and Measurement Error: Algebra and Statistics; Sage Publications: Los Angeles, CA, USA, 1981. [Google Scholar]
- Lee, C.-H.; Chiang, H.-S.; Hsiao, K.-L. What drives stickiness in location-based AR games? An examination of flow and satisfaction. Telemat. Inform. 2018, 35, 1958–1970. [Google Scholar] [CrossRef]
- MacKinnon, D.P.; Lockwood, C.M.; Hoffman, J.M.; West, S.G.; Sheets, V. A comparison of methods to test mediation and other intervening variable effects. Psychol. Methods 2002, 7, 83. [Google Scholar] [CrossRef]
- Preacher, K.J.; Hayes, A.F. Asymptotic and resampling strategies for assessing and comparing indirect effects in multiple mediator models. Behav. Res. Methods 2008, 40, 879–891. [Google Scholar] [CrossRef]
- Liu, I.L.; Cheung, C.M.; Lee, M.K. Habit Formation in Twitter. In Proceedings of the 24th Bled eConference: eFuture Creating Solutions for the Individual, Organisations and Society, Bled, Slovenia, 12–15 June 2011; p. 43. [Google Scholar]
- Wei, P.S.; Lu, H.P. Why do people play mobile social games? An examination of network externalities and of uses and gratifications. Internet Res. 2014, 24, 313–331. [Google Scholar] [CrossRef]
Publisher’s Note: MDPI stays neutral with regard to jurisdictional claims in published maps and institutional affiliations. |
© 2021 by the authors. Licensee MDPI, Basel, Switzerland. This article is an open access article distributed under the terms and conditions of the Creative Commons Attribution (CC BY) license (http://creativecommons.org/licenses/by/4.0/).