Article

Research on the Optimization of Empty Container Repositioning of China Railway Express in Cooperation with International Liner Companies

College of Transportation Engineering, Dalian Maritime University, Dalian 116026, China
*
Author to whom correspondence should be addressed.
Sustainability 2021, 13(6), 3182; https://doi.org/10.3390/su13063182
Submission received: 8 January 2021 / Revised: 1 March 2021 / Accepted: 2 March 2021 / Published: 14 March 2021

Abstract

:
Both China Railway Express (CRE) companies and international liner companies are faced with the problem of empty container repositioning. In order to reduce empty container repositioning cost and realize their sustainable development, this paper studies the optimization problem of empty container repositioning under the condition of their cooperation. To minimize the cost, three optimization models of empty container repositioning are established, which are based on the single repositioning and cooperative repositioning. Numerical experiments are carried out to analyze the three empty container repositioning optimization models solved by CPLEX. The results show that the total cost could be greatly reduced by the cooperative repositioning. The effects of cooperation become more obvious with the unit storage cost or repositioning cost increases and become weaker with the unit mutual rental cost increase. When the demand fluctuation is in a certain range, the cooperation is still effective, which can reduce the cost. But when it is beyond a certain range, the benefits will be greatly reduced. In reality, for the sustainability of their cooperation, both sides should pay attention to the proportion of supply and demand and set reasonable mutual rental cost.

1. Introduction

With the rapid implementation of the “The Belt and Road” strategy and the strengthening of China’s opening to the outside world, the CRE has developed rapidly. In 2019, the CRE has opened 8225 trains, with a year-on-year growth of 29%. Up to now, CRE have operated more than 21,000 trains, reaching 57 cities in 18 European countries. The statistics of the number and growth rate of CRE from 2011 to 2019 are shown in Figure 1.
In recent years, the volume of CRE has increased significantly. But due to the imbalance of freight between China and Europe, the problem of high return empty container rate is still prominent, which leads to many CRE company unable to operate normally. The high cost of empty container repositioning has always been a major problem for the CRE company.
In terms of sea transportation, the international liner company will transport the full containers to various ports for unloading, and some of them will be transported to inland cities. When the full containers arrive at the city, they are unloaded and stored in the inland station. If there is no demand for goods, the empty containers will be returned to the port for storage. With the opening of CRE, the proportion of cargoes transported by sea is reduced, which not only reduces the revenue of the international liner companies, but also increases the volume of containers stocked in ports, resulting in high storage cost of the international liner companies. Especially in the inland areas of Europe, the empty container storage cost of the international liner companies is very high. In order to reduce the storage cost, the international liner companies usually store empty containers in the port. When inland demand arises, they transfer containers from the port. This causes two land transportation and increases the additional transportation cost. In addition, the imbalance of cargo flow between ports will also make the international liner companies face the problem of empty container repositioning.
Shi et al. [1] put forward the idea of alliance very early, but it was only limited to liner companies. For both of the sustainable development, the CRE companies and the international liner companies have begun to seek cooperation. At present, the cooperation is in the exploratory stage, only in a few pilot cities to carry out cooperation. In the long run, with the deepening of cooperation, they can achieve a win-win situation and reduce the total cost of empty container repositioning. In addition, both of the cooperation can not only reduce the turnover rate of empty containers, but also reduce the flow rate of empty containers on the railway, reduce the carbon emissions to a certain extent, and promote the sustainable development of the environment. What is more, the Infrastructure of transportation network [2] and the selection of dry port [3] provides a certain basis for the cooperation.

2. Literature Review

Empty container repositioning has always been one of the hot issues. At present, the main purpose of most researches is to reduce the total cost of empty container repositioning. Many scholars have deeply studied the empty container repositioning optimization problem of single-mode transportation by sea or land, and have achieved rich research results.Braekers et al. [4] reviewed all decisions concerning empty container repositioning at strategic, tactical, and operational level separately to reducing empty container movement, and the main focus lied on hinterland empty container. Dang et al. [5] studied the problem of empty container repositioning in the inland multi-yard system, and pointed out that the inland empty container repositioning included three forms: repositioning from overseas ports, repositioning from inland ports, and empty container leasing. Guo et al. [6] studied the static problem of empty container repositioning. Chou et al. [7] studied the problem of empty container repositioning between multiple ports on the basis of considering inventory. Song et al. [8] studied the problem of empty container repositioning under the network of multi-path, multi ship and multi scheduled voyage. Then, Song et al. [9] studied the empty container repositioning strategy under the condition of flexible destination port, and evaluated the effectiveness of the strategy through simulation. Khakbaz and Bhattacharjya [10] provided a comprehensive literature review about maritime empty container repositioning, and trends and potential research directions were examined. Zheng et al. [11] considered the coordination between liner carriers, and used the reverse optimization method to optimize the cost of empty container repositioning.
In order to reduce the cost of empty container repositioning, some scholars have realized it through jiont transportation optimization. Katarzyna Anna kuzmicz a et al. [12] analyzed the model and various solutions of empty container repositioning from the perspective of Eurasian intermodal transport, providing certain reference value for connecting China and Europe, and making a significant change of container transportation from sea transportation to railway (multimodal transport) route. Peng et al. [13] studied the combination of railway and road transportation modes, which created the possibility for improving the efficient service of logistics enterprises and reducing the operation cost, and optimized the air and full load combined transportation of inland containers. Olivo et al. [14] constructed an integer programming model to solve the empty container repositioning optimization problem in multimodal transportation network. Sun [15] studied the optimization problem of empty container sea land multimodal transportation, and sought the optimal cost transportation scheme to meet the empty container demand of each node. Li et al. [16] based on the comprehensive analysis of the current situation of Central Europe container multimodal transport, built a multi-objective optimization model for the path optimization of container multimodal transport between China and Europe. Taking the actual data from Nanjing to Berlin as an example, the model is verified to be efficient and can provide high guidance for the path optimization of container multimodal transport between China and Europe.
Some scholars achieve optimization by means of collaboration or alliance. Xie et al. [17] discussed the problem of empty container inventory sharing and coordination between seaports and dry ports in container multimodal transport, and designed bilateral repurchase contracts to solve the inventory sharing game between railway companies and the international liner companies. Considering that the operation is influenced by tactical decision-making, Zhang et al. [18] proposed an optimization model of empty container repositioning under the coordination of tactics and operation, and designed an algorithm to calculate the reachable transportation distance matrix between ports. The proposed model and algorithm are verified through simulation examples, which can better deal with the empty container repositioning optimization model under the coordination of tactics and operation. Liang et al. [19] studied the problem of empty container repositioning under two modes of independent allocation and unified allocation of two ports, and established a single period empty container repositioning model. The data analysis results show that the unified allocation mode can bring more profits than the independent allocation mode. Wang et al. [20] based on the situation of random supply and demand of empty containers, established the optimization model of multi-port empty container repositioning under the cooperation of shipping companies, introduced the idea of port empty container pairing, and verified the effectiveness of the idea in solving the empty container repositioning model. Jiang et al. [21] established a fuzzy optimization model for empty container repositioning under the cooperation of shipping companies. The results of the calculation show that the cooperative container transfer strategy can reduce the total cost. Based on the uncertainty of demand, Sun [15] established an opportunity constrained model under the container sharing mode. The hybrid algorithm is used to solve the problem. The results show that the shipping company alliance sharing mode can greatly reduce the empty container repositioning cost. Based on the background of the international liner company alliance, Xing et al. [22] established the dynamic empty container allocation optimization model of each segment of liner route, which is based on empty container mutual leasing strategy, and concluded that under the condition of liner alliance, empty container mutual leasing strategy can effectively realize the optimization of empty container allocation of container liner transportation.
Some scholars study the empty container repositioning from the perspective of network, inventory and Influencing factors. Song and Dong [23] surveyed the empty container repositioning from the network scope, including inland and intermodal transportation network. Besides, the solutions to this problem from the logistics channel scope and modeling technique perspectives Lee and Song [24] surveyed the extent research in the field of ocean container transport. They proposed that quantity decision and cost estimation were two board type of the empty container repositioning at operational level. Besides, the relationship between empty container repositioning and inventory management was be discussed.Song and Carter [25] analyzed the critical factor that affected empty container repositioning through reviewing the related literature. The scale and different strategies were quantified and evaluated to reduce empty container repositioning cost.
To sum up, land sea intermodal transport and cooperative cooperation mode can reduce the cost of empty container repositioning. Therefore, based on the idea of land sea combined transportation and cooperation, the highlight of this paper is as follow:firstly, it can enrich the existing research on empty container repositioning optimization; secondly, it can provide certain reference for the cooperation between CRE and liner company in reality; lastly, it can reduce the cost of empty container repositioning and reduce a certain amount of carbon emissions through cooperation, so as to realize the sustainable development of economy and society.
The remainder of this paper is organized as follows: under the cooperation of the CRE company and the international liner company, Section 3 proposes the description of empty container repositioning optimization problem. Section 4 gives the symbol description and model establishment. Section 5 collects the data of the CRE company and the international liner operation for numerical experiments. Section 6 collects the data of the CRE company and the international liner operation for numerical experiments. Section 6 gives some conclusions.

3. Problem Description

The problem of empty container repositioning is mainly caused by the imbalance of freight flow. At present, the operation mode of CRE is mainly "point-to-point". As shown in Figure 2, taking Chengdu CRE company as an example, it has opened several CRE lines with Chengdu as the origin and a European city as the destination. The hinterland of the company can cover more than 20 Chinese cities and more than 50 European cities. Due to the trade imbalance between China and Europe, the number of outbound trains is much larger than that of inbound trains. Therefore, there will be a certain number of empty containers in the European region. In order to reduce the cost of empty container transportation, the train company will transport part of the empty containers in the form of CRE lines, and transport part of the empty containers back through sea land combined transportation. Due to the long transportation distance, empty containers cannot be returned in time. In order to meet the demand of domestic customers, the train company will rent a certain number of containers in each hinterland.
In the aspect of liner companies, due to the limited independent operation capacity of liner companies and the long route cycle, it is very easy to see the imbalance of empty containers in various ports, with a large backlog of empty containers in some ports and a serious shortage of empty containers in some ports. In addition, after the full containers of liner companies arrive at inland cities and are unloaded, they will be transported back to the port for storage when there is no demand for empty containers for a period of time. When customers in inland cities have demand, they need to transport empty containers to inland areas again. In this way, the repeated land transportation is caused and the transportation cost is increased. Especially in the inland areas of Europe, the empty container storage cost of liner companies is very high. In order to reduce the storage cost, liner companies usually store empty containers in the port, and then transport containers from the port when inland demand arises. When the empty container repositioning can not meet the real-time demand of customers, the liner company will rent the container from the leasing company at a high price to meet the requirements of customers, which will also lead to the high total cost of empty container repositioning.
In view of the situation that the CRE company has surplus empty containers in the European inland area and the empty containers need to be transported to China, the liner company needs empty containers in the European inland area, and the sea transport capacity is relatively sufficient, at present, the CRE company and the liner company have signed a cooperation agreement to rent empty containers at a certain price. In this way, for liner companies, renting empty containers from CRE company in the European region can reduce the transportation cost between ports and the cost of renting empty containers, and reduce the transportation cost of empty containers from ports to inland stations. Similarly, for the CRE company, firstly, it can reduce the rental cost of empty containers through low-cost leasing. Secondly, leasing empty containers to liner company in Europe can reduce the cost of empty container repositioning. In addition, the liner company can provide a lower booking price for the CRE company, which can also reduce certain transportation costs for the CRE company. At the same time, the cooperation can reduce the volume of empty container transportation turnover, and greatly reduce the carbon emissions of transportation vehicles.
Under this background, this paper studies the multi-period, multi-ports and multi-cities empty container repositioning optimization problem and constructs three empty container repositioning optimization models.

4. Mathematical Model

4.1. Assumptions

In this paper, the main assumptions are as follows:
  • The empty container demand of customer must be met in each period;
  • All of containers are the same type;
  • Container handling time is negligible.
  • The operation route of the CRE is known, and transportation time and unit transportation cost between the cities are known;
  • The routes of liner companies between ports are known and can cover all ports.

4.2. Symbol Description

(1) Parameters
L: The set of CRE lines.
N 1 : The origin and destination set of the CRE.
N 11 : The city set of CRE in China.
N 12 : The city set of CRE in foreign regions.
N 2 : The port set of the international liner company.
N 21 : The port set of the international liner companies in China.
N 22 : The port set of liner companies in foreign regions.
T: The set of decision period.
O l : The origin of the CRE; l L .
D l : The destination of the CRE; l L .
d i t 1 : Empty container demand of the CRE company in city i in t period, i N 1 , t T .
d i t 2 : Empty container demand of the international liner company in port p in t period, p N 2 , t T .
d i t 3 : Empty container demand of the international liner company in city i in t periods; i N 1 , t T .
W i t 1 : Empty container supply of the CRE company in city i in t period, i N 1 , t T .
W p t 2 : Empty container suppky of the international liner company in port p in t period, p N 2 , t T .
W i t 3 : Empty container supply of the international liner company in city i in t periods; i N 1 , t T .
S i 1 : The maximum volume of empty containers allowed by the CRE company at the city i, i N 1 .
S p 2 : The maximum volume of empty containers allowed by the international liner company at the port p, p N 2 .
S i 3 : The maximum volume of empty containers allowed by the international liner company at the city i, i N 1 .
C i j 1 : Empty container repositioning unit cost from city i to city j in China; i , j N 11 .
C i j 2 : Empty container repositioning unit cost from city i to city j in foreign area; i , j N 12 .
C i j 4 : Empty container repositioning unit cost from city i to city j by sea-land intermodal transport; i N 12 , j N 11 .
C l : Empty container repositioning unit cost of the CRE l, l L .
c i j 1 : Empty container repositioning unit cost of the from city i to city j the CRE l; i N 12 , j N 11 . Due to the existence of one-way trains, c i j 1 has different values.
c i j 1 = c l , i = O l , j = D l c i O l 2 + c l , i O l , j = D c l + c D l j 1 , i = O l , j D c i O l 2 + c l + c D l j 1 , i O l , j D
c i 3 : Empty containers unit rental cost at the city i; i N 1 .
m 1 : The mutual rental cost between CRE company and liner company.
m 2 : Booking price.
c i p 1 : Unit empty container repositioning cost between city i and port p in China; i N 11 , p N 21 .
c i p 2 : Unit empty container repositioning cost between city i and port p in foreign area; i N 12 , p N 22 .
c p q 7 : Unit empty container repositioning between port p and port q in China; p , q N 2 .
F t : The maximum booking capacity that the international company can provide for the CRE company in t period; t T .
K p q t : the empty container transportation capacity between port P and port Q in t period. ∀ p , q N 2 , t T .
K l t :the empty container transportation capacity of CRE line l in t period, ∀ l L , t T
(2) Decision variables
x i j t l : The volume of empty containers transported from node i to node j through line l in the t period; i , j N 1 , t T .
y i j t : The volume of empty containers transported from node i to node j by sea land intermodal transportation in the t period; i , j N 1 , t T .
Q i t 1 : Empty container inventory of the CRE company at the end of period t at city i; i N 1 , t T .
Q p t 2 : Empty container inventory of port p at the end of period t; p N 2 , t T .
Q i t 3 : Empty container inventory of the international liner company at city node i at the end of period t; i N 1 , t T .
G i t 1 : The volume of containers rented by the CRE company in the city node i at the t period; i N 1 , t T .
G i t 2 : The volume of containers rented by the international liner company in the city i at the t period; i N 1 , t T .
G p t : The rental volume of the international liner company at port p in t period; p N 2 , t T .
G i t 3 : The empty container volume of the international liner company rented by the CRE company at the city node i in the t period; i N 1 , t T .
G i t 4 : The empty container volume of the CRE company rented by the international liner company at the city i in the t period; i N 1 , t T .
z p i t 1 : The empty container volume of the international liner company at port p rented by the CRE company at city i in the t period; p N 2 , i N 1 , t T .
z p i t 2 : The empty container volume of the international liner company renting the CRE company in the city i at port p in the t period; p N 2 , i N 1 , t T .
z q p t 3 : Empty container repositioning volume of the international liner company between port p and port q in the t period; p , q N 2 , t T .
z p i t 4 : Empty container repositioning volume of the international liner company from port p to city i in the t period; p N 2 , i N 1 , t T .
z i p t 5 : Empty container repositioning volume of the international liner company from city i to port p in the t period; p N 2 , i N 1 , t T .

4.3. Mathematical Model

The mathematical model of this paper mainly considers three constraints: empty container inventory balance, empty container transportation capacity limit and empty container storage capacity limit. Among them, the balance of empty container inventory mainly depends on the empty container volume of inflow and outflow nodes in the two periods. Figure 3 shows the diagram of empty container in and out of each node in the adjacent cycle, which is before and after the cooperation between the international liner company and the CRE company. The left side of the node is the inflow of empty containers, and the right side is the outflow of empty containers. Under both of cooperation, this paper constructs the empty container flow balance constraint according to Figure 3, as shown in Section 4.3.1, Section 4.3.2 and Section 4.3.3.

4.3.1. The Empty Container Repositioning Optimization Model of CRE

The objective function:
min Z 1 = t T i N 12 j N 11 l A c i j l x i j t l + c i j 4 y i j t + t T i , j N 11 l A x i j t c i j 1 + t T , j N 12 l A x i j t c i j 2 + t T i N 1 c i 3 G i t 1 + t T i N c i 5 Q i t 1
The objective function is established to minimize the total empty container repositioning cost of the CRE company in the planning period, including the cost of empty container repositioning of inter regional city (cost of CRE transportation + cost of sea land combined transport), the cost of empty container repositioning of China regional cities, the cost of empty container repositioning of European regional cities, the rental cost, the storage cost.
Subject to: (1) The empty container flow balance in the Europe cities
Q i ( t 1 ) 1 + j N 12 x j i t + G i t 1 + W i t 1 = Q i t 1 + d i t 1 + j N 12 x i j t + l L j N 11 x i j t l + j N 1 y i j t , i N 12 , t T
Storage volume at the end of the previous period + the volume of empty containers repositioned from other cities in the same region in this period + the volume of containers rented by the CRE company from container rental company in this period + empty container supply in the period = Storage volume in the period + the demand of empty containers in this period + the volume of empty containers repositioned to other city nodes in this region in this period + the volume of empty containers repositioned by the CRE in this period + the volume of empty containers repositioned by sea land combined transport in this period.
(2) The empty container flow balance in the China cities
Q i ( t 1 ) 1 + l L j N 12 x j i t l + j N 11 x j i t + j N 12 y j i ( t 1 ) + G i t 1 + W i t 1 = Q i t 1 + d i t 1 + j N 11 x i j t i N 11 , t T
Storage volume at the end of the previous period + the volume of empty containers rented by the CRE company from the international liner company at all ports in this period + the volume of empty containers repositioned from other cities in this region in this period + the volume of empty containers repositioned by sea and land combined transportation in the period + the volume of empty containers rented by CRE company from the rental company in the period + the empty container supply in this period = Storage volume in this period + the empty container demand in this period + the volume of empty containers repositioned to other cities in this region in this period.
(3) Storage capacity constraints
0 Q i t 1 S i 1 , i N 1 , t T
Constraint (4) is the limit of the storage capacity of the CRE company in the city.
(4) Transport capacity constraints
i N 12 j N 11 x j i t l K l , t T , l L
Constraint (5) is the capacity restriction of empty containers transported by CRE line.

4.3.2. The Empty Container Repositioning Optimization Model of the International Liner Company

The objective function:
min Z 2 = t T p N 2 q N 2 z p q t 3 c p q 7 + t T p N 2 c p 4 G p t 2 + t T p N 2 i N 11 c p 6 Q p t 2 + c i 5 Q i t 1 t T p N 21 i N 11 z p i t 4 + z i p t 5 c p i 1 + t T p N 22 i N 12 z p i t 4 + z i p t 5 c p i 2
The objective function is established to minimize the total empty container repositioning cost of the international liner company in the planning period, including empty container repositioning between ports, the rental cost, the storage cost of empty containers at ports and cities, the cost of empty container repositioning and rental by the international liner companies in China, the cost of empty container repositioning between ports and cities in China, and the cost of empty container repositioning between ports and cities in Europe.
(1) The empty container flow balance in the cities
Q i ( t 1 ) 3 + p N 21 z p i t 4 + G i t 2 + W i t 3 = Q i t 3 + d i t 3 + p N 21 z i p t 5 , i N 1 , t T
Storage volume at the end of the previous period+ the volume of empty container repositioned by the international liner company from all ports in this period+ the volume of empty container from rental company in this period + empty container supply in this period= Storage volume in this period + the demand of empty container in this period+ the volume of empty container repositioned to the port by the international liner company in this period.
(2) The empty container flow balance in the china ports
Q p ( t 1 ) 2 + p N 2 z q p t 3 + G p t 2 + W p t 2 + i N 11 z i p t 4 = Q p t 2 + i N 11 z i p t 5 + d p t 2 + q N 2 z p q t 3 , p N 21 , t T
Storage volume at the end of the previous period + the rental volume of the international liner company from the CRE company at the city in this period+ the repositioning volume of the international liner company from other ports during this period + the rental volume of the rental company in this period+ empty container supply in this period+ the repositioning volume of the international liner company from the city to all ports in this period = Storage volume in this period+ the volume of containers rented by the CRE company from the international liner company at the city in this period+ the demand of empty container in this period+ the repositioning volume of the international liner company from this port to the others in this period.
(3) The empty container flow balance in the Europe ports
Q p ( t 1 ) 2 + p N 2 z q p t 3 + G p t 2 + W p t 2 + i N 11 z i p t 4 = Q p t 2 + i N 11 z i p t 5 + d p t 2 + q N 2 z p q t 3 , p N 22 , t T
Storage volume at the end of the previous period + the repositioning volume of the international liner company from other ports during this period + the rental volume of the rental company in this period+ empty container supply in this period+ the repositioning volume of the international liner company from the city to all ports in this period = Storage volume in this period+ the volume of containers rented by the CRE company from the international liner company at the city in this period+ the demand of empty container in this period+ the repositioning volume of the international liner company from this port to the others in this period.
(4) Storage capacity constraints
0 Q i t 3 S i 3 , i N 1 , t T
0 Q p t 2 S p 2 , p N 2 , t T
Constraint (10) is the limit of the storage capacity of the international liner company at the city node. Constraint (11) is the limitation of the storage capacity of the international liner company at the port.
(5) Transport capacity constraints
z p q t 3 K p q t , p , q N 2 , t T
Constraint (12) is the capacity restriction of empty containers transported by the international liner companies between ports.

4.3.3. The Empty Container Repositioning Optimization Model of the Cooperation between CRE and the International Liner Company

The objective function:
min Z 3 + Z 4 : Z 3 = t T i N 12 j N 11 l L c i j l x i j t l + m 2 y i j t + t T i , j N 11 c i j 1 x i j t + t T i , j N 12 c i j 2 x i j t + t T i N 1 c i 3 G i t 1 + t T i N c i 5 Q i t 1 + t T i N 11 p N 21 c i p 1 + m 1 z p i t 1 + m 1 G i t 3 + t T i N 12 p N 22 c i p 2 + m 1 z p i t 1 + m 1 G i t 3 Z 4 = t T p N 2 q N 2 c p q 7 z p q t 3 + t T p N 2 c p 4 G p t 2 + t T p N 2 i N c p 6 Q p t 2 + c i 5 Q i t 1 + t T i N 11 p N 21 c i p 1 + m 1 z i p t 2 + m 1 G i t 4 + t T i N 12 p N 22 c i p 2 + m 1 z i p t 2 + m 1 G i t 4 + t T p N 21 i N 11 z p i t 4 + z i p t 5 c i p 1 + t T p N 22 i N 12 z p i t 4 + z i p t 5 c i p 2
The objective function is established to minimize the total empty container repositioning cost of the cooperation in the planning period. The first part is the total cost of empty container repositioning of the CRE company, including the cost of empty container repositioning of inter regional city nodes (cost of CRE transportation + cost of sea land combined transport), the cost of empty container repositioning at China cities, the cost of empty container repositioning of at European cities, the external rental cost o, the storage cost, the transportation cost and the cost of container rental of the CRE company at all ports from the international liner company, transportation cost and container rental cost of the CRE company from the international liner company at the cities. The second part is the total cost of empty container repositioning of the international liner company, including empty container repositioning between ports, the external rental cost, the storage cost of at ports and cities, the cost of empty container repositioning and rental by the international liner companies from CRE company in China, the cost of empty container repositioning and rental by the international liner companies from CRE company in Europe, the cost of empty container repositioning between ports and cities in China, and the cost of empty container repositioning between ports and cities in Europe.
(1) The empty container flow balance in the Europe cities
Q i ( t 1 ) 1 + j N 12 x j i t + p N 22 x p i t 1 + G i t 1 + W i t 1 + G i t 3 = Q i t 1 + G i t 4 + d i t 1 + j N 12 x i j t + l L j N 11 x j i t l + j N 11 y j i ( t 1 ) + p N 22 z i p t 2 , i N 12 , t T
Storage volume at the end of the previous period + the volume of empty containers repositioned from other cities in the same region in this period + the volume of containers rented by the CRE company from the international liner company at all ports in this period + the volume of containers rented by the CRE company from container rental company in this period + empty container supply in the period + the volume of containers rented by the CRE company from the international liner company at the city in this period = Storage volume in the period + the volume of containers rented by the international liner company from the CRE company at the city in this period + the demand of empty containers in this period + the volume of empty containers repositioned to other city nodes in this region in this period + the volume of empty containers repositioned by the CRE in this period + the volume of empty containers repositioned by sea land combined transport in this period + the volume of empty containers rented by the international liner company from the CRE company at all ports in this period.
(2) The empty container flow balance in the China cities of CRE
Q i ( t 1 ) 1 + l L j N 12 x j i t l + p N 21 z p i t 1 + l L j N 11 , j i x j i t + j N 12 y j i ( t 1 ) + G i t 1 + W i t 1 + G i t 3 = Q i t 1 + G i t 4 + d i t 1 + l L j N 11 , j i x i j t + p N 21 z i p t 2 , i N 11 , t T
Storage volume at the end of the previous period + the volume of empty containers repositioned by the CRE in the period + the volume of empty containers rented by the CRE company from the international liner company at all ports in this period + the volume of empty containers repositioned from other cities in this region in this period + the volume of empty containers repositioned by sea and land combined transportation in the period + the volume of empty containers rented by CRE company from the rental company in the period + the volume of empty containers rented by the CRE company from the international liner company at the city in this period + the empty container supply in this period = Storage volume in this period + the empty container demand in this period + the volume of empty containers repositioned to other cities in this region in this period + the empty container rented by international liner company from the CRE company at all ports in this period +the volume of empty containers rented by the international liner company from the CRE company at the city in this period.
(3) The empty container flow balance in the cities of the international liner company
Q i ( t 1 ) 3 + p N 21 z p i t 4 + G i t 2 + G i t 4 + W i t 3 = Q i t 3 + G i t 3 + d i t 3 + p N 21 z i p t 5 , i N 1 , t T
Storage volume at the end of the previous period+ the volume of empty container repositioned by the international liner company from all ports in this period+ the volume of empty container from rental company in this period+ the volume of empty containers rented by the international liner company from the CRE company at the city in this period + empty container supply in this period= Storage volume in this period+ the volume of containers rented by the CRE company from the international liner company at the city in this period+ the demand of empty container in this period+ the volume of empty container repositioned to the port by the international liner company in this period.
(4) The empty container flow balance in the china ports of the international liner company
Q p ( t 1 ) 2 + i N 11 z i p t 2 + q N 2 z q p t 3 + G p t 2 + W p t 2 + i N 11 z i p t 4 = Q p t 2 + i N 11 z i p t 5 + d p t 2 + q N 2 z p q t 3 + i N 11 z p i t 2 , p N 21 , t T
Storage volume at the end of the previous period + the rental volume of the international liner company from the CRE company at the city in this period+ the repositioning volume of the international liner company from other ports during this period + the rental volume of the rental company in this period+ empty container supply in this period+ the repositioning volume of the international liner company from the city to all ports in this period = Storage volume in this period+ the volume of containers rented by the CRE company from the international liner company at the city in this period+ the demand of empty container in this period+ the repositioning volume of the international liner company from this port to the others in this period+ the volume of containers rented by the CRE company from the international liner company at all port.
(5) The empty container flow balance in the Europe ports of the international liner company
Q p ( t 1 ) 2 + i N 12 z i p t 2 + q N 2 z q p t 3 + G p t 2 + W p t 2 + i N 12 z i p t 4 = Q p t 2 + i N 12 z i p t 5 + d p t 2 + q N 2 z p q t 3 + i N 12 z p i t 1 , p N 22 , t T
(6) Storage capacity constraints
Constraints (4), (10)–(11).
(7) Transport capacity constraints
Constraints (5), (12).
(8) Booking capacity constraint
y i j t F t , i N 12 , j N 11 , t T
Constraint (19) is the maximum booking capacity that the international liner company can provide for the CRE company in each cycle.

5. Numberial Experiment

5.1. Experiment Description

Since the “One Belt One Road” strategy was put forward, many cities have opened the CRE. Chengdu CRE company has always ranked first in terms of the number of trains in China in recent years. The hinterland cities in the two regions are also very extensive. In terms of shipping, COSCO Shipping Co., Ltd. has the world’s leading container shipping fleet. The service network covers the whole world. In particular, after the acquisition of the port of Piraeus, the development of China EU routes has become smoother. Therefore, this example selects the hinterland city of Chengdu CRE company and the service ports of COSCO Shipping Co., Ltd. as examples to carry out numerical experiments. The selected cities and ports are shown in the Table 1.
The basic parameters of the empty containers optimization model are shown in Table 2.
In this study, all models were solved by CPLEX 12.6.2, and the i5-6440 CPU processor with a Windows 7 operating system was applied for calculation.

5.2. Experimental Results

In the context of this example, the optimization results of the three models are shown in Table 3. As we can see, whether it is the CRE company or the international liner company, the rental cost, storage cost, repositoining cost and the total cost under the condition of cooperation are lower than those under the condition of non cooperation. For the CRE company, the D-values of the rental cost, storage cost, repositoining cost and the total cost are 189000, 72400, 159900, and 421300 respectively. For the the international liner company, the D-values of the rental cost, storage cost, repositoining cost and the total cost are 52900, 615000, 3725800, and 4393700 respectively.
The result shows that the cooperation between the two companies can greatly reduce the total cost, which is conducive to the sustainable development of both. Analysis of the optimization results shows that the cooperation can reduce the repositioning cost by the shortening of repositioning distance, and reduce the rental cost and storge cost by the mutual renting empty containers.

5.3. Sensitively Analysis

As everyone knows, unit storage cost, rental cost, repositioning cost and fluctuation of demand and supply will affect the total cost of empty container repositioning. Therefore, this paper mainly analyzes the sensitivity of the above factors. Because of the relativity between supply and demand, only demand fluctuation is considered in sensitivity analysis.

5.3.1. Sensitively Analysis with Unit Storage Cost

Table 4 shows the influence of unit storage cost change on total cost. The change of unit storage cost will have an impact on the total cost under the condition of in-cooperation and non-cooperation. The total cost D-value under the condition of in-cooperation and non-cooperation increases gradually with the increase of unit storage cost. Obviously, with the increase of unit storage cost, the results of in-cooperation is superior to that of non-cooperation.

5.3.2. Sensitively Analysis with Unit Repositioning Cost

Table 5 shows the influence of unit repositioning cost change on total cost. The change of repositioning storage cost will also have an impact on the total cost under the condition of in-cooperation and non-cooperation. The changes of the total cost D-value with the increase of unit repositioning cost are similar to those with the increase of unit storage cost under the condition of in-cooperation and non-cooperation. Similarly, with the increase of unit repositioning cost, the result of in-cooperation is superior to that of non-cooperation.

5.3.3. Sensitively Analysis with m 1

Table 6 shows the influence of parameter m1 change on total cost. Compared with unit storage and repositioning cost, the change of parameter m1 have an different impact on the total cost under the condition of in-cooperation and non-cooperation. Because the empty container mutual renting only appears in in-cooperation conditions. The total cost under in-cooperation with the increase of parameter m 1 . When the unit mutual rental cost (parameter m 1 ) is close to the external unit rental cost, the D-value becomes smaller. This means that the effect of in-cooperation is gradually weakening. In reality, mutual renting may bring certain benefits to one party. But for the sustainable development of both, the unit mutual renting cost setting in-cooperation must be based on a certain range.

5.3.4. Sensitively Analysis with Demand Fluctuation

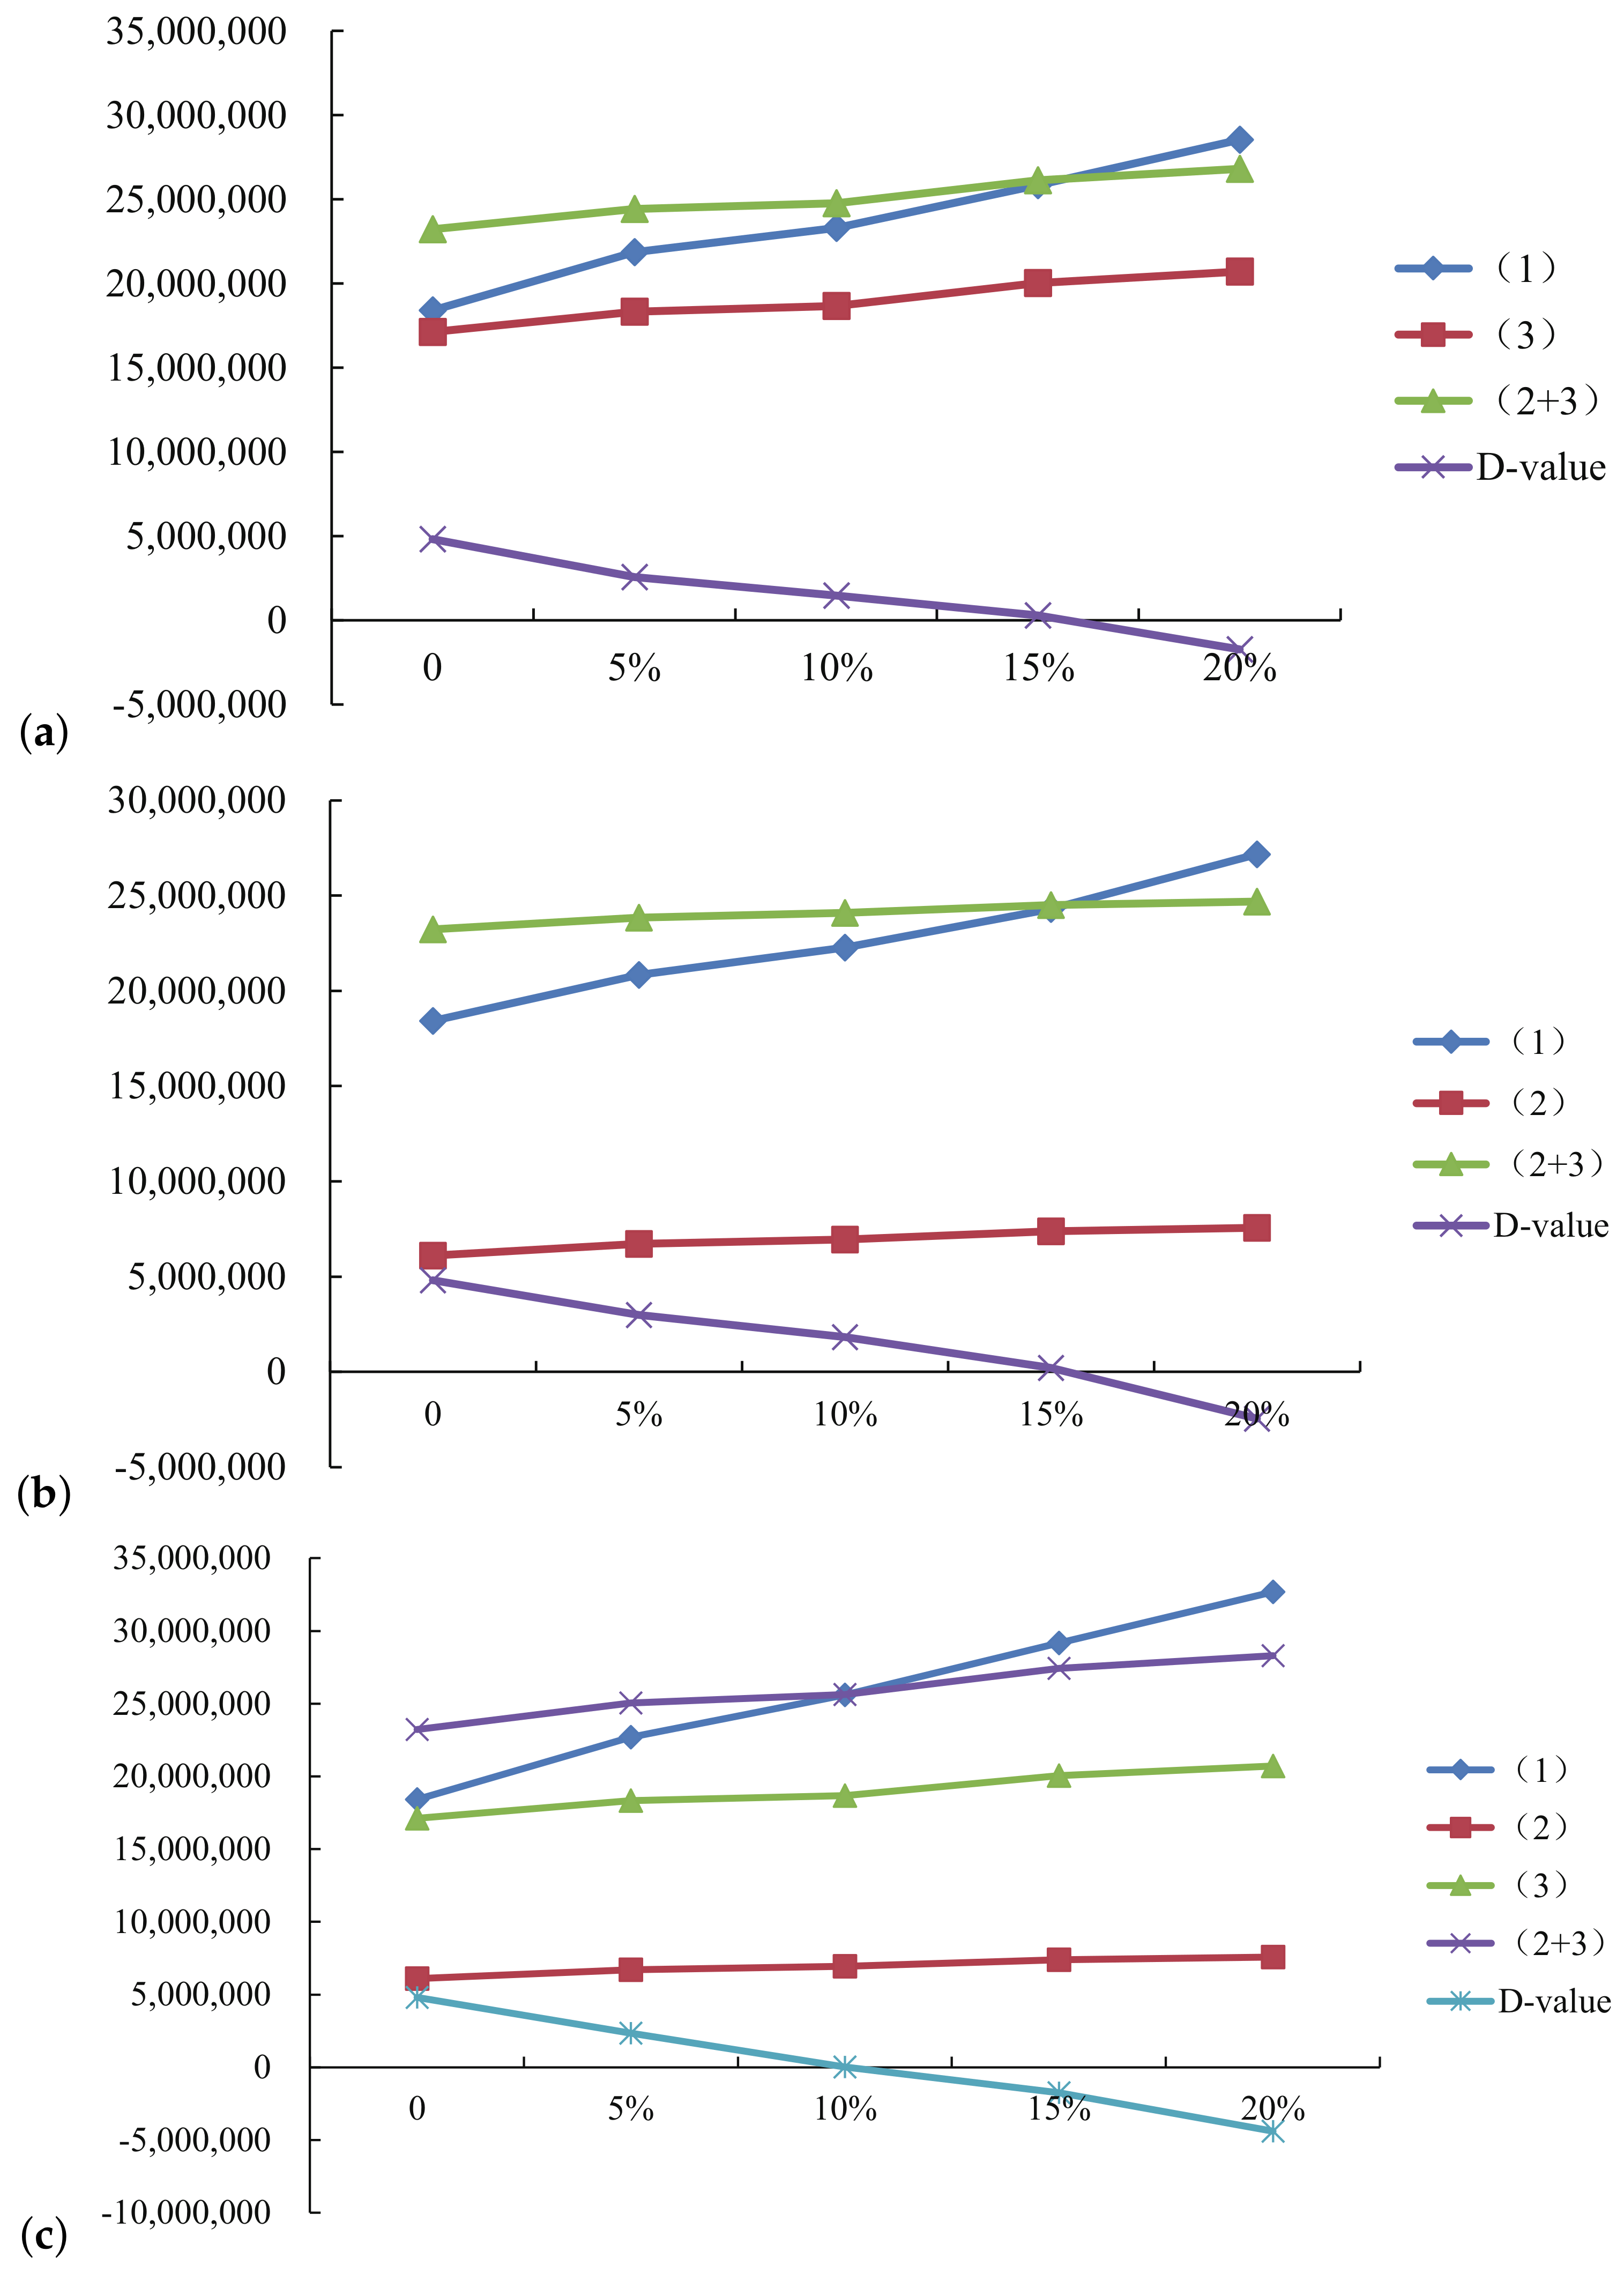
The demand fluctuation directly affects the total cost of empty container repositioning. Figure 4 shows the influence of demand fluctuation on the cost. Figure 4a–c show the influence of the demand increase of CRE company, the demand increase of international liner company, the influence of the demand increase of both CRE company and international liner company on the relevant cost respectively. In the Figure 4 the total cost under the condition of in-cooperation, the total cost of CRE company, the total cost of international liner company, the total cost under the condition of non-cooperation increases with the empty container demand of CRE company increasing. But the D-value decreases with the demand increasing. When the demand of CRE company or the demand of international liner company increases by 20%, D-value becomes negative. But when the demand of CRE company and the demand of international liner company increases at the same time, D-value becomes negative at the 15%. So we can draw that when the demand fluctuation is in a certain range, the cooperation is still effective, which can reduce the cost. When it is beyond a certain range, the benefits will be greatly reduced.

6. Conclusions

This paper evaluates the feasibility of the cooperative repositioning between CRE companies and international liner companies. It constructs three optimization models for empty container repositioning under single repositioning cases and cooperative repositioning case. Considering that all the models are mixed integer programming model, we use CPLEX to solve the models.
The results show that under the condition of cooperation, the total cost of empty container repositioning is lower than the sum of the total cost of single repositioning. It can be seen that cooperation can make both sides win-win, which is conducive to the sustainable development of society and economy. We can also draw some conclusions from the sensitively analysis. The unit storage cost, rental cost, repositioning cost and fluctuation of demand and supply affect the total cost of empty container repositioning in different ways. The unit storage cost and repositioning cost have the same influence effects on the total cost. But the mutual rental cost has the opposite effects differ from above two factors. The fluctuation of demand in different numerical ranges determine the effect of cooperation.
In this paper, we just consider one CRE company and one international liner company. In this way, the empty container repositioning model is relatively simple. For future research, we will focus on three aspects. The first one is the collaborative optimization of many CRE companies and many international liner companies; the second one is that taking the uncertainty of supply and demand into account in the model.The last one is that considering a variety of factors, taking the external environment changes into account in the internal optimization. For example, considering the impact of COVID-19 impact on empty container accumulation.

Author Contributions

Conceptualization, L.X. and Y.Y.; methodology, L.X. and Q.X.; software, L.X.; validation, L.X. and Y.Y.; formal analysis, L.X.; investigation, L.X. and H.Y.; resources, L.X. and Q.X.; data curation, L.X., Y.Y., and H.Y.; writing—original draft preparation, L.X. and Y.Y.; writing—review and editing, H.Y. and Q.X.; visualization, L.X.; supervision, Q.X.; project administration, Q.X.; funding acquisition, Q.X. All authors have read and agreed to the published version of the manuscript.

Funding

This research is funded by Belt & Road Program of China Association for Science and Technology (no. 2020ZZGJB072032), Joint Program of Liaoning Provincial Natural Science Foundation of China (no. 2020HYLH49), Leading Talents Support Program of Dalian Municipal Government (no. 2018-573), Fundamental Research Funds for the Central Universities (no.3132019301), and the National Natural Science Foundation, China (no. 71702019).

Conflicts of Interest

The authors declare no conflict of interest.

References

  1. Shi, X.; Voß, S. Container terminal operations under the influence of shipping alliances. In Risk Management in Port Operations, Logistics and Supply Chain Security; Bichou, K., Bell, M.G.H., Evans, A., Eds.; Informa: London, UK, 2007; pp. 135–167. [Google Scholar]
  2. Shi, X.; Vanelslander, T. Design and evaluation of transportation networks: Constructing transportation networks from perspectives of service integration, infrastructure investment and information system implementation. Netnomics 2010, 11, 1–4. [Google Scholar] [CrossRef] [Green Version]
  3. Li, F.; Shi, X.; Hu, H. Location selection of dry port based on AP clustering—The case of Southwest China, in conference proceedings of LISS. Proc. Int. Conf. Logist. Inform. Serv. Sci. 2011, 2, 255–260. [Google Scholar]
  4. Braekers, K.; Janssens, G.K.; Caris, A. Challenges in managing empty container movement at multiple planning levels. Transp. Rev. 2011, 31, 681–708. [Google Scholar] [CrossRef]
  5. Dang, Q.V.; Yun, W.Y.; Kim, H.W. Positioning empty containers under dependent demand process. Comput. Ind. Eng. 2012, 62, 708–715. [Google Scholar] [CrossRef]
  6. Guo, Z.; Wang, W.; Tang, G. A recursive model for static empty container allocation. Front. Comput. Sci. China 2011, 5, 486–495. [Google Scholar] [CrossRef]
  7. Chou, C.C.; Gou, R.H.; Tsai, C.L.; Tsou, M.C.; Wong, C.P.; Yu, H.L. Application of a mixed fuzzy decision making and optimization programming model to the empty container allocation. Appl. Soft Comput. 2010, 10, 1071–1079. [Google Scholar] [CrossRef]
  8. Song, D.P.; Dong, J.X. Cargo routing and empty container repositioning in multiple shipping service routes. Transp. Res. Part B Methodol. 2012, 46, 1556–1575. [Google Scholar] [CrossRef]
  9. Song, D.P.; Dong, J.X. Effectiveness of an empty container repositioning policy with flexible destination ports. Transp. Policy 2011, 18, 92–101. [Google Scholar] [CrossRef]
  10. Khakbaz, H.; Bhattacharjya, J. Maritime empty container repositioning: A problem Review. Int. J. Strateg. Decis. Sci. 2014, 5, 1–23. [Google Scholar] [CrossRef] [Green Version]
  11. Zheng, J.F.; Sun, Z.; Gao, Z.Y. Empty container exchange among line carriers. Transp. Res. Part E 2015, 83, 158–169. [Google Scholar] [CrossRef]
  12. Kuzmicz, K.A.; Pesch, E. Approaches to empty container repositioning problems in the context of Eurasian intermodal transportation. Omega 2019, 85, 194–213. [Google Scholar] [CrossRef]
  13. Peng, Z.; Wang, H.; Wang, W.; Jiang, Y. Intermodal transportation of full and empty containers in harbor-inland regions based on revenue management. Eur. Transp. Res. Rev. 2019, 11, 1–18. [Google Scholar] [CrossRef]
  14. Olivo, A.; Zuddas, P.; Francesco, M.D.; Manca, A. An operational model for empty container management. Marit. Econ. Logist. 2005, 7, 199–222. [Google Scholar] [CrossRef]
  15. Sun, H. Research on multimodal repositioning of empty containers around seaborne and land carriage. J. Wuhan Univ. Technol. 2010, 34, 533–536. [Google Scholar]
  16. Li, Y.M.; Guo, X.Y.; Yang, L. Route optimization of China-EU container multimodal transport considering various factors. J. Railw. Sci. Eng. 2017, 14, 2239–2248. [Google Scholar]
  17. Xie, Y.; Laing, X.; Ma, L.; Yan, H. Empty container management and coordination in intermodal transport. Eur. J. Oper. Res. 2016, 257, 223–232. [Google Scholar] [CrossRef]
  18. Zhang, H.; Lu, L.; Wang, X. Tactical and Operational Cooperative Empty Container Repositioning Optimization Model Based on Business Flow and Initial Solutions Generation Rules. Symmetry 2019, 11, 300. [Google Scholar] [CrossRef] [Green Version]
  19. Liang, Y.; Liao, B.; Xu, C. Single period transportation of port empty containers based on carbon trading in uncertain environment. Navig. China 2016, 39, 133–139. [Google Scholar]
  20. Wang, C.; Chen, F. Optimal empty container reposition with collaboration among shipping companies based on multiple ports. J. Syst. Manag. 2016, 25, 539–545. [Google Scholar]
  21. Jiang, Y.; Han, X. Fuzzy Optimization Model of Maritime Empty Container Repositioning under the Cooperation of Shipping Companies. Packag. Eng. 2018, 39, 151–156. [Google Scholar]
  22. Xing, Y.; Yang, H.; Chu, F. Empty container transportation of liner alliance based on mutual leasing strategy. J. Dalian Marit. Univ. 2016, 42, 101–106. [Google Scholar]
  23. Song, D.P.; Dong, J. Empty container repositioning. In Handbook of Ocean Container Transport Logistics—Making Global Supply Chain Effective; Springer: New York, NY, USA, 2015; pp. 163–208. [Google Scholar]
  24. Lee, C.Y.; Song, D.P. Ocean container transport in global supply chains: Overview and research opportunities. Transp. Res. Part B 2017, 95, 442–474. [Google Scholar] [CrossRef]
  25. Song, D.P.; Carter, J. Empty container repositioning in liner shipping. Marit. Policy Manag. 2009, 36, 291–307. [Google Scholar] [CrossRef]
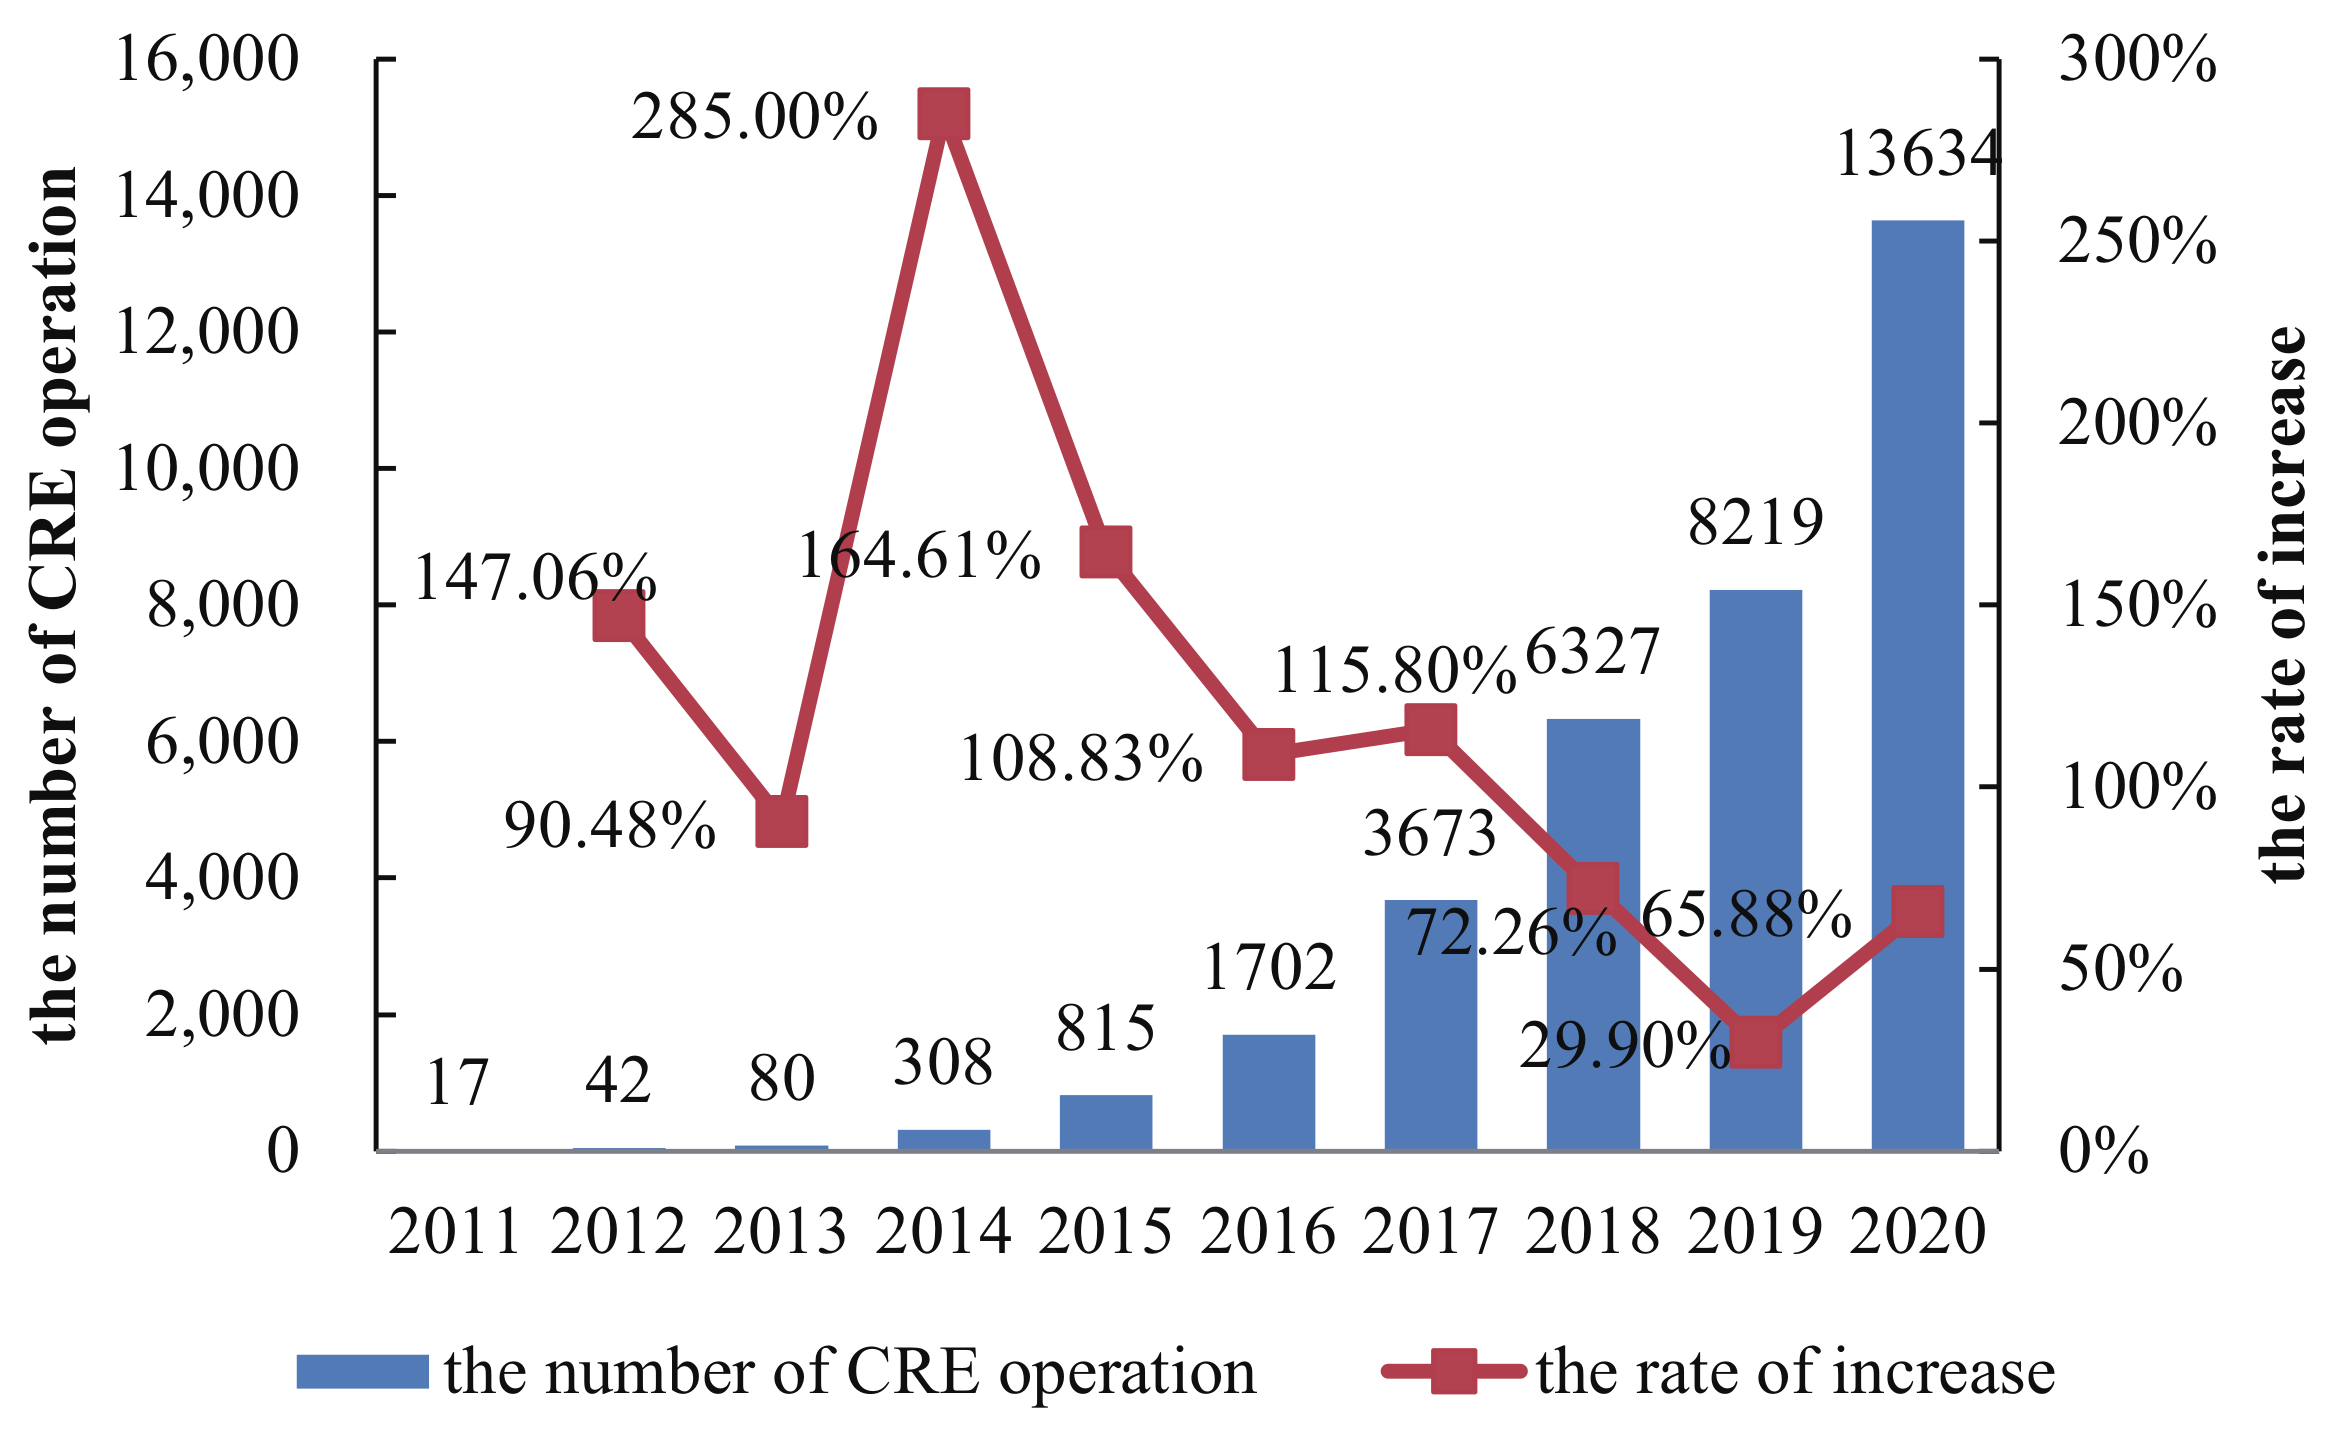
Figure 1. Statistics of China Railway express.
Sustainability 13 03182 g001
Figure 2. The opening of Chengdu CRE company.
Sustainability 13 03182 g002
Figure 3. The flow in-out of empty containers before and after cooperation.
Sustainability 13 03182 g003
Figure 4. The influence of demand fluctuation on the cost. (a) the influence of the demand increase of CRE company; (b) the demand increase of international liner company; (c) the influence of the demand increase of both CRE company and international liner company on the relevant cost.
Sustainability 13 03182 g004
Table 1. Selection of cities and ports.
RegionCitiesPorts
ChinaChengdu (1), Wuhan, Tianjin (3), Qingdao (4),Dalian port (1), Tianjin port (2),
regionRizhao (5), Shanghai (6), Ningbo (7),Qingdao port (3), Shanghai Port (4),
Xiamen (8), Shenzhen (9), Guangzhou (10)Xiamen port (5), Shenzhen port (6),
Qianzhou (11) Nanning (12), Kunming (13)Ningbo port (7)
EuropeHamburg (14), Duisburg (15), Lodz (16),Hamburg Port (8), Rotterdam Port (9),
regionlyon (17), London (18), Tilburg (19),Piraeus Port (10), Port of Gdynia (11),
Nuremberg (20), Poznan (21), Rotterdam (22)Barcelona (12)
Table 2. The basic parameters.
ParametersQuantity
T12
The length of each time period (days)25
unit storage cost in city/port (yuan/day · TEU)20/15
unit rental cost in city/port (yuan/TEU)5000/5000
unit transportation cost between cities or between cities and ports0.5/0.8
in China/Europe (yuan/km · TEU)
unit transportation cost by CRE lines (yuan/km · TEU)0.6
unit transportation cost between ports (yuan/km · TEU)0.25
m1/m2 (yuan/TEU)2500/2000
The maximum booking capacity (TEU)400
The maximum storage capacity in city for CRE company (TEU)1000
The maximum storage capacity in city or port for500/1500
international liner company (TEU)
The empty container demand/supply of CRE company[30,60]/[20,40]
in cities of china (TEU)
The empty container demand/supply of CRE company[25,40]/[40,60]
in cities of Europe (TEU)
The empty container demand/supply of international[30,50]/[20,40]
liner company of cities (TEU)
The empty container demand/supply of international[400,800]/[350,750]
liner company in ports of China (TEU)
The empty container demand/supply of international[400,800]/[450,850]
liner company in ports of China (TEU)
The initial storage volume in cities for CRE[5,15]/[5,15]
company/ international liner company (TEU)
The initial storage volume in ports for international liner company (TEU)[50,80]
Table 3. The results of experiments (unit: million $).
CRE CompanyInternational Liner Company
Non-In-D-Non-In-D-
Cooperation (1)Cooperation (2)Value (1–2)Cooperation (1)Cooperation (2)Value (1–2)
rental cost1.271.080.190.950.890.05
storage cost0.230.170.075.444.830.62
repositoining4.594.430.1610.747.023.73
cost
Total cost6.105.680.4217.1312.734.40
Table 4. The influence of unit storage cost change on total cost (unit: million $).
Change of UnitIn-CooperationNon-CooperationD-Value
Storage CostThe Total Cost (1)The Total CostThe Total Cost ofThe Total Cost(2 + 3 − 1)
of CREof International(2 + 3)
Company (2)Liner Company (3)
018.416.1017.1323.234.82
+518.816.3517.3223.674.86
+1019.206.6117.5124.124.91
+1519.606.8617.7024.564.96
+2019.997.1217.8825.005.01
Table 5. The influence of unit repositioning cost change on total cost (unit: million $).
Change of UnitIn-CooperationNon-CooperationD-Value
RepositioningThe Total Cost (1)The Total CostThe Total Cost ofThe Total Cost(2 + 3 − 1)
Cost of CREof International(2 + 3)
Company (2)Liner Company (3)
018.416.1017.1323.234.82
+20%20.707.0219.2826.305.59
+40%22.997.9421.4329.366.37
+60%25.288.8623.5732.437.15
+80%27.5797.7525.7235.507.92
Table 6. The influence of parameter m 1 change on total cost (unit: million $).
Change ofIn-CooperationNon-CooperationD-Value
Parameter m 1 The Total Cost (1)The Total CostThe Total Cost ofThe Total Cost(2 + 3 − 1)
of CREof International(2 + 3)
Company (2)Liner Company (3)
018.416.1017.1323.234.82
+50020.446.1017.1323.232.79
+100020.816.1017.1323.232.42
+150022.106.1017.1323.231.13
+200023.026.1017.1323.230.21
Publisher’s Note: MDPI stays neutral with regard to jurisdictional claims in published maps and institutional affiliations.