Abstract
Street tree species are selected mainly based on functional utility. This selection practice results in effective management. If the value of street trees as perceived by citizens is added to the existing selection criteria, satisfaction will be improved in addition to effective management. This study attempted to find a way to reflect citizens’ values in street tree selection criteria through empirical analysis. A preference survey and the visual and affective evaluation of 12 street tree species in Busan Metropolitan City were conducted. With the collected data, principal component analysis (PCA) was performed to draw common factors of evaluation. Additionally, multidimensional scaling (MDS) was used to group tree species that were considered similar. The study results revealed that citizens prefer species that provide visually positive feelings and intimacy. Some species appropriate for urban greenspaces are not preferred for street trees. Although a low level of nuisance is an important aspect of street trees, citizens do not prefer species that are excessively free from nuisance. When selecting species with a polarized preference, dealing with undesired aspects is required. It is necessary to acknowledge the different preferences of citizens and street tree authorities; reflecting citizens’ values can provide more citizen-friendly street plans.
1. Introduction
Researchers generally agree that urban greenspace provides various benefits and plays a crucial role in maintaining sustainable cities [1]. Its benefits, suggested by various research studies, include improving urban landscape, public health, and land values [2,3]; providing green views, shade, and biological diversity [4,5,6]; reducing air pollution [7]; mitigating the heat island effect [8,9]; affecting the microclimate [10], among others.
In the urban greenspace, street trees grow close to citizens’ daily life [11] and provide frequent chances to encounter the above-mentioned benefits. Most research on street trees has focused mainly on functional benefits, such as data collection [1,11,12,13], policies [14,15,16,17], and species diversity [18,19]. Related research [20,21,22,23] suggests that street trees, being planted alongside roads, should tolerate a harsh growing environment. Therefore, the selection of street tree species is one of the most crucial elements in providing sufficient benefits and ensuring tolerance of harsh growing conditions [23].
Previous research suggested aesthetic, ecological, economic, and environmental factors as the main criteria for tree species selection [3,24,25,26]. Sæbø et al. [26] and Sæbø et al. [27] suggested three categories for species selection: “basic features” (inherent characters such as climate adaptation, and pest and disease tolerance), “urban stress tolerance”, and “amenity and functional features”. Roy [3] suggested, as criteria for species selection, “species characteristics”, “management and maintenance issues”, “visual and aesthetic benefits” and “site factors”. Busan also adopted criteria that selects species “appropriate for climate, soil and public health”, “matching with surrounding landscape”, “representing locality”, and “mitigating environmental pollution or controlling climate” [28]. These criteria mainly focus on functional and management issues, without the consideration of citizens’ preferences and perceptions.
The above criteria are useful and effective in producing aesthetic, ecological, economic, and environmental effects [3,24,25,26]. Street tree authorities adopting these criteria have achieved functionally positive outcomes [16,23,29], and many cities have adopted them. If citizens’ perceptions and preferences are added to the existing selection criteria, it is expected that their level of satisfaction will also improve.
Since user evaluation of the living environment can provide crucial clues for desirable urban planning and environmental design, citizens’ values ought to be prioritized [30]. It is important to consider citizens’ perceptions of street trees to increase satisfaction; however, little research has focused on this aspect. Some studies have addressed citizens’ satisfaction with the urban greenspace [31,32,33,34,35] and the differences in perception [36,37]. Nevertheless, the growing environment of street trees is somewhat different from that of trees planted in other parts of cities, and this difference has an influence on citizens’ perceptions.
Previous studies found that the selection of street tree species has emphasized functional and management aspects from the perspective of tree authorities, and the consideration of citizens’ perceptions and preferences is underrepresented. Research on citizens’ perceptions and preferences regarding street trees is limited. This study aimed to suggest methods to reflect the views of citizens, in other words, to reflect citizens’ values in the selection of street trees. We adopted statistical methodologies to objectify the subjective perceptions and preferences of citizens and to present the implications. This attempt is meaningful, since there are few similar studies, and its outcome is expected to be used for more citizen-friendly street tree planning.
With this purpose in mind, street tree species and the area of study were selected. The preferences for and perceptions of selected species were determined for citizens of the study area. Then, we attempted to outline the visual and affective properties to determine how citizens recognize each existing street tree and to draw common factors influencing their evaluation of these trees through principal component analysis (PCA). To establish how such factors have influenced citizens’ preference, we grouped street trees considered similar by citizens through multidimensional scaling (MDS) and compared the common factors of each group. Through a detailed practical analysis, we derived the characteristics of preferred street tree species and suggested methods for selecting street tree species that reflect these characteristics.
2. Materials and Methods
2.1. Study Area
This study targeted street trees in Busan Metropolitan City. Busan has the second largest population (3,490,727) in South Korea and a high population density (4500/km2). Thirty-six species, with a total of 132,436 street trees, are planted in Busan alongside 960 km of street, out of a total road network of 3707 km [28]; this is therefore an appropriate area for research on urban street trees.
The questionnaire is inevitable method to determine preferences and perceptions. However, because Busan is one of the largest metropolitan cities in Korea, it was necessary to limit the survey area, and thus two criteria were set. The first is roads with a width of 40 m or wider. Roads in cities in Korea are classified into four types (Kwangro, Daero, Zoongro and Soro), based on width, according to the Rules on Decision, Structure and Installation Standards for Urban and Gun Planning Facilities, enacted in 2012 by the Ordinance of the Ministry of Land, Infrastructure and Transport. The widest road category is Kwangro (with a width 40 m or wider). Each type of road is subdivided into three classes. The second criterion used was roads with street trees composed of over 50% of the 12 selected species. Roads with a width 40 m or wider are Kwangro Class 1 (width 70 m or wider), Kwangro Class 2 (width from 50 m to below 70 m), and Kwangro Class 3 (width from 40 m to below 50 m). These are collectively referred to as “boulevards”. There are 46 boulevards in Busan; nine boulevards meeting the two criteria were set for the final survey area (Figure 1).
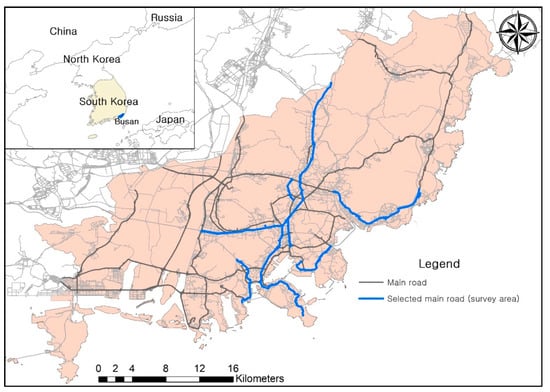
Figure 1.
Survey area.
2.2. Species Selection for Research and Data Collection
Among the 36 street tree species planted in Busan, 12 species were selected for this study. These 12 species comprise 95.72% of all street trees. The remaining 24 species are few in number and planted in limited areas; thus, most citizens have few opportunities to encounter them. Twenty-four species were thus excluded since they were not appropriate for preference and similarity analysis. The selected 12 species include Yoshino cherry (Prunus yedoensis Matsumura), maidenhair (Ginkgo biloba L.), sawleaf zelkova (Zelkova serrata Makino), bottonwood (Platanus occidentalis L.), silver magnolia (Machilus thunbergii S. et Z.), Chinese scholar (Sophora japonica L.), Retusa fringe (Chionanthus retusus Lindl. et Paxton), Japanese black pine (Pinus thunbergii Parl.), round-leaf holly (Ilex rotunda Thunb.), trident maple (Acer buergerianum Miq.), Japanese horse chestnut (Aesculus turbinata Bl.), and Japanese hackberry (Celtis sinensis Pers.). Figure 2 shows the 12 species; the picture on the left for each species shows the species in a street context and the picture on the right for each species was sourced from a book [38].
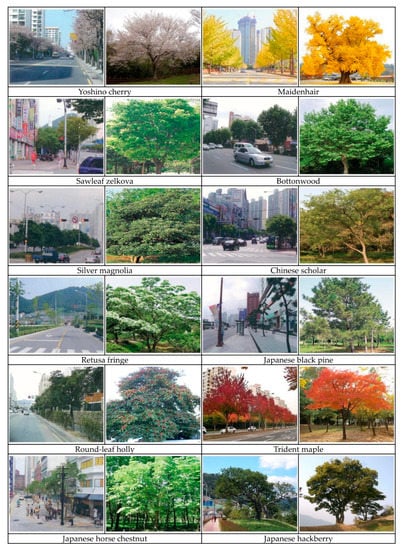
Figure 2.
Twelve selected street tree species in Busan Metropolitan City.
Since the survey asked for the comparison of street tree species, pictures in a street context were used for the survey. They were taken when each species was in high season, since it is important to compare species under identical conditions. The physical characteristics of each tree, such as height, size, seasonal appearance, etc., are important, but they were not considered in the survey. The survey was conducted with randomly chosen citizens in the survey area, and the data were collected and analyzed in November 2020.
The survey consisted of questions about the characteristics of and preferences for the tree species and the level of similarity between them. The respondents were presented with images (7 cm × 8 cm) of each species and asked to evaluate the level of fifteen visual and affective properties of the 12 species. For preference, they were asked to “choose the three most preferred and the three most non-preferred species” and “choose or mention the reasons for selecting the most preferred and the most non-preferred species”. For the similarity evaluation, they also were asked, “after looking at the pair of pictures of species, choose the level of similarity you felt”. Similarity was evaluated on a five-point Likert scale.
Since the questionnaire aimed to evaluate and compare various tree species, it was complicated for respondents and time consuming. However, 128 valid samples out of 140 were obtained. Table 1 shows the characteristics of the 128 valid respondents. The average residence period was about 20 years, and 68% of respondents were male, more than twice the percentage of females. The average age was 35.4 years old, and 57% of the respondents were found to have an educational background of junior college or higher. Most respondents (87.5%) had a monthly income of three million won or less (Table 1).

Table 1.
Summary of respondent characteristics.
2.3. Visual and Affective Characteristics
In the environmental assessment, it was necessary to know the meaning of an environmental image. It has two kinds of meanings: the perceptual and cognitive meaning from the assessment of visual properties, and the affective meaning from affective appraisals [39,40,41,42]. The former is related to the evaluation of an environment’s physical features, such as spatial structure and organizational relations [43,44], and the latter represents the emotional response to an environment [40,41,45]. Although there are two aforementioned meanings, it is not possible to completely separate the perceptual and cognitive meaning from the affective meaning [41]; thus, this study did not measure them independently.
To determine the common factors in evaluating the image of street trees, we adopted visual property variables representing perceptual and cognitive meaning and affective properties variables representing affective meaning. We sampled variables for visual property from the research of Lynch [44], Nasar [46], Russell and Lanius [47], Nasar and Kang [48], Russell and Snodgrass [42], Hanyu [40,45], Ataov [49], Herzog and Miller [50], and Peron et al. [51]. We selected six visual property variables, including simple-complex [40,42,45,46,49], covered-exposed [40,44,46,50], closed-open [40,45,46,48], common-unique [40,42,45,46,49,51], low nuisance-high nuisance [40,45,46], and unfamiliar-familiar [40,45,47,51]. We excluded those variables with low relevance to street trees, such as legibility, coherence, naturalness and vehicles.
To evaluate affective meaning, we utilized semantic differential (SD), which provides pairs of contrary adjectives as a rating scale to estimate the perceived strength of a concept [52]. Since people can express differently about the feeling of a same object, SD can adopt similar adjectives. Affective property variables were sampled from the research of Abelson and Sermat [53], Nasar [46], Russell [54], Russell and Pratt [41], Nasar and Kang [48], Russell and Snodgrass [42], Hanyu [40,45,55], and Russell and Mehrabian [56]. We selected nine affective property variables, including pleasant-unpleasant [40,41,45,48,53,54,55,56], exciting-boring [40,41,42,45,48,54,55], relaxing-distressing [40,41,42,45,48,55], fearful-safe [40,45,54], interesting-uninteresting [40,45], beautiful-ugly [41,55], good-bad [55], likable-dislikable [46], and cold-warm.
Photographs of 12 street tree species were presented, and respondents evaluated fifteen variables on a five-point Likert scale. PCA was conducted to derive the common factors influencing the appraisal of street trees.
2.4. Similarity Characteristics
Species considered similar by citizens were grouped through MDS, a method used to express the attribute data of objects on a single perceptual map. It is widely used in evaluating similarity and preference as it is a quantitative analysis that expresses similarity data and preference data with a distance model. That is, MDS explains dissimilarity with a psychological calculation, adopting a mathematical formula for the distance between two objects [57]. In addition, it models data by using the distance between objects in geometric space to visualize the arrangement of data and make it easier for researchers to understand and derive important information from the data [57]. One of the most important merits of MDS is that it can limit the perceptual dimensions in which a series of stimuli is perceived, and reliable results can be obtained without requiring abundant samples [58]. For these reasons, this study, with 128 samples, was able to derive sufficiently reliable results through MDS.
The physical distance appearing in the results of MDS decreases as the similarity is evaluated to be higher. That is, the basic principle of MDS is to assume that respondents calculate the distance in their psychological space when responding to the dissimilarity between objects. The data used in similarity analysis consist of dissimilarity data with a diagonal element of “0” or the opposite of similarity data—a format similar to the correlation matrix. After all, dissimilarity data are defined as the distance between individuals, and the distance is defined using the Euclidean distance formula. Therefore, the distance between the two objects with coordinate points and is defined as the Euclidean distance by the Pythagorean theorem, and the space becomes a dimensional Euclidean space. If the Euclidean distance is defined as dissimilarity, the symmetric matrix with a diagonal element of “0” becomes the Euclidean distance matrix and can be expressed as follows [56]:
Respondents were asked to evaluate the level of similarity between each pair of the 12 species. The collected data were classified into similar groups by multidimensional unfolding (MDU), one of the MDS methods. MDU is a geometric searching method that drives the arrangement of two groups based on the pairwise preferences between the elements of the two target groups [59]. Through MDU, the degree of similarity evaluated by respondents was derived as a two-dimensional perceptual map where the distance represents the degree of similarity; in other words, the closer the distance between species, the more similar the characteristics of the trees. The groups of similar species are compared using the level of common factors derived from visual and affective evaluation to understand the features of each group and reveal the relation with citizens’ preferences.
3. Results
3.1. Preference for Street Trees
Respondents were asked to select three preferred and three non-preferred street trees among the 12 species. The top five species of each ranking are shown in Figure 3. The most preferred species were the Yoshino cherry (37.1%), trident maple (17.9%), Japanese black pine (7.9%), maidenhair (7.1%), and sawleaf zelkova (7.1%). The second most preferred species were the Yoshino cherry (20.7%), maidenhair (20.0%), trident maple (17.9%), Retusa fringe (6.4%), and sawleaf zelkova (5.7%). The third most preferred species were the sawleaf zelkova (15.7%), trident maple (15.0%), Japanese hackberry (10.0%), maidenhair (10.0%), and round-leaf holly (10.0%). Based on the results, it can be concluded that the Yoshino cherry was the most preferred species, showing the highest ratio in the first and second preferences, and the first preference was more than twice that of the trident maple, which was the next preferred tree species. It is judged that the Yoshino cherry’s flowers in full bloom were well recognized by citizens, since 60% of respondents who chose the Yoshino cherry as the most preferred species specified its flowers as selecting reason. The trident maple was ranked second in the first and third preferences and third in the second preference. Maidenhair ranked second in the second preference and fourth in the first and third preferences; thus, it seems to be included in the citizens’ preferred tree species.
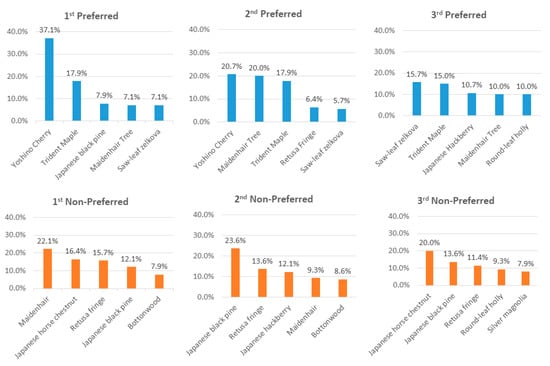
Figure 3.
Street tree preference.
The least preferred tree species were the maidenhair (22.1%), the Japanese horse chestnut (16.4%), the Retusa fringe (15.7%), the Japanese black pine (12.1%), and the bottonwood (7.9%). The second non-preferred species were the Japanese black pine (23.6%), the Retusa fringe (13.6%), the Japanese hackberry (12.1%), the maidenhair (9.3%), and the bottonwood (8.6%). The third non-preferred species were the Japanese horse chestnut (20.0%), the Japanese black pine (13.6%), the Retusa fringe (11.4%), the round-leaf holly (9.3%), and the silver magnolia (7.9%). As shown in Figure 3, it was difficult to specify the rank of non-preferred species. However, in general, the maidenhair, Japanese horse chestnut, Retusa fringe, and Japanese black pine occupy a high portion of each non-preferred ranking and may therefore be regarded as the most non-preferred species by citizens. Among respondents who chose maidenhair as most non-preferred species, 85% of them chose dirtiness of fallen leaves and fruits as a demerit, and respondents to short-answer questions revealed the odor of Gingko as a non-preferred reason. Those who disliked Japanese horse chestnut, Retusa fringe and Japanese black pine commented on bad appearance, not pretty, not leafy and not matching with surroundings as non-preferred reasons.
The fact that three species with “Japanese” in their names are non-preferred species may be misunderstood as antipathy towards Japan, with the name influencing the citizens’ decisions on preference. However, those names including the word “Japanese” are only named as such in English, whereas Korean names do not include the term, and Korean names were used in the survey. Therefore, the non-preference has no relation to the trees’ names.
It is interesting that the maidenhair showed a relatively high rate in both preferred and non-preferred rankings, manifesting a clearly polarized preference. Respondents to open answers, who are favorable to maidenhair, revealed colorful leaves in autumn as the reason. As mentioned above, the reasons to be unfavorable include dirtiness and odor.
3.2. Evaluation of Visual and Affective Characteristics
Citizens’ evaluation of the visual and affective properties of the 12 street tree species is as follows. The most preferred, the Yoshino cherry, received over 3.0 in all the variables. It ranked first in unfamiliar-familiar (4.094), pleasant-unpleasant (3.992), relaxing-distressing (3.727), safe-fearful (3.693), beautiful-ugly (4.141), good-bad (4.078), and warm-cold (4.117); it ranked second in exciting-boring (3.441), interesting-uninteresting (3.680), and likable-dislikable (3.953). The second preferred, the trident maple, also received over 3.0 in all 15 variables and ranked first in common-unique (3.852), exciting-boring (3.734), interesting-uninteresting (3.859), and likable-dislikable (3.961); it ranked second in simple-complex (3.578), pleasant-unpleasant (3.906), relaxing-distressing (3.570), safe-fearful (3.555), beautiful-ugly (4.008), good-bad (3.883), and warm-cold (3.969). The two most preferred species—the Yoshino cherry and trident maple—were highly evaluated in visual affective characteristics, and it is presumed that this led to the high preference of citizens.
The Retusa fringe, Japanese black pine, and Japanese horse chestnut appeared to be non-preferred species in the survey. The Retusa fringe was ranked first in covered-exposed (3.984), closed-open (3.969), and low-nuisance-high nuisance (4.016), but it was quite low in other variables. The Japanese black pine showed relatively high scores in covered-exposed (3.803), closed-open (3.770), common-unique (3.536), and low nuisance-high nuisance (3.732) and had low scores in other variables. The Japanese horse chestnut had relatively high scores in covered-exposed (3.516), closed-open (3.492), and low nuisance-high nuisance (3.492) and low scores in the rest of the variables. Therefore, it is possible to assume that non-preferred street tree species have high scores in covered-exposed, closed-open, and low nuisance-high nuisance but have low scores in the remaining variables. The maidenhair, with polarized preference, did not show remarkably high or low scores in any of the variables.
3.3. Common Factors Influencing the Visual and Affective Evaluation of Street Trees
To determine the common factors influencing the visual and affective evaluation of street trees, PCA was conducted using the data presented in Table 2. As a result, three components with an eigenvalue of 1.0 or higher were derived, and their explanatory range was 65.74% (Table 2). Component 1 has the highest eigenvalue (6.548) and thus has the highest explanatory range. Component 2 has a value of 1.748, and Component 3 has a value of 1.564.
Table 2.
Principal component analysis.
Component loadings after varimax rotation are shown in Table 3. Component 1 was composed of nine variables, and the other two components had three variables each. Component 1 could have the highest eigenvalue, since it has more variables; thus it is recognized as a crucial component in the citizens’ perceptions and evaluation of street trees.
Table 3.
Rotated component matrix.
Component 1 includes good-bad, likable-dislikable, relaxing-distressing, beautiful-ugly, safe-fearful, pleasant-unpleasant, warm-cold, interesting-uninteresting, and unfamiliar-familiar, and all variables have a positive relation. Component 1 is named the “emotion” component because it is related to the emotional feelings associated with the street trees. Component 2 includes three variables—closed-open, covered-exposed, and low nuisance-high nuisance—all showing positive relation. Variables in Component 2 are related to the external shape of street trees; thus, it is named the “appearance” component. Component 3 is a group of three variables comprising simple-complex, common-unique, and boring-exciting, which have positive relation. Component 3 is named the “impression” component because it is related to the impression felt based on the appearance of the street trees. To be more specific, the emotion component is affective feeling about street trees, the appearance component is the expression of trees, and the impression component is the visual feeling about species.
3.4. Grouping of Similar Street Trees and Component Score Comparison of Groups
The results of similarity analysis using MDS are shown in Figure 4. Twelve street tree species are classified into four groups. Group I includes two species—the Yoshino cherry and the trident maple. Group II has six species—the sawleaf zelkova, bottonwood, silver magnolia, Chinese scholar, round-leaf holly, and Japanese hackberry. Group III has three species—the Retusa fringe, Japanese black pine, and Japanese horse chestnut. Group IV comprised the maidenhair alone and had unique characteristics different from other groups. The characteristics of the four groups will be interpreted with the results of PCA in the discussion section.
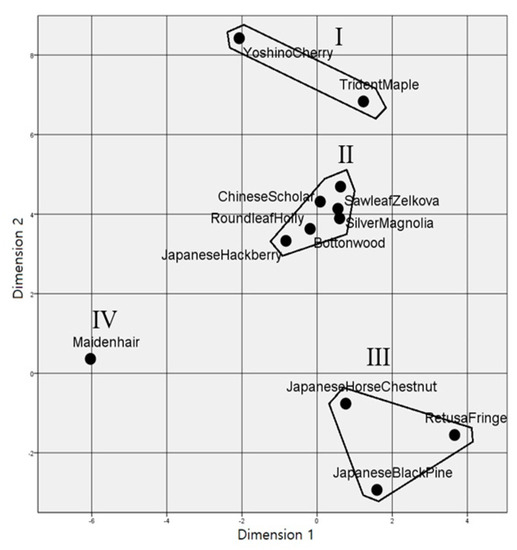
Figure 4.
2-D perceptual map of similarity.
4. Discussion
Each tree species is scored on derived components by PCA to analyze the images of street trees (Table 4). The component score is a measure of the degree of each factor, and if the component score is high, it can be interpreted that each street tree has a high level of characteristics of the corresponding component.
Table 4.
Principal component scores by tree.
In the emotion component, the Yoshino cherry (0.655) and the trident maple (0.366) showed high scores. On the other hand, the remaining 10 species showed significantly low component scores in comparison with the top two species. It is assumed that citizens appreciate the Yoshino cherry and trident maple, and that they feel a sense of intimacy with these trees. These two species were also highly evaluated in the preference survey; therefore, it is assumed that citizens feel more favorable to the species that evoke emotion and intimacy. The species with low component scores include the Japanese black pine (−0.416), the Retusa fringe (−0.313), the Japanese horse chestnut (−0.303), the bottonwood (−0.236), and the round-leaf holly (−0.082). Presumably, these species were evaluated as evoking less positive emotions and were considered unfamiliar by citizens. In addition, they were not highly evaluated in the preference survey. It may then be determined that the component score of the emotion component is closely related to the preference for a particular species.
The Retusa fringe (0.738) and the Japanese black pine (0.603) have high appearance component scores. It seems that citizens judge these species as open, exposed, and having a low level of nuisance. However, they showed poor preference, and the Japanese black pine and the Retusa fringe have low scores in the emotion component. In other words, since these trees do not have many branches and leaves, citizens consider them to be open and not to represent visual obstacles; nevertheless, they are not suitable as street trees.
In the impression component, only four species—the trident maple (0.836), Japanese hackberry (0.673), Yoshino cherry (0.239), and maidenhair (0.199)—showed positive scores. That is, citizens positively evaluated the appearance of these four species as noteworthy. It is interesting that the trident maple and Yoshino cherry belonged to the preferred species, but the Japanese hackberry was quite unfavorable. It is large and has lush leaves and spread-out branches; thus, it is quite a visually impressive species. Nevertheless, unusually, it is not popular. Citizens may consider it appropriate as an ornament in a park or as a landmark at the entrance of a village but not as a street tree. In case of the maidenhair, the component score was not high, but a positive aspect is that it seemed to reflect impressive yellow autumn leaves. This species showed a polarized preference.
Three component scores derived from PCA were input for each species, and the mean of each group is presented in Table 5. The comparison of principal component scores by each group provides useful insight into the citizens’ preference of street trees. Group I consists of the Yoshino cherry and trident maple, and its emotion component score (0.511) and impression component score (0.538) were higher than those of other groups. The species in Group I showed the highest preference and intimacy. In other words, it is assumed that the emotion and impression components are the most crucial factors reflecting citizens’ values in street tree species selection.
Table 5.
Principal component scores by group.
With regard to Group II, the emotion component score (−0.013), the appearance component score (−0.288), and the impression component score (−0.072) were generally low. These species were distinguished neither in preference nor non-preference; in other words, it is assumed that the species in this group do not attract much attention from citizens as street trees, and their evaluation is reserved. Though the Japanese hackberry showed a high impression component score (0.673), as mentioned above, this is impressive but unfavorable. As it belongs to this group, it is confirmed that this species is not suitable as a street tree.
In Group III, only the appearance component score (0.513) was particularly high, and the emotion component score (−0.344) and impression component score (−0.0281) were significantly low. The Retusa fringe, Japanese black pine, and Japanese horse chestnut in this group were highly non-preferred. These species give a sense of openness due to few visual disturbances. Since they do not hide and cover traffic signs and road facilities, they are highly functional as street trees. Nevertheless, citizens do not prefer them as such.
In Group IV, the maidenhair is a unique case. All the component scores are medium level—emotion (0.087), appearance (0.131), and impression (0.199)—and there were no particularly noteworthy factors. This tree showed a polarized preference, and the moderate mean component scores are the result of the offset by the polarized component scores. The distinctive feature of this species is that preference is divided, especially in the autumn. Citizens favor its autumn leaves changing into yellow, but they do not appreciate the odor and dirtiness of the fallen fruits. The simultaneous occurrence of like and dislike implies that preference may change, even by the same person.
5. Conclusions
Trees in cities provide various benefits and have an important role in maintaining a sustainable urban environment [1,2,3,4,5,6,7,8,9,10]. In the urban greenspace, street trees are the easiest and most accessible natural environment for citizens [11] and should endure coarse growing circumstances [20,21,22,23]. Therefore, the functional role of street trees is an important element to consider in the selection of street tree species [3,24,25,26,27]. Further to the functional selection of species, this study attempts to suggest a way to reflect citizens’ values in street tree species selection. The analysis was conducted through the evaluation of preferences, visual and affective characteristics, derivation of common factors, and grouping of similar species, with the data collected by a questionnaire survey.
As a result of the analysis, suggestions to reflect citizens’ preferences and perceptions of street tree selection criteria are as follows. First, it is necessary to select species with a high emotional component—which evoke positive emotions and enhance intimacy—as well as species with a high impression component—which have an impressive appearance. In this study, the Yoshino cherry and the trident maple in Group I are included in this category and showed the highest preference. The Yoshino cherry in the spring and the trident maple in the autumn stand out; thus, the degree of preference for a street tree may vary depending on the season. However, to improve citizens’ satisfaction in general, it is necessary to select species that arouse positive emotion, intimacy, and attention.
Second, it should be considered that citizens deem some species not suitable as street trees. Species belonging to Group II were not evaluated highly in the preference survey, and all component scores appeared to be low. The Japanese hackberry, among the species in Group II, had a high impression component score; however, it was not chosen as one of the preferred species. Presumably, citizens judged it as having an impressive appearance but considered it unfavorable as a street tree. In other words, species like the Japanese hackberry may suit other types of urban greenspace, such as parks, but not be suitable as street trees. This provides evidence that species selected by the street tree authority may not satisfy citizens.
Third, it is suggested to avoid species that are excessively open, exposed, and with a low level of nuisance. The Retusa fringe, Japanese black pine, and Japanese horse chestnut in Group III, which were not favored by citizens, have an exceptionally high appearance component, whereas their other components are low. In terms of functionality, it is important to choose species with a low level of nuisance to not cover traffic signals and street signs, but it is also necessary to avoid species that are considered unattractive by citizens; this is another example showing the difference in preferred street tree species between citizens and tree authorities.
Finally, if species with a polarized preference are chosen, it is necessary to have precautionary measures to cope with undesired aspects. The maidenhair in Group IV is beloved as a street tree, but it is also undesired by many citizens for the odor released by the ginkgo nut. In terms of functionality, it is superior in purifying air pollution and resistant to pests and diseases, and it gives a visually good impression. The unfavorable aspect is the odor of the fruit, for which a technical solution exists: male trees should be used since the fruit opens only in female trees. With the development of identifying methods, it is possible to plant only male trees. Species with a polarized preference require preventive effort to remove or sufficiently reduce the unfavorable aspects.
These suggestions can be directly used in the selection of street tree species in Busan, and future street tree related plans such as “Busan park and green space master plan”. The methods used in this study will be helpful to make a bottom-up-type urban green related plan, which reflects citizens’ values and needs from the beginning. It will also improve the level of citizens’ participation. The selection of street tree species has emphasized mainly functional aspects thus far. This study is meaningful in that it suggests empirical methods to reflect citizens’ values on the selection. Street tree selection criteria emphasizing functionality are still important and will be used in the future. If the value of citizens’ perceptions and preferences is added to functional criteria, citizens’ satisfaction may be increased [60].
The limitation of this study and suggestions for further research are as follows. The selected fifteen variables were referenced from previous research; however, it has not been verified that they are optimized for the study of preference and perception of street trees. Suggestions for future research include finding a variable composition that better reflects the citizens’ preferences and perceptions. The representativeness of respondents is limited, since they were randomly sampled for the research in metropolitan Busan. Future studies should consider limiting the research area and scope to guarantee representativeness. The other limitation is the fact that seasonal changes in tree species are not considered. It was inevitable to compare the images of each species in high season. Related research reflecting the seasonal changes of each species will be interesting. Since high attachment does not necessarily link to higher willingness to pay [61,62], research of comparing preference and willingness to pay is suggested.
Author Contributions
Conceptualization, S.S.K., J.-S.L. and Y.C.; methodology, S.S.K., J.-S.L., D.H.L. and Y.C.; software, D.H.L.; validation, S.S.K., J.-S.L., D.H.L. and Y.C.; formal analysis, S.S.K., J.-S.L., D.H.L. and Y.C.; investigation, S.S.K., J.-S.L. and Y.C.; resources, S.S.K. and J.-S.L.; data curation, S.S.K., J.-S.L. and D.H.L.; writing—original draft preparation, S.S.K., J.-S.L. and Y.C.; writing—review and editing, S.S.K. and Y.C.; visualization, S.S.K. and J.-S.L.; supervision, Y.C. All authors have read and agreed to the published version of the manuscript.
Funding
This research received no external funding.
Data Availability Statement
The data is available on request from the corresponding author.
Conflicts of Interest
The authors declare no conflict of interest.
References
- Seiferling, I.; Naik, N.; Ratti, C.; Proulx, R. Green streets—Quantifying and mapping urban trees with street-level imagery and computer vision. Landsc. Urban Plan. 2017, 165, 93–101. [Google Scholar] [CrossRef]
- Pandit, R.; Polyakov, M.; Tapsuwan, S.; Moran, T. The effect of street trees on property value in Perth, Western Australia. Landsc. Urban Plan. 2013, 110, 134–142. [Google Scholar] [CrossRef]
- Roy, S. Anomalies in Australian municipal tree managers’ street-tree planting and species selection principles. Urban For. Urban Green. 2017, 24, 125–133. [Google Scholar] [CrossRef]
- Cowett, F.D.; Bassuk, N.L. Statewide assessment of street trees in New York State, USA. Urban For. Urban Green. 2014, 13, 213–220. [Google Scholar] [CrossRef]
- Li, X.; Ratti, C.; Seiferling, I. Quantifying the shade provision of street trees in urban landscape: A case study in Boston, USA, using Google Street View. Landsc. Urban Plan. 2018, 169, 81–91. [Google Scholar] [CrossRef]
- Subburayalu, S.; Sydnor, T.D. Assessing street tree diversity in four Ohio communities using the weighted Simpson index. Landsc. Urban Plan. 2012, 106, 44–50. [Google Scholar] [CrossRef]
- Harris, T.B.; Manning, W.J. Nitrogen dioxide and ozone levels in urban tree canopies. Environ. Pollut. 2010, 158, 2384–2386. [Google Scholar] [CrossRef] [PubMed]
- Lanza, K.; Stone, B. Climate adaptation in cities: What trees are suitable for urban heat management? Landsc. Urban Plan. 2016, 153, 74–82. [Google Scholar] [CrossRef]
- Park, J.; Kim, J.; Lee, D.K.; Park, C.Y.; Jeong, S.G. The influence of small green space type and structure at the street level on urban heat island mitigation. Urban For. Urban Green. 2017, 21, 203–212. [Google Scholar] [CrossRef]
- Sanusi, R.; Johnstone, D.; May, P.; Livesley, S.J. Microclimate benefits that different street tree species provide to sidewalk pedestrians relate to differences in Plant Area Index. Landsc. Urban Plan. 2017, 157, 502–511. [Google Scholar] [CrossRef]
- Plant, L.; Sipe, N. Adapting and applying evidence gathering techniques for planning and investment in street trees: A case study from Brisbane, Australia. Urban For. Urban Green. 2016, 19, 79–87. [Google Scholar] [CrossRef]
- Berland, A.; Lange, D.A. Google Street View shows promise for virtual street tree surveys. Urban For. Urban Green. 2017, 21, 11–15. [Google Scholar] [CrossRef]
- Vogt, J.; Gillner, S.; Hofmann, M.; Tharang, A.; Dettmann, S.; Gerstenberg, T.; Schmidt, C.; Gebauer, H.; Van de Riet, K.; Berger, U.; et al. Citree: A database supporting tree selection for urban areas in temperate climate. Landsc. Urban Plan. 2017, 157, 14–25. [Google Scholar] [CrossRef]
- Buijs, A.; Hansen, R.; Van der Jagt, S.; Ambrose-Oji, B.; Elands, B.; Rall, E.L.; Mattijssen, T.; Pauleit, S.; Bunhaar, H.; Olafsson, A.S.; et al. Mosaic governance for urban green infrastructure: Upscaling active citizenship from a local government perspective. Urban For. Urban Green. 2019, 40, 53–62. [Google Scholar] [CrossRef]
- Foo, K. Examining the Role of NGOs in urban environmental governance. Cities 2018, 77, 67–72. [Google Scholar] [CrossRef]
- Galenieks, A. Importance of urban street tree policies: A Comparison of neighbouring Southern California cities. Urban For. Urban Green. 2017, 22, 105–110. [Google Scholar] [CrossRef]
- Seamans, G.S. Mainstreaming the environmental benefits of street trees. Urban For. Urban Green. 2013, 12, 2–11. [Google Scholar] [CrossRef]
- Dangulla, M.; Manafb, L.A.; Ramli, M.F.; Yacob, M.R. Urban tree composition, diversity and structural characteristics in Northwestern Nigeria. Urban For. Urban Green. 2020, 48, 126512. [Google Scholar] [CrossRef]
- Nagendra, H.; Gopal, D. Street trees in Bangalore: Density, diversity, composition and distribution. Urban For. Urban Green. 2010, 9, 129–137. [Google Scholar] [CrossRef]
- Chen, Y.; Wang, X.; Jiang, B.; Wen, Z.; Yang, N.; Li, L. Tree survival and growth are impacted by increased surface temperature on paved land. Landsc. Urban Plan. 2017, 162, 68–79. [Google Scholar] [CrossRef]
- Sjöman, H.; Nielsen, A.B. Selecting trees for urban paved sites in Scandinavia—A review of information on stress tolerance and its relation to the requirements of tree planners. Urban For. Urban Green. 2010, 9, 281–293. [Google Scholar] [CrossRef]
- Jim, C.Y. Protection of urban trees from trenching damage in compact city environments. Cities 2003, 20, 87–94. [Google Scholar] [CrossRef]
- Mullaney, J.; Lucke, T.; Trueman, S.J. A review of benefits and challenges in growing street trees in paved urban environments. Landsc. Urban Plan. 2015, 134, 157–166. [Google Scholar] [CrossRef]
- Amir, S.; Misgav, A. A framework for street tree planning in urban areas in Israel. Landsc. Urban Plan. 1990, 19, 203–212. [Google Scholar] [CrossRef]
- Li, Y.Y.; Wang, X.R.; Huang, C.L. Key street tree species selection in urban areas. Afr. J. Agric. Res. 2011, 6, 3539–3550. [Google Scholar] [CrossRef]
- Sæbø, A.; Borzan, Z.; Ducatillion, C.; Hatzistathis, A.; Lagerstrom, T.; Supuka, J.; García-Valdecantos, J.L.; Rego, F.; Van Slycken, J. The selection of plant materials for street trees, park trees and urban Woodland. In Urban Forests and Trees; Konijnendijk, C., Nilsson, K., Randrup, T., Schipperijn, J., Eds.; Springer: New York, NY, USA, 2005; pp. 257–280. [Google Scholar] [CrossRef]
- Sæbø, A.; Benedikz, T.; Randrup, T.B. Selection of trees for urban forestry in the Nordic countries. Urban For. Urban Green. 2003, 2, 101–114. [Google Scholar] [CrossRef]
- Busan Metropolitan City. 2030 Busan Park and Green Space Master Plan; Busan Metropolitan City: Busan, Korea, 2011; pp. 150–174. [Google Scholar]
- Yang, J.; Zhou, J.; Ke, Y.; Xiao, J. Assessing the structure and stability of street in Lhasa, China. Urban For. Urban Green. 2012, 11, 432–438. [Google Scholar] [CrossRef]
- Peckham, S.C.; Duinker, P.N.; Ordóñez, C. Urban forest values in Canada: Views of citizens in Calgary and Halifax. Urban For. Urban Green. 2013, 12, 154–162. [Google Scholar] [CrossRef]
- Barrera, F.; Peyes-Peackeb, S.; Harrisc, J.; Bascuñán, D.; Farías, J.M. People’s perception influences on the use of green spaces in socio-economically differentiated neighborhoods. Urban For. Urban Green. 2016, 201, 254–264. [Google Scholar] [CrossRef]
- Gozalo, G.R.; Morillas, J.M.B.; González, D.M. Perceptions and use of urban green spaces on the basis of size. Urban For. Urban Green. 2019, 46, 126470. [Google Scholar] [CrossRef]
- Lafortezza, R.; Carrus, G.; Sanesi, G.; Davies, C. Benefits and well-being perceived by people visiting green spaces in periods of heat stress. Urban For. Urban Green. 2009, 8, 97–108. [Google Scholar] [CrossRef]
- Ng, W.; Chau, C.; Powell, G.; Leung, T. Preferences for street configuration and street tree planting in urban Hong Kong. Urban For. Urban Green. 2015, 14, 30–38. [Google Scholar] [CrossRef]
- Wang, H.; Yang, Y.; Li, M.; Liu, J.; Jin, W. Residents’ preferences for roses, features of rose plantings and the relations between them in built-up areas of Beijing, China. Urban For. Urban Green. 2017, 27, 1–8. [Google Scholar] [CrossRef]
- Madureira, H.; Nunes, F.; Oliveira, J.V.; Cormier, L.; Madureira, T. Urban residents’ beliefs concerning green space benefits in four cities in France and Portugal. Urban For. Urban Green. 2015, 14, 56–64. [Google Scholar] [CrossRef]
- Zhao, J.; Xu, W.; Li, R. Visual preferenceof trees: The effects of tree attributes and seasons. Urban For. Urban Green. 2017, 25, 19–25. [Google Scholar] [CrossRef]
- Gyeongsangbuk-Do Forest Environment Research Institute. Trees Picture Book; Gyeongsangbuk-Do Forest Environment Research Institute: Gyeongju-si, Korea, 2011; pp. 3–324. [Google Scholar]
- Canter, L.W. Interdisciplinary teams in environmental impact assessment. Environ. Impact Assess. Rev. 1991, 11, 375–387. [Google Scholar] [CrossRef]
- Hanyu, K. Visual properties and affective appraisals in residential areas after dark. J. Environ. Psychol. 1997, 17, 301–315. [Google Scholar] [CrossRef]
- Russell, J.A.; Pratt, G. A description of the affective quality attributed to environments. J. Personal. Soc. Psychol. 1980, 38, 311–322. [Google Scholar] [CrossRef]
- Russell, J.A.; Snodgrass, J. Emotion and the environment. In Handbook of Environmental Psychology; Wiley: New York, NY, USA, 1987; Volume 1, pp. 245–280. [Google Scholar]
- Appleyard, H.J. Environment—Cause and cure. Appl. Ergon. 1970, 1, 189. [Google Scholar] [CrossRef]
- Lynch, K. The Image of the City; MIT Press: Cambridge, MA, USA, 1960; pp. 1–14. [Google Scholar]
- Hanyu, K. Visual properties and affective appraisals in residential areas in daylight. J. Environ. Psychol. 2000, 20, 273–284. [Google Scholar] [CrossRef]
- Nasar, J.L. Adult viewers’ preferences in residential scenes: A study of the relationship of environmental attributes to preference. Environ. Behav. 1983, 15, 589–614. [Google Scholar] [CrossRef]
- Russell, J.A.; Lanius, U.F. Adaptation level and the affective appraisal of environments. J. Environ. Psychol. 1984, 4, 119–135. [Google Scholar] [CrossRef]
- Nasar, J.L.; Kang, J. A post-jury evaluation: The Ohio State University design competition for a center for the visual arts. Environ. Behav. 1989, 21, 464–484. [Google Scholar] [CrossRef]
- Ataov, A. Environmental aesthetics. J. Plan. Lit. 1998, 13, 239–257. [Google Scholar] [CrossRef]
- Herzog, T.R.; Miller, E.J. The role of mystery in perceived danger and environmental preference. Environ. Behav. 1998, 30, 429–449. [Google Scholar] [CrossRef]
- Peron, E.; Purcell, A.T.; Staats, H.; Falchero, S.; Lamb, R.J. Models of preference for outdoor scenes: Some experimental evidence. Environ. Behav. 1998, 30, 282–305. [Google Scholar] [CrossRef]
- Osgood, C.E.; Suci, G.J.; Tannenbaum, P.H. The Mearsurement of Meaning; University of Illinois Press: Urbana, IL, USA, 1957; pp. 1–30. [Google Scholar]
- Abelson, R.P.; Sermat, V. Multidimensional scaling of facial expressions. J. Exp. Psychol. 1962, 63, 546–554. [Google Scholar] [CrossRef]
- Russell, J.A. Affective space is bipolar. J. Personal. Soc. Psychol. 1979, 37, 345–356. [Google Scholar] [CrossRef]
- Hanyu, K. The affective meaning of Tokyo: Verbal and non-verbal approaches. J. Environ. Psychol. 1993, 13, 161–172. [Google Scholar] [CrossRef]
- Russell, J.A.; Mehrabian, A. Evidence for a three-factor theory of emotions. J. Res. Personal. 1977, 11, 273–294. [Google Scholar] [CrossRef]
- Brog, I.; Groenen, P. Modern Multidimensional Scaling; Springer: New York, NY, USA, 1997; pp. 37–61. [Google Scholar]
- MacKay, K.J.; Fesenmaier, D.R. An exploration of cross-cultural destination image assessment. J. Travel Res. 2000, 38, 417–423. [Google Scholar] [CrossRef]
- Busing, F.M.T.A. Advances in Multidimensional Unfolding. Ph.D. Thesis, Leiden University, Leiden, The Netherlands, 2010. Available online: http://hdl.handle.net/1887/15279 (accessed on 5 December 2020).
- Gerstenberg, T.; Hofmann, M. Perception and preference of trees: A psychological contribution to tree species selection in urban areas. Urban For. Urban Green. 2016, 15, 103–111. [Google Scholar] [CrossRef]
- Lo, A.Y.; Jim, C.Y. Protest response and willingness to pay for culturally significant urban trees: Implications for Contingent Valuation Method. Ecol. Econ. 2015, 114, 58–66. [Google Scholar] [CrossRef]
- Sabyrbekov, R.; Dallimer, M.; Navrud, S.; Sabyrbekov, R. Nature affinity and willingness to pay for urban green spaces in a developing country. Landsc. Urban Plan. 2020, 194, 103700. [Google Scholar] [CrossRef]


Publisher’s Note: MDPI stays neutral with regard to jurisdictional claims in published maps and institutional affiliations. |
© 2021 by the authors. Licensee MDPI, Basel, Switzerland. This article is an open access article distributed under the terms and conditions of the Creative Commons Attribution (CC BY) license (http://creativecommons.org/licenses/by/4.0/).