Article

The Impact of On-Demand Collective Transport Services on Sustainability: A Comparison of Various Service Options in a Rural and an Urban Area of Switzerland

Institute of Tourism and Mobility ITM, Lucerne School of Business, Lucerne University of Applied Sciences and Arts, 6002 Lucerne, Switzerland
*
Authors to whom correspondence should be addressed.
Sustainability 2021, 13(6), 3091; https://doi.org/10.3390/su13063091
Submission received: 5 February 2021 / Revised: 3 March 2021 / Accepted: 8 March 2021 / Published: 11 March 2021
(This article belongs to the Special Issue Public Transport Integration, Urban Density and Sustainability)

Abstract

:
This study examines the effects of on-demand mobility services on sustainability in terms of emissions and traffic volume. According to our simulations, implementing on-demand mobility services is recommendable only as a supplement to public transport in both urban and rural regions since there are positive effects in terms of CO2 emissions. However, in urban areas, there is a negative impact on the traffic volume in terms of additional vehicle kilometres since the bundled public transport demand is replaced by less bundled on-demand vehicles. In rural areas, the increase in vehicle kilometres plays less of a role due to generally low demand. The negative effects per vehicle kilometre are slightly higher in rural areas due to higher empty kilometres and lower bundling rates, but the negative effects per km2 in dense cities are much more serious. Authorities need to consider these effects according to the spatial context when implementing such services.

1. Introduction

Transportation is responsible for the highest share of emissions (14%) around the world [1], and this number is increasing faster than emissions from other sectors (e.g., agriculture or commercial) as income is rising and infrastructure is expanding globally. Since transportation demands are rapidly increasing, experts expect annual transportation emissions to double by the year 2050 [2]. The increasing demand for mobility in modern societies is leading to several traffic problems in urban areas, such as congestion, traffic noise, and greenhouse gas (GHG) emissions. Especially in low-density areas, transportation forms other than walking, for example the private car, are used to get to the destination of interest [3]. Cities around the world are constantly pursuing energy conservation and climate preservation in order to avoid drastic climatic change and to ensure the continued existence of natural resources for future generations [4,5]. For this reason, [6] insist on the need to reduce GHG emissions considerably. Public transport is a key instrument for reaching climate goals for sustainability see [7]. Therefore, it is obvious that making the transportation system more sustainable is of high priority [4,5,8]. The integration of information and communications technology in mobility systems has the potential to contribute to more sustainable transportation [9,10]. New forms of mobility are arising, helped by digital connectivity and electrification technologies, and on-demand services such as shared electric vehicles are now competing with traditional mobility offerings [11].
The emergence of app-based on-demand mobility is being observed with great interest by research and industry. Driven by digitalisation, the bundling of trips, optimised routing, and dynamic pricing have become more attractive. Cities, particularly in the United States and Asia, are experiencing a boom in the “ride selling” industry. Concepts, such as ride-hailing or ridesharing, are assumed to lead to several societal benefits, such as reduced car purchases; therefore, less congestion and CO2 emissions, e.g., [12,13,14,15]. Additionally, these concepts offer alternatives to more environmentally harmful modes of transport and complement existing public transport services [16]. In addition to the high convenience of these services, however, negative effects can also be observed. These range from declining passenger numbers in public transport to increasing traffic congestion, labour law issues among drivers and climate pollution. Ride selling can have a negative environmental impact if the vehicles cover many empty kilometres, the degree of bundling in the vehicle is low, or when the passengers are mainly poached from more environmentally friendly means of transport such as public transport or slow-moving traffic [10,17,18,19]. At present, however, there is little reliable knowledge about the types of services offered and the spatial contexts in which these collective transport services have a positive or negative aggregate effect.
The present study, therefore, examines the expected ecological effects in terms of the emissions and traffic load of digital on-demand mobility services. This empirical study analyses paid services, such as Uber Pool, Ioki, CleverShuttle, BerlKönig, MOIA, Kollibri, mybuxi, and Kutsuplus, which are a form of ride selling. Ride selling refers to a form of demand aggregation offered by apps or via Internet browsers. It is a paid passenger transport service with passenger cars (mostly minibuses or minivans) that is offered for individual or collective transport by a mobility service provider who provides both the vehicle and the driver [20].
For the analysis, we created four service options, designed to be as realistic as possible, depending on the level of on-demand mobility service integration into public transport. These are the on-demand line operations, supplementation of public transport, replacement of public transport, and commercial offer in competition with public transport. The analysis was differentiated according to these different service variants as well as different spatial conditions. The main focus of the study is the comparison of a rural area (model region Glarus South) with an urban region (model region Basel-St. Johann). All service options were simulated and compared using a model depending on the type of space. This allowed us to estimate the ecological effects of the different service options in different types of space. The results will be condensed into generalised findings.
This paper contributes to the existing literature in several ways. First, the simulation approach used in this paper clearly shows which factors are central to the assessment of the sustainability of on-demand collective transport. On the supply side, among other things, the propulsion system (electric vs. combustion engine), the service concept and the modal shift are taken into account. On the demand side, for example, bundling and trip length play a role in the analysis. What is special about our study is that we also investigated the influence of the spatial situation on the ecological effects of on-demand mobility services. The analysis thus determines which factors have which effects and how realistic it is to influence them in a positive manner. Second, the paper shows several options for integrating on-demand mobility services into public transport to minimise emissions and energy consumption and thus meet the need for sustainability.

2. Literature Review

Traditional passenger transportation systems consist of collective public transport such as the metro, trains or buses. These public transport services have a fixed schedule and depend on existing infrastructure with reduced flexibility, especially regarding geographical issues. On-demand transport services may be an alternative as they can supplement public transport and provide better access to urban and rural regions. In particular, they can provide flexibility regarding the spatial route and temporal scheduling. Taxis are a traditional example of on-demand transport services; however, they compete with modern app-based sharing systems that emerged due to technological advances, such as ride-hailing [21].
In the past decade, on-demand mobility services, such as ride-hailing or flexible on-call buses, have dramatically changed the mobility behaviour of residents, workers, and tourists. Flexible on-call buses are not a new invention and have been established for years, especially in rural areas; for example, those in Germany [22]. However, their dissemination has been limited to specific rural contexts. Thanks to the spread of smartphones, flexible on-demand transportation has been able to massively increase its productivity through optimised “matching” of customers to transport providers compared to the previous business model of the taxi industry [23]. For customers, management via smartphone applications has increased convenience and transparency. In particular, urban and traffic planners, who are responsible for managing the infrastructure, are interested in the positive and negative effects that on-demand mobility services can have on traffic and emissions in urban as well as in rural areas [24].
While several studies argue that ride-hailing services lead to reduced vehicle use and car ownership [12,14], other findings raise concerns regarding the extent of the positive environmental impact of ride-hailing or ridesharing services. A recent study by [25] shows that an electric, pooled ride-hailing trip can reduce emissions by 68% compared with a private vehicle trip. Compared with a non-pooled ride-hailing trip, it produces 79% fewer emissions. However, the authors indicate that ride-hailing can also have severe negative environmental impacts. First, they found that a non-pooled ride-hailing trip leads to 47% more pollution than a private car ride. The increased pollution is caused by “deadheading”, which is when a vehicle is empty of passengers between hired rides. Second, ride-hailing services increase the total number of trips and vehicle miles travelled. They cannibalise other eco-friendlier forms of transport, such as mass transit, walking, or cycling, and are, therefore, about 69% more polluting than the trips they replace. In that respect, ride-hailing services can lead to congestion during peak periods. Reference [24] found that 59% of surveyed ride-hailing trips added a new vehicle to the road. Another important aspect to analyse is the rebound effect; i.e., the unintended shifts in mode choice when people shift from eco-friendly mass transportation to on-demand mobility services that offer high comfort and relatively low prices [19]. Ridesharing or ride-hailing services, such as Uber and Lyft, have been criticised for posing a threat to conventional public transport, particularly suburban buses [26]. The studies by [17,24] confirm this hypothesis and reveal that on-demand mobility services are substitutes for public transport offers. Moreover, induced traffic is generated by such services, which leads to higher traffic performance and expenditure. Nevertheless, there are opportunities for public agencies to supplement public transport with ride-hailing; for example, in first-mile/last-mile service planning [24,27].
Other studies focus on the environmental impacts of ridesharing. In several Asian megacities such as Singapore or Hong Kong, ridesharing has the potential to reduce car ownership by 40–60%. This would mean fewer traffic problems and less congestion during peak hours. Moreover, 80% of the surveyed commuters, who are interested in buying their own car, would reconsider if there were ridesharing services that could meet their mobility demands [18]. In addition, [28] further states that there could be a 5–8% reduction in fuel consumption with the implementation of ridesharing. Nevertheless, the findings of [10] show that the growth of carsharing and ridesharing will mainly be at the expense of public transport, indicating that this new mobility form will replace a more sustainable alternative. Thus, it is recommended that public agencies invest in making public transport more attractive, so that the rebound effect is mitigated [10,29].
A study by [30] analyses the energy and climate impact of private bicycles and e-scooters, electric mopeds, and ridesourcing (passengers request car rides in real time from potential providers via a smartphone app). It was found that ridesourcing vehicles and taxis have the highest energy and GHG emission impacts per passenger kilometre of all compared mobility options. However, energy use and GHG emissions depend on several aspects such as ridership characteristics, infrastructure, operational practices, and propulsion technology. Several authors have considered the use of electric vehicles in on-demand mobility service offerings, e.g., [31,32,33,34]. Compared to internal combustion engine vehicles, they indicate that electric vehicles lead to decreased energy use and environmental pollution. Furthermore, extending vehicle life or enhancing capacity will improve environmental performance. This effect can be amplified by significantly increasing the occupancy rate. In this context, the reduction of “empty kilometres”, also known as “deadheading” or “empty runs”, is of great importance.
Overall, the literature shows that shared vehicles bring about several positive aspects for society, such as decreased traffic noise, greater comfort, higher road safety, and improved quality of time during the ride. The most important positive impact on the environment is the reduction of congestion and GHG emissions that comes through a decrease in the number of vehicles on the road and technological advances in the vehicle propulsion [35,36]. In combination with public transport, on-demand mobility services can thus provide sustainable door-to-door transportation [37,38]. However, empirical evidence for supporting these statements is still rare and the so-called rebound effects, such as shifting from more environmentally friendly alternatives to on-demand mobility services, have been largely disregarded [10]. Based on the previous literature review, the authors attempt to address the following identified research needs.
The first research question concerns the effects on ecology and traffic load: is the impact of on-demand collective transport services on the environment to be evaluated positively or negatively overall? How should the effect be operationalised and what does the result depend on? How strongly do factors such as the modal shift of passengers, empty runs, degree of bundling or propulsion system technology have an effect? There are indications and analyses of this, especially from the USA [25]; however, there are no studies in Switzerland, where the proportion of public and non-motorised transport is higher than in a typical city in the USA. The quantification of the demand for vehicles and the vehicle kilometres (VKM) and passenger kilometres (PKM) produced by them is also strongly influenced by the spatial situation, in comparison to the status quo of “traditional” public transport. The increase or avoidance of VKM is an essential assessment criterion for the approval of new mobility offers, especially in urban areas. So what is the effect when larger public transport systems with a high degree of bundling are replaced by smaller systems with a lower degree of bundling? We posit the following hypothesis:
Hypothesis 1 (H1):
we assume that the positive effect of on-demand collective transport services on sustainability in terms of traffic volume and emissions through a modal shift from private transport exceeds the negative effects through cannibalisation of public transport and human-powered mobility.
Moreover, a study by [30] shows that the effective integration of new mobility services with public transport can strengthen the capacity of new mobility and has the potential to substitute for private car ownership. Using on-demand collective transport trips as feeder services for public transport in rural and low-density areas will increase the competitiveness of public transport with respect to car travel [3,30]. The integration of on-demand mobility services into public services results in net energy and GHG emissions reductions if they displace trips that would otherwise occur by car [30]. Reference [18] also suggests that on-demand mobility services can have a significant positive environmental impact as feeder services in rural areas that are not covered by existing public transport services. In these cases, ridesourcing offers replace private car use and thus reduce energy use and GHG emissions. Nevertheless, they also note that public authorities have to ensure that on-demand mobility services do not substitute for more eco-friendly transport alternatives.
Overall, there is a lack of literature on how to integrate on-demand mobility services into public transport in order to achieve the most sustainable solution. Thus, the second research question concerns the requirement to operate on-demand collective transport services in synergy with public transport. In the literature, there is a lack of references on operationalising this aspect. This study focuses on the question of how on-demand services, in conjunction with “mobility hubs” (see also [38]), can better perform a “fine distribution” and provide enhanced access. In the present study, therefore, four conceivable offer variants are defined and calculated. Furthermore, synergy with public transport is linked to specific central stops (so-called hubs) where passengers can change to the train [39]. The authors, therefore, modelled area-based on-demand services as they are currently realistic in Switzerland (real examples are E-Buxi or Kollibri). The current demand for public transport is defined as the target figure. Many simulation studies dealing with ridesharing and pooling, however, focus on the entire mobility market instead of local regular customers of public transport [40]. Accordingly, the present study is not concerned with finding out how many cars would become superfluous if everyone adopted the use of “shared” fleets; rather, the aim is to present small-scale use cases with on-demand mobility services and to analyse how these mobility services can be used to bring people to their next mobility hub, in order to provide better access to areas, especially to those that are difficult to reach. The following hypothesis is formulated for this research question:
Hypothesis 2 (H2):
an expansion of the modal split by supplementing public transport with on-demand collective transport services will only succeed if their services focus on the specific weaknesses of public transport and position themselves as a superior alternative to the taxi or second car.
In addition to analysing the integration of on-demand mobility services into public transport offers and the ecological effects of these services, we are interested in the role of the spatial context (rural vs. urban). Since on-demand mobility services offer high flexibility to their users, the authors of [41] suggest that these services are especially useful in low-density urban areas or small urban centres. However, there are only a few academic articles on the influence of space (urban vs. rural) and density on on-demand mobility services. We contribute to this literature by differentiating between urban and rural spatial contexts when determining the ecological effects of these alternative mobility options. A third research question thus deals with the influence of space (rural vs. urban) on the suitability of on-demand collective transport services. Geographical areas differ in terms of the extent of activities, settlement structures, typical routes and topography. What influence do these spatial parameters have on the ecology of on-demand collective transport services? There is no literature on this subject, as most on-demand services are currently offered in urban areas. Regarding the influence of space, our hypothesis is stated as follows:
Hypothesis 3 (H3):
we expect that due to the strong market position of public transport in urban areas with high numbers of passengers and high bundling rates, an increase in on-demand collective transport services will have a negative impact on sustainability compared to the situation in rural areas where the market position of public transport is weak in terms of numbers of passengers and bundling rates.
The calculations of the present study are based on a sustainability simulation model that can distinguish between different types of space and on-demand collective transport services. The input data for the sustainability simulation are taken from the literature as well as empirical data from pilot projects.
On-demand collective transport services are currently facing financial challenges. In particular, mobility providers not supported by the government are facing challenges in the current coronavirus disease 2019 (COVID-19) crisis. The study thus aims to contribute to the evidence-based discussion on flexible forms of operation and to enable a more differentiated view of the opportunities and risks from a traffic-oriented and ecological perspective.

3. Materials and Methods

To answer the research questions, several service options in two different example regions are outlined. The effects of the service options are estimated using a sustainability simulation model with suitable simplifying assumptions.

3.1. Analysis Approach

A sustainability simulation model based on Excel was used for the model calculations. For the model calculations, relevant output factors were identified (see Figure 1). A differentiated analysis of these effects within different service options or spatial conditions was conducted using the corresponding input factors.
Using the sustainability simulation model, the energy consumption was calculated according to the means of transport used, the degree of capacity utilisation and the vehicle kilometres driven. To determine “Traffic Volume” and “CO2 Emissions”, the following formulas, which are following the model for the calculation of CO2 emissions from the Ministry of Regional Development and Transport [42], are used in the model:
Y i = passenger   trips   total modal   share   oD average   travel   distance 1 + empty   run   rate   oD occupancy   rate   oD bundling   rate   oD
where Yi is the number of vehicle kilometres driven by on-demand service option i.
V i = distribution   peak   demand   oD ( 1 empty   run   rate   oD average   travel   time 60
where Vi is the number of vehicles required by on-demand service option i.
Z i =   g C O 2 equ   per   VKM   oD   Y i g C O 2 equ   per   VKM   M n
where Zi is the ecobalance by on-demand service option i. Yi is the number of vehicle kilometres driven by on-demand service option i, and Mn is the number of shifted vehicle kilometres by other modes of transport. The gCO2equ per VKM is depending on the type of vehicle, the share of electric-driven fleet and the share of renewable energy (gCO2equ = grams of carbon dioxide equivalent).

3.2. Service Options

On-demand collective transport services are taxi-like services that passengers can book via an application. As previously mentioned, different types of on-demand collective transport services were simulated. The service options largely correspond to approaches found in practice, as currently discussed, or already tested in Europe and overseas see, e.g., [43,44,45,46].
  • Service Option 1: on-demand line operation: the first service option is a mixture of a public transport and an on-demand collective transport service. The concept is strongly based on existing public bus routes. With minibuses, passengers are taken to virtual stops at major road junctions near the customer’s address (we assumed that such a virtual stop is about 250 m from the front door). Furthermore, the minibus does not follow a rigid timetable, particularly in off-peak hours, but can be ordered at short notice via an app at any time. The aim of this application is to continue to offer journeys that coordinate with the public transport timetable, especially with train connections. In contrast to Service Options 2–4, only the under-used bus routes are made more flexible. The vehicles used are large eight-seater all-purpose vehicles.
  • Service Option 2: on-demand collective transport service at off-peak and marginal times as a public transport supplement: the second service option is based on an on-demand collective transport system that is intended to supplement public transport at off-peak times. With an on-demand service, the operating times that are currently poorly served by public transport (for example, in off-peak hours) would become more attractive. A comfort surcharge of 2 Swiss francs (CHF) per trip is added to the public transport fare. The service is offered door to door or via virtual stops from a certain mobility hub and only for a defined service area. Standard four-seater all-purpose vehicles are used.
  • Service Option 3: on-demand collective transport service as a public transport replacement with integration into public transport pricing: analogous to Service Option 2, Service Option 3 replaces the public transport bus with an on-demand collective transport service. In this case, however, the fare system is fully integrated into the public transport fare system. The use of the on-demand collective transport service is thus as costly as taking the suburban railway or train, and any public transport season ticket is accepted for use. The vehicles used are large eight-seater all-purpose vehicles.
  • Service Option 4: commercial on-demand (collective) transport service with own fares: in contrast to Service Option 3, the on-demand driving service in this service option requires a market-based tariff. The offer is thus not integrated into the public transport system and is in competition with the existing public transport offer. There are no defaults for the fares, nor is there any restriction of connections with existing public transport or service areas. It is thus left to the commercial provider to decide where, with how many vehicles and whether they are electric or conventional, and at what price they want to offer their services. In contrast to Service Options 1–3, this does not have to be a collective transport (pooling); this means that the pooling of separate, similar travel requests is only partially carried out. Standard four-seater all-purpose vehicles are used.
Table 1 presents a comparison of the different service options.

3.3. Spatial Comparison

In order to investigate whether on-demand mobility services have different ecological effects in different types of space, a rural and an urban area were considered. Given the spatial characteristics of the two localities, Glarus South was taken as a rural example and Basel-St. Johann as an urban example [47].
(A) Rural area: Glarus South: the public transport system in the rural area of Glarus South mainly consists of one railway line and a wide-ranging bus service, which both run at 30–60-min intervals. The calculated demand corresponds to the current boarding and alighting data, as well as the load plots of the bus and suburban railroad lines, from 2017. Glarus South has an area of 430 km2 with 9494 inhabitants in total, which yields a population density of 22 people per km2. The number of workplaces per km2 is 1.87. Of all the cantons in Switzerland, Glarus has the highest share of motorised private transport (MPT), at 71%. Public transport accounts for 21%, followed by slow transport (non-motorised transport) (6%) [48]. According to the [49], the number of trips in Glarus, which has a density of fewer than 0.25 inhabitants and workplaces per hectare, is 3.1 per day per inhabitant and workplace. The simplified assumption was made that all trips occur within the study region. The number of trips in Glarus South was calculated to be 32,000 per day for all inhabitants and workers, as follows: (9581 inhabitants + 806 workplaces) × 3.1 (number of trips per day) ≈ 32,000 (of which 6700 by public transport). These values were based on the territorial principle; i.e., only the distances covered on the territory of an agglomeration were considered, regardless of whether these distances were covered by the agglomeration population or by others.
(B) Urban area: Basel-St. Johann: one of Basel’s six railway stations is located in the district; this is operated by the Swiss Federal Railways (SBB) and trains from here to Basel SBB or Mulhouse every half hour. The district is, for the most part, well connected to the city’s tram and public transport network, which consists of several suburban railway and bus lines. Basel-St. Johann is an urban district located in the heavily industrialised north of Basel. With an area of 2.24 km2 and a population of 18,700, it has a relatively high population density of about 8300 people per km2. The number of workplaces per km2 is 10,241. In Basel-St. Johann, with a density of 185.8 inhabitants and workplaces per hectare, the number of trips per day per inhabitant and workplace is 3.5 [49]. Again, it was assumed that all trips take place within the study region. Since no detailed traffic data was available for Basel-St. Johann, the number of passenger trips was estimated based on the generated routes and structural data (inhabitants and working places). In Basel-St. Johann, based on the territorial principle, it was calculated that around 146,000 trips per day for all inhabitants and workers are made. This was calculated as follows: (18,684 inhabitants + 22,939 workplaces) × 3.5 (number of trips per day) ≈ 146,000. Of these, around 44,000 passenger trips per day are made by public transport (30%), 15,000 by slow transport (11%) and 65,000 by motorised private transport (58%) [48].
Table 2 presents a comparison of the most important differences between the two example localities.

3.4. Key Input Factors and Assumptions for the Four Service Options

The following sections describe the assumptions made about the key input variables required for the model calculations.

3.4.1. Operational Input Variables

To calculate the effects of on-demand collective transport services on the sustainability dimension, the following additional operational assumptions were adapted from [40] who refer to other studies, e.g., [13,50] as well as data from the Federal Statistical Office and the Federal Office for Spatial Development:
  • Used vehicles: two general categories of vehicles were considered in this study. A standard four-seater all-purpose vehicle as a mid-range car (example: Volkswagen Golf) was used for the public transport supplement (Service Option 2) and commercial on-demand offer (Service Option 4). For the on-demand line operation (Service Option 1) and public transport replacement (Service Option 3), a large 8-seater all-purpose vehicle (example: VW Multivan) was used.
  • Average occupancy without empty runs: the average occupancy rate was calculated by dividing the average number of passengers in the vehicle by the number of seats. The values for the average number of passengers per vehicle was adapted from [40], and was set in relation to the vehicle size. This resulted in the following calculations: 2.6/8 = 0.325, 2.4/4 = 0.6, 2.6/8 = 0.325, and 1.6/4 = 0.4. It can be critically noted that due to the lack of empirical data, we did not assume any differences in the occupancy rate of on-demand vehicles between rural and urban areas [40].
  • Percentage of empty runs: as in [40], based on [13,50], we also assumed that the percentage of empty runs was 8% for urban and 15% for rural areas.
An overview over the operational central input variables per service option and study region is given in Table 3.

3.4.2. Spatial Input Variables

Reference [51] found in their study that CO2 emissions from residential and passenger transport are related to the spatial characteristics of a region. Reference [52] explains that spatial characteristics determine the travel distances and speed, which in turn affect fuel consumption, energy use and air pollution. In this paper, the following spatial differences for the simulation of the sustainability dimensions were included:
  • Travel distances: travel distances vary widely between urban and rural areas. In Glarus, they are more than twice as far as in Basel. On the one hand, this leads to a higher traffic volume per inhabitant and a higher number of VKM in the countryside than in the city. On the other hand, longer travel distances with on-demand systems lead to a higher proportion of empty runs. Table 4 shows the travel distances used in the model per service option and spatial context.
  • Speed: another difference between urban and rural regions concerns speed. The lower the average speed at which a vehicle travels during a journey, the more vehicles must be deployed to serve a certain demand. In cities, the lower average speed means that proportionally more vehicles are needed than in the countryside. For Service Options 1, 3, and 4, the same average speeds were used within the respective regions: 31.3 km/h for Glarus South and 20.6 km/h for Basel-St. Johann. Furthermore, for Service Option 2, we used 32.2 km/h for Glarus South and 21.9 km/h for Basel-St. Johann. The speeds for Service Option 2 speeds were slightly higher as this service option serves off-peak hours, during which time vehicles tend to be travel faster.
  • Modal shift: the modal shift describes the percentage of new journeys generated by an on-demand collective transport service that substitute other modes of transport. If an on-demand service option attracts passengers from less sustainable transport, the effect on sustainability is more positive than if the customers come from, for example, non-motorised transport. If public transport is completely replaced, it is assumed in a simplified way that all public transport journeys switch to the on-demand services. A factor for induced trips was derived from the findings from domestic and international on-demand (collective) transport services e.g., [53,54]. The modal shift was based on the following assumptions as shown in Figure 2. First, it was assumed that in Service Option 1, hardly any trips could be gained from motorised private transport (MPT), because it does not offer door-to-door operations. Instead, around 90% of the generated trips in Service Option 1 stem from passengers that switch from public transport (train, tram, bus) to this new on-demand mobility service. Second, for Service Option 2, the modal shift was based on existing studies from abroad, e.g., [54,55,56,57]. A considerable proportion of the trips that supplement public transport are likely to come from taxis since on-demand driving services offer a cost-effective alternative. Although on-demand services in this option supplement public transport, the cannibalisation of public transport is apparent, but lowest for Service Option 2 compared to all other options. Third, in Service Option 3, the majority of the generated trips (around 60%) are former public transport trips since the conventional public transport service is replaced. An increase in attractiveness is created by the door-to-door connection, which is why former car and taxi rides are also substituted. Fourth, Service Option 4 is a commercial offer, which deliberately seeks to attract MPT drivers as well. The share of people switching from MPT to Service Option 4 is the highest in comparison of all options. The share of people stemming from MPT, train and tram, bus, as well as taxi, is roughly balanced. The modal shift corresponds to studies from Switzerland and abroad e.g., [54,55,56,57]. Fifth, the modal shift was not differentiated by spatial context due to a lack of data. To calculate the sustainable effects of on-demand collective transport services, the following modal shifts (shown in Figure 2) as explained above were made.
Table 4. Spatial central input variables per service option and study region (source: own illustration).
Service OptionTravel Distances 4
Glarus SouthBasel St. Johann
1 On-demand line operation10.5 km 53.5 km 6
2 On-demand public transport supplement11 km4 km
3 On-demand public transport replacement11 km4 km
4 Commercial on-demand15 km 77 km 8
4 In all service options, 500 m was added for the door-to-door connection. 5 Average distance based on possible travel routes in the study area. 6 Average distance for trips using local public transport, according to [58]. 7 Average distance for trips using MPT, according to [58]. 8 Average distance for trips in taxis, according to [58].
4.
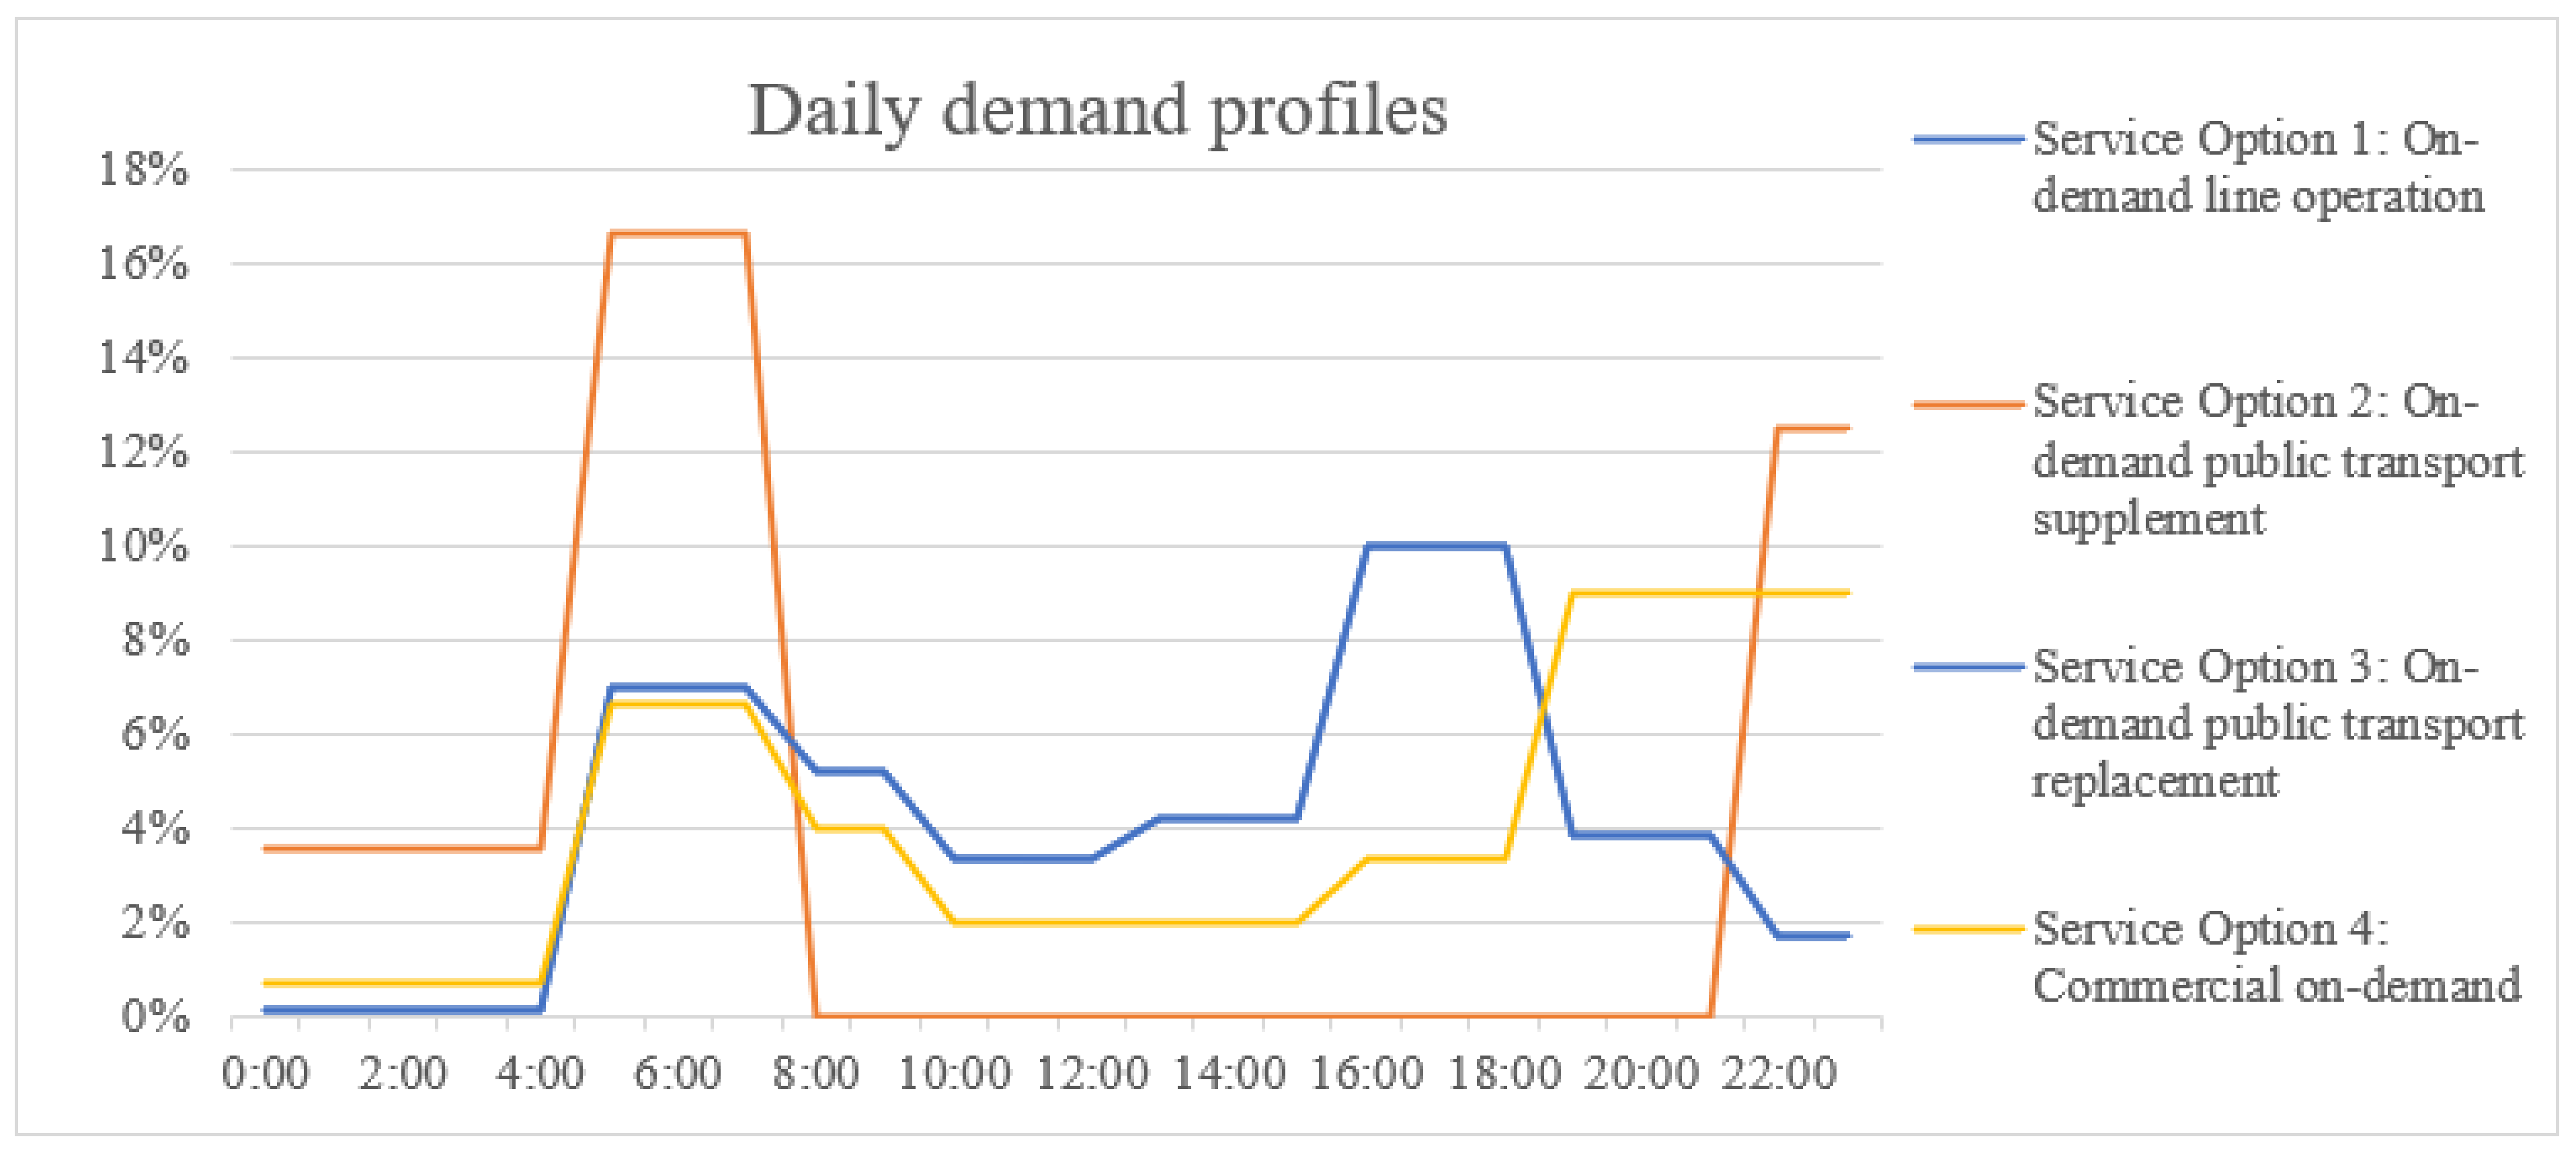
Daily demand profile: depending on the service option, different assumptions were made for the daily flow of traffic. First, if on-demand collective transport services replace public transport, a typical public transport daily flow of traffic, according to the mobility survey (Mobility and Transport Microcensus) conducted every five years by the Swiss Federal Statistical Office see [59], was used (Service Options 1 and 3). Second, if on-demand services are only offered during off-peak hours, the daily flow of traffic was adjusted to off-peak hours. Third, investigations of on-demand collective transport services in Switzerland and abroad show an atypical course of daily walking compared to other means of transport, e.g., [27], but only if they are used commercially in competition with a public transport offer (see Service Option 4). The daily demand profile (as shown in Figure 3) influences the number of vehicles required and thus the volume of traffic during peak hours.

3.4.3. Environmental Input Variables

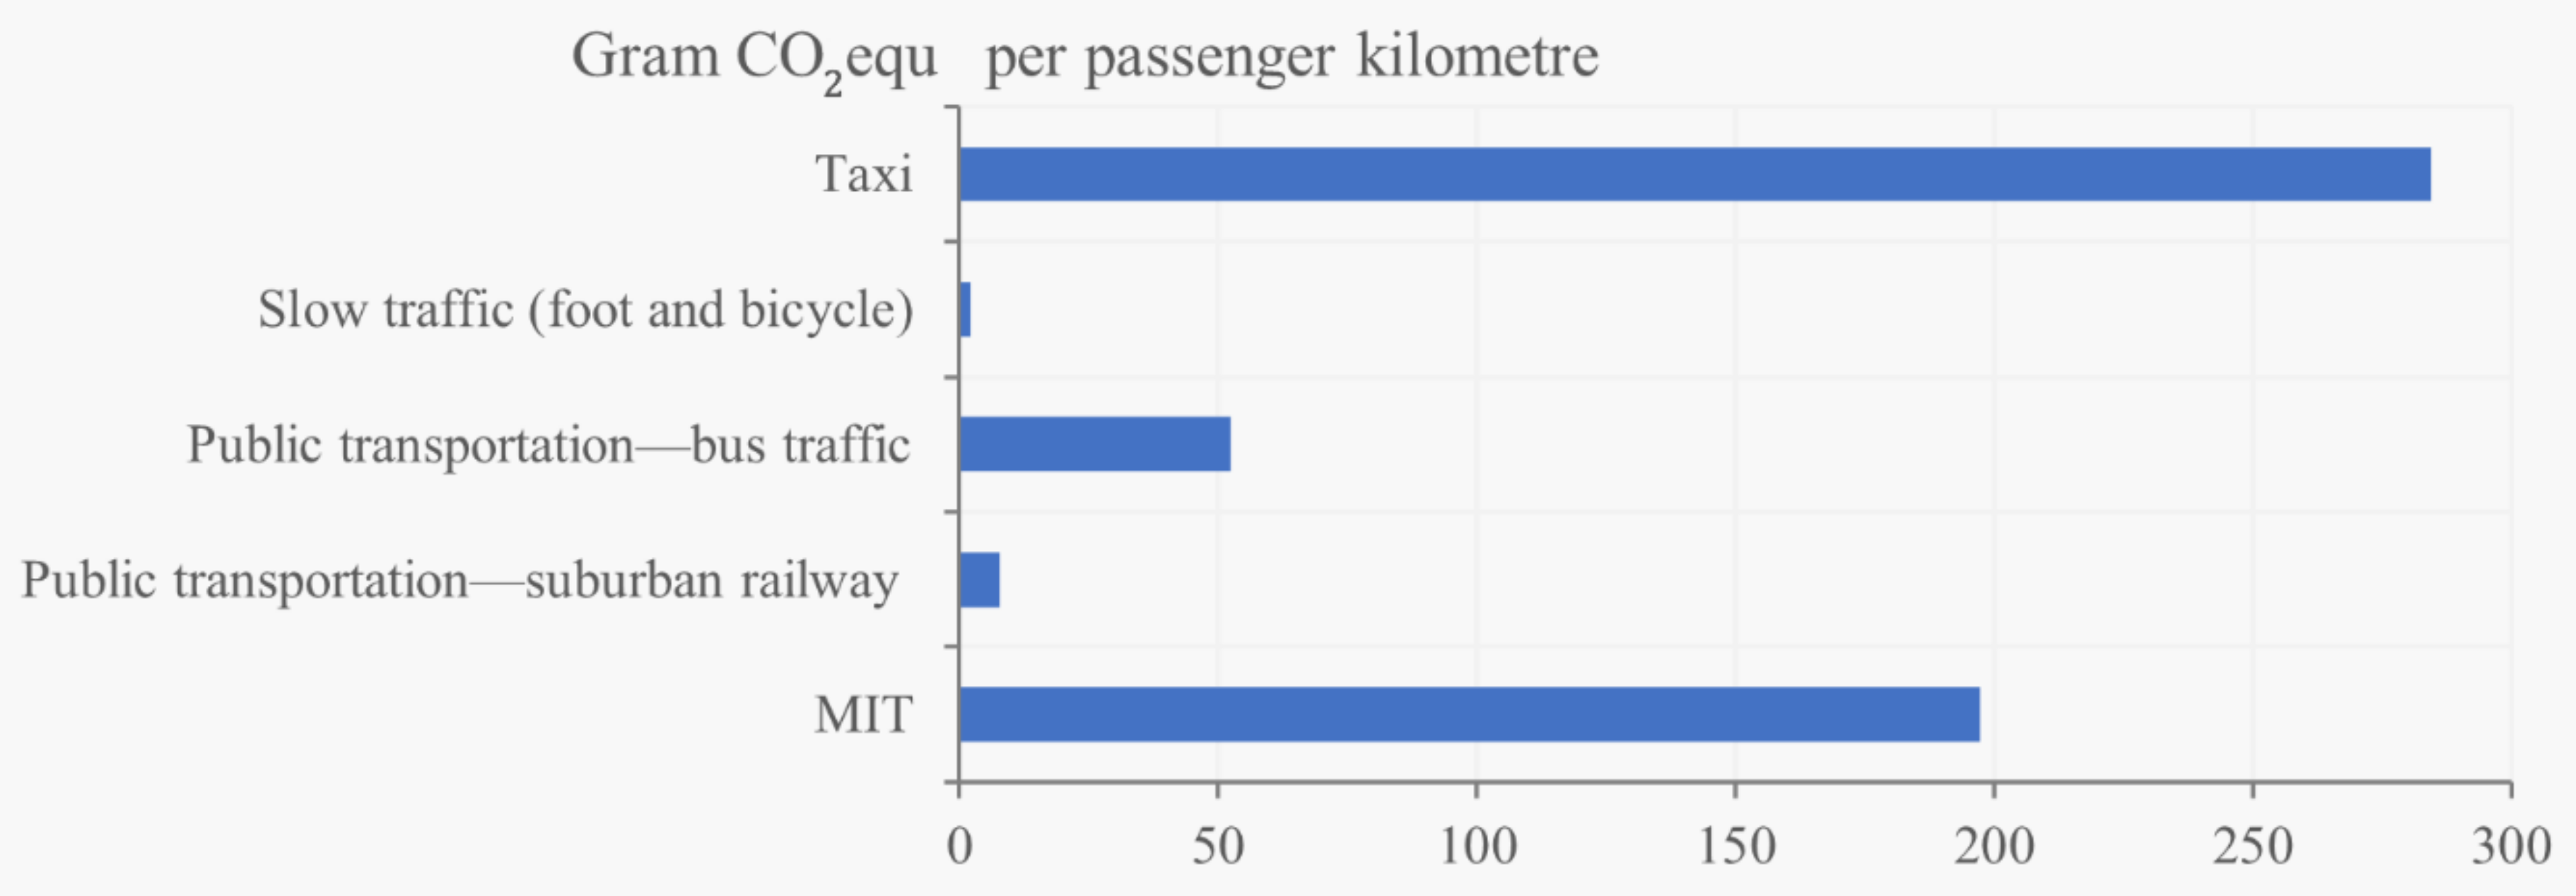
In order to calculate the ecological effects, market-average CO2 emission values in gCO2equ/PKM from the Swiss platform for mobility management tools (www.mobitool.ch) and processed environmental data were used for each means of transport:
  • Grams of CO2equ per passenger kilometre: the values take into account the fuel and electricity consumption per VKM, the use of the means of transport and the drive technology. The current Swiss electricity mix is stored for electrically powered vehicles [60].
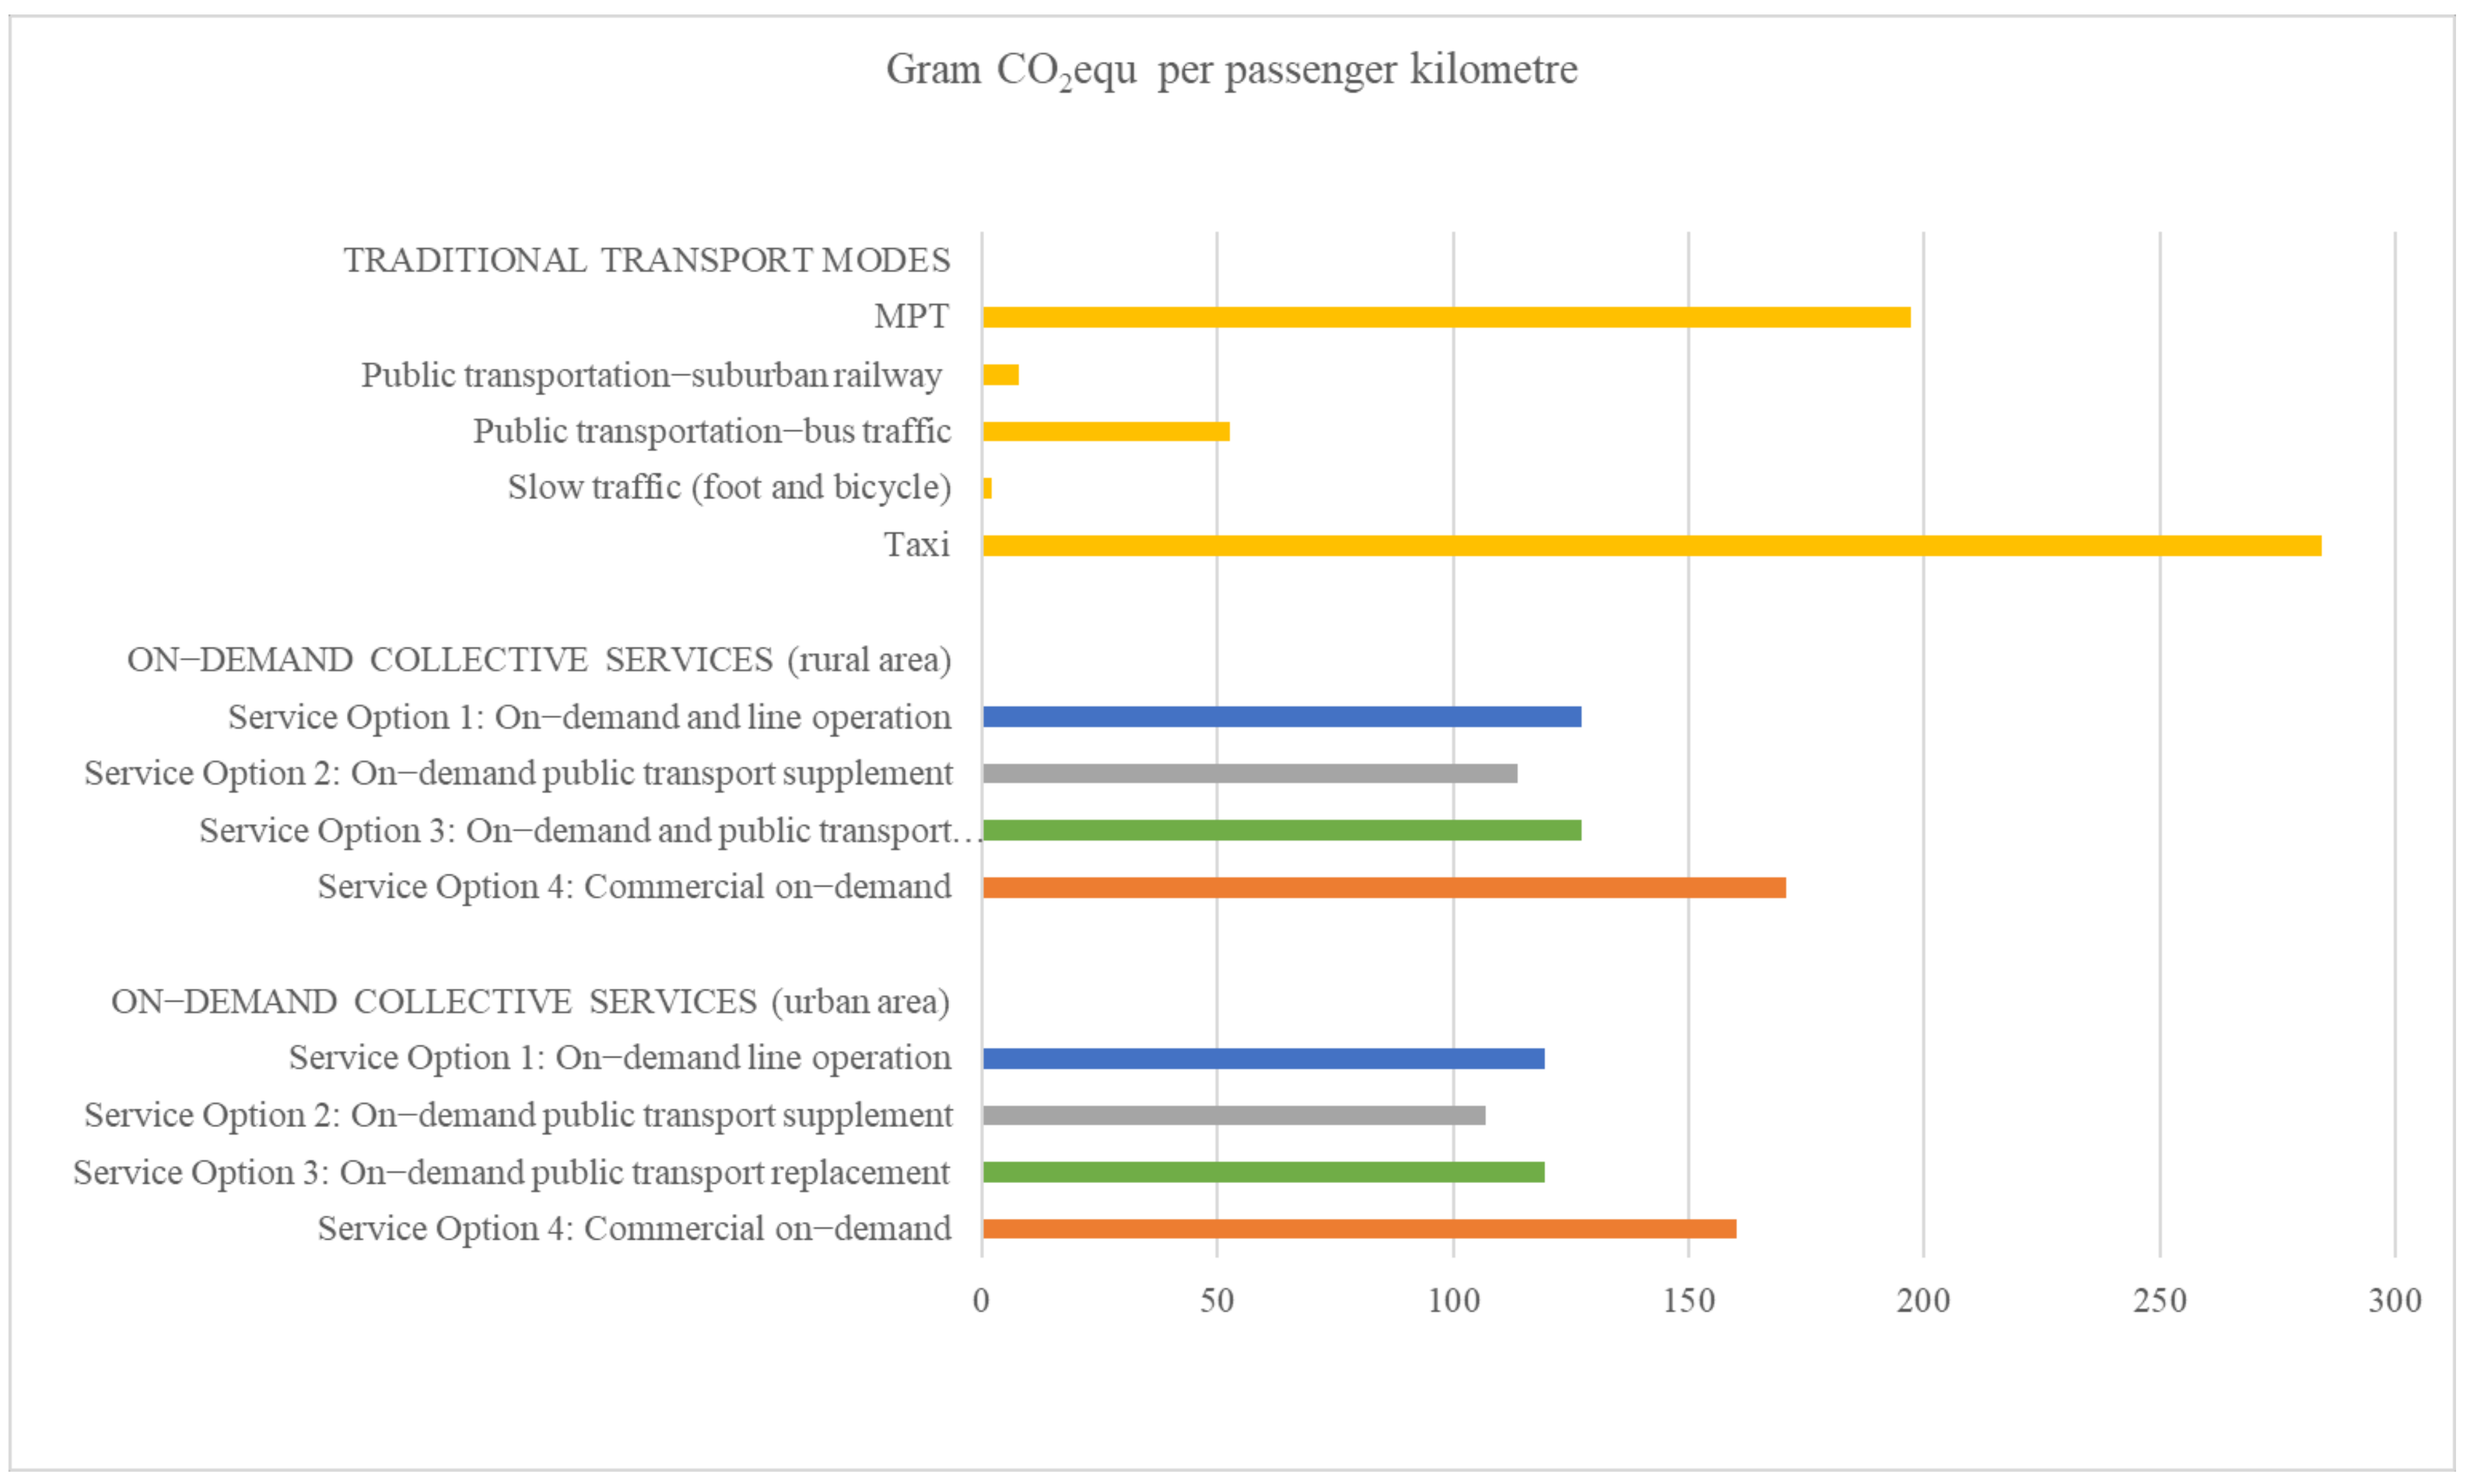
Figure 4 shows the ecological effects for each means of transport.
2.
Assumptions for on-demand collective services: since no values are stored in the mobitool for on-demand collective driving services, it was assumed that the driving services in Service Options 2 and 4 (standard vehicles) consume the same amount of energy per vehicle kilometre as a private car. For Service Options 1 and 3 (both eight-seater vans) a 50% and 20%, respectively, higher consumption per vehicle kilometre was used, based on the stored vehicle sizes in mobitool. Furthermore, it was assumed that on-demand vehicles included a higher proportion of electric vehicles (25%) and that the average use, at least in Service Options 1–3, is higher than that of a car with 1.6 passengers. Emissions per PKM are negatively influenced by the additional empty kilometres. To calculate CO2 emissions of electric vehicles, the current Swiss electricity mix was used [60].

3.4.4. Market Potential in the Study Area

Since demand effects can only be modelled with various assumptions and an existing traffic model, we expected different modal split shares of on-demand collective transport services in all service options would be a simplification. The assumptions for modal split define the transport service provided (in passenger kilometres) and are of central importance for the transport-oriented and ecological effects of on-demand services in relation to the transport system. The market potential thus has no influence on the impact per passenger kilometre. However, it puts the four service options into an overall context, based on the spatial region, in order to answer the question of what impact on-demand services have on the overall traffic volume and emissions. The assumptions made for the demand potential are described below.
Modal split: the share of on-demand collective driving services on the modal split shows the demand potential. The share of the modal split of the new on-demand collective transport services (see Table 5) was derived from the current modal splits in the respective areas of investigation.

4. Results

In the following sections, the traffic-oriented and ecological effects calculated using the sustainability simulation model are shown for the different service options in different spatial contexts. The model calculations were based on the assumptions made and show tendencies regarding how different service options of on-demand collective transport services in different spatial contexts could affect the traffic volume and emissions. In order to better validate the results, the key input factors were examined in the follow-up for each case on the basis of sensitivity analyses for robustness.

4.1. Traffic Volume

In all service options and in both spatial contexts, additional road traffic is a consequence of the on-demand collective transport services. On the one hand, there is additional traffic because, according to the model assumptions, a considerable proportion of users in all service options switch from public or non-motorised transport to the on-demand collective transport services. This ultimately leads to additional vehicle kilometres on the road. On the other hand, this effect is due to the low occupancy rate of on-demand collective services caused by a low degree of bundling of trips and a high proportion of empty kilometres. Furthermore, induced traffic is also generated, which leads to higher traffic performance and expenditure.
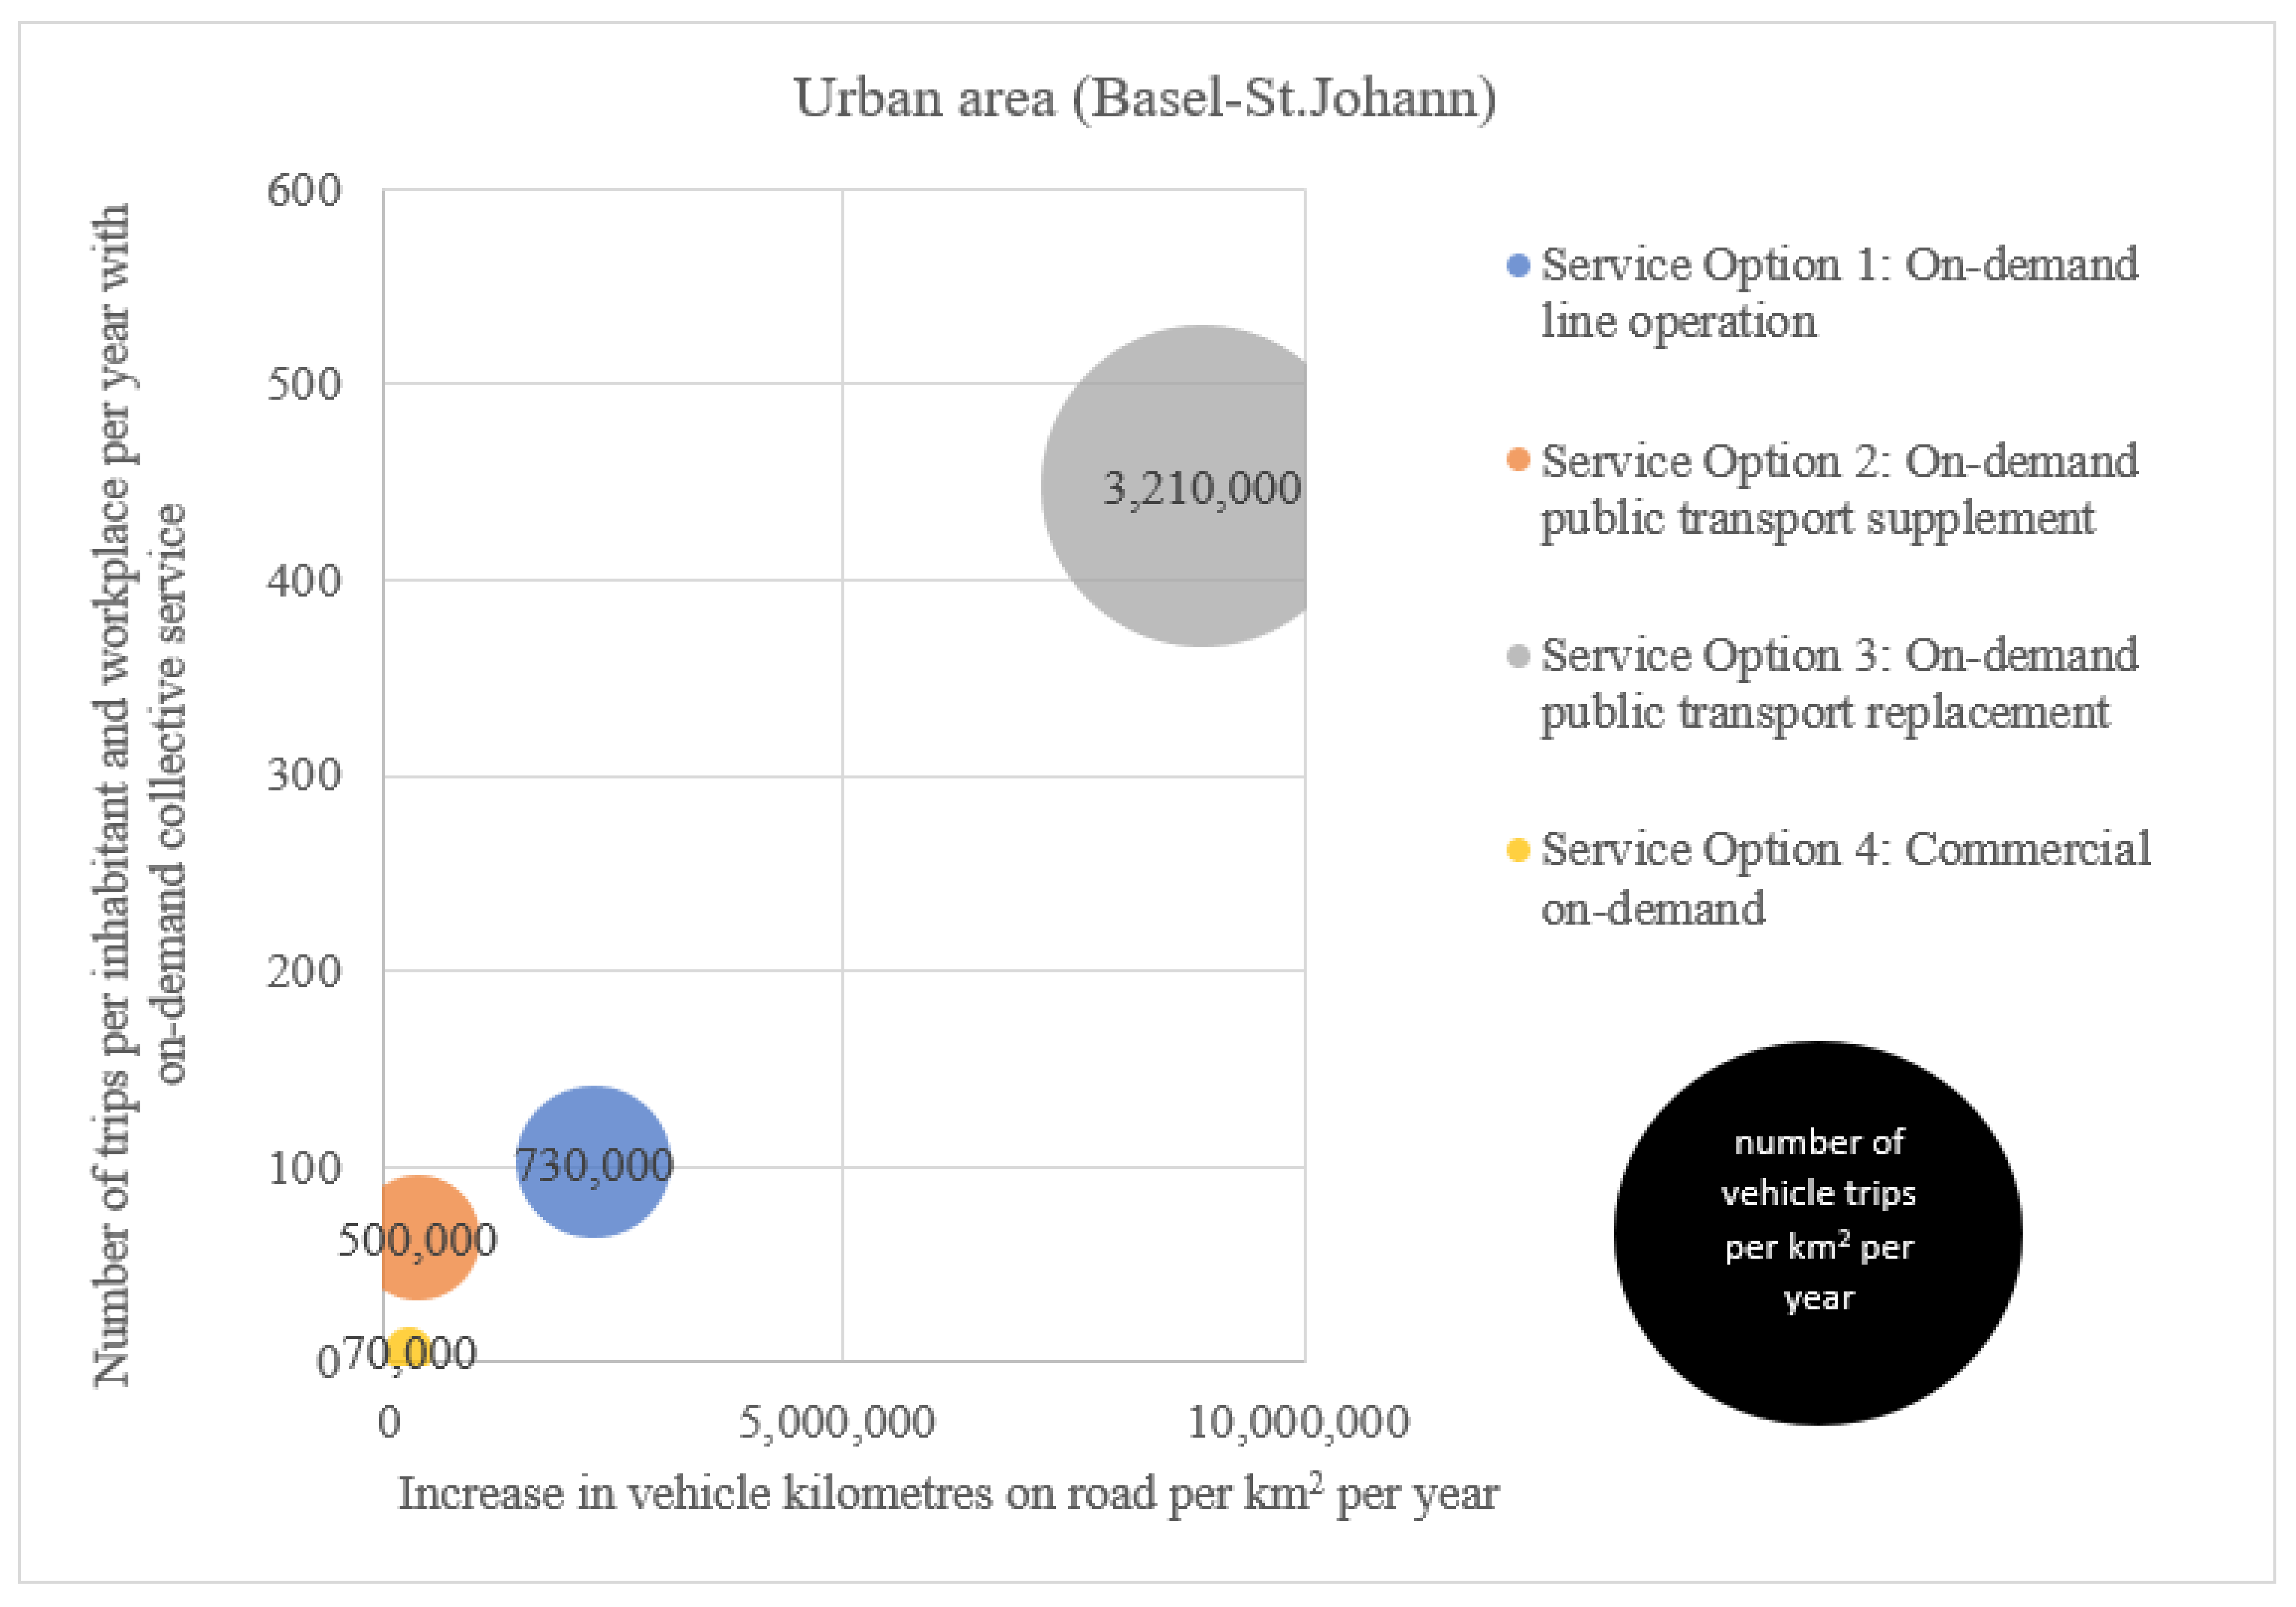
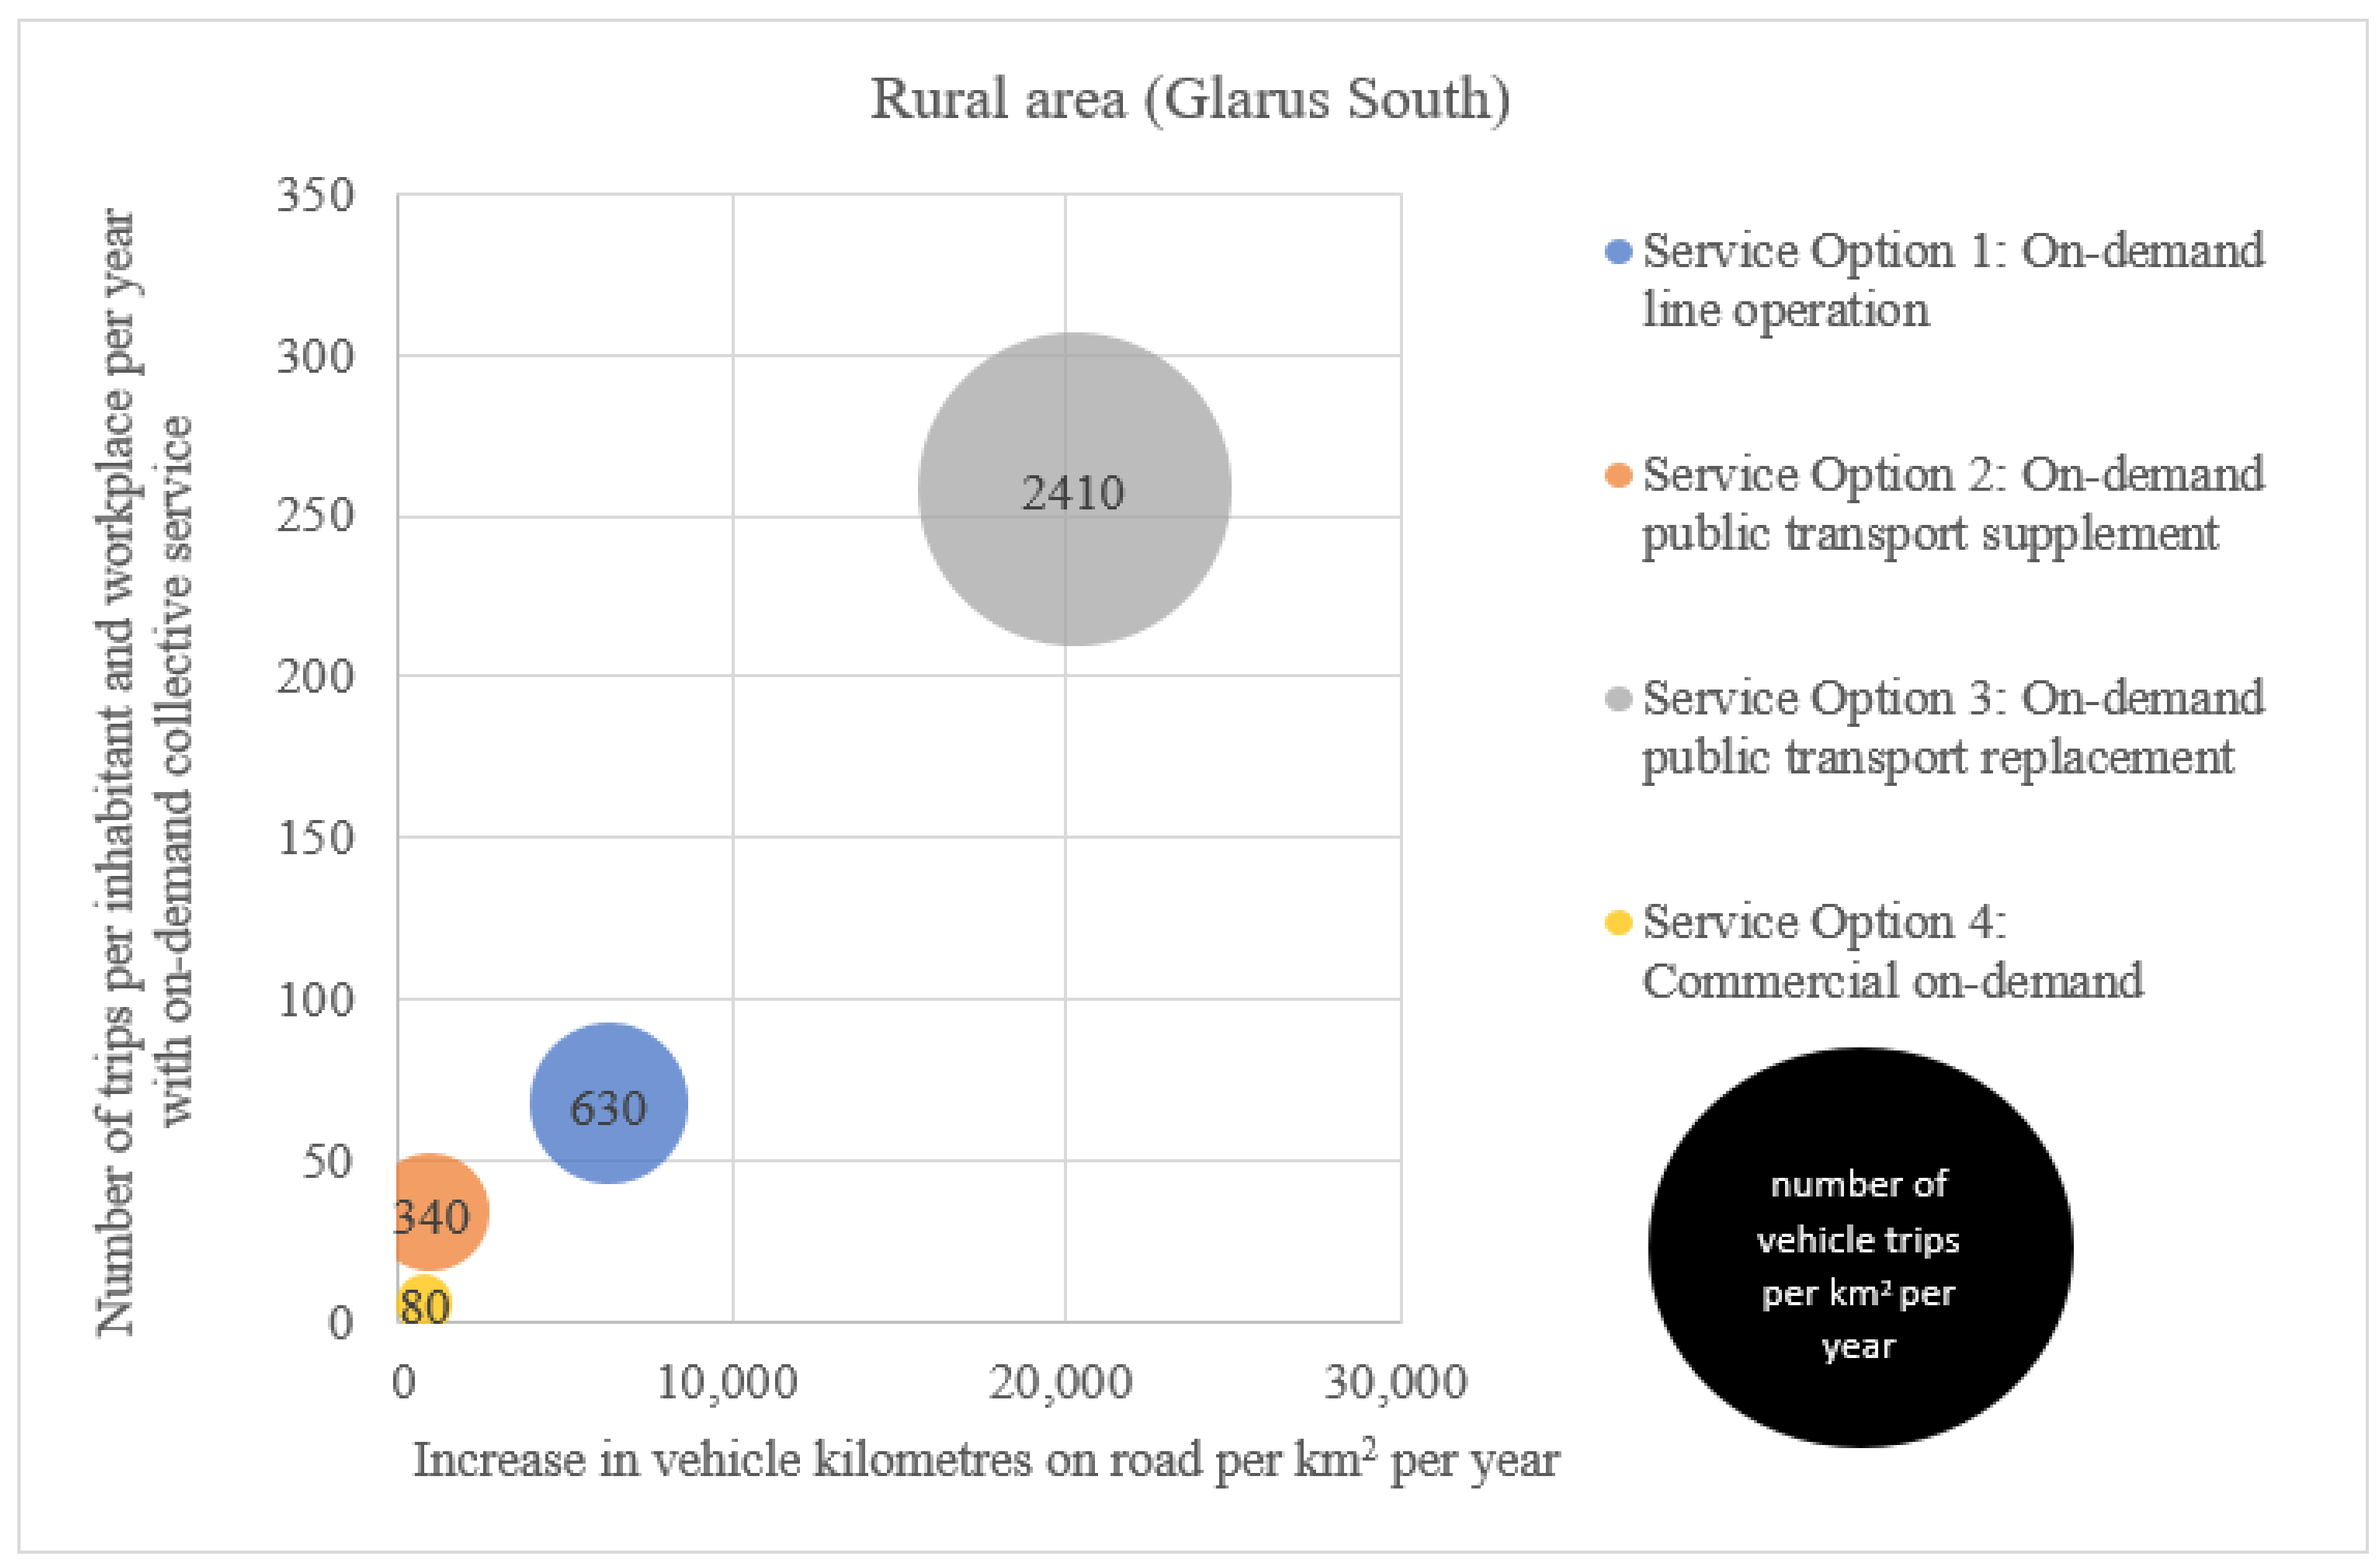
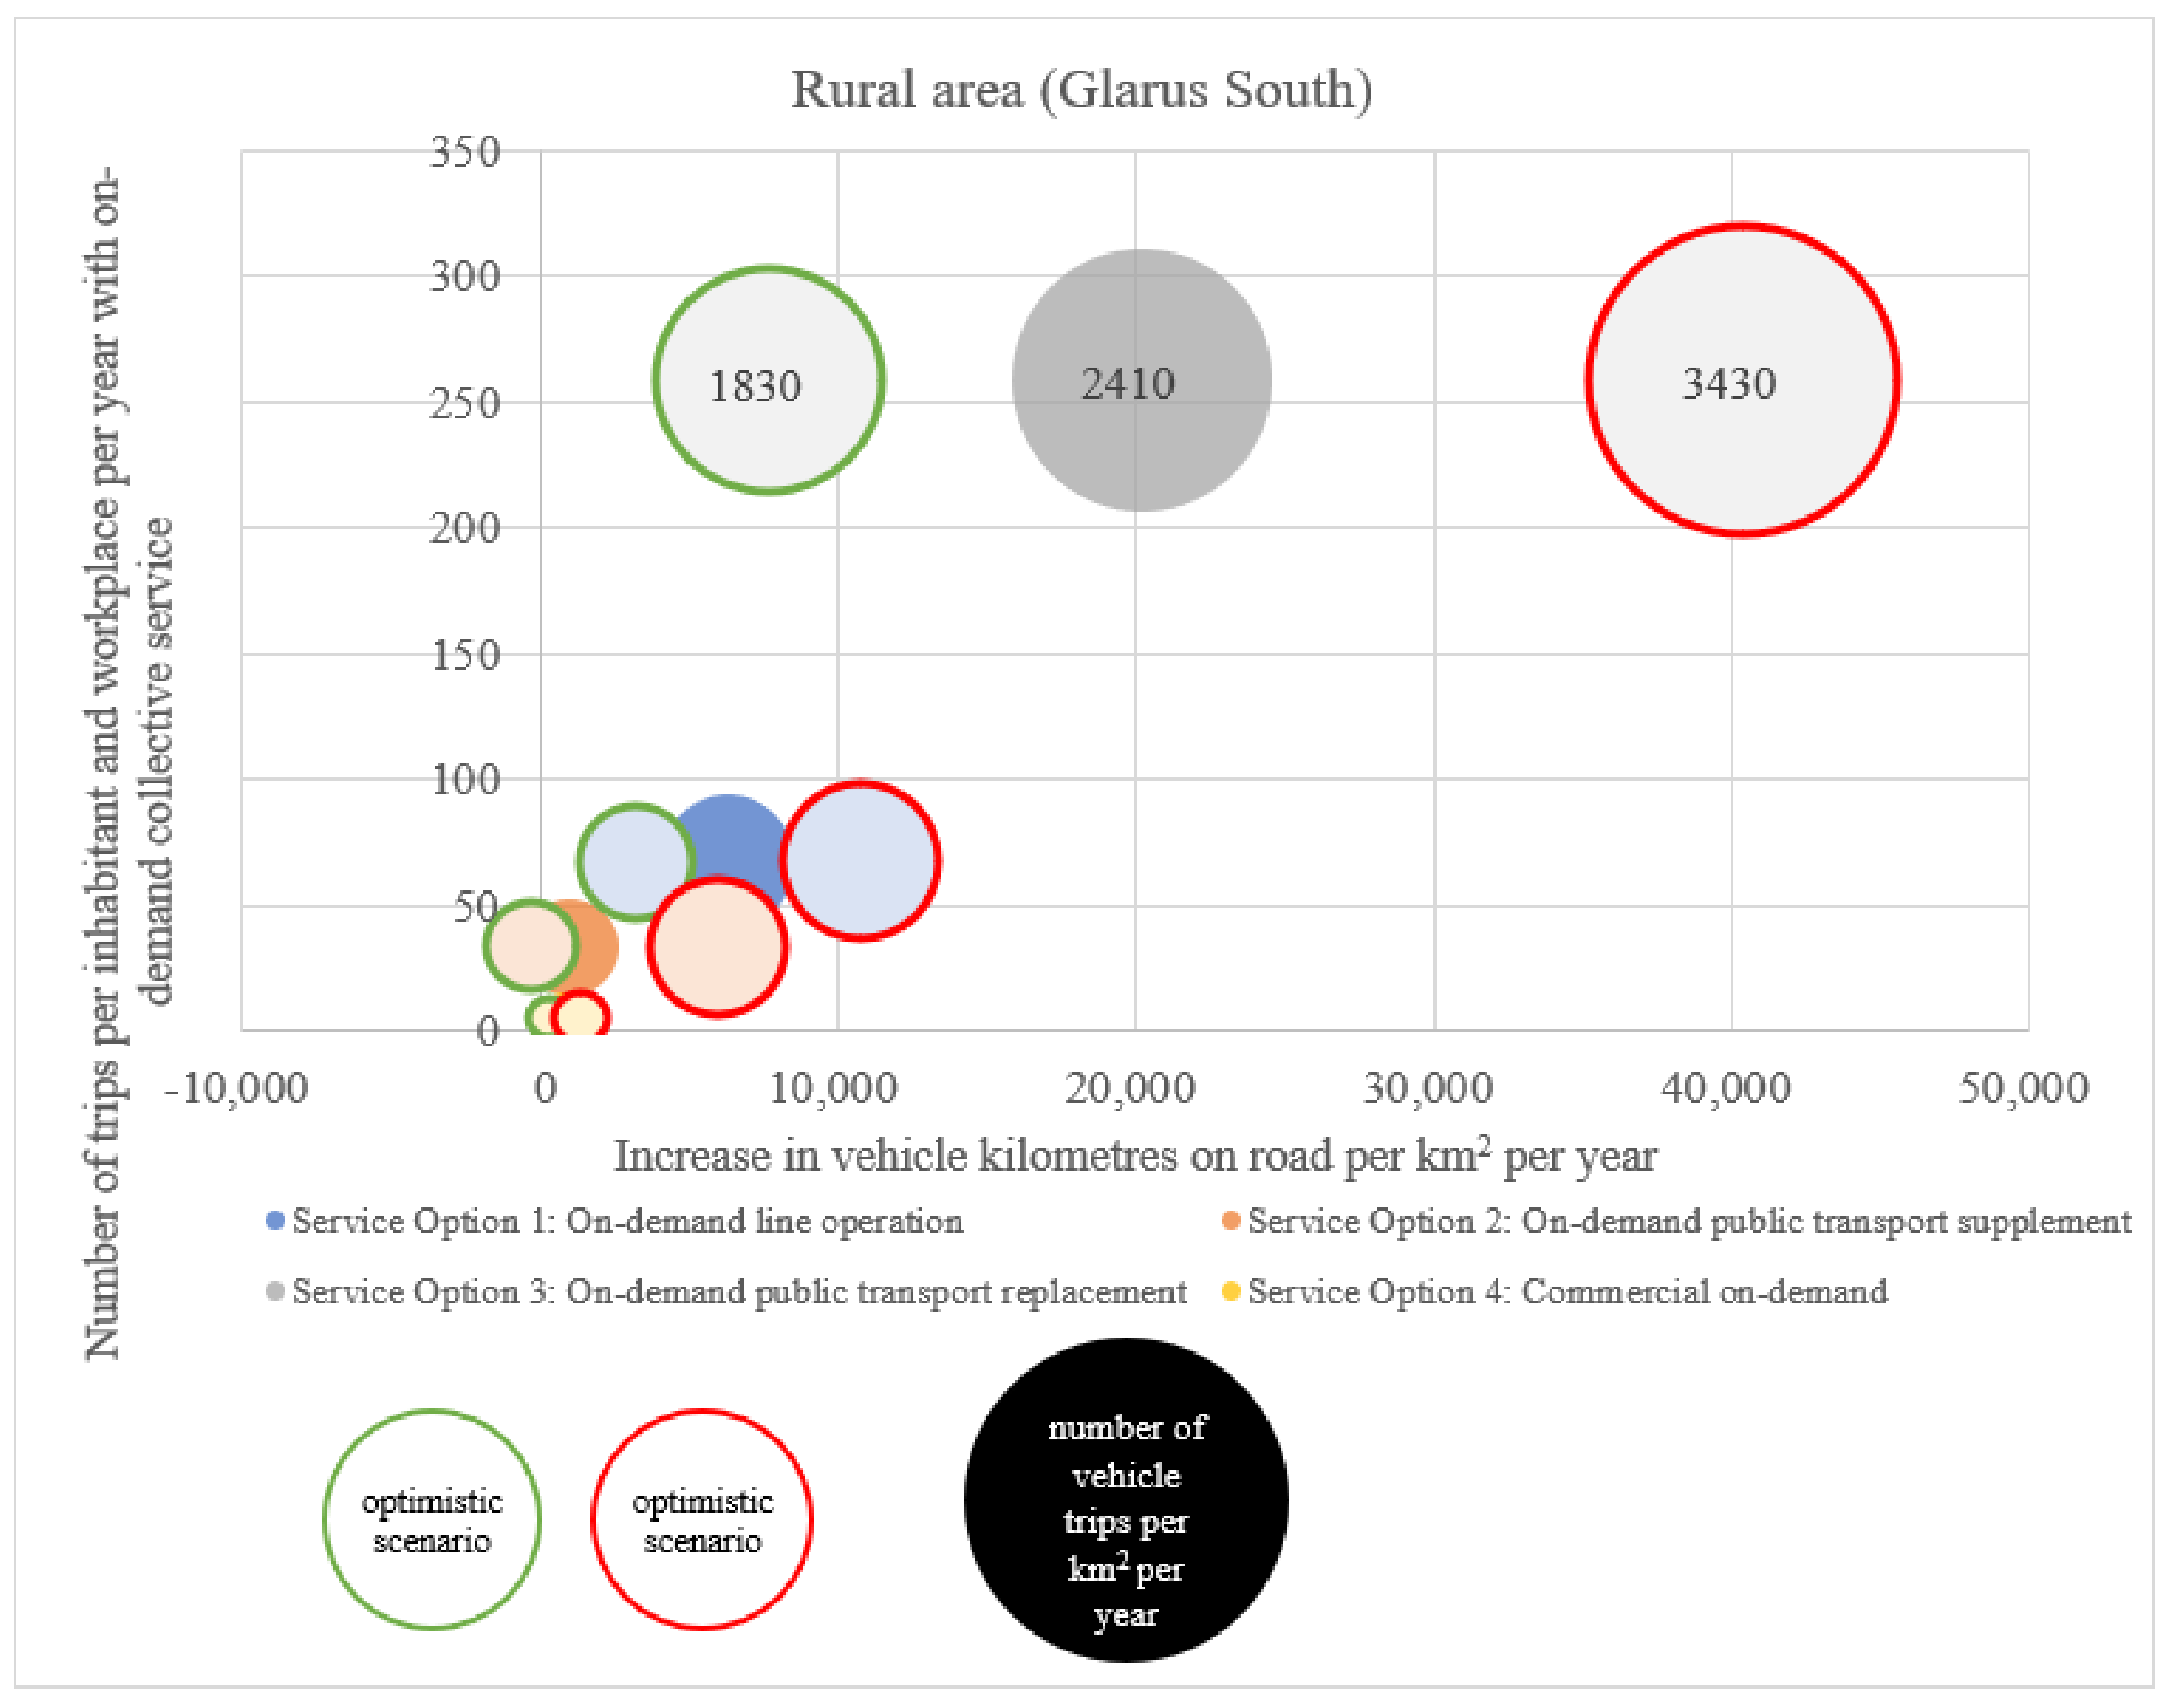
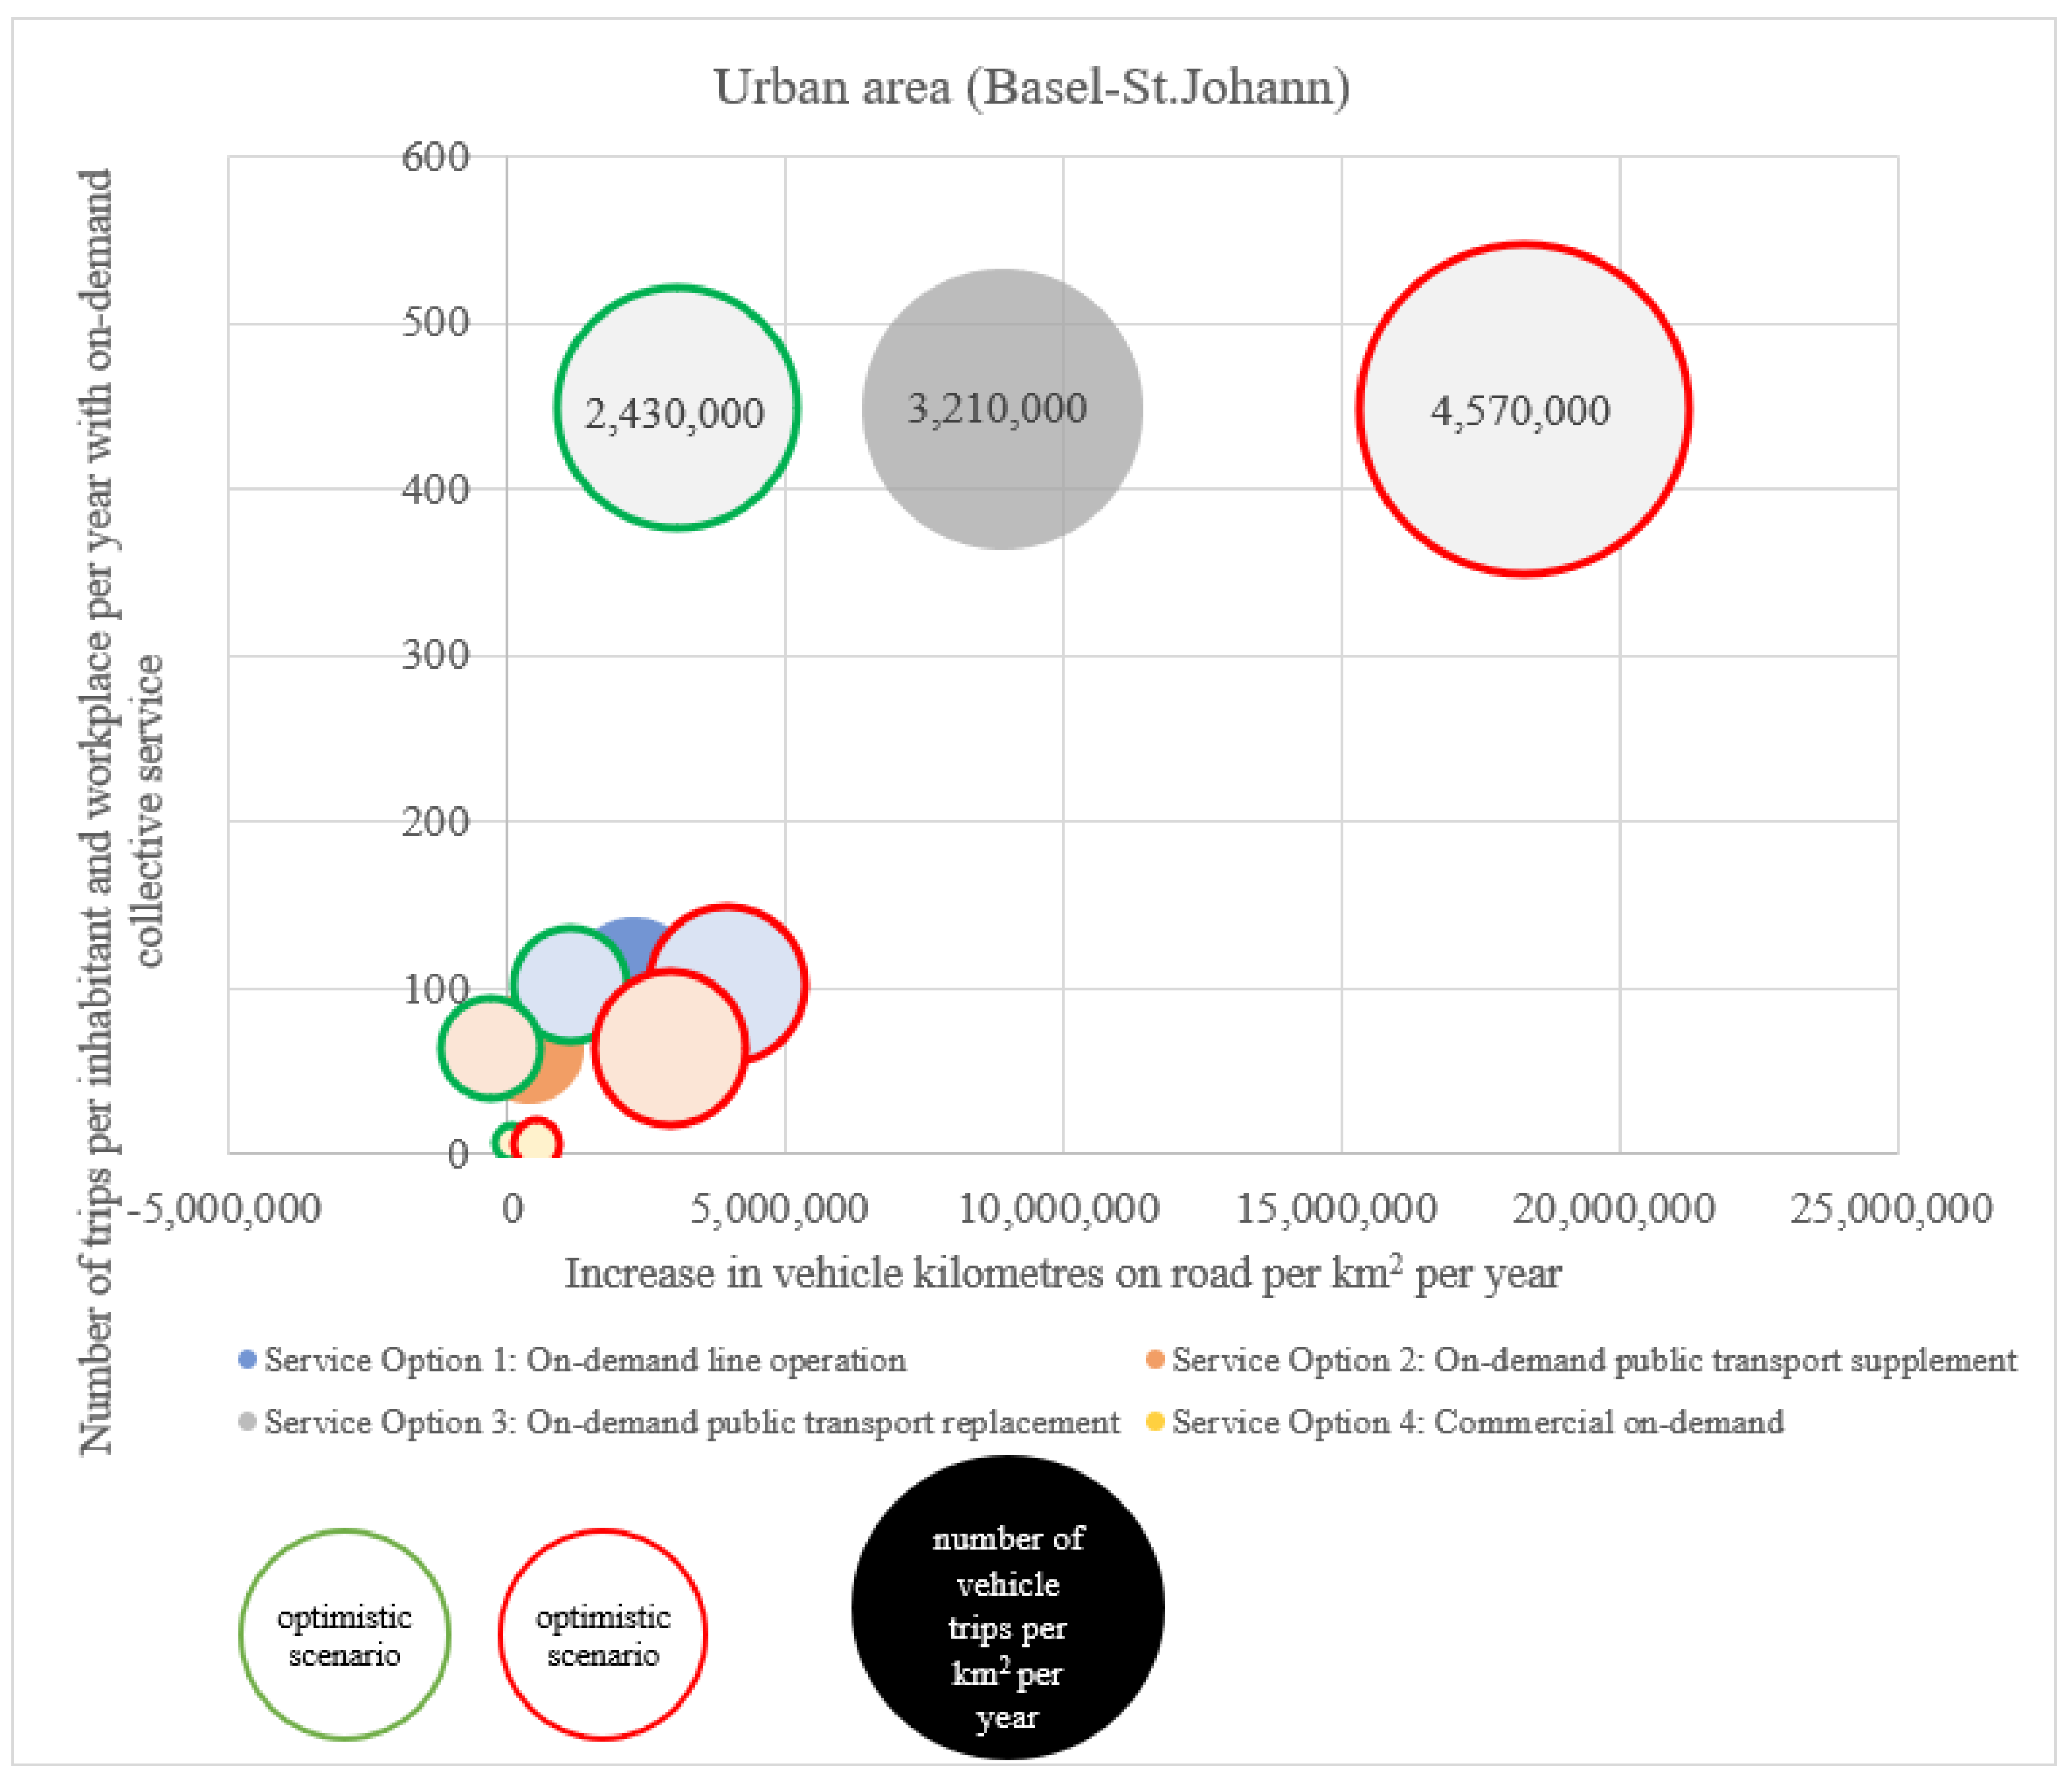
The following two figures (Figure 5 and Figure 6) show the additional vehicle kilometres generated on the road (x-axis) and the number of trips per inhabitant and workplace per year (y-axis) by using on-demand collective transport services. The increase in vehicle kilometres on the road results from the generated vehicle kilometres driven with the new on-demand collective transport services minus the vehicle kilometres omitted for MPT, taxis and public transport. The size of the circle simulates the number of vehicle trips per km2 per year for a rural area (Glarus South) and an urban area (Basel-St. Johann). In particular, the traffic volume in Service Option 3 (replacement of public transport) in both areas is many times higher than in the other service options, where a comparatively manageable additional traffic volume is generated.
For Basel-St. Johann, the differences between the service options are similar to those in Glarus South, but to a greater extent, as shown in Figure 6 below.
Figure 6. Traffic volume of on-demand collective transport service in Basel-St. Johann (source: own illustration).
Sustainability 13 03091 g006
Much more severe are the differences in the traffic volume between the two areas, as Table 6 shows. The higher the initial volume of traffic in an area, the more additional vehicle kilometres are generated by on-demand collective transport services.
While a rural region, such as Glarus South, generates comparatively little additional traffic volume per km2, on-demand mobility services in urban areas can have a serious impact on the environment and traffic—even though the average journey length per passenger is significantly lower in Basel-St. Johann. In Glarus South, the four service options generate 1.73 (Service Option 1), 0.93 (Service Option 2), 6.6 (Service Option 3), and 0.22 (Service Option 4) additional trips per km2 per day. This is relatively low compared to Basel-St. Johann with 2000, 13,670, 8795, and 192 additional trips, respectively. It is worth mentioning that the additional traffic volume in Basel-St. Johann is 1159 (Service Option 1), 1471 (Service Option 2), 1332 (Service Option 3), and 875 (Service Option 4) times higher than in Glarus South. Likewise, the additional vehicle kilometres per km2 per year generated on the road in Basel-St. Johann are 363.5 times higher for Service Option 1, 370 times higher for Service Option 2, 440.6 times higher for Service Option 3, and 350 times higher for Service Option 4 than in Glarus South.
In Basel-St. Johann, for example, an on-demand collective transport service as a public transport supplement would drive about 4.8 million vehicle kilometres per year, which corresponds to about 120 round-the-world trips. If the vehicle kilometres of MPT, taxi, and bus services that are no longer required due to the modal shift are deducted, there is a net increase of around 820,000 additional vehicle kilometres. In the hypothetical case that public transport in Basel-St. Johann would be completely replaced, this would result in a traffic volume of more than 31 million vehicle kilometres per year for the on-demand collective transport service, or 7.2 million vehicle trips, with a net increase of almost 20 million additional vehicle kilometres. In an area of just 2.4 km2, this would cause considerable traffic problems.
It is also interesting to consider the required fleet size. This is calculated by taking into account the usage and demand per five-minute interval. The capacity usage results from the bundling of trip requests, the average number of passengers per trip request and the empty quota. The fleet size was calculated to cover an average hour during the evening peak. The average driving distance was not taken into account in the calculation of the fleet size, which means that the annual output per vehicle used varies greatly depending on the type of space and, in some cases, very high values were calculated.
Table 7 shows that a high number of vehicles per km2 is needed in dense areas.
It is necessary to build up a large fleet of vehicles in order to be able to meet the demand in a high quality, especially in urban areas. While, for example, Service Option 2 (public transport supplementation during off-peak and off-peak hours) in Glarus South requires only 23 vehicles for peak hours, 99 vehicles are needed in Basel-St. Johann to meet transportation demands.

4.2. Ecological Effects

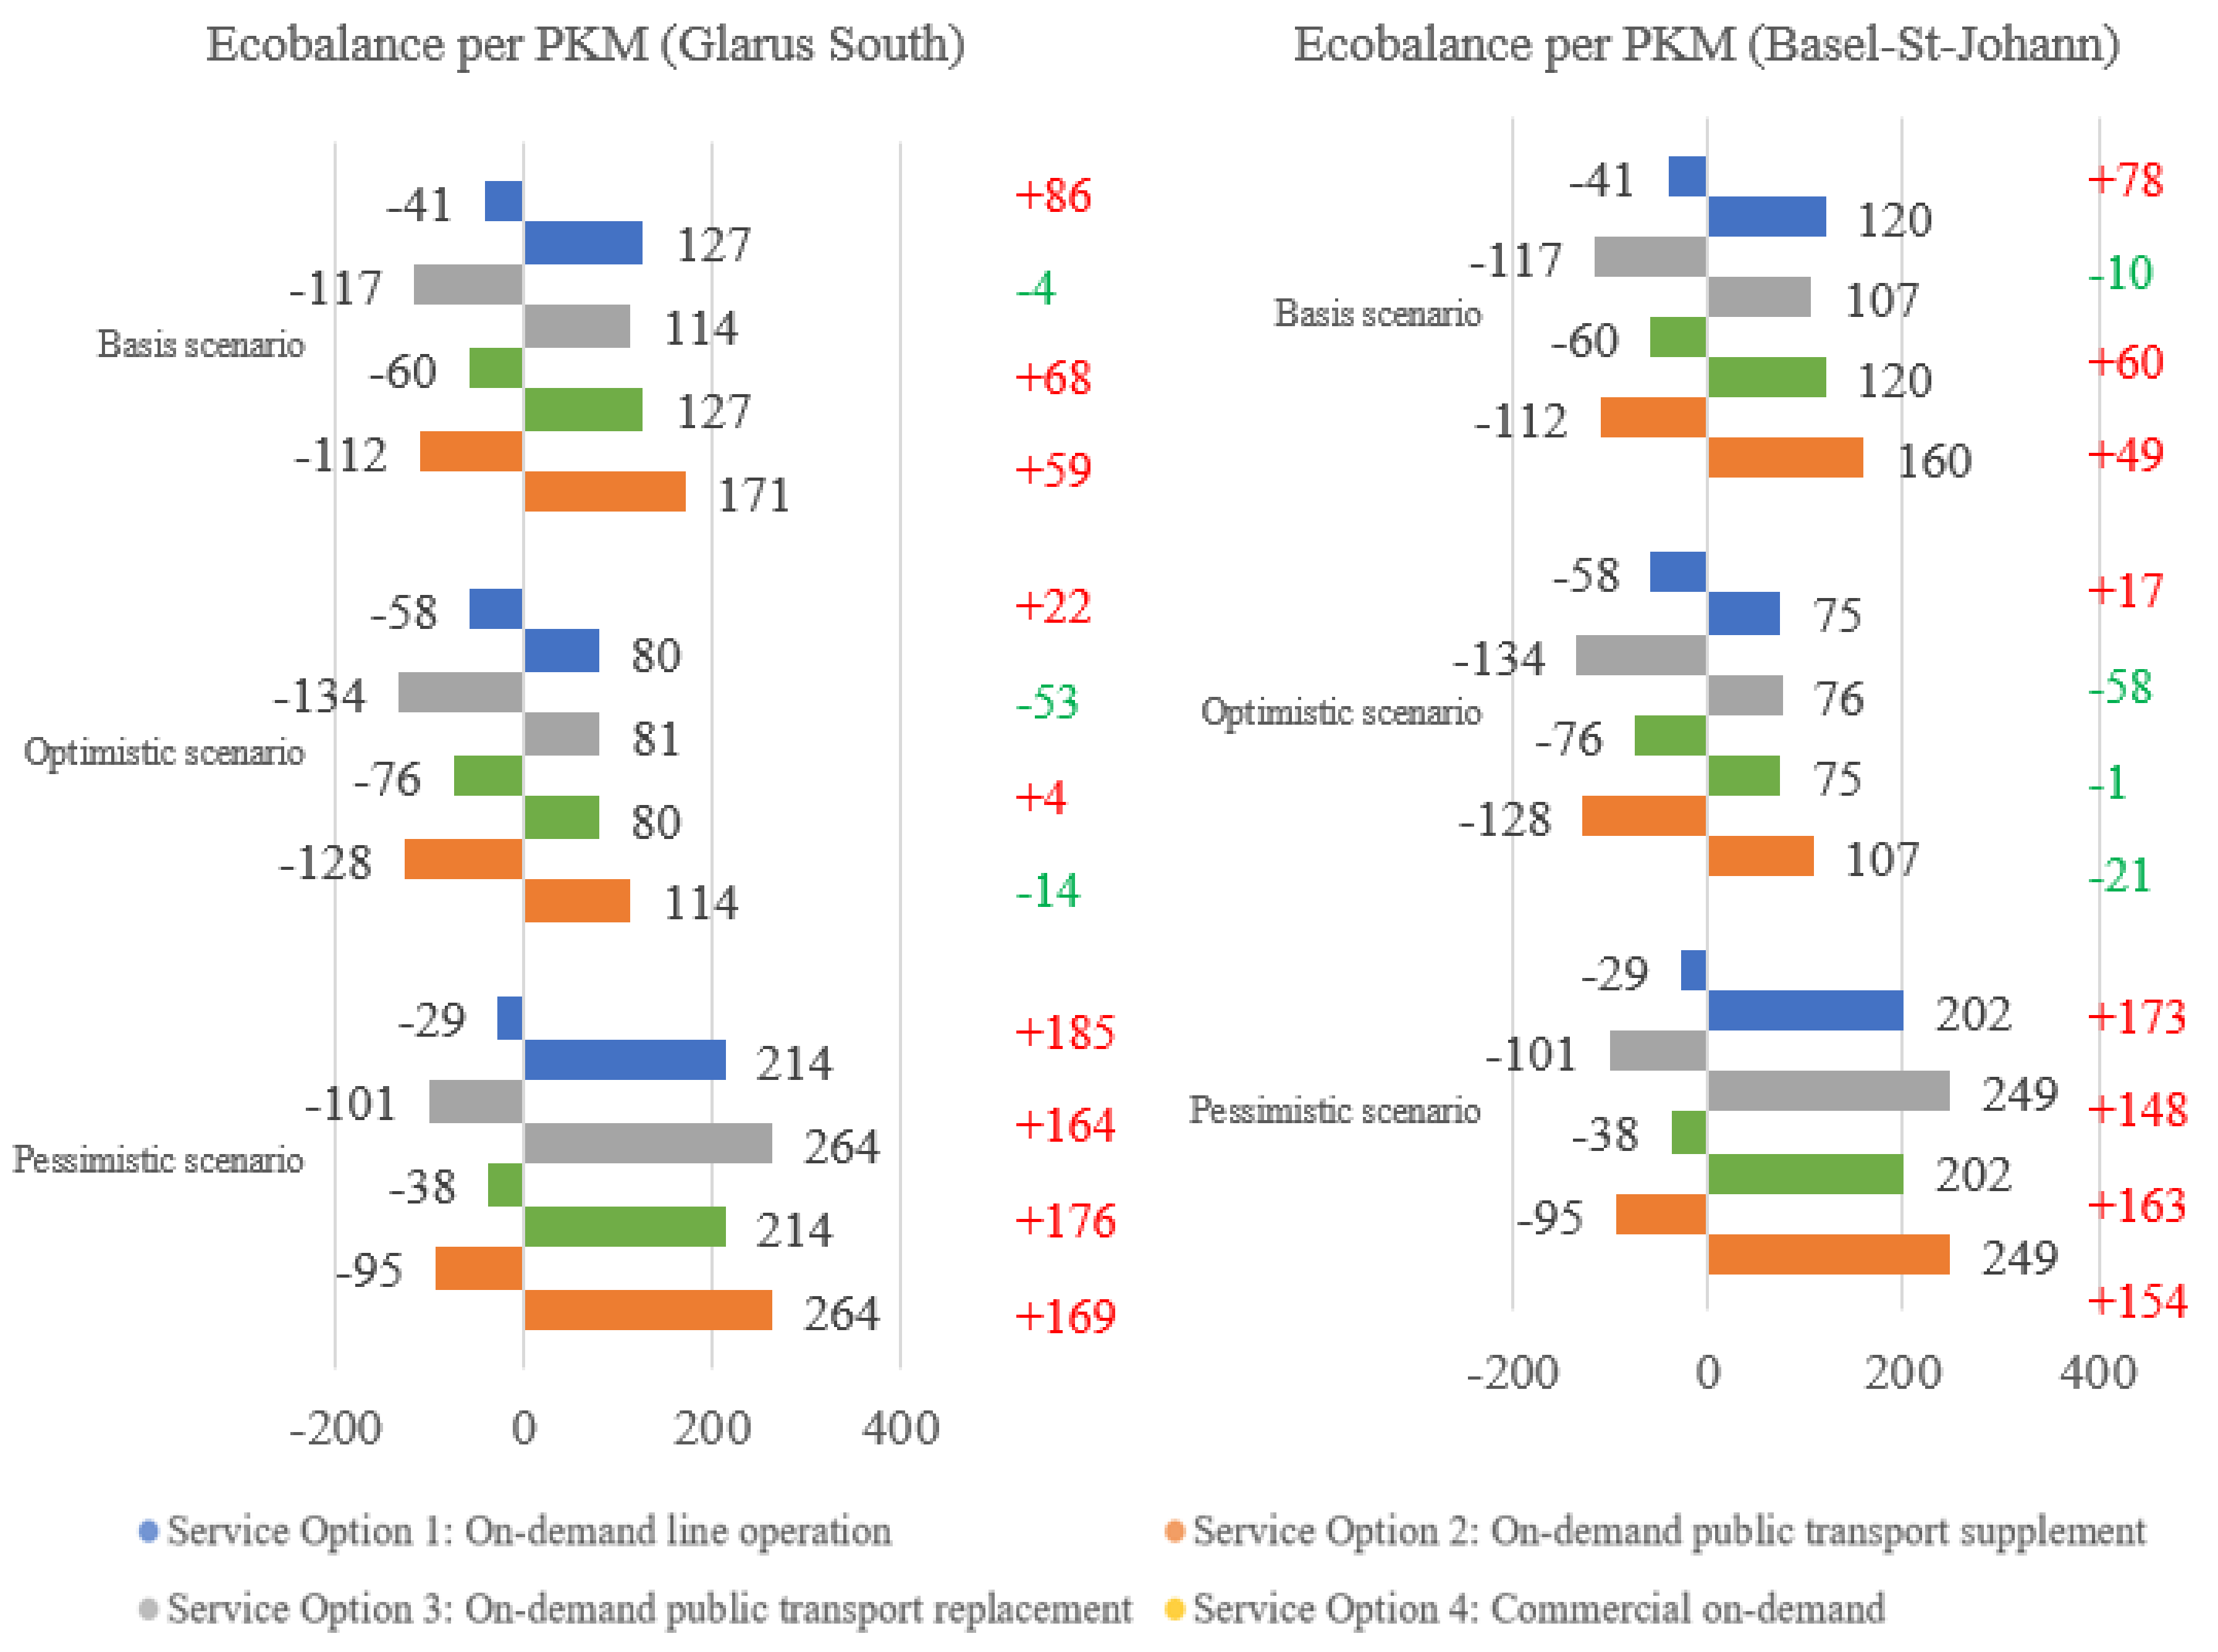
In terms of ecological effects, the question arises whether more or less CO2 is emitted per passenger kilometre due to on-demand collective transport services. In both spatial types, Service Options 1, 3, and 4 result in negative effects in terms of CO2 emissions, as shown in the following figure. The left side of the diagram displays the CO2 savings by reducing other modes of transport, while on the right, the average CO2 emissions produced by the on-demand service are shown.
Assuming the CO2 emission values in gCO2equ/PKM taken from the mobitool for each means of transport and a 25% share of electric vehicles, a significant increase in CO2 emissions can be expected for Service Options 1, 3, and 4. This is due to the fact that in the case of on-demand collective transport services, the traffic volume increases at the expense of more environmentally friendly means of transport. The reasons for the negative environmental effects are the proportion of empty runs and the occupancy rate (see Table 7) as well as the shift effects that come from public transport and slow transport (see Figure 7).
Service Option 1 results in the worst carbon footprint per PKM. This is because with this option, there is a particular shift from existing public transport journeys to on-demand collective transport services. This is different in Service Options 2–4, where a certain potential of MPT and taxi traffic can be exploited. In Service Options 3 and 4, this still leads to a negative carbon footprint per PKM, but to a lesser extent.
Figure 8 shows the grans of CO2eq per passenger kilometre for the traditional modes of transport, as well as for the four service options for on-demand transport services in both regions. According to our calculations, taxis and MPT lead to the highest generated CO2 emissions. For both spatial regions, the four service options cause less CO2 emissions per passenger kilometre than taxis and MPT but still much more than public transport or slow transport.
Table 8 summarises the increase in CO2 emissions per year, per inhabitant and workplace (referring to the territorial principle), and in relation to total CO2 emissions in transportation due to on-demand collective transport services. The table shows that the increase in CO2 emissions per inhabitant and workplace in relation to the CO2 emissions in total transport per person and to total traffic emissions is relatively small for Service Options 1 and 4. However, the increase in CO2 emissions triggered by Service Option 3 is quite remarkable. The increase in CO2 emissions in relation to total CO2 emissions in transport is lower in Basel-St. Johann than in Glarus South due to fewer empty trips and shorter average distances.

4.3. Sensitivities

The model calculations performed are based on various assumptions, some of which could significantly influence the results. In this section, sensitivities were used to check the robustness of the calculated effects.
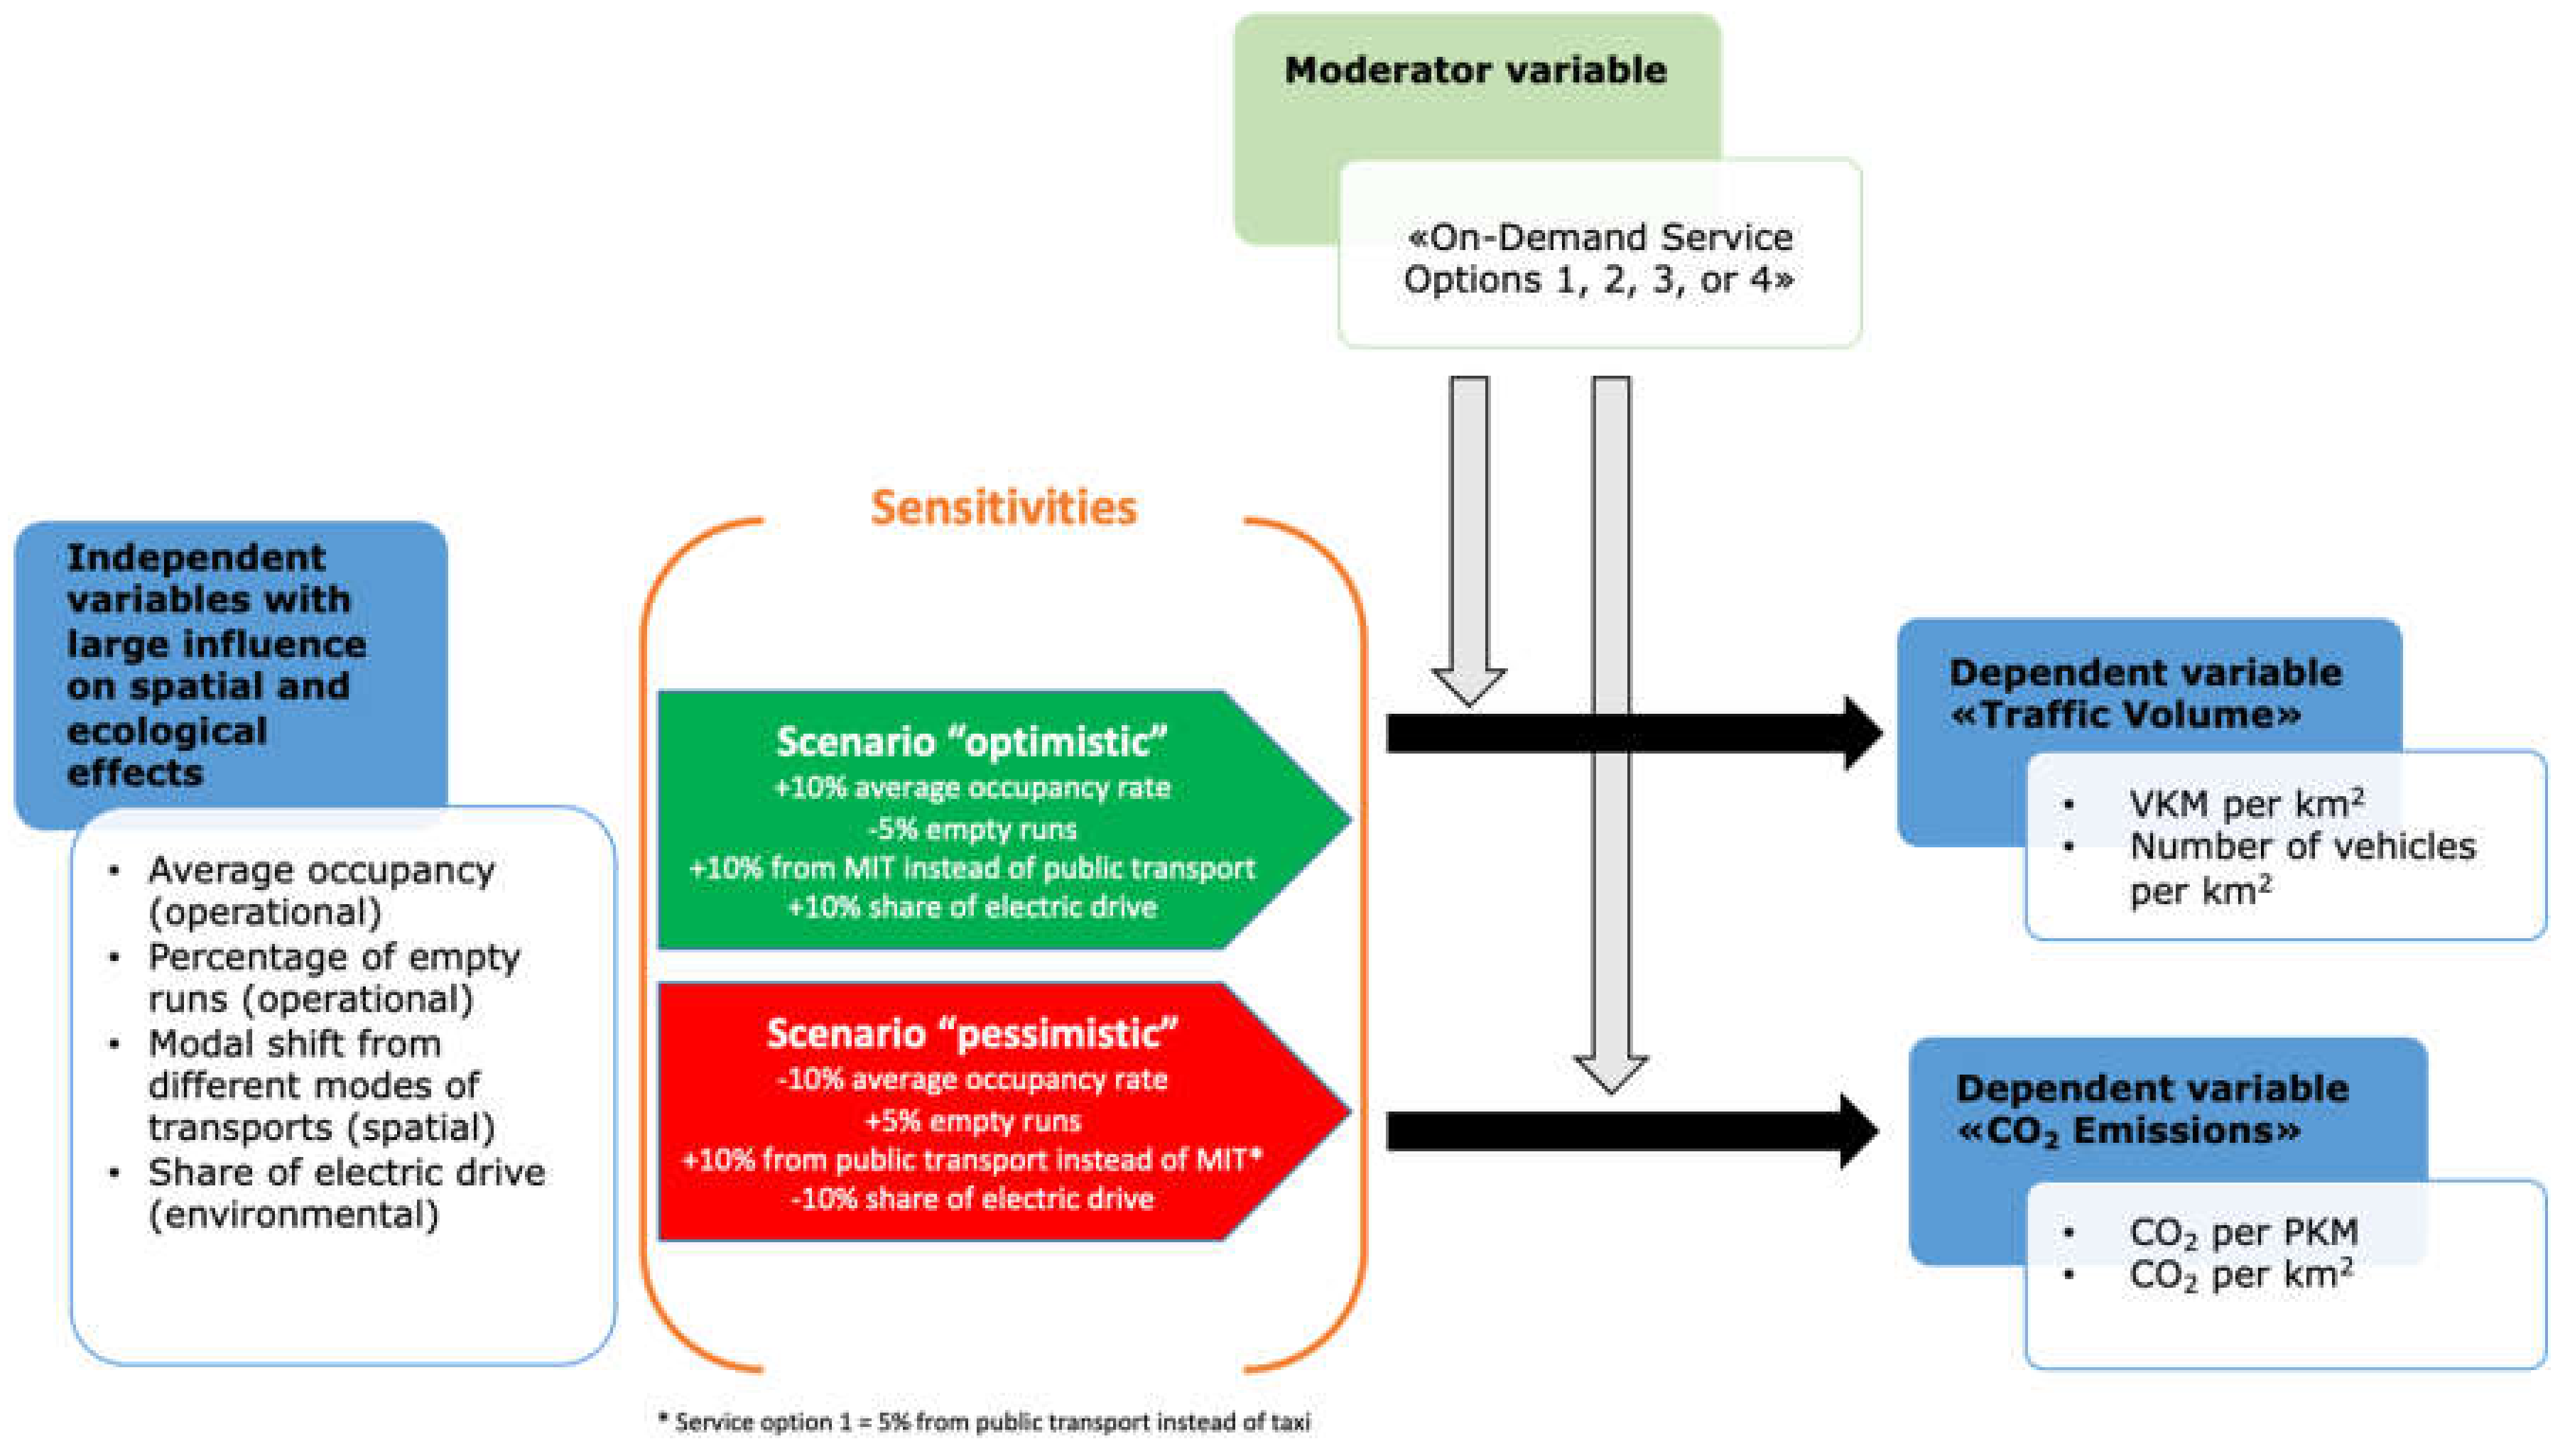
For the sensitivity analysis, the assumptions regarding the input factors (“basis” scenario) were changed, which had a particularly large influence on the effects on traffic volume and ecology. This made it possible to check whether Service Options 1–4 lead to increased traffic even with more optimistic assumptions about the input factors, such as higher occupancy rate, lower empty runs and more modal shift from MPT instead of public transport (“optimistic” scenario). With regard to the ecological effects, it can be shown whether these input factors, as well as a higher share of electric drive, can lead to a positive ecobalance. Conversely, the effects of more pessimistic assumptions are shown in the “pessimistic” scenario (see Figure 9).
Regarding the two scenarios, the following conclusions can be drawn from the sensitivity analysis:
  • Traffic volume: even with more optimistic assumptions regarding the above input factors, the introduction of an on-demand collective service is likely to result in an overall increase in road traffic. Nevertheless, the increase in vehicle kilometres on the road per year (see Figure 10 and Figure 11) would be approximately halved for Service Options 1, 3, and 4, compared to the basis scenario in Glarus South and Basel-St. Johann. For Service Option 2 (on-demand collective service as a public transport supplement), a very optimistic average occupancy rate and a high rate of substituted car trips, as undertaken in the optimistic scenario, could even lead to less road traffic overall in both areas. If more pessimistic input factors are used (pessimistic scenario), all service options lead to significantly higher road traffic growth (+50–100%). The increase is particularly large for Service Option 2, where around five to six times more road traffic growth is recorded than in the basis scenario. The sensitivities only have an impact on the total traffic volume, not on the PKM and number of trips per inhabitant and workplace covered by on-demand services per year (y-axis).
2.
Ecological effects: the more optimistic assumptions regarding the average occupancy rate, empty runs, modal shift, and share of electric drive would also lead to a positive ecological balance for Service Option 4 (in both areas) and Service Option 3 (in only the urban area) in addition to Service Option 2 (see Figure 12). CO2 emissions per PKM would decrease by around one-third for all four service options. However, Service Option 3 is rather unrealistic in an urban context due to the high increase in road traffic. Assuming more pessimistic assumptions than in the basis scenario, all service options without exception lead to a negative ecobalance; i.e., up to 2.3 times higher CO2 emissions per PKM.

5. Conclusions

5.1. Discussion of Results

The present study generated substantial new insights into the research needs outlined in the literature review. In Hypothesis 1, we assumed that the positive effect of on-demand collective transport services on sustainability in terms of traffic volume and emissions through a modal shift from private transport would exceed the negative effects from the cannibalisation of public transport and human-powered mobility. The results of the simulation show that on-demand collective transport services are to be assessed critically, especially in an urban context. In Service Options 1, 3, and 4, a significant increase in CO2 emissions can be expected due to the on-demand collective transport services, as a considerable share of customers of the collective transport services come from the more environmentally friendly modes of public transport and non-motorised transport. This finding is in line with other studies that prove that on-demand mobility services cannibalise other eco-friendlier forms of transport, such as public transport, walking, or cycling [17,19,24,25,26]. Service Option 1 is not appropriate since there is relatively high demand for scheduled services during peak hours. Consequently, many of these small vehicles would be needed. Larger vehicles could possibly be used if there was a bundled passenger volume on certain routes. Implementing Service Option 3 is also not desirable from a traffic point of view, especially in urban areas. In terms of CO2 emissions, the negative effects per PKM in rural areas are even higher than in urban areas, because more empty runs and longer distances are driven. The negative effects are also relevant in terms of total transport emissions. The negative effects of Service Option 4 are quite modest in both urban and rural areas as the market potential is limited. However, negative effects are to be expected without exception in terms of the volume of traffic on the roads since a vast majority comes from public transport. Thus, Hypothesis 1 cannot be supported with respect to Service Options 1, 3, and 4. The promises of commercial on-demand mobility providers that they can solve traffic and environmental problems cannot be confirmed by this study. With electric vehicles, there is a positive ecological balance, but the additional traffic remains. Implementing Service Option 2 (on-demand collective transport services at off-peak times as a public transport supplement) is recommendable in both regions. There are positive effects in terms of CO2 emissions because with this option many passengers change from a taxi or private car to eco-friendly collective transport services, supporting Hypothesis 2. In line with this hypothesis, the positive ecological effect of Service Option 2 is achieved only if on-demand mobility services can be positioned as a superior alternative to the taxi or second car. Reference [18] suggests that on-demand mobility services can especially have a high positive environmental impact as feeder services in rural areas that are not covered by existing public transport services. At the same time, the additional generated traffic is modest. Therefore, Hypothesis 1 can be partly confirmed with respect to Service Option 2. Thus, urban and transport planners need to strengthen the integration of public transport and shared mobility services in order to reduce energy use and GHG emissions. Reference [30] recommends some measures to combine public transport and on-demand mobility services, such as tax rebates, differentiated fees, or the provision of subsidies for on-demand mobility providers, in order to improve the catchment capacity of public transport. Thus, a mix of both general and specific policies that support environmental protection is required. In particular, creating incentives for industrial development and innovation, such as investments in making battery manufacturing more sustainable, should be considered within the policy framework. Furthermore, public agencies should invest in making public transport more attractive, so that the rebound effect is mitigated [10,29].
In Hypothesis 3, we expected that due to the strong market position of public transport in urban areas with high numbers of passengers and high bundling rates, an expansion with on-demand collective transport services would have a negative impact on sustainability compared to the situation in rural areas where the market position of public transport is weak in terms of passenger numbers and bundling rates. The results of the simulation regarding the influence of the area (rural vs. urban) on the advantageousness of on-demand collective transport services show that the Service Options 1, 3, and 4 each generate higher additional CO2 emissions in terms of gCO2equ/PKM in the rural than in the urban area. Service Option 2 leads to a reduction of CO2 emissions by 4 gCO2equ/PKM in Glarus South and by 10 gCO2equ/PKM in Basel-St. Johann. However, a substantial change from the current public transport offer to on-demand collective transport services is not recommended in an urban context since, on average, over all service options, each option generates approximately 1200 times more additional vehicle trips on the road and 380 times more additional vehicle kilometres per km2 per year in the urban than in the rural area. This finding is in line with the results of a study by [25], which illustrates the negative environmental impacts of on-demand mobility services due to increased total number of trips and vehicle miles travelled.
The ecological advantage of Service Option 2 may be modest in the short-term, but in the medium-term, on-demand collective services could result in a lower share of private car ownership, as shown by [18]. Furthermore, from the perspective of public authorities, ecology is not the only criterion for deciding whether it is appropriate to provide on-demand mobility services. Customer benefits such as convenience and travel time, as well as costs, safety, and accessibility, are also important factors, which will presumably improve with on-demand offers. However, this is not the focus of this paper but will be dealt with in a following one.
The calculations of the ecological effects also show the major effect of the electrification of a collective transport fleet. If the fleet can be operated 100% electrically or if the operators are successful in increasing the occupancy rate, then the ecological disadvantage of collective transport services compared to public transport can be sharply reduced. Policymakers should, therefore, focus on supporting the use of clean energy in ridesourcing services. Ridesourcing vehicles should be equipped with innovative technologies that lead to improved lifecycle energy efficiency and reduced GHG emissions. However, the pilot studies conducted worldwide show that increasing the occupancy and bundling rates and avoiding empty runs is extremely difficult to achieve in both urban and rural areas. The effect of collective transport services with regard to the additional VKM caused is critical; this effect is relevant if the area of operation is characterised by high demand and density, as is typical in urban quarters. In the hypothetical case that public transport would be completely replaced by collective transport services, on-demand collective transport services would generate an additional traffic volume of 8.9 million vehicle kilometres on the road per km2 per year (25,000 vehicle kilometres on the road per km2 per day) or more than 3.2 million vehicle trips per km2 per year (9000 vehicle trips per km2 per day) in an urban area such as Basel-St. Johann. In an area of only 2.4 km2, this would cause considerable traffic problems. This shows that public transport remains unbeatable, especially in urban areas with high traffic demand, and that complete traffic management by shared shuttles, as is partly simulated in various studies, would not be feasible because of the considerable additional traffic.
The effect of a much lower bundling rate and smaller vehicle sizes, therefore, has strongly negative consequences in urban areas. In rural areas with less traffic movement, the growth of VKM plays less of a role. Compared to Basel-St. Johann, on-demand collective transport services in a rural area, such as Glarus South, would generate an additional traffic volume of 20,200 vehicle kilometres on the road per km2 per year (55 vehicle kilometres on the road per km2 per day) or more than 2400 vehicle trips per km2 per year (seven vehicle trips per km2 per day) when implemented as a public transport replacement. The concentration of passenger cars is already low there and the roads are not overloaded, especially during off-peak hours. Since low vehicle occupancy is especially ecologically harmful, there is a need to set incentives for ridesourcing providers to increase the occupancy rate of their vehicles. For example, minimum occupancy standards could lead to better capacity use [30]. A push-pull strategy is probably needed to ensure that such higher-quality offers trigger further changes in behaviour; e.g., with respect to car ownership (e.g., financial and regulatory incentives, parking space availability, etc.). It would also be helpful if the technical and public transport tariff integration of such on-demand collective transport services also included other sharing offers, such as e-bikes, cargo bikes, and micromobility.
By calculating sensitivities, the present study shows which factors influence the ecological balance and how strong their effects are. Unsurprisingly, it turns out that high vehicle usage (due to demand in general and additionally to bundling) is ecologically decisive. The modal shift (from MPT or public transport/non-motorised traffic) as well as the propulsion system technology (electrification) have a strong influence on ecology and traffic volume. The sensitivity analysis leads to the following general conclusions with regard to the parameters for on-demand collective transport services in all spatial contexts:
  • Traffic volume: the modal shift, the average usage and the bundling rate (that is to say, the occupancy rate) have a particularly high influence on the generated traffic. If the majority of trips could be shifted from MPT to the new on-demand mobility services and, at the same time, an average capacity higher than that of a private car could be achieved, there would be positive effects on space and environment. These aspects are particularly important in densely populated areas with high traffic volumes. Conversely, there are negative effects on traffic volume and the environment if many passengers change from large public transport offers with high bundling to minibuses with low bundling.
  • Ecological effects: the introduction of on-demand collective transport services leads to less traffic and thus to lower CO2 emissions when making optimistic assumptions regarding the bundling of travel requests, the empty rate and the shift from private cars. The electrification of the vehicle fleet has a major effect, while the average distance per passenger has a small effect.
Even if these sensitivities indicate that the result of on-demand collective transport services could be improved, their realisation is not trivial. It is obvious that people who would otherwise have to walk or travel by public transport are more likely to order a collective transport service than those who have a car “on their doorstep”. Increasing the rate of bundling also seems difficult, because wherever this bundling works, public transport services are already available on schedule. A political–economic assessment of where on-demand collective transport services could be usefully applied can only be answered on a certain level of abstraction in the present study. In practice, it would, therefore, be important to increase the scope for well-evaluated pilot projects (e.g., with an experimentation clause). Moreover, there must be competition of ideas as to which service concepts would optimally provide the population with mobility services. In this case, introducing standardised methodologies to evaluate lifecycle emissions is important. Minimum performance requirements via market entry rule and/or operating licenses would help to promote environmentally friendly practices [30]. The tendency is that the more rural the areas to be served are, the more the use of small, flexible vehicles would make sense for improving a comprehensive public mobility service. In rural areas, bundling plays less of a role and the environmental impact of the additional VKM is less significant. However, the decision for a particular service concept always requires a lot of local knowledge and cooperation. On-demand collective transport services can, therefore, contribute to the overall transport system if intelligent regulation minimises the negative effects and creates incentives for the development of socially useful business models. Public authorities should, therefore, adapt existing reporting obligations to include the diversity and dynamism of business models and vehicle types. They need to extend the regulatory reporting requirements in order to acquire adequate information by mobility providers for making evidence-based policy decisions [30].

5.2. Study Limitations

The method chosen for calculating the effects has some limitations. As the sensitivity analyses have shown, the input variables that are based on assumptions have relatively high sensitivities. Where available, existing studies were used; however, most of these studies refer to densely populated areas and on-demand transport services without a collection function. In Switzerland and also in Europe, there is still little empirically reliable data for on-demand collective transport services. Another limitation is the fact that we do not have actual values for the number of trips within the study region. Therefore, we have extrapolated the number of trips, which is why the values tend to be slightly too high. This is particularly important when CO2 emissions are considered in relation to total traffic emissions. In addition, the method did not take into account any forecast data (e.g., changes in mobility behaviour, new parking space concepts, changing cost and revenue trends, etc.) or macroeconomic changes (e.g., fuel price increases). In particular, this study cannot answer the question of whether people would forego a second car due to the existence of on-demand mobility services. The long-term effects on sustainability in terms of traffic volume and emissions are not shown in this analysis, nor does it take into account the grey energy that is generated, for example, in the manufacture and disposal of electric vehicles. Furthermore, a potential expansion of electric vehicles in the motorised private transport category is not considered.

5.3. Avenues for Future Research

The present study is based on a sustainability simulation model, input data from the literature, and simplified assumptions. For a better understanding of the opportunities and risks of on-demand collective transport services, the authors see some need for further research. It is important to also examine the economic evaluation of collective transport services, for example, the quantification of the actual savings potential that can be realised in public transport. Is it possible to keep a smaller technical and operational reserve in the fleet? Does the upkeep of expensive rails during off-peak hours allow an increased service life of the infrastructure?
Another open question is the medium-term adaptation of behaviour; e.g., to the ratio of car or second car ownership, if public transport is supplemented by an affordable but higher quality service. There is also a need for research on meaningful concepts of on-demand collective transport services. How large must the space served be? Is a public transport hub needed as an anchor point? To what extent are passengers willing to switch from a collective transport service to larger public transport vehicles? From an operational point of view, it would be interesting to know with which organisation collective transport services could cooperate with; e.g., with the taxi industry or patient transportation. In order to be able to produce additional services during off-peak hours at low cost, vehicles and drivers have to be deployed elsewhere during the day. The expansion of on-demand collective transport services as a standard product will probably only occur when automation greatly improves the cost-effectiveness of such services. Nobody knows at the moment when this time will come and how strong the cost degression will really be. In this context, it could make sense to see human-controlled on-demand collective transport services as a learning opportunity. When the technology is mature, it would be advantageous for public transport to already have mature service concepts, legal foundations and partnerships.
In this paper, we investigated, among other things, the influence of the spatial context (rural vs. urban areas) on the ecological effects and induced traffic volume of on-demand mobility services. However, the development and expansion of such services may also influence density and space. For example, people might move from urban centres to more rural areas if they can be offered a flexible alternative by integrating on-demand collective transport services with public transport. Thus, further research could analyse the effects of expanding on-demand mobility services on long-term urban and suburban structures.

Author Contributions

Conceptualization, W.v.A.; methodology, J.F. and L.D.; formal analysis, J.F. and L.D.; writing—original draft preparation, L.D.; writing—review and editing, J.F. and W.v.A.; visualization, J.F. and L.D.; supervision, W.v.A.; project administration, W.v.A.; All authors have read and agreed to the published version of the manuscript.

Funding

This research was supported by the Swiss Federal Railways (SBB).

Data Availability Statement

The data used can be requested from the authors. The Excel model for the calculations was developed by the company KCW GmbH Berlin and the Lucerne University of Applied Sciences and Arts and is confidential. The authors can provide interested researchers with detailed information on the model upon request.

Conflicts of Interest

The authors declare no conflict of interest.

References

  1. Shaheen, S.A.; Lipman, T.E. Reducing greenhouse emissions and fuel consumption: Sustainable approaches for surface transportation. IATSS Res. 2007, 31, 6–20. [Google Scholar] [CrossRef] [Green Version]
  2. Taiebat, M.; Brown, A.L.; Safford, H.R.; Qu, S.; Xu, M. A review on energy, environmental, and sustainability implications of connected and automated vehicles. Environ. Sci. Technol. 2018, 52, 11449–11465. [Google Scholar] [CrossRef]
  3. Nigro, A.; Bertolini, L.; Moccia, F.D. Land use and public transport integration in small cities and towns: Assessment methodology and application. J. Transp. Geogr. 2019, 74, 110–124. [Google Scholar] [CrossRef] [Green Version]
  4. Gil, J.; Duarte, J.P. Tools for evaluating the sustainability of urban design: A review. In Proceedings of the Institution of Civil Engineers-Urban Design and Planning; Institution of Civil Engineers-Urban Design and Planning: London, UK, 2013; Volume 166. [Google Scholar]
  5. Santos, J.; Ferreira, A.; Flintsch, G. A life cycle assessment model for pavement management: Road pavement construction and management in Portugal. Int. J. Pavement Eng. 2015, 16, 315–336. [Google Scholar] [CrossRef]
  6. Luers, A.L.; Mastrandrea, M.D.; Hayhoe, K.; Frumhoff, P.C. How to Avoid Dangerous Climate Change: A Target for US Emissions Reductions; Union of Concerned Scientists: Cambridge, MA, USA, 2007. [Google Scholar]
  7. United Nations Framework Convention on Climate Change. Adoption of the Paris Agreement; United Nations: Paris, France, 2015. [Google Scholar]
  8. Sgobbo, A.; Basile, M. Sharing sustainability. UPLanD 2017, 2, 255–297. [Google Scholar]
  9. Kramers, A.; Höjer, M.; Lövehagen, N.; Wangel, J.; Ab, E. ICT for sustainable cities: How ICT can support an environmentally sustainable development in cities. In ICT4S 2013: Proceedings of the First International Conference on Information and Communication Technologies for Sustainability; ETH: Zurich, Switzerland, 2013; pp. 183–188. [Google Scholar]
  10. Pakusch, C.; Stevens, G.; Boden, A.; Bossauer, P. Unintended effects of autonomous driving: A study on mobility preferences in the future. Sustainability 2018, 10, 2404. [Google Scholar] [CrossRef] [Green Version]
  11. Wong, Y.Z.; Hensher, D.A.; Mulley, C. Mobility as a service (MaaS): Charting a future context. Transp. Res. Part A Policy Pract. 2020, 131, 5–19. [Google Scholar] [CrossRef]
  12. Clewlow, R.R.; Mishra, G.S. The Adoption, Utilization, and Impacts of Ride-Hailing in the United States; Institute of Transportation Studies, University of California: Davis, CA, USA, 2017. [Google Scholar]
  13. Fagnant, D.J.; Kockelman, K.M.; Bansal, P. Operations of shared autonomous vehicle fleet for Austin, Texas, market. Transp. Res. Rec. 2015, 2563, 98–106. [Google Scholar] [CrossRef] [Green Version]
  14. Rayle, L.; Dai, D.; Chan, N.; Cervero, R.; Shaheen, S. Just a better taxi? A survey-based comparison of taxis, transit, and ridesourcing services in San Francisco. Transp. Policy 2016, 45, 168–178. [Google Scholar] [CrossRef] [Green Version]
  15. Walker, W.E.; Marchau, V.A. Dynamic adaptive policymaking for the sustainable city: The case of automated taxis. Int. J. Transp. Sci. Technol. 2017, 6, 1–12. [Google Scholar] [CrossRef]
  16. Chin, V.; Jaafar, M.; Moy, J.; Phong, M.; Wang, S.; McDonnell, M.; Prawiradinata, I. Unlocking Cities: The Impact of Ridesharing in Southeast Asia and Beyond; The Boston Consulting Group: Kuala Lumpur, Malysia, 2017. [Google Scholar]
  17. Krueger, R.; Rashidi, T.H.; Rose, J.M. Preferences for shared autonomous vehicles. Transp. Res. Part C Emerg. Technol. 2016, 69, 343–355. [Google Scholar] [CrossRef]
  18. Suatmadi, A.Y.; Creutzig, F.; Otto, I.M. On-demand motorcycle taxis improve mobility, not sustainability. Case Stud. Transp. Policy 2019, 7, 218–229. [Google Scholar] [CrossRef]
  19. Trommer, S.; Kolarova, V.; Fraedrich, E.; Kröger, L.; Kickhöfer, B.; Kuhnimhof, T.; Lenz, B.; Phleps, P. Autonomous Driving: The Impact of Vehicle Automation on Mobility Behaviour. Institute for Mobility Research. 2016. Available online: https://elib.dlr.de/110337/1/ifmo_2016_Autonomous_Driving_2035_en.pdf (accessed on 27 February 2021).
  20. Röth, T.; Pielen, M.; Wolff, K.; Lüdiger, T. Urban vehicle concepts for the shared mobility. ATZ Worldw. 2018, 120, 18–23. [Google Scholar] [CrossRef]
  21. Cuevas, V.; Estrada, M.; Salanova, J.M. Management of on-demand transport services in urban contexts. Barcelona case study. Transp. Res. Procedia 2016, 13, 155–165. [Google Scholar] [CrossRef] [Green Version]
  22. Mehlert, C.; Schiefelbusch, M. Rufbus meets Mobility 4.0: Lernen aus 40 Jahren flexiblem Nahverkehr. Nahverkehr 2018, 36, 29–35. [Google Scholar]
  23. Cramer, J.; Krueger, A.B. Disruptive change in the taxi business: The case of Uber. Am. Econ. Rev. 2017, 106, 177–182. [Google Scholar] [CrossRef] [Green Version]
  24. Gehrke, S.R.; Felix, A.; Reardon, T.G. Substitution of ride-hailing services for more sustainable travel options in the greater Boston region. Transp. Res. Rec. 2019, 2673, 438–446. [Google Scholar] [CrossRef]
  25. Anair, D.; Martin, J.; Pinto de Moura, M.C.; Goldmann, J. Ride-Hailing’s Climate Risks: Steering a Growing Industry toward a Clean Transportation Future; Union of Concerned Scientists: Cambridge, MA, USA, 2020; Available online: https://www.ucsusa.org/sites/default/files/2020-02/Ride-Hailing%27s-Climate-Risks.pdf (accessed on 15 November 2020).
  26. Liyanage, S.; Dia, H.; Abduljabbar, R.; Bagloee, S.A. Flexible mobility on-demand: An environmental scan. Sustainability 2019, 11, 1262. [Google Scholar] [CrossRef] [Green Version]
  27. Feigon, S.; Murphy, C. Transit Cooperative Research Program Research Report 195: Broadening Understanding of the Interplay among Public Transit, Shared Mobility, and Personal Automobiles; The National Academies Press: Washington, DC, USA, 2018. [Google Scholar]
  28. Caulfield, B. Estimating the environmental benefits of ride-sharing: A case study of Dublin. Transp. Res. Part D Transp. Environ. 2009, 14, 527–531. [Google Scholar] [CrossRef] [Green Version]
  29. Bischoff, J.; Maciejewski, M. Current and future dynamic passenger transport services–Modeling, simulation, and optimization in a sustainable transport system. In Sustainable Transportation and Smart Logistics; Elsevier: Amsterdam, The Netherlands, 2019; pp. 337–360. [Google Scholar]
  30. Cazzola, P.; Crist, P. Good to Go? Assessing the Environmental Performance of New Mobility; OECD: Paris, France, 2020. [Google Scholar]
  31. Chen, T.D.; Kockelman, K.M. Management of a shared autonomous electric vehicle fleet: Implications of pricing schemes. Transp. Res. Rec. 2016, 2572, 37–46. [Google Scholar] [CrossRef]
  32. Davidson, P.; Spinoulas, A. Driving alone versus riding together–How shared autonomous vehicles can change the way we drive. Road Transp. Res. 2016, 25, 51–65. [Google Scholar]
  33. Gkourtzounis, I.; Rigas, E.S.; Bassiliades, N. Towards online electric vehicle scheduling for mobility-on-demand schemes. In European Conference on Multi-Agent Systems; Springer: Cham, Switzerland, 2018; pp. 94–108. [Google Scholar]
  34. Rigas, E.S.; Tsompanidis, K.S. Congestion Management for Mobility-on-Demand Schemes that use Electric Vehicles. In Multi-Agent Systems and Agreement Technologies; Springer: Cham, Switzerland, 2020; pp. 52–66. [Google Scholar]
  35. Fagnant, D.J.; Kockelman, K. Preparing a nation for autonomous vehicles: Opportunities, barriers and policy recommendations. Transp. Res. Part A Policy Pract. 2015, 77, 167–181. [Google Scholar] [CrossRef]
  36. Greenblatt, J.B.; Saxena, S. Autonomous taxis could greatly reduce greenhouse-gas emissions of US light-duty vehicles. Nat. Clim. Chang. 2015, 5, 860–863. [Google Scholar] [CrossRef]
  37. Chong, Z.J.; Qin, B.; Bandyopadhyay, T.; Wongpiromsarn, T.; Rankin, E.S.; Ang, M.H.; Low, K.H. Autonomous personal vehicle for the first- and last-mile transportation services. In IEEE 5th International Conference on Cybernetics and Intelligent Systems (CIS); Institute of Electrical and Electronics Engineers: Qingdao, China, 2011; pp. 253–260. [Google Scholar]
  38. Imhof, S.; Frölicher, J.; von Arx, W. Shared autonomous vehicles in rural public transportation systems. Res. Transp. Econ. 2020, 83, 1–7. [Google Scholar] [CrossRef]
  39. Enbel-Yan, J.; Leonard, A. Mobility hub guidelines: Tools for achieving successful station areas. ITE J. 2012, 82, 42–47. [Google Scholar]
  40. Hörl, S.; Becker, F.; Dubernet, T.J.P.; Axhausen, K.W. Induzierter Verkehr Durch Autonome Fahrzeuge: Eine Abschätzung; Bundesamt für Strassen: Bern, Switzerland, 2019. [Google Scholar]
  41. Inturri, G.; Le Pira, M.; Giuffrida, N.; Ignaccolo, M.; Pluchino, A.; Rapisarda, A.; D’Angelo, R. Multi-agent simulation for planning and designing new shared mobility services. Res. Transp. Econ. 2019, 73, 34–44. [Google Scholar] [CrossRef]
  42. Ministry of Regional Development and Transport. Modell für die Berechnung von CO2-Emissionen. Magdeburg, Germany. 2019. Available online: https://lvwa.sachsen-anhalt.de/fileadmin/Bibliothek/Politik_und_Verwaltung/LVWA/LVwA/Dokumente/3_wirtschaft_kultur_verbrschutz_bau/307/EFRE/Intelligente_Verkehrssysteme/IVS_Zuweisung/1.1_Anlage_1_zum_Antrag_Berechnungsmodul.pdf (accessed on 3 March 2021).
  43. Helsinki Regional Transport Authority. Kutusplus–Final Report. Helsinki. 2016. Available online: https://www.hsl.fi/sites/default/files/uploads/8_2016_kutsuplus_finalreport_english.pdf (accessed on 27 February 2021).
  44. NSW Transport. On Demand Public Transport. 2020. Available online: https://transportnsw.info/travel-info/ways-to-get-around/on-demand (accessed on 15 November 2020).
  45. Shaheen, S.; Cohen, A. Mobility on demand in the United States: From operational concepts and definitions to early pilot projects and future automation. In Analytics for the Sharing Economy: Mathematics, Engineering and Business Perspectives; Crisostomi, E., Ghaddar, B., Häusler, F., Naoum-Sawaya, J., GRusso, G., Shorten, R., Eds.; Springer Nature: Cham, Switzerland, 2020; pp. 227–254. [Google Scholar]
  46. Sieber, L.; Ruch, C.; Hörl, S.; Axhausen, K.W.; Frazzoli, E. Improved public transportation in rural areas with self-driving cars: A study on the operation of Swiss train lines. Transp. Res. Part A Policy Pract. 2020, 134, 35–51. [Google Scholar] [CrossRef]
  47. Swiss Federal Statistical Office. Gemeindetypologie und Stadt/Land-Typologie; Federal Statistical Office: Neuchâtel, Switzerland, 2017. [Google Scholar]
  48. Federal Office for Spatial Development. Modalsplit in den Agglomerationen-Ergebnisse 2015. Bern, Switzerland. 2018. Available online: https://www.are.admin.ch/dam/are/de/dokumente/verkehr/dokumente/mikrozensus/modalsplit_agglomerationen.pdf.download.pdf/Modalsplit_Agglomerationen_2015.pdf (accessed on 27 February 2021).
  49. Federal Office for Spatial Development. Dichte und Mobilitätsverhalten. 2018. Available online: https://www.are.admin.ch/are/de/home/medien-und-publikationen/publikationen/grundlagen/dichte-und-mobilitatsverhalten.html (accessed on 27 February 2021).
  50. Bösch, P.M.; Müller, K.; Ciari, F. The IVT 2015 Baseline Scenario. 16th Swiss Transport Research Conference. Available online: https://www.research-collection.ethz.ch/bitstream/handle/20.500.11850/117938/2/ab1163.pdf (accessed on 27 February 2021).
  51. Makido, Y.; Dhakal, S.; Yamagata, Y. Relationship between urban form and CO2 emissions: Evidence from fifty Japanese cities. Urban Clim. 2012, 2, 55–67. [Google Scholar] [CrossRef] [Green Version]
  52. Khalil, H.A. Energy efficiency strategies in urban planning of cites. In 7th International Energy Conversion Engineering Conference; American Institute of Aeronautics and Astronautic: Reston, VA, USA, 2019. [Google Scholar]
  53. New York City Department of Transportation. Citywide Mobility Survey. 2017. Available online: https://www1.nyc.gov/html/dot/downloads/pdf/nycdot-citywide-mobility-survey-report-2017.pdf (accessed on 27 February 2021).
  54. Schaller, B. The New Automobility: Lyft. Uber and the Future of American Cities. 2018. Available online: http://schallerconsult.com/rideservices/automobility.pdf (accessed on 27 February 2021).
  55. Schaller, B. Making Congestion Pricing Work for Traffic and Transit in New York City. 2018. Available online: http://www.schallerconsult.com/rideservices/makingpricingwork.pdf (accessed on 3 March 2021).
  56. Leisy, C.A. Transportation Network Companies and Taxis; Routledge: London, UK, 2019. [Google Scholar]
  57. Rodier, C. The Effects of Ride Hailing Services on Travel and Associated Greenhouse Gas Emissions. 2018. Available online: https://escholarship.org/content/qt2rv570tt/qt2rv570tt_noSplash_11ef3f6f9b4f64f6cd7730c9faf5cca8.pdf?t=qenf5z (accessed on 3 March 2021).
  58. Swiss Federal Statistical Office. Mobilität in der Schweiz–Ergebnisse des Mikrozensus Mobilität und Verkehr 2010. 2012. Available online: https://www.are.admin.ch/dam/are/de/dokumente/verkehr/mobilitaet_in_derschweiz-ergebnissedesmikrozensusmobilitaetundve.pdf.download.pdf/mobilitaet_in_derschweiz-ergebnissedesmikrozensusmobilitaetundve.pdf (accessed on 27 February 2021).
  59. Swiss Federal Statistical Office. Verkehrsverhalten der Bevölkerung–Ergebnisse des Mikrozensus Mobilität und Verkehr 2015; Federal Statistical Office: Neuchâtel, Switzerland, 2017. [Google Scholar]
  60. Swiss Federal Office of Energy. Gesamtenergiestatistik. 2018. Available online: https://www.bfe.admin.ch/bfe/de/home/versorgung/statistik-und-geodaten/energiestatistiken/gesamtenergiestatistik.html (accessed on 27 February 2021).
  61. Swiss Federal Office for the Environment. Indikator Klima. 2020. Available online: https://www.bafu.admin.ch/bafu/de/home/themen/thema-klima/klima--daten--indikatoren-und-karten/klima--indikatoren/indikator-klima.pt.html/aHR0cHM6Ly93d3cuaW5kaWthdG9yZW4uYWRtaW4uY2gvUHVibG/ljL0FlbURldGFpbD9pbmQ9S0wwMDImbG5nPWRlJlN1Ymo9Tg%3D%3D.html (accessed on 15 November 2020).
  62. Swiss Federal Office for the Environment. Klima: Das Wichtigste in Kürze. 2020. Available online: https://www.bafu.admin.ch/bafu/de/home/themen/klima/inkuerze.html#-1190322929 (accessed on 15 November 2020).
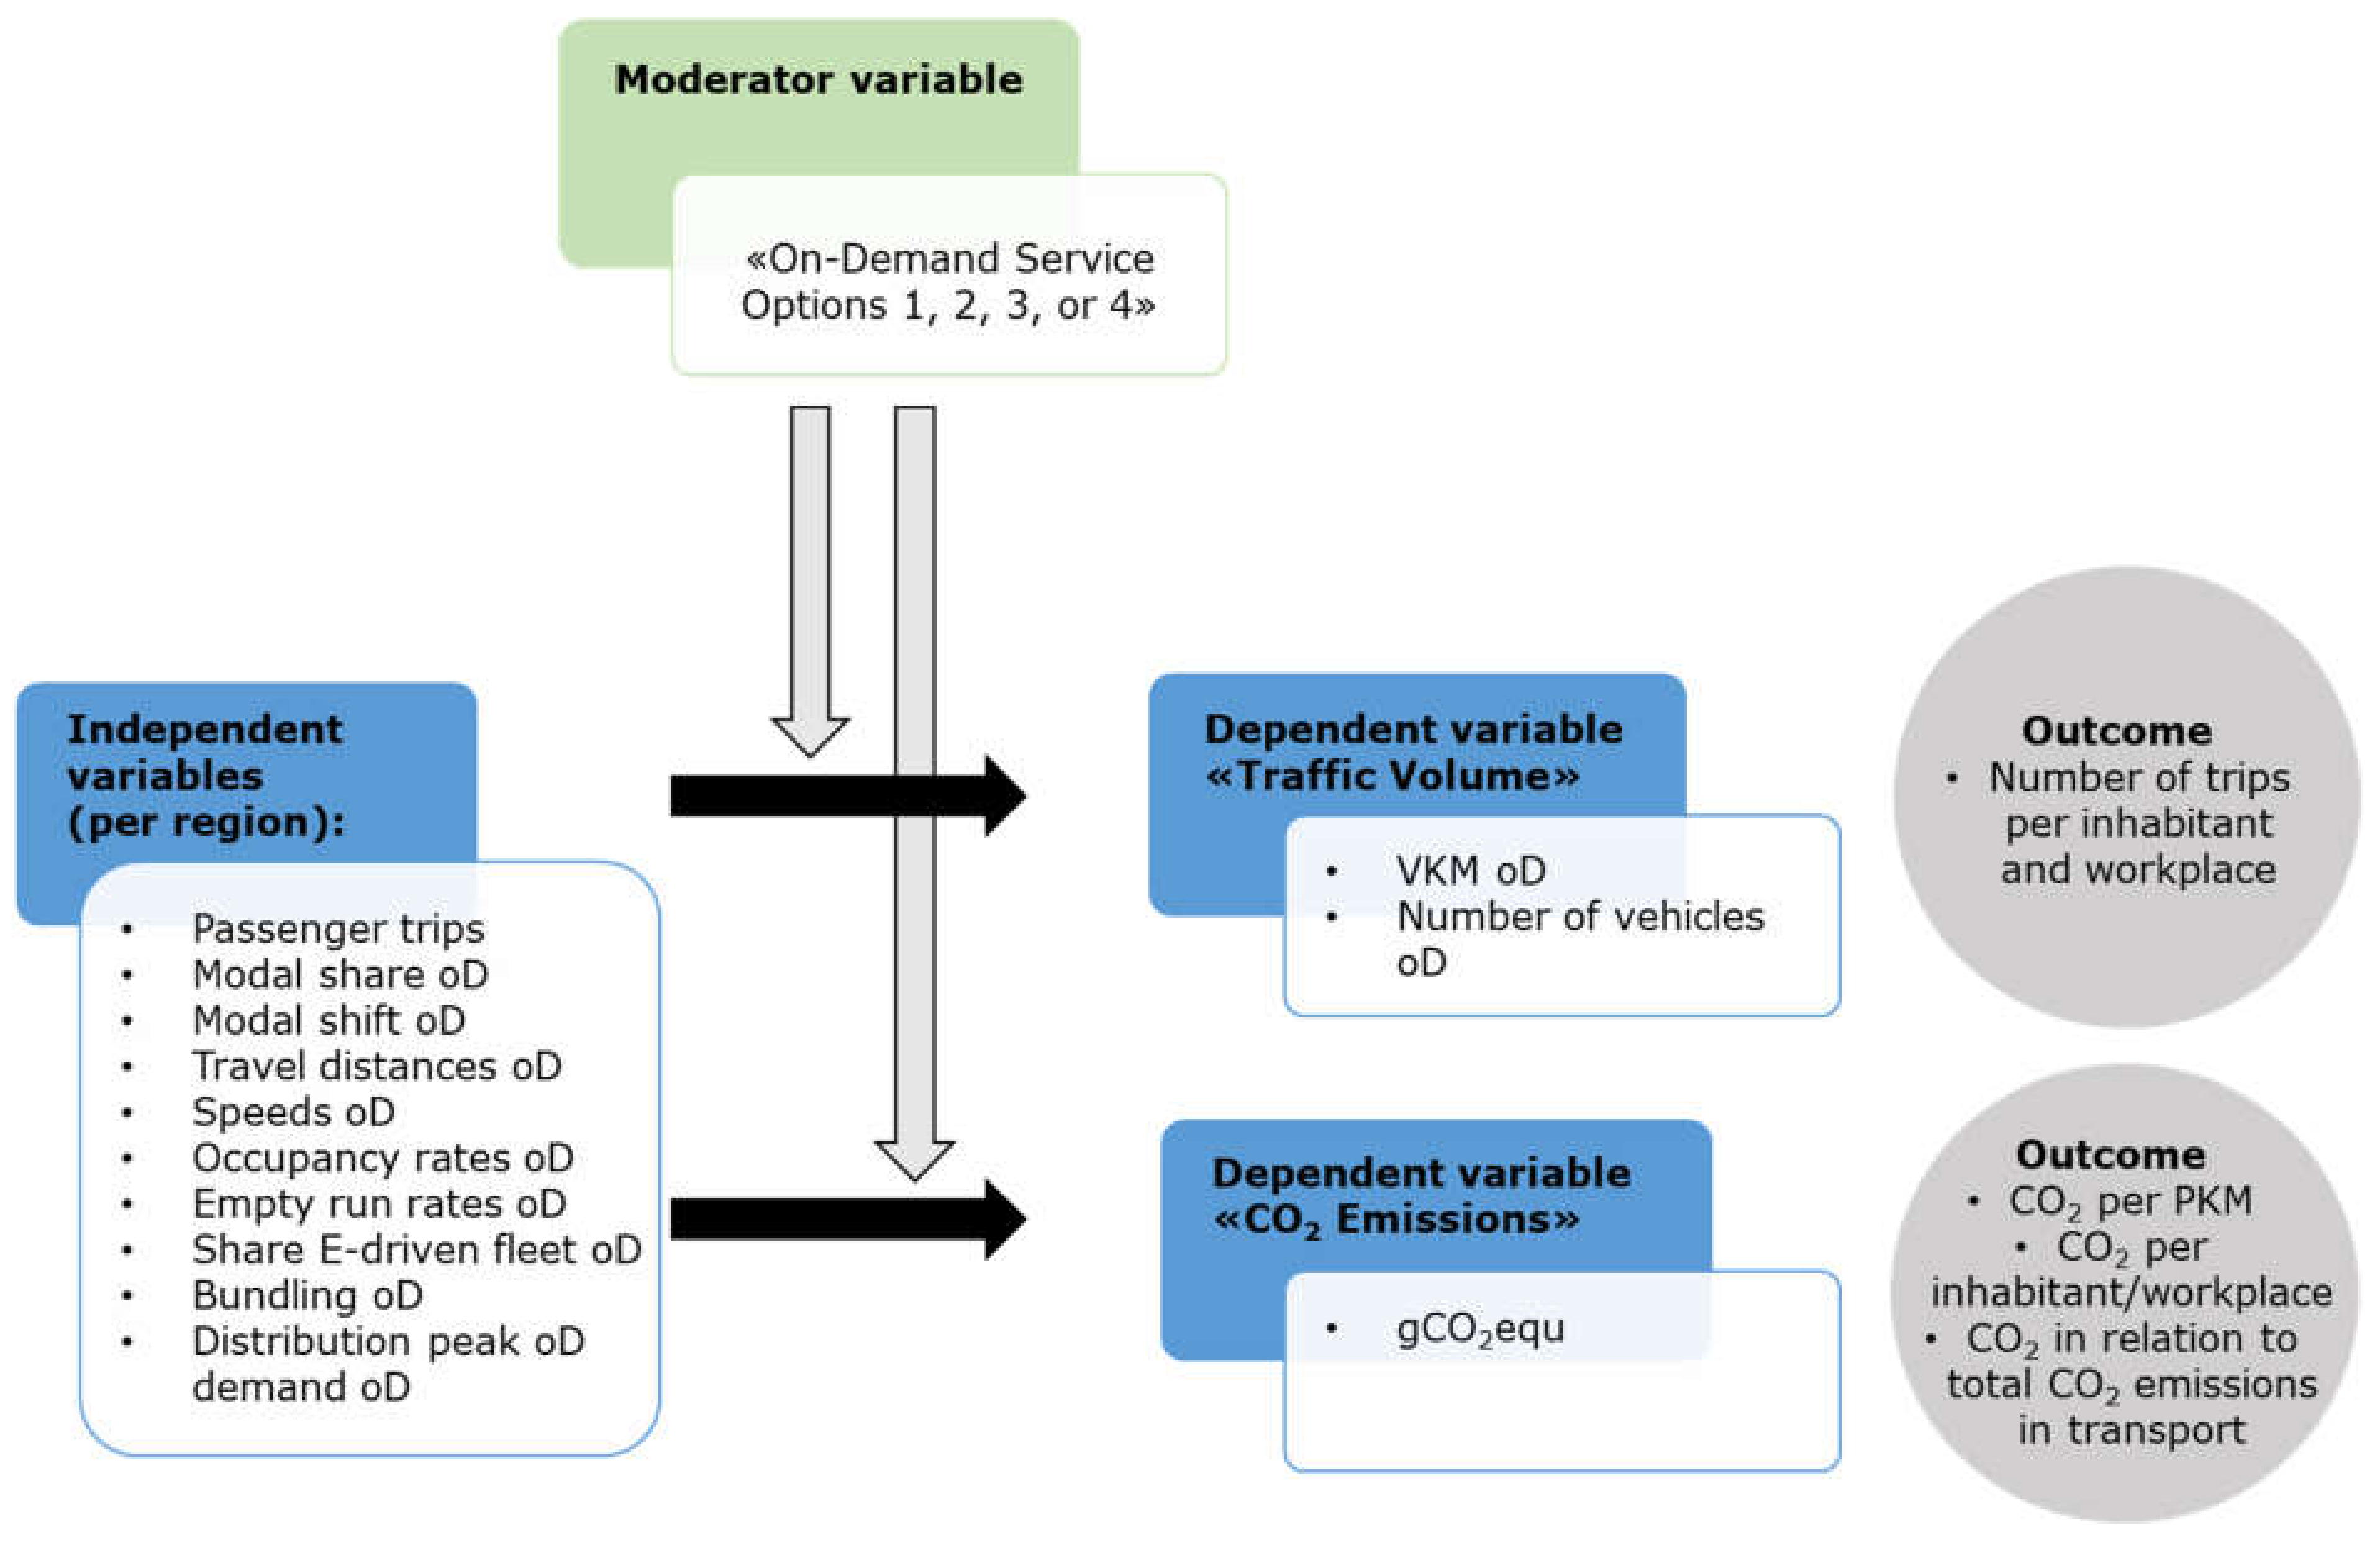
Figure 1. Sustainability simulation model used for the calculation of on-demand collective transport services (source: own illustration). (oD = on-demand; VKM = vehicle kilometres; PKM = passenger kilometres).
Sustainability 13 03091 g001
Figure 2. Modal shifts used per service option for both regions (source: own illustration). (MPT = motorised private transport).
Sustainability 13 03091 g002
Figure 3. Daily demand profiles used in the sustainability simulation model for both regions (source: own illustration).
Sustainability 13 03091 g003
Figure 4. Grams of carbon dioxide equivalent (gCO2equ)/passenger kilometres (PKM) per means of transport according to mobitool.ch.
Sustainability 13 03091 g004
Figure 5. Traffic volume of on-demand collective transport service in Glarus South per year (source: own illustration). Legend: Service Option 1 leads to an increase in vehicle kilometres of about 6300 per km2 per year. Per inhabitant and workplace, an average of around 67 trips per year is also covered by the on-demand collective transport service in line operation. The number of trips per year and km2 triggered by the on-demand collective transport service is lower for Service Option 1 than for Service Option 3 but higher than for Service Options 2 and 4.
Sustainability 13 03091 g005
Figure 7. CO2 emissions per PKM in Glarus South and Basel-St. Johann (source: own illustration). Legend: the net effect is shown on the far right in red or green. Service Options 1, 3, and 4 lead to additional CO2 emissions of 49–86 gCO2equ/PKM. Option 2 leads to a reduction in CO2 emissions of 4 gCO2equ/PKM in Glarus South and 10 gCO2equ/PKM in Basel-St. Johann.
Sustainability 13 03091 g007
Figure 8. CO2 emissions in grams of CO2eq per passenger kilometre (source: own illustration).
Sustainability 13 03091 g008
Figure 9. Assumptions of input factors per scenario (sensitivities) (source: own illustration).
Sustainability 13 03091 g009
Figure 10. Sensitivities in relation to the traffic volume in Glarus South (source: own illustration).
Sustainability 13 03091 g010
Figure 11. Sensitivities in relation to the traffic volume in Basel-St. Johann (source: own illustration).
Sustainability 13 03091 g011
Figure 12. CO2 emissions per PKM in Glarus South and Basel-St. Johann for basis, optimistic, and pessimistic scenarios (source: own illustration).
Sustainability 13 03091 g012
Table 1. Different types of on-demand collective transport services (source: own illustration).
Service OptionStopsLine OperationTimetableOperating HoursRelation to Public TransportType of VehicleSeats
1 On-demand line operationExisting bus stopsYesYes, but on demandAdapted to public transportExtensionVan8
2 On-demand public transport supplementDoor-to-door or virtual stopsNoNoOnly at off-peak times AdditionStandard4
3 On-demand public transport replacementDoor-to-door or virtual stopsNoNoAdapted to public transportReplacementVan8
4 Commercial on-demandDoor-to-door or virtual stopsNoNoNot necessarily adapted to public transportCompetitionStandard4
Table 2. Spatial comparison in the example localities (source: own illustration). (MPT = motorised private transport).
Type of SpaceExample LocalitiesAre in km2Population Density (Inhabitants/ km2)Workplaces per km2Existing Transport OfferNumber of Passenger Trips per Day 1Modal Split (in Relation to Trips)
ARural peripheral municipalityGlarus South430 221.87One train line, several bus lines (30–60-min intervals)32,000MPT: 71%
Public transport: 21%
Non-motorised: 6%
Other: 2%
BUrban municipality of a large agglomerationBasel-St. Johann2.24834110,241Several train, suburban railway and bus lines (frequency intervals)146,000MPT: 58%
Public transport: 30%
Slow transport: 11%
Other: 2%
1 Extrapolation of inhabitants and workplaces based on [49].
Table 3. Operational central input variables per service option and study region (source: own illustration based on [40]).
Service OptionUsed VehiclesAverage Occupancy without Empty Runs 2Percentage of Empty Runs 3
TypeSeatsShare of Electric DriveGlarus SouthBasel St. JohannGlarus SouthBasel St. Johann
1 On-demand line operationVan825%32.5%32.5%15%8%
2 On-demand public transport supplementStandard425%60%60%15%8%
3 On-demand public transport replacementVan825%32.5%32.5%15%8%
4 Commercial on-demandStandard425%40%40%15%8%
2 In the business case model, the average occupancy rate was calculated from the bundling of travel requests and the average number of people per travel request [40] (p. 63). For the commercial on-demand transport service, which does not necessarily have to offer a pooling function, a value between a cab and an on-demand collective transport service was used. 3 According to [40].
Table 5. Share of the new on-demand collective transport service in the modal split per service option (source: own illustration).
Service OptionShare of On-Demand Collective Transport Service 9
Glarus SouthBasel St. Johann
1 On-demand line operation6%8%
2 On-demand public transport supplement3%5%
3 On-demand public transport replacement23%35%
4 Commercial on-demand0.5%0.5%
9 The modal split represents the market share of the on-demand collective transport services. It includes the modal shift from conventional modes of transport and induced traffic.
Table 6. Traffic volume in the two examined areas (source: own illustration).
Service OptionIncrease in Vehicle Kilometres on Road per km2 per Year due to On-Demand Collective ServicesNumver of Trips per Inhabitant and Workplace per Year with On-Demand Collective ServicesNumber of Vehicle Trips per km2 per Year with On-Demand Collective Services
Glarus SouthBasel St. JohannGlarus SouthBasel St. JohannGlarus SouthBasel St. Johann
1 On-demand line operation63002,290,00067102630730,000
2 On-demand public transport supplement1000370,0003464340500,000
2 On-demand public transport replacement20,2008,900,00025944824103,210,000
4 Commercial on-demand800280,000668070,000
Table 7. Number of required vehicles (source: own illustration).
Service OptionRequired Fleet Size in Totalper km2
Glarus SouthBasel St. JohannGlarus SouthBasel St. Johann
1 On-demand line operation24850.0638
2 On-demand public transport supplement23990.0544
3 On-demand public transport replacement994290.23192
4 Commercial on-demand9180.028
Table 8. Increase in CO2 per year due to on-demand collective services (source: own illustration).
Service Optionper Inhabitant and Workplace (in Tonnes per Year)CO₂ Increase in % in Relation to Total CO₂ Emissions in Transport 10
Glarus SouthBasel St. JohannGlarus SouthBasel St. Johann
1 On-demand line operation+0.061+0.028+4.4%+2.0%
2 On-demand public transport supplement−0.001−0.003−0.1%−0.2%
3 On-demand public transport replacement+0.193+0.108+13.9%+7.7%
4 Commercial on-demand+0.005+0.002+0.4%+0.2%
10 According to [61], CO2 emissions amount to 4.35 tonnes per year and per capita. Of that amount, 32% is caused by traffic (without air traffic) [62], resulting in 1.4 tonnes per year per capita.
Publisher’s Note: MDPI stays neutral with regard to jurisdictional claims in published maps and institutional affiliations.