Article

Development of Biosorbent Derived from the Endocarp Waste of Gayo Coffee for Lead Removal in Liquid Wastewater—Effects of Chemical Activators

1
Department of Chemical Engineering, Universitas Syiah Kuala, Banda Aceh 23111, Indonesia
2
Research Center for Environmental and Natural Resources, Universitas Syiah Kuala, Banda Aceh 23111, Indonesia
3
Graduate School of Chemical Engineering, Universitas Syiah Kuala, Banda Aceh 23111, Indonesia
4
Undergraduate School of Chemical Engineering, Universitas Syiah Kuala, Banda Aceh 23111, Indonesia
5
Department of Chemistry Education, Universitas Pendidikan Mandalika (UNDIKMA), Jl. Pemuda No. 59A, Mataram 83126, Indonesia
6
Faculty of Food Science and Nutrition, Universiti Malaysia Sabah, Jalan UMS, Kota Kinabalu 88400, Malaysia
*
Authors to whom correspondence should be addressed.
Sustainability 2021, 13(6), 3050; https://doi.org/10.3390/su13063050
Submission received: 2 February 2021 / Revised: 22 February 2021 / Accepted: 26 February 2021 / Published: 10 March 2021
(This article belongs to the Special Issue Sustainable Tropical Crop Science and Agriculture Management)

Abstract

:
This study reports the development of bio-based adsorbent by utilizing coffee endocarp (CE) waste as a raw material for lead (Pb) removal from liquid wastewater. The effect of NaOH and HCl as activation precursors on the characteristics and performance of the resulting adsorbents was investigated. The prepared adsorbents were characterized using scanning electron microscopy (SEM), Fourier transform infrared spectroscopy (FTIR), X-ray diffraction (XRD), X-ray fluorescence (XRF) and Surface Area Analyzer (SAA). The characterization results confirm the positive role of the activation by either NaOH or HCl in enhancing the surface properties of the resulting adsorbents. The chemical activations removed most of impurities leading to smoother surface, pore size enlargement and enhanced surface area to pore volume ratio, which result in an enhanced adsorption capacity and Pb removal efficiency. The raw adsorbent shows 57.7% of Pb removal efficiency and sorption capacity of 174.4 mg/g. On the other hand, after the chemical treatment using HCl and NaOH, the Pb removal efficiencies increased up to 63.9% and 89.86%, with adsorption capacity of 193 and 271.58 mg/g, respectively. Though both activated sorbents demonstrate better adsorption performance compared to the non-activated CE, overall results reveal that the NaOH-activated sorbent offers better characteristic and performance than the HCl-activated sorbent.

1. Introduction

Lead (Pb) is known as one of the most toxic metals and its presence in water is threatening even at low concentrations. According to the United States Environmental Protection Agency (US-EPA) standard, the maximum allowed level of Pb in water is 0.3 mg/L [1]. The presence of lead in drinking water at a concentration of 0.5 mg/L will trigger the formation of a strong neurotoxic metal that may cause poisoning if consumed. Acute lead poisoning in humans affects the central nervous system, digestive system, liver, kidneys and can directly or indirectly cause serious health problems such as anemia, hepatitis, nephritic syndrome and encephalopathy [2,3]. In addition, lead can affect the metabolic system of calcium and vitamin D [4].
In industrial wastewater, the concentration of Pb ranges between 200–500 mg/L. Pb is usually discharged in the range of 5–66 mg/L in the battery industry, 0.02–2.5 mg/L in the mining industry and around 125–150 mg/L in the oil processing industry [1]. This content is considerably high compared to that allowed by a water quality standard of only 0.03 mg/L (Government Regulation No. 82 of 2001, Class I). Therefore, the disposal of Pb-containing industrial wastewater into drains or sewage systems is strictly regulated to reduce its environmental impacts. Several methods have been carried out to reduce levels of Pb in wastewater including extraction [5], ion exchange [6], membrane filtration [7,8] and electrodialysis [9]. However, most of these methods have significant disadvantages such as relatively high costs and low eligibility to be used in small scale industries.
Adsorption is a simple, effective and low-cost method for the removal of potential toxic metals (PTM) [4], mainly due to the simple operation and design [10]. Moreover, a wide choice of materials can be used as adsorbents with a large surface area and excellent adsorption performance [11]. Based on the nature of the source materials, adsorbents are classified into inorganic and organic. Inorganic adsorbents include zeolites, silica sand, lignite, kaolin and bentonite [12,13]. There are also organic adsorbents like ion-exchange-resins that have been proven effective to remove heavy metals like Pb [6,14,15]. In addition, there are also nature-sourced bio-sorbents which are commonly developed from the low-cost by-products of agricultural, domestic and industrial sectors [10]. The bio sorbents include powder from rubber leaf (Hevea brasiliensis), sawdust [4], rice husks [16], bagasse [17], peanut shell [1], fruit stem [18], banana peels [19], peanut powder [20], coconut coir [21], coffee grounds [22] and many others. For the specific application in Pb removal, various bio-sorbents, such as peanut shells [1], Sargassum filipendula [23], Pinus sylvestris [24], corncobs [25] and Cinnamomum camphora [26], have been used.
Aceh is one of the largest coffee-producing regions in Indonesia, particularly in Central Aceh Regency where the best coffee (known as Gayo coffee) is produced. Coffee production in Gayo Highland starts from cultivation, harvesting of the coffee bean, followed by conversion of the coffee beans into coffee bean powder or coffee grounds. It is unavoidable that many solid by-products with low economic value are produced during the processes. The derivative wastes of coffee mostly consist of coffee husk, pulp, coffee grounds and others. They are generally discharged directly into the environment as organic solid waste. In recent years, many researchers have developed methods to further re-utilize these wastes, that is, through conversion into adsorbent materials. Anastopoulos et al. [27] have summarized the recent utilization of coffee derivative wastes as high-performing adsorbent materials. In their review, the materials used were mostly coffee grounds, coffee grains and coffee husk. Despite knowing that the lignocellulosic part of coffee contains high lignin and hemicellulose, few studies have reported the utilization of coffee endocarp (CE) as a bio-sorbent material. According to the Indonesian Center of Excellence for Tropical Forest Product Utilization, the CE contains > 50% cellulose, which is far higher than that of a peanut shell as reported by Tasar and research team [1]. Therefore, in this study, the CE was chosen to be utilized as a promising biosorbent-based material. It was hypothesized that the high content of cellulose can be advantageous in fabricating a high-performing bio-sorbent, as well as to reduce the abundancy of coffee waste in Gayo Highland.
A good adsorbent is expected to possess ideal characteristics such as large surface area, high exchange of cations, excellent chemical and mechanical stabilities, small diffusion resistance and outstanding reactivity as well as affinity to pollutant [11]. However, these characteristics are hard to obtain from the raw sorbents, especially those based on natural materials. Therefore, adsorbents are generally given chemical or physical (better known as activation) treatment to open the pores or expand the surface areas because natural-based raw adsorbents contain high organic impurities [4]. Chemical activation is well known in the preparation of activated carbon. It offers many advantages such as low pyrolysis temperatures, can be done in one step, generally results in adsorbent with higher surface areas and generates high adsorption yield [28]. Chemical activation is generally carried out using acidic or basic materials such as NaOH, KOH, HCl and many others. In our previous work [29], the coffee ground waste was activated using HCl to fabricate a high-performing bio-sorbent for removal of Fe metal. Compared to the nonactivated coffee grounds, the HCl-activated bio-sorbent showed a much more porous surface morphology. In another reports [30], HCl was used to activate natural bentonite as a PTM adsorbent. They reported that the use of HCl as an activator increased the surface area and the number of active acidic sites in the adsorbent. Activation with acid improved the number of strong Lewis acid sites, which makes adsorbent more suitable for PTM removal. Whereas, NaOH has been known as the most commonly used alkaline precursor in adsorbent preparation. It was reported that the activation process using NaOH significantly increased the adsorption rate due to the increase in adsorption sites on the surface of adsorbent through the occurrence of redox reaction and carbon oxidation [28,31,32].
In this work, we selected the CE waste as the raw material for adsorbent for the removal of Pb ion in wastewater. The raw CE adsorbents were further activated chemically using both NaOH and HCl to improve the characteristics and performances. The effect of two different chemical activators on the quality and characteristics of the prepared sorbents were evaluated by the water content, ash content, iodine number and a series of analyses using scanning electron microscopy (SEM), Fourier-transform infrared spectroscopy (FTIR), X-Ray Diffractometer (XRD), and Brunauer-Emmet-Teller (BET) surface area analysis. The performance of the resulting adsorbents was further studied on the adsorption of artificial lead-containing wastewater. The isotherms and kinetics of adsorption are also discussed.

2. Materials and Methods

2.1. Materials

The CE as the raw material for adsorbent was obtained from the solid waste of Gayo Arabica coffee production facilities located in Central Aceh Regency, Indonesia. Pb(NO3)2 (Pudak Scientific) was used as the source of Pb ion in the model wastewater for the adsorption test. Other chemicals of 0.1 N of Iodine solution (Sigma Aldrich), the starch indicator (1%) (LabChem), 0.1 N of sodium thiosulfate (The Science Company) and distilled water were employed as supporting materials during the preparation and characterization of the produced adsorbents.

2.2. Preparation and Activation of CE Adsorbent

First, 1 kg of CE waste was washed, sun-dried, then carbonized in a muffle furnace at a temperature of 350 °C for 2 h. After that, the resulting carbon was refined using mortar and pestle, then sieved using a 100–120 mesh. The chemical activation process was then carried out by immersing 25 g of the activated carbon in a 0.5 N NaOH solution and 0.5 N HCl, under a stirring speed of 250 rpm for 3 h. Following that, each mixture was filtered and the resulting adsorbents were washed with distilled water to a neutral pH. The adsorbent was then dried in an oven at a temperature of 110 °C until reaching a constant weight to evaporate the remaining water. To avoid contact with moisture in a humid air, the adsorbents were stored in a desiccator until further use.

2.3. Characterizations of the Sorbent

To evaluate the effects of activation using different precursors on the characteristics of CE-based adsorbents, several characterizations and analyses were performed. Morphological structure was analyzed using Scanning Electron Microscopy (SEM, FEI, Inspect-s50), the chemical bonds spectra on the surface of the adsorbents using the Fourier Transform Infra-Red Spectrophotometer at resolution of 2 cm−1 (IRPrestige21, Shimadzu), the crystalline structure of the adsorbent using the X-Ray Diffraction (PanAnalytical, Expert Pro, Malvern, UK), the elemental composition analysis on the adsorbent surface using the X-Ray Fluorescence (PanAnalytical, Minipal 4), and the specific surface area and pores using the Brunauer-Emmett-Teller (BET) method.
The resulting adsorbents were also characterized in terms of water content (WC, %), ash content (AC, %) and iodine number using Equations (1) and (2) [18]:
WC   =   a b a × 100 %
AC   =   a b × 100 % .
The symbols a and b denote the weight of adsorbent before and after the heat treatment (g), respectively. The iodine number (In, mg/g) measurements were conducted by means of titration using sodium thiosulphate as the standardized solution, starch as the indicator and calculated using Equation (3).
In =   10 N × V 0.1 S × 12.69 × 2.5 ,
where V represents the spent volume of the sodium thiosulfate for titration (L), N is concentration of sodium thiosulfate (N), S is the mass of carbon (g), and 12.69 is a constant that represents the conversion factor from mEq sodium thiosulfate per grams of iodine (the molecular weight of iodine is 126.9 g/mol). All experiments were conducted in five tries and the averaged data were taken as the final results.

2.4. Adsorption of Simulated Lead Wastewater Experiment

The performance of prepared adsorbents was tested for the removal of Pb in a simulated Pb solution made of 300 mg/L Pb(NO3)2. The adsorption test was carried out batch-wise by contacting 0.1 g of adsorbent (each type) to 100 mL of Pb(NO3)2 solution for varied durations of 30, 60, 90, 120 and 150 min at room temperature. The mixture was stirred under a stirring speed of 250 rpm at room temperature. After each varied adsorption time, the feed was separated from the adsorbent and the final concentration was measured for the calculation of adsorption capacity (AC, mg/g) and the adsorption efficiency (AE, %) using Equations (4) and (5), respectively.
AC = C 0 C t × V W
AE = C 0 C t C 0 × 100 % ,
where C0 and Ct correspond to concentrations of Pb before and after adsorption (mg/L), V represents the volume of Pb solution used in the experiment (L), and W is the weight of the adsorbent (g). The experiment was repeated five times for each adsorbent variation and averaged data were taken as the final results.

2.5. Isotherm and Kinetics of Adsorption

The adsorption isotherm was evaluated by means of Langmuir, Freundlich, and Dubinin–Radushkevich isotherm models using Equations (6)–(8), respectively.
C e q e =   1 K L · q m + C e q m
log q e = log K F +   1 n log C e
ε = R T l n 1 + 1 C e   ,
where Ce is the equilibrium concentration of adsorbate (mg/L), qe is the adsorption capacity (mg/g), KL is the Langmuir isotherm constant, qm is the maximum adsorption capacity (mg/g), KF is the Freundlich isotherm constant (mg/g), n is the adsorption intensity, ε is the Dubinin–Radushkevich isotherm constant.
The kinetics of adsorption were determined by using the pseudo-first order and pseudo-second order kinetic equations as given in Equations (9) and (10), respectively. Symbol qt denotes the adsorbed amount of Pb at time ‘t’ (mg/g), k1 is the pseudo-first order rate constant [min−1], and k2 is the pseudo-second order rate constant [g/mg.min].
d q t d t = k 1 q e q t
l n q e q t = ln q e k 1 t   .

3. Results

3.1. Characteristics of CE Activated Carbon

The carbonization process was carried out to break down cellulose into carbon elements and remove non-carbon elements from the base material. It is generally accepted that the higher the content of cellulose in the material, the more beneficial it is to produce an adsorbent [10]. Therefore, the prepared adsorbents are also polished for the further improvement of quality through activations. Chemical activation is expected to remove impurities to produce carbon with larger pores and higher surface area. The bigger the surface area of a carbon, the higher the adsorption capability [33].
Table 1 shows the characteristics of the produced sorbents. The analysis was done in terms of water content, ash content and iodine number. The results show that both the NaOH-activated and HCl-activated CE sorbents meet the Standard Quality of activated carbon according to Indonesian National Standard (SNI) No. 06-3730-1995.
Adsorbent with a low water content is favorable because it has a better sorption of gases or liquids. All of the prepared sorbents in this work have a relatively low water content, which meet the national quality standard No. 06-3730-1995 (Standard Nasional Indonesia). The ash content was analyzed to determine the content of metal oxides, minerals and impurities in an activated carbon. High ash content reduces the quality of activated carbon because of the high amount of inorganic materials contained in the sorbent. Table 1 shows that the CE sorbents have low inorganic impurities and shows suitability for adsorption application.
Another parameter to determine the quality of adsorbent is iodine adsorption value. It represents the sorbent capacity to adsorb low molecular weight substances in a liquid phase. Data in Table 1 show that all CE-based sorbents meet the standard in term of the iodine value. The increasing amount of adsorbed iodine by the adsorbents, especially those with activation, is due to the low content of impurities on the surface thanks to the chemical activation. According to Lillo-Ródenas et al. [28], activation using NaOH enhanced the adsorbent surface through two steps of reactions, one of which included the etching of carbon to form pores. Based on water content, ash content and absorption of iodine shows that the activated carbon produced in this study is suitable to be used as an adsorbent in the reduction of Pb ion.

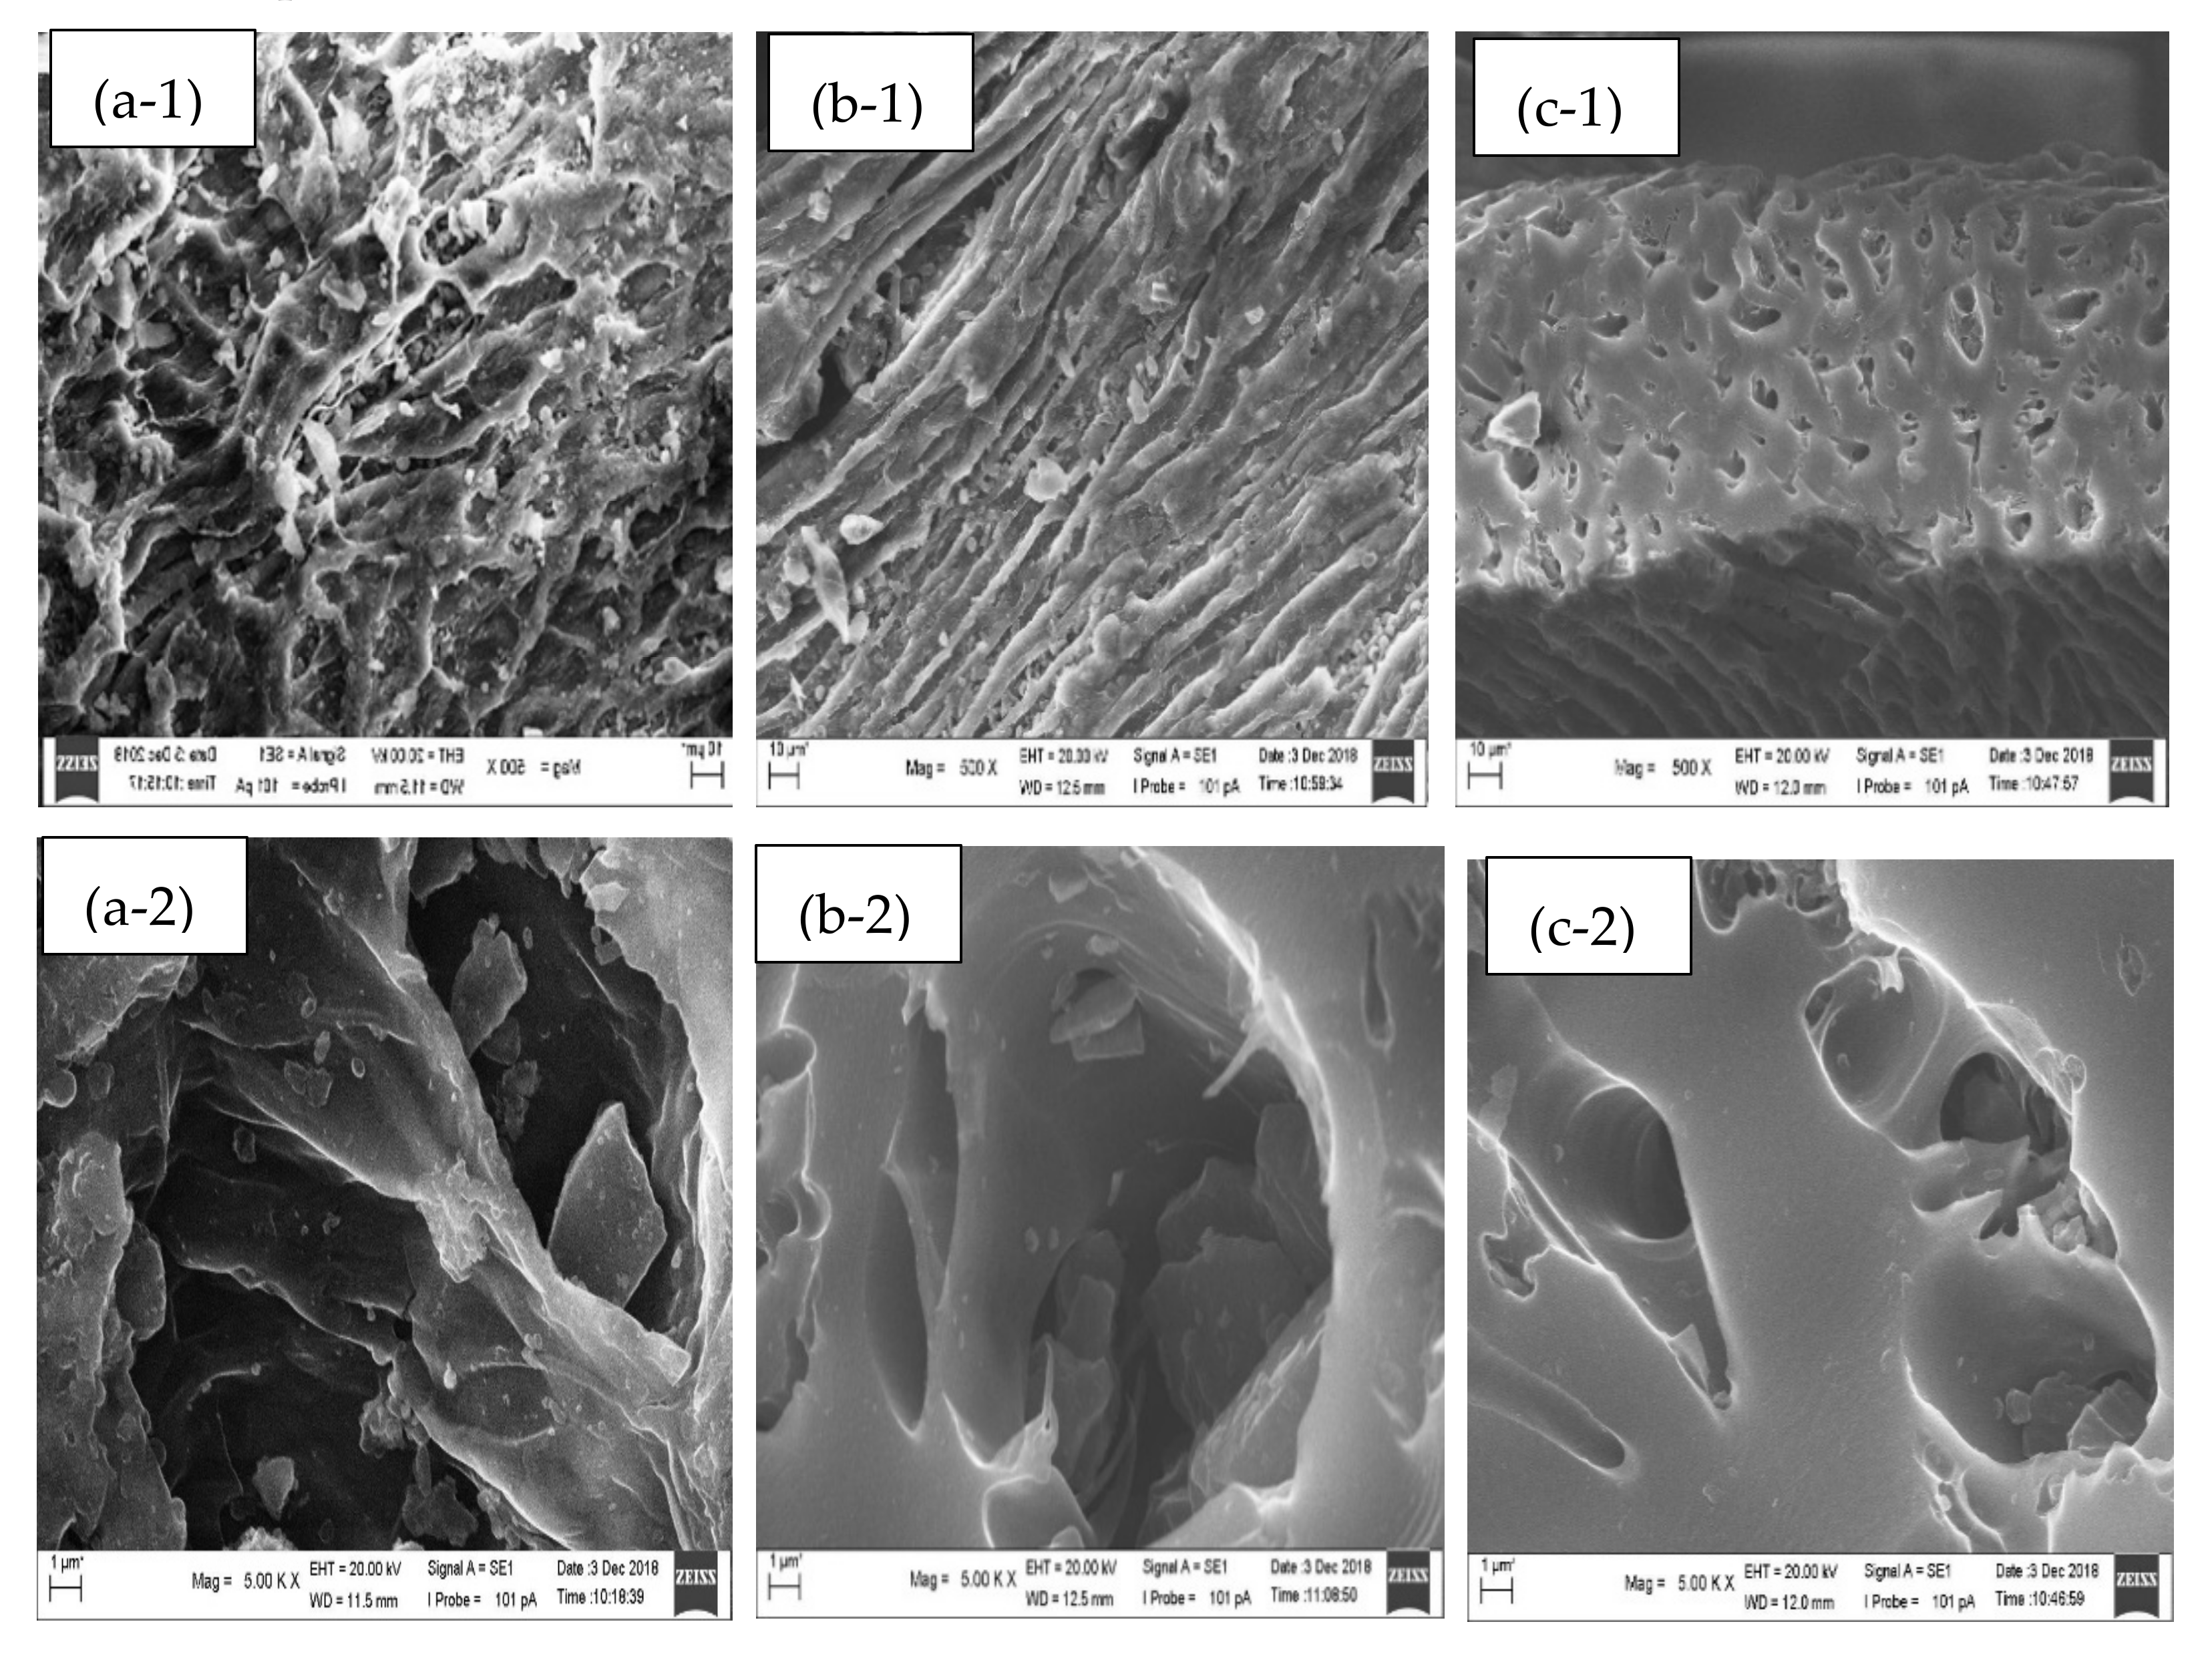
3.2. Morphological Analysis

Figure 1 shows obvious differences between the surface of the non-activated and the activated sorbents. The nonactivated sorbent has a dirty and rough view of its surface, which can be attributed to the presence of impurities that spread over the surface pores. These impurities are unwanted hydrocarbon and inorganic components, as also reflected by the ash content data in Table 1. These impurities can be removed through the acid or alkaline treatment, as shown by the morphologies of the chemically activated sorbents. As seen in Figure 1b,c, the surfaces of the activated sorbents are cleaner and smoother after the activation using HCl or NaOH (0.5 M) compared to the one without activation. The morphology with fewer impurities was obtained from erosion of tar and inorganic materials dissolved by the chemical activators. The loss of tar and minerals from the surface of the adsorbent enlarged the pores and positively impact the surface area of the adsorbent and simultaneously increases the adsorption capacity [34]. Similar results were also reported by others [35]. They fabricated a bio-sorbent based on wheat bran. Without chemical activation, the structure of the resulting sorbent had a surface covered with granules and no display of pore. Whereas, after activation with NaOH, the surface displayed numerous pores.

3.3. Chemical Functional Groups Analysis

Figure 2 shows the results of FTIR analysis at a spectra range of 500–4000 cm−1. The absorption of the -OH, C-H, C=O and C=C of the aromatic groups dominates all CE-based sorbents. Absorption of the -OH group, usually detected at a wavenumber range of 4000–3400 cm−1 [36], is seen at 3620 and 3743 cm−1 for the non-activated sample; at 3645 and 3743 cm−1 for the NaOH-activated sample; and at 3523 and 3628 cm−1 for the CE sorbent activated by HCl. These results indicate that all CE-based sorbents still have hydroxyl groups from organic contents in the CE that resisted degradation during the chemical activations and the carbonization process.
Previous research revealed that the organic adsorbent containing C-H group in alkane is usually marked by the appearance of peak at a wavenumber range of 2850–2970 cm−1 [37]. From Figure 2, the C-H group in the CE-based sorbents can be identified at wavenumbers of 2964 cm−1 (without activation); 2970 cm−1 (NaOH-activated); and 2962 cm−1 (HCl-activated). Besides that, the aromatic C=C group is detected at wavenumbers 1649–1452 cm−1 for the non-activated sorbent, at 1649–1450 cm−1 for the NaOH-activated sorbent and at a wavenumber range of 1583–1512 cm−1 for the HCl-activated sorbent. These results agree well with the earlier works in which the aromatic C=C group commonly appears in a spectra range of 1690–1450 cm−1 [38].
The presence of the C=O group from the aldehyde, ketone and carboxylic acid compounds for all samples can be identified as follows—at a wavenumber of 1693 cm−1 for the non-activated and the NaOH-activated sorbents IR, at a wavenumber of 1697 cm−1 in IR result of the HCl-activated sorbent, as also reported earlier [36]. Those peaks indicate that the cellulose, lignin and hemicellulose components were not all decomposed during carbonization. The CE adsorbent has several functional groups, which generally contain -OH, CH, C=O and C=C with peaks that are not so sharp. It suggests that, though in low content, the CE adsorbents still contain cellulose, lignin and hemicellulose that were not fully carbonized.
If observed closely between the IR of the non-activated and the activated sorbents, there are some visible shifts of peaks. This shift of peaks indicates that the activation process affects the absorption intensity as suggested by others [39]. The CE adsorbent has several functional groups, which generally contain -OH, CH, C=O and C=C with rather broad peaks. It suggests that, though low in content, the CE adsorbents still contain cellulose, lignin and hemicellulose residual that was failed to be broken down into carbon during carbonization.

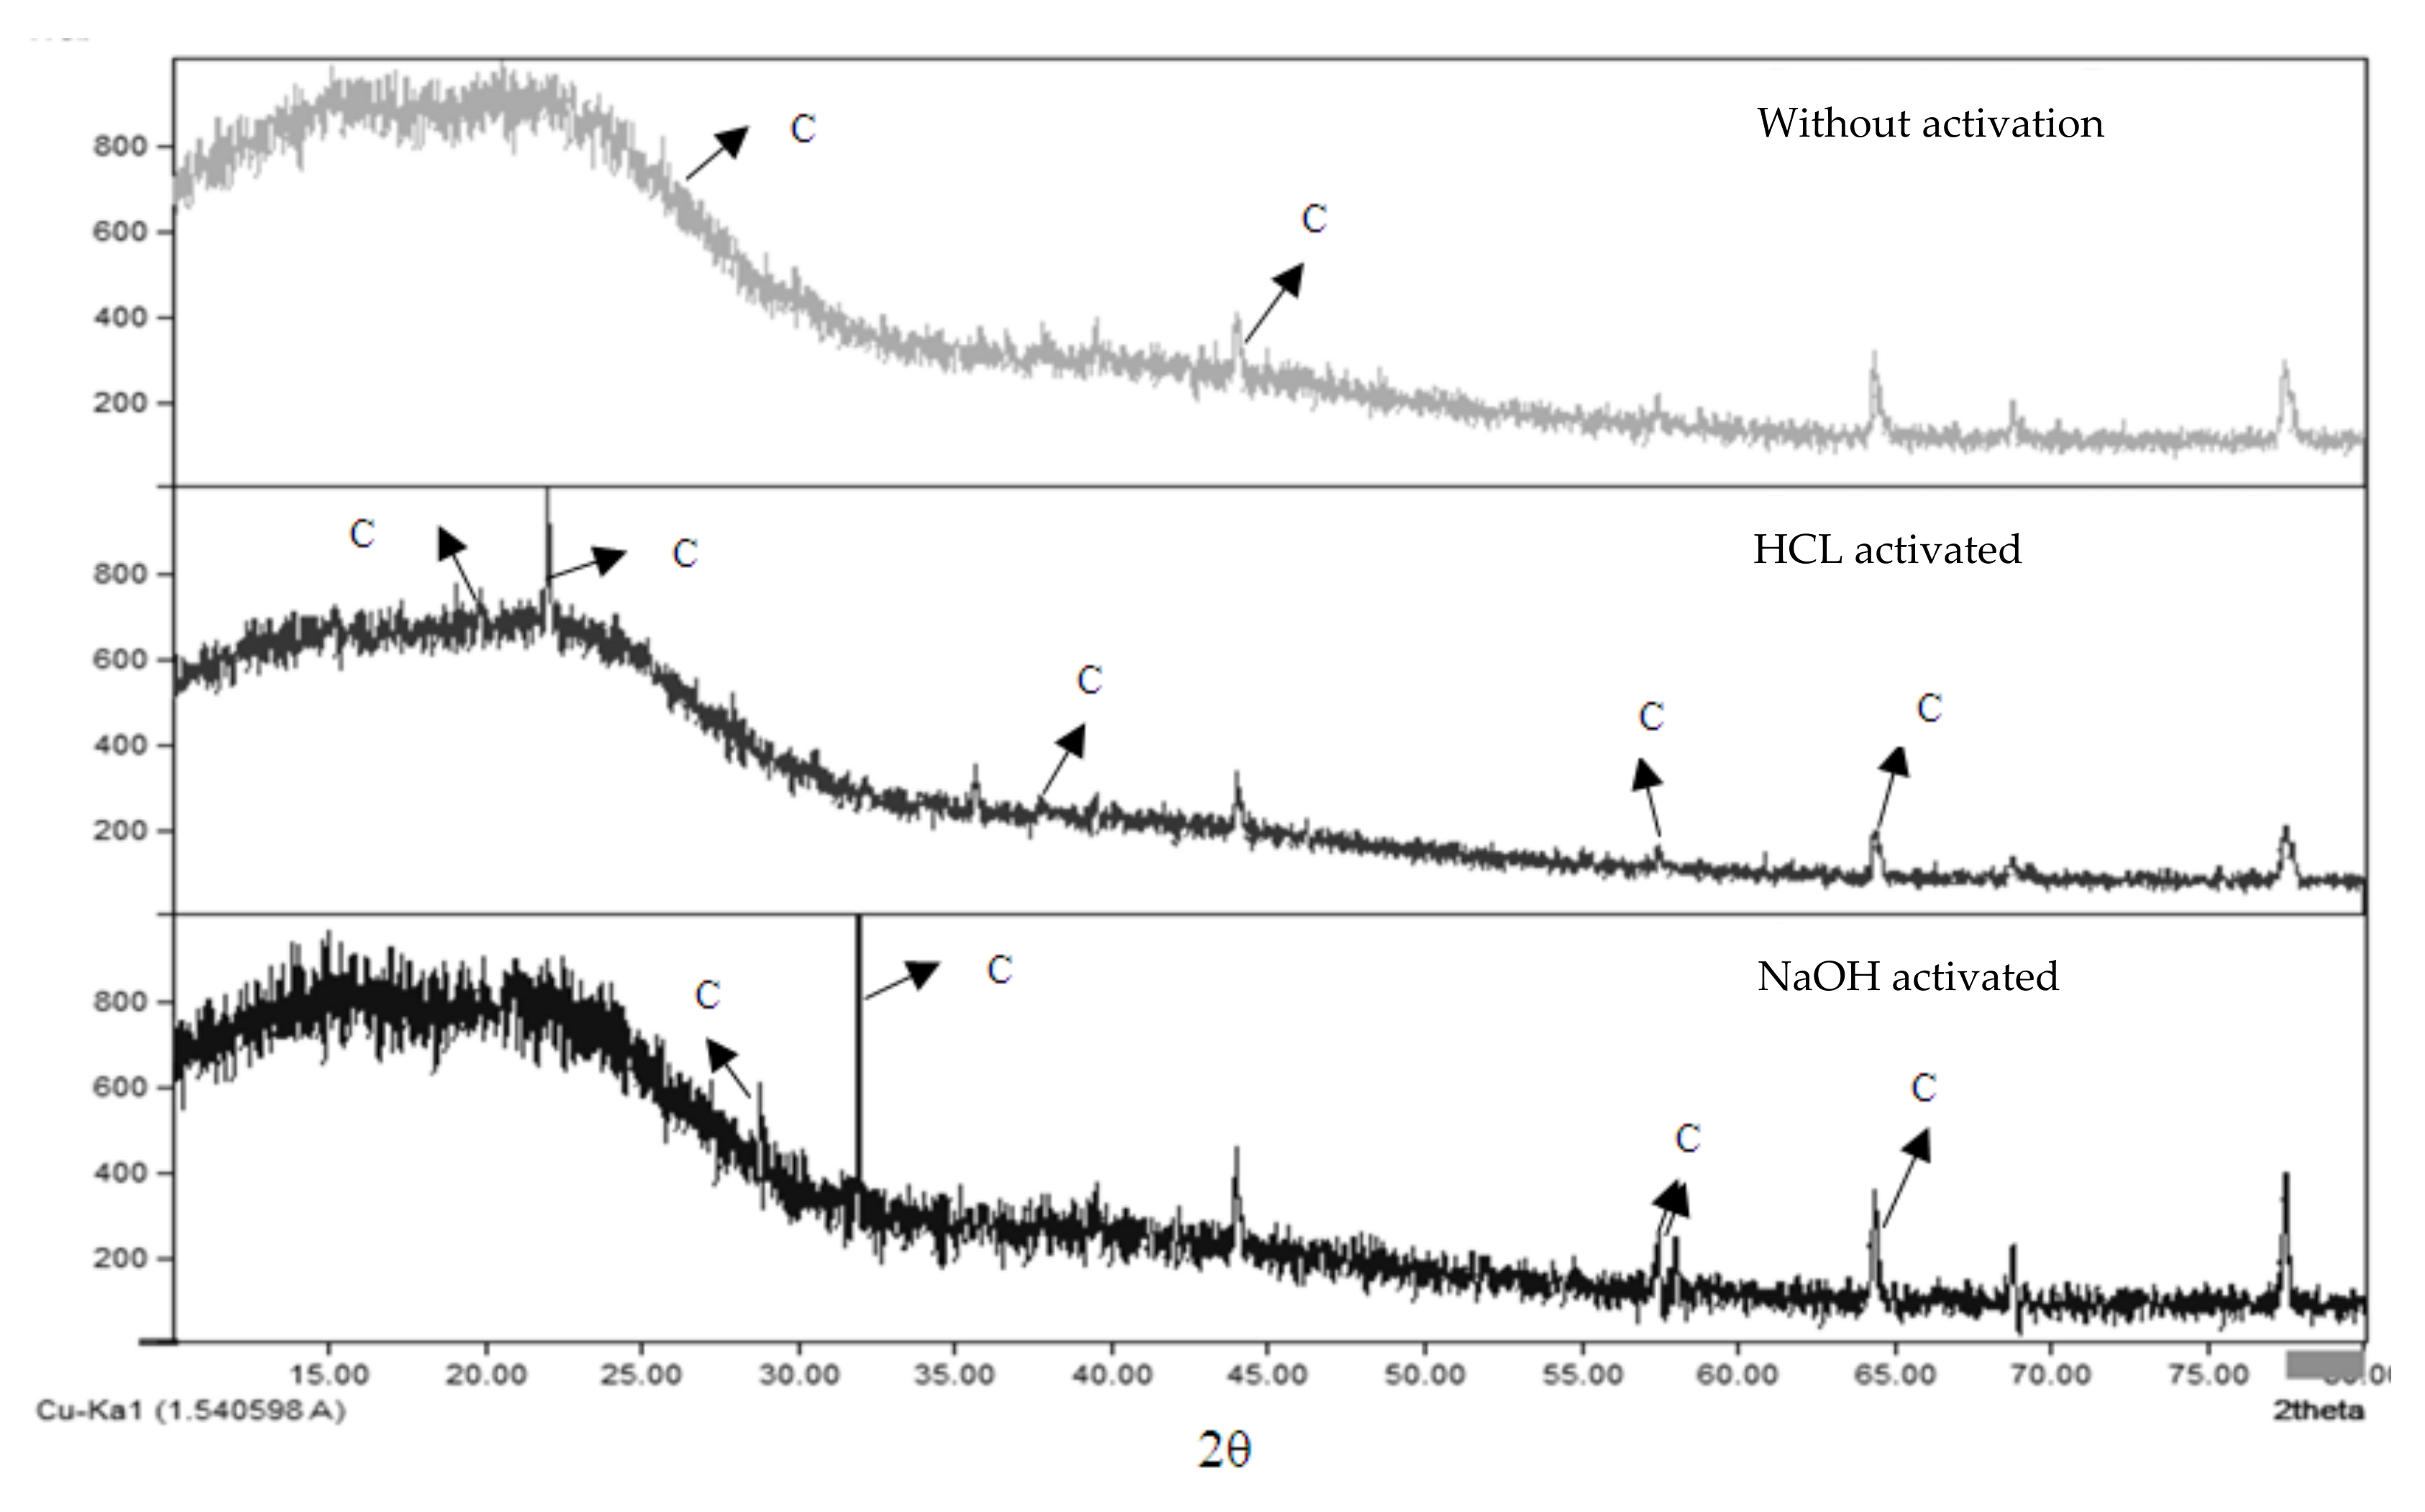
3.4. XRD and XRF Analysis

Figure 3 shows the results of X-ray diffraction analysis on the three adsorbent samples. It was reported that activated carbon shows a highly irregular microcrystalline structure in which graphite micro crystals are randomly oriented [40]. The presence of carbon in the non-activated sorbent can be seen in 2θ = 26.28° (d = 3.3887 Å) and 44.27° (d = 2.0443 Å). The non-existent of a sharp peak in the non-activated sorbent confirms that this adsorbent has an amorphous structure [41].
In the HCl-activated adsorbent, several peaks that indicate the presence of chlorine (Cl) are detected, namely the 2θ in an area of = 19.66° (d = 4.5114 Å); 22.75° (d = 3.9052 Å) 37.84° (d = 2.3755 Å); 57.42° (d = 1.6036 Å) and 64.34° (d = 1.4468 Å). Meanwhile, some broad and sharp peaks are seen in the NaOH-activated sorbent. Sharp peaks are the result of better alignment of the layers that represent the characteristic of the crystalline structure [41]. The XRD pattern of the NaOH-activated sorbent contains several sharp peaks in the region of 2θ = 28.77° (d = 3.1005 Å); 32.10° (d = 2.7863 Å); 57.82° (d = 1.5935 Å); 58.44° (d = 1.5781 Å) and 64.37° (d = 1.4461 Å), which can be attributed to the presence of sodium (Na). The sharpness of the peak indicates that the Na crystal is relatively large, although it is still in the micro range.
To further investigate the composition of the CE adsorbents, XRF analysis was performed. As seen in the Table 2, it appears that SiO2 is the main component in the non-activated CE adsorbent, the NaOH-activated CE adsorbent and the HCl-activated CE adsorbents with compositions of 47.32%, 56.72% and 60%, respectively. Silica is the most desired and important component in an adsorbent as it greatly affects the reactivity of an adsorbent during adsorption process [12,13]. Therefore, it is expected that the NaOH-activated CE adsorbent to show a better performance in comparison to the rest.

3.5. Surface Area Analyzer (SAA)

Table 3 shows that the surface area of the non-chemically activated adsorbent is 1.8405 m2/g with a pore volume of 0.001836 cm3/g. The surface area of the HCl-activated adsorbent is 1.4057 m2/g with a pore volume of 0.001262 cm3/g, meanwhile the NaOH-activated sorbent has a surface area and pore volume of 0.9707 m2/g and 0.000689 cm3/g, respectively. In general, the chemically activated sorbents have a higher surface area to pore volume ratio compared to the non-activated CE adsorbent. If further compared, the NaOH-activated sorbent poses the highest surface area to pore volume ratio, and the largest pore size amongst the others. This is due to the removal of impurities through hydrolysis and deacetylation of cellulose fiber, as well as the dissolved of hemicellulose and pectin from the cell wall of adsorbent as reported in a published literature [42]. It was also reported that the greater the ratio of surface area to pore volume ratio, the more reactive the adsorbent [43].
The BET test results also reveal that the average pore diameter for the non-activated sorbent is 39.9030 Å, while the adsorbents activated by 0.5 M HCl and 0.5 M NaOH have an average pore diameter of 42.8215 Å and 47.8671 Å, respectively. According to Mariana et al. [29], the mesoporous diameter is in the range of 20–500 Å. This shows that the adsorbents obtained in this study fall under mesoporous classification.

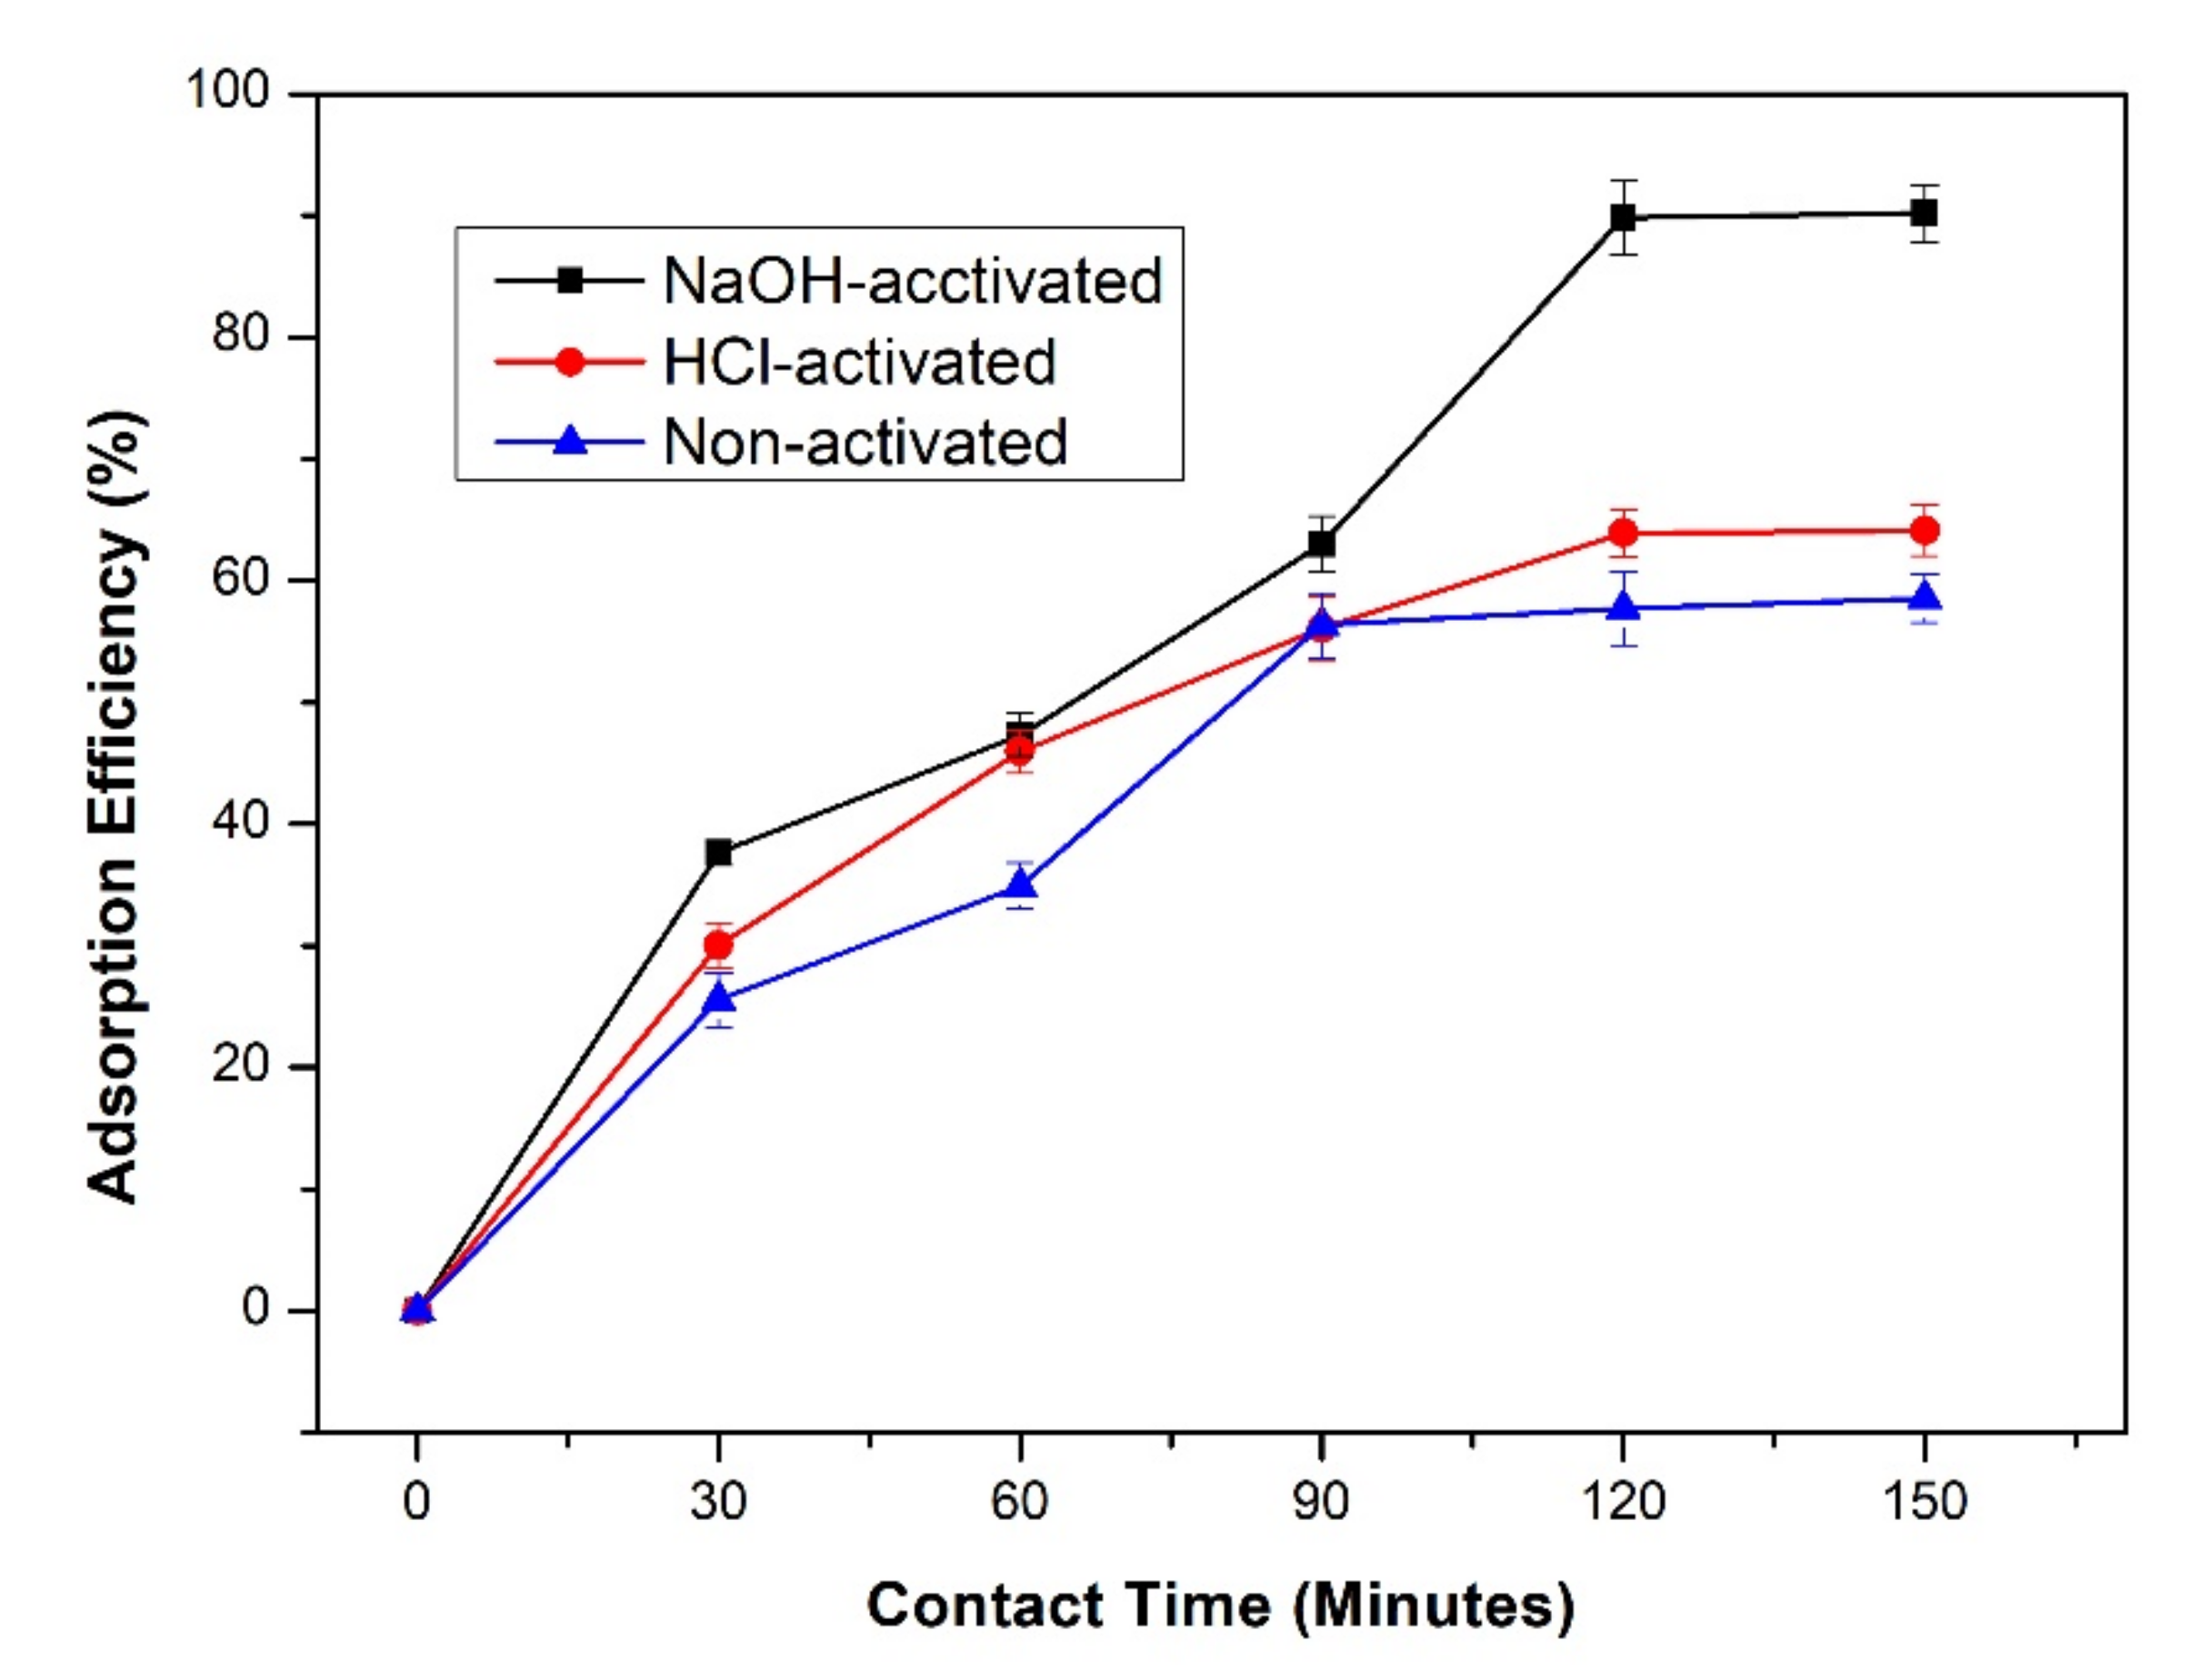
3.6. Effect of Contact Time on the Adsorption Efficiency and Capacity of Lead

The adsorption process is influenced by several factors, namely contact time, initial concentration of feed, adsorbent dose and pH of the feed solution [44]. As contact time is one of the important factors, it is necessary to evaluate the optimum contact time for adsorption. It is defined as the time required by activated carbon adsorbent to absorb the maximum amount of Pb. The relation between contact time and the adsorption efficiency of Pb using adsorbents developed in this study is shown in Figure 4.
Figure 4 shows that the longer the contact time between adsorbate and adsorbent, the higher the efficiency of absorption until the equilibrium is reached. For the non-activated sorbent, the adsorption occurs relatively fast within the first 90 min and remains constant after 120 min. The fast adsorption at the beginning occurs due to the large availability of the adsorbent sites, hence Pb ions can easily interact with the sites [1]. For the non-activated CE, the adsorption equilibrium is obtained at 90 min contact time with an adsorption efficiency of 56.34%. The equilibrium time obtained in this study is faster than that of reported by Tasar et al. [1] that used a peanut shell-based sorbent for the removal of Pb that achieved equilibrium state after contact time of 120 min with an adsorption efficiency of 65.75%.
The NaOH or HCl-activated sorbents show higher adsorption efficiencies than the non-activated ones. As seen in Figure 4, the adsorption process reaches constant values at 120 min with the adsorption efficiencies for the HCl-activated and the NaOH-activated sorbents are 63.92% and 89.86%, respectively. This result is supported by the SEM imaging (Figure 1) which show that after activation using either NaOH or HCl, the sorbents have cleaner surfaces with no impurities covering the surface. Therefore, the sorbents have more area for adsorption [45]. Higher adsorption efficiencies in the activated adsorbents can be associated with available adsorption sites (surface functional groups) on the surface of adsorbents. Figure 4 also shows that the NaOH-activated sorbent had the highest absorption efficiency. This is because the acid activator (HCl) promotes formation of more positive charge, whereas, the base activator (NaOH) causes the adsorbent to be more negative-charged which is more beneficial in the adsorption process [46]. The Na ion from NaOH has good affinity to functional groups that carry negative ions, thus, during the adsorption process the ion exchange between Na ions and metal ions can be promoted [47].
Figure 5 displays the relationship between contact time and capacity of adsorption. Capacity of adsorption defines the quantity of adsorbate that can be adsorbed by per unit mass or volume of adsorbent [44]. It shows that the adsorption capacity increases with prolonged contact time, in which the amount of adsorbed Pb also increases until equilibrium. At the early duration of adsorption (30–120 min) using the NaOH-activated sorbent, the Pb absorption rate is very large. After 120 min, the equilibrium state (te) occurs for both of the activated sorbents. On the other hand, the optimum contact time of adsorption using the non-activated sorbent is achieved at 90 min. The long contact time is required if the adsorbent has bigger capacity to adsorb more adsorbate. Adsorbent with a high capacity has more reactive sites on the adsorbent surface that are available to take up the adsorbate molecules [48]. This is considered a satisfactory result given that the initial concentration of artificial Pb used was high (300 mg/L).
Figure 5 also shows that the maximum adsorption capacity is 272.56 mg/g obtained by the NaOH-activated CE sorbent. This is supported by the data presented in Table 2 which shows that it has a greater iodine absorption value of 1628.6 mg/g compared to that of the HCl-activated of 1226.7 mg/g. This result is in accordance with that of research conducted by Gaya et al. [49]. Table 4 shows the comparison of the maximum adsorption capacity obtained in this work with several other studies using different adsorbent materials.

3.7. Effect of Activator Type on the Adsorption Efficiency and Capacity

The involvement of activators in the chemical activation of the adsorbent greatly influences the ability of the adsorbent to absorb the adsorbate moiety, as summarized in Figure 6. Figure 6 also obviously shows that the NaOH-activated sorbent produces the greatest removal efficiency of 89.9% and the adsorption capacity of nearly 300 mg/g (272.56 mg/g) compared to the HCl-activated and the non-activated sorbents. From all of these results, it is clear that the NaOH-activated showcased the best performance in terms of efficiency and the capacity of adsorption in comparison to two other prepared sorbents; therefore, further investigation in the following sections will only focus on NaOH-activated sorbent. The adsorption process using sorbents activated by NaOH and HCl resulted in higher efficiency values compared to the sorbent without activation. This is due to the effect of chemical activation, which can release impurities on the adsorbent so that the pores of the active site are widened and promote formation of functional groups effective in absorbing metal ions [34]. It is suggested that the complex interaction between adsorbent and metal ions not only occurs through chelation or ion exchange, but also through bonding between surface functional groups [55].

3.8. Adsorption Isotherms

The Langmuir isotherm of NaOH-activated CE sorbent in Pb adsorption was obtained by plotting Ce vs. Ce/qe, whereas the Freundlich adsorption isotherm was obtained by plotting between log Ce vs. log qe, and the Dubinin-Radushkevich isotherm was evaluated by plotting a curve between ln Ce vs. ε2 to obtain the Kad (Dubinin–Radushkevich isotherm constant, mol2/kJ2), and qs (theoretical isotherm saturation capacity, mg/g). The obtained constants for all three isotherms are summed in Table 5. Determination of the equilibrium model can be done by looking at the highest determinant coefficient (R2) from the graph generated from each adsorption isotherm plot.
Based on data in Table 5, the adsorption of Pb by the NaOH-activated CE sorbent tends to follow the Langmuir isotherm model. This can be seen from the determinant coefficient (R2) of the model (of 0.99), which is higher than the determinant coefficient of the Freundlich isotherm model (of 0.85). The finding is in line with a previous study using an adsorbent derived from zeolitic tuff [56], with an R2 value of 0.99. Adsorption onto an oil palm empty fruit bunches as sorbent also followed the Langmuir model with an R2 value of 0.997 [52]. The adsorption mechanism in the Langmuir isotherm suggests that the active sites found on the surface of the adsorbent are homogeneous, where the adsorbent can only adsorb one Pb metal ion for each active site and there is no interaction between Pb with the adjacent active sites [52].

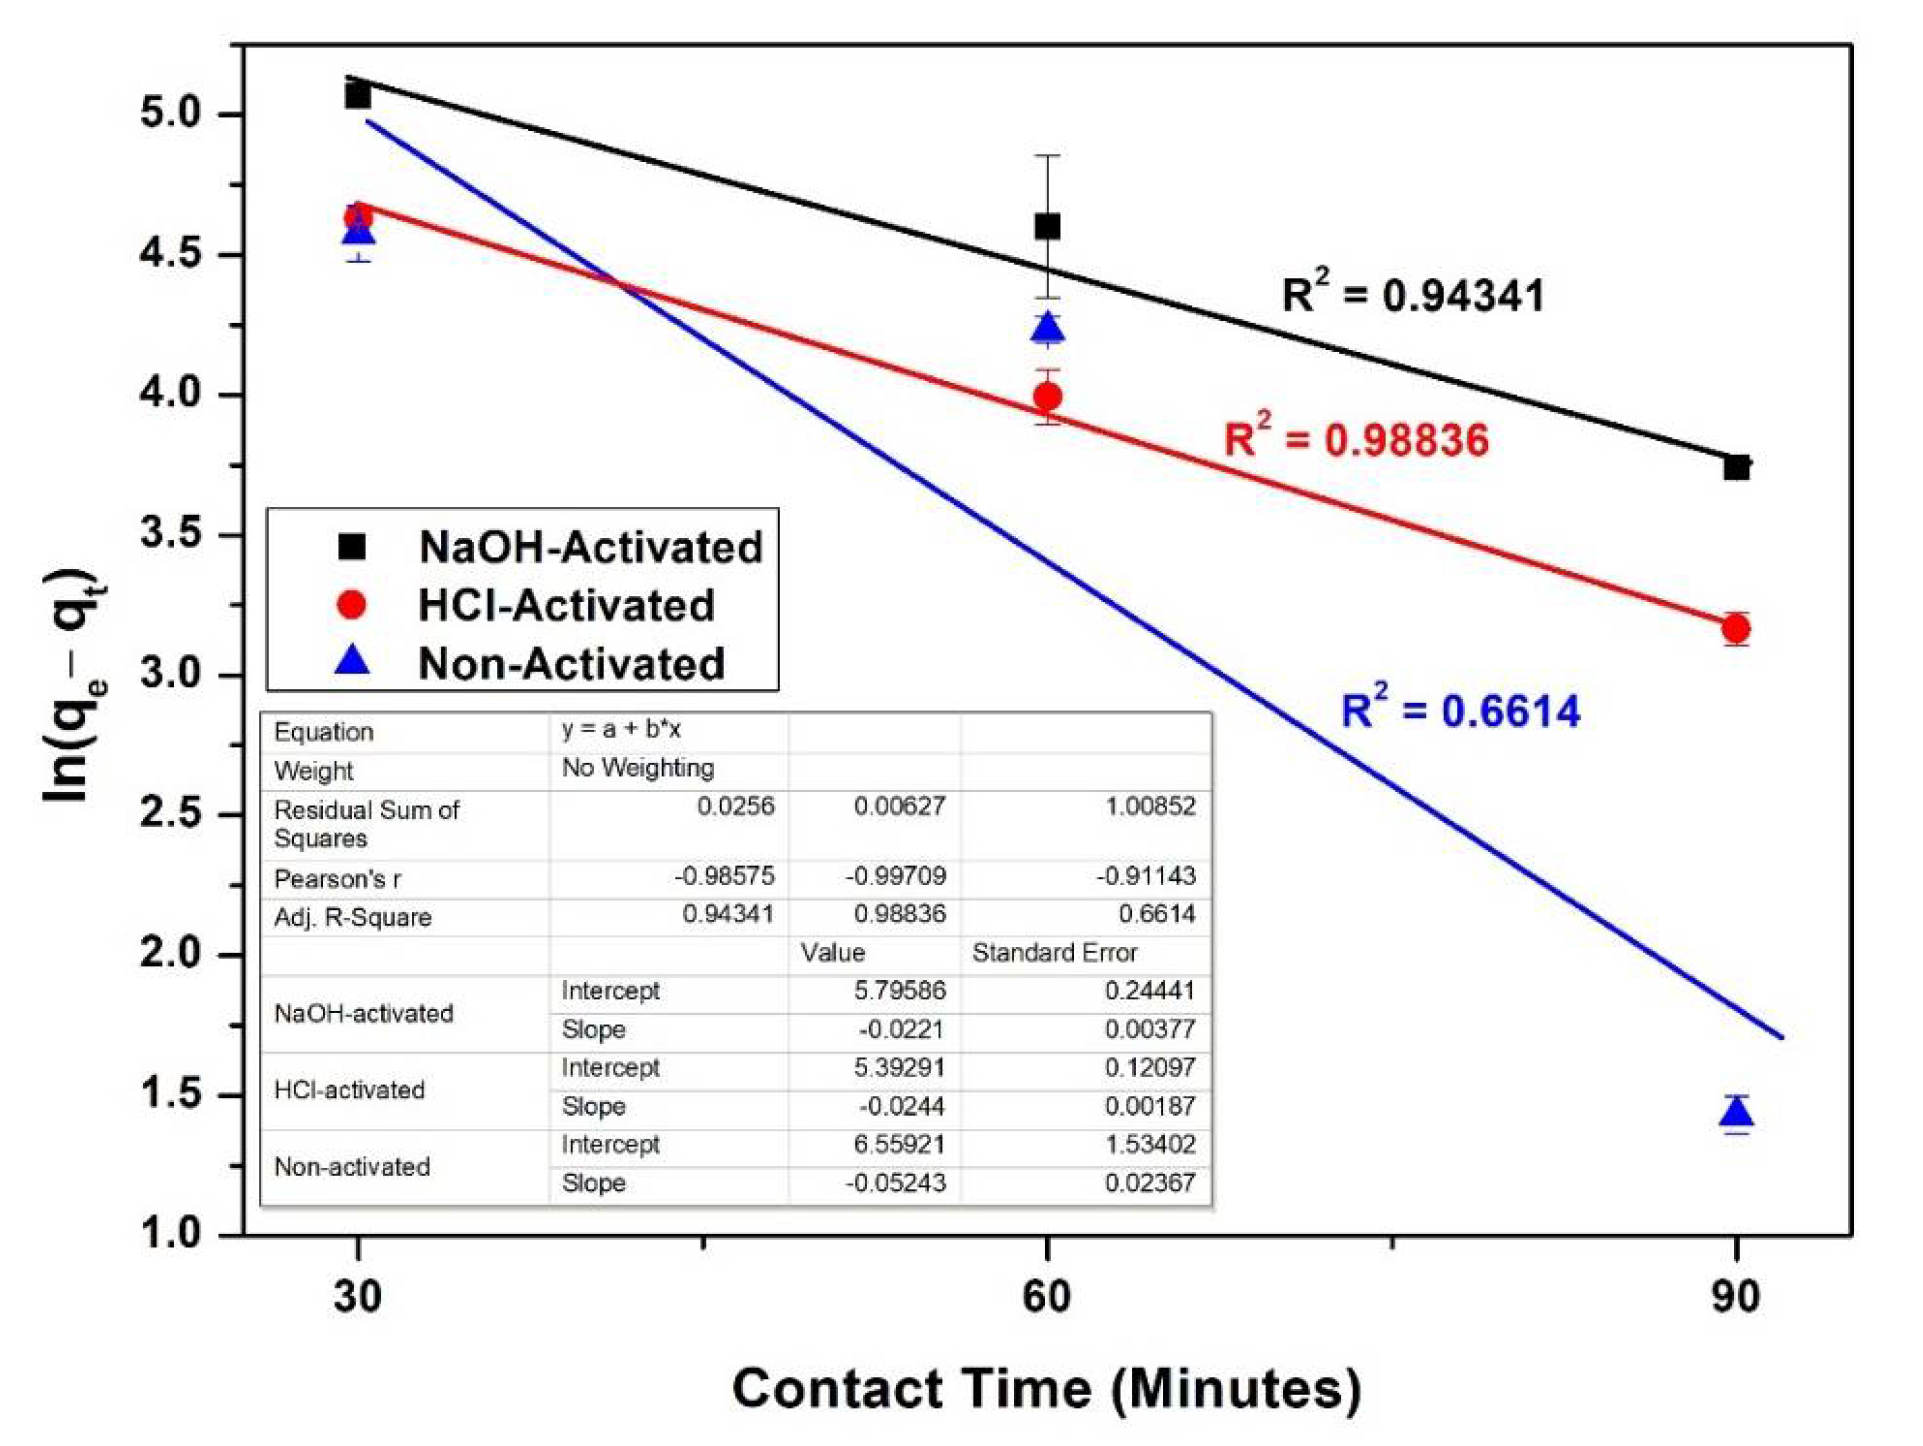
3.9. Kinetics of Adsorption

The kinetic models used are Lagergren’s pseudo-first order and pseudo-second order models. Kinetic studies are needed to optimize different operating conditions for absorption [57]. The pseudo-first order kinetic of Pb adsorption using the activated and non-activated sorbents is given in Figure 7 from which the data for Lagergren’s pseudo-first order kinetic, determinant value (R2), and the pseudo-first order rate constant (k1) were obtained and are presented in Table 6. The results are also compared with those of other studies, which used different kind of adsorbent materials. The pseudo-second order adsorption kinetic of Pb adsorption using CE adsorbents is shown in Figure 8 from which the data for Lagergren’s equation, determinant value (R2), and the pseudo-second order rate constant (k2) were acquired and summarized in Table 7.
According to Table 6 and Table 7, the adsorption using the NaOH-activated CE sorbent followed the pseudo-first order and pseudo-second order pseudo kinetic models with the R2-values of 0.971 and 0.969, respectively. The adsorption process by using HCl-activated CE sorbent tends to follow a pseudo-second order kinetic with an R2 of nearly 1 (0.999). A similar result was also obtained in a previous study [45], in which they performed an adsorption on Pb using the HNO3-activated coffee husk sorbent and obtained a correlation value of 0.9998. The adsorption process using the non-activated CE sorbent is found to follow the first-order kinetic model with an R2 of 0.830. In previous work conducted by Taşar et al. [1], the adsorption kinetic from the removal process of Pb using the non-activated peanut shell adsorbent also followed the pseudo-first order and pseudo-second order models with a R2-value of 0.999.

4. Conclusions

The fabrication of bio-sorbent sourced from EC waste has been done for application in the removal process of Pb metal ions. The characterization results confirm that the adsorbent has better surface properties after being activated by either NaOH or HCl. The chemical activation removed most of the impurities on the sorbent, which leads to a smoother surface, increasing pore size and surface area to pore volume ratio. The improved surface characteristics give a significant impact to the removal performance of CE-based adsorbent in terms of adsorption capacity and efficiency. The adsorption of Pb using raw CE sorbent yields 57.7% of adsorption efficiency and adsorption capacity of only 174.4 mg/g, with treatment using HCl and NaOH the efficiency of removal increased up to 63.9% and 89.86%, with a capacity of 193 and 272.56 mg/g, respectively. Though both activated sorbents have better adsorption performance compared to the non-activated CE, overall results reveal that the NaOH-activated sorbent showcase the best characteristic and performance. The adsorption process using NaOH-activated CE fits the Langmuir isotherm model with R2 of 0.991, the kinetics of this process follows both the pseudo-first order and pseudo-second order with R2 of 0.943 and 0.938, respectively. Considering the effectiveness of EC waste-based biosorbent, application of the material in more realistic conditions can be explored in the future with studies on the reusability as well as disposal of, the spent biosorbent.

Author Contributions

M.M. and F.M. conceived the research idea; L.J., D.F., and R.S., conducted the experiments and analyzed data; L.J., M.M., and S.M. prepared the original draft. M.R.B., A.H.M.S. and N.H. reviewed and updated the manuscript. All authors have read and agreed to the published version of the manuscript.

Funding

The APC was funded by Universiti Malaysia Sabah.

Conflicts of Interest

The authors declare no conflict of interest.

References

  1. Taşar, Ş.; Kaya, F.; Özer, A. Biosorption of lead (II) ions from aqueous solution by peanut shells: Equilibrium, thermodynamic and kinetic studies. J. Environ. Chem. Eng. 2014, 2, 1018–1026. [Google Scholar] [CrossRef]
  2. Ng, D.-Q.; Chen, C.-Y.; Lin, Y.-P. A new scenario of lead contamination in potable water distribution systems: Galvanic corrosion between lead and stainless steel. Sci. Total Environ. 2018, 637–638, 1423–1431. [Google Scholar] [CrossRef]
  3. Zietz, B.; Dassel de Vergara, J.; Kevekordes, S.; Dunkelberg, H. Lead contamination in tap water of households with children in Lower Saxony. Sci. Total Environ. 2001, 275, 19–26. [Google Scholar] [CrossRef]
  4. Singh, N.B.; Nagpal, G.; Agrawal, S. Water purification by using Adsorbents: A Review. Environ. Technol. Innov. 2018, 11, 187–240. [Google Scholar] [CrossRef]
  5. Bailón-Salas, A.M.; Ordaz-Díaz, L.A.; Cháirez-Hernández, I.; Alvarado-de la Peña, A.; Proal-Nájera, J.B. Lead and copper removal from groundwater by spherical agglomeration using a biosurfactant extracted from Yucca decipiens Trel. Chemosphere 2018, 207, 278–284. [Google Scholar] [CrossRef] [PubMed]
  6. Lalmi, A.; Bouhidel, K.-E.; Sahraoui, B.; Anfif, C.E.H. Removal of lead from polluted waters using ion exchange resin with Ca(NO3)2 for elution. Hydrometallurgy 2018, 178, 287–293. [Google Scholar] [CrossRef]
  7. Zhang, Y.; Feng, Y.; Xiang, Q.; Liu, F.; Ling, C.; Wang, F.; Li, Y.; Li, A. A high-flux and anti-interference dual-functional membrane for effective removal of Pb(II) from natural water. J. Hazard. Mater. 2020, 384, 121492. [Google Scholar] [CrossRef] [PubMed]
  8. S Samal, K.; Das, C.; Mohanty, K. Development of hybrid membrane process for Pb bearing wastewater treatment. J. Water Process Eng. 2016, 10, 30–38. [Google Scholar] [CrossRef]
  9. Gherasim, C.-V.; Křivčík, J.; Mikulášek, P. Investigation of batch electrodialysis process for removal of lead ions from aqueous solutions. Chem. Eng. 2014, 256, 324–334. [Google Scholar] [CrossRef]
  10. De Gisi, S.; Lofrano, G.; Grassi, M.; Notarnicola, M. Characteristics and adsorption capacities of low-cost sorbents for wastewater treatment: A review. Sustain. Mater. Technol. 2016, 9, 10–40. [Google Scholar] [CrossRef] [Green Version]
  11. Biela, R.; Šopíková, L. Efficiency of sorption materials on the removal of lead from water. Appl. Ecol. Environ. Res. 2017, 15, 1527–1536. [Google Scholar] [CrossRef]
  12. Wang, C.; Li, J.; Sun, X.; Wang, L.; Sun, X. Evaluation of zeolites synthesized from fly ash as potential adsorbents for wastewater containing heavy metals. J. Environ. Sci. 2009, 21, 127–136. [Google Scholar] [CrossRef]
  13. Herzog, T.H.; Jänchen, J. Adsorption Properties of Modified Zeolites for Operating Range Enhancement of Adsorption Heat Pumps through the Use of Organic Adsorptive Agents. Energy Procedia 2016, 91, 155–160. [Google Scholar] [CrossRef] [Green Version]
  14. Bożęcka, A.; Orlof-Naturalna, M.; Sanak-Rydlewska, S. Removal of lead, cadmium and copper ions from aqueous solutions by using ion exchange resin C 160. Gospod. Surowcami Miner. 2016, 32, 129–140. [Google Scholar] [CrossRef] [Green Version]
  15. Abo-Farha, S.A.; Abdel-Aal, A.Y.; Ashour, I.A.; Garamon, S.E. Removal of some heavy metal cations by synthetic resin purolite C100. J. Hazard. Mater. 2009, 169, 190–194. [Google Scholar] [CrossRef] [PubMed]
  16. Yakout, S.M. Removal of the hazardous, volatile, and organic compound benzene from aqueous solution using phosphoric acid activated carbon from rice husk. Chem. Cent. J. 2014, 8, 52. [Google Scholar] [CrossRef] [Green Version]
  17. Sarkheil, H.; Tavakoli, J.; Behnood, R. Oil by-product removal from aqueous solution using sugarcane bagasse as absorbent. Int. J. Emerg. Trends Sci. Technol. 2014, 2, 48–52. [Google Scholar]
  18. Ekpete, O.A.; Marcus, A.C.; Osi, V. Preparation and characterization of activated carbon obtained from plaintain Musa Paradisiaca fruit stem. J. Chem. 2017, 2017. [Google Scholar] [CrossRef] [Green Version]
  19. Hossain, M.; Ngo, H.; Guo, W.; Nguyen, T. Biosorption of Cu (II) from water by banana peel based biosorbent: Experiments and models of adsorption and desorption. J. Water Sustain. 2012, 2, 87–104. [Google Scholar]
  20. Olguin, M.; López-González, H.; Serrano-Gomez, J. Hexavalent chromium removal from aqueous solutions by Fe-modified peanut husk. Water Air Soil Pollut. 2013, 224, 1654. [Google Scholar] [CrossRef]
  21. Nashine, A.L.; Tembhurkar, A.R. Equilibrium, kinetic and thermodynamic studies for adsorption of As (III) on coconut (Cocos nucifera L.) fiber. J. Environ. Chem. Eng. 2016, 4, 3267–3273. [Google Scholar] [CrossRef]
  22. Kim, M.-S.; Min, H.-G.; Koo, N.; Park, J.; Lee, S.-H.; Bak, G.-I.; Kim, J.-G. The effectiveness of spent coffee grounds and its biochar on the amelioration of heavy metals-contaminated water and soil using chemical and biological assessments. J. Environ. Manag. 2014, 146, 124–130. [Google Scholar] [CrossRef]
  23. Verma, A.; Kumar, S.; Kumar, S. Biosorption of lead ions from the aqueous solution by Sargassum filipendula: Equilibrium and kinetic studies. J. Environ. Chem. Eng. 2016, 4, 4587–4599. [Google Scholar] [CrossRef]
  24. Ucun, H.; Bayhana, Y.K.; Kaya, Y.; Cakici, A.; Algur, O.F. Biosorption of lead (II) from aqueous solution by cone biomass of Pinus sylvestris. Desalination 2003, 154, 233–238. [Google Scholar] [CrossRef]
  25. Ningsih, D.A.; Said, I.; Ningsih, P. Adsorpsi Logam Timbal (Pb) Dari Larutannya Dengan Menggunakan Adsorben Dari Tongkol Jagung. J. Akad. Kim. 2016, 5, 55–60. [Google Scholar] [CrossRef] [Green Version]
  26. Wang, H.; Yuan, X.; Wu, Z.; Wang, L.; Peng, X.; Leng, L.; Zeng, G. Removal of Basic Dye from Aqueous Solution using Cinnamomum camphora Sawdust: Kinetics, Isotherms, Thermodynamics, and Mass-Transfer Processes. Sep. Sci. Technol. 2014, 49, 2689–2699. [Google Scholar] [CrossRef]
  27. Anastopoulos, I.; Karamesouti, M.; Mitropoulos, A.C.; Kyzas, G.Z. A review for coffee adsorbents. J. Mol. Liq. 2017, 229, 555–565. [Google Scholar] [CrossRef]
  28. Lillo-Ródenas, M.A.; Cazorla-Amorós, D.; Linares-Solano, A. Understanding chemical reactions between carbons and NaOH and KOH: An insight into the chemical activation mechanism. Carbon 2003, 41, 267–275. [Google Scholar] [CrossRef]
  29. Mulana, F.; Ismail, T.A.; Hafdiansyah, M.F. Activation and characterization of waste coffee grounds as bio-sorbent. IOP Conf. Ser. Mater. Sci. Eng. 2018, 334, 012029. [Google Scholar]
  30. Al-Essa, K. Activation of Jordanian Bentonite by Hydrochloric Acid and Its Potential for Olive Mill Wastewater Enhanced Treatment. J. Chem. 2018, 2018, 8385692. [Google Scholar] [CrossRef] [Green Version]
  31. Norouzi, S.; Heidari, M.; Alipour, V.; Rahmanian, O.; Fazlzadeh, M.; Mohammadi-moghadam, F.; Nourmoradi, H.; Goudarzi, B.; Dindarloo, K. Preparation, characterization and Cr(VI) adsorption evaluation of NaOH-activated carbon produced from Date Press Cake; an agro-industrial waste. Bioresour. Technol. 2018, 258, 48–56. [Google Scholar] [CrossRef] [PubMed]
  32. Kim, D.-W.; Wee, J.-H.; Yang, C.-M.; Yang, K.S. Efficient removals of Hg and Cd in aqueous solution through NaOH-modified activated carbon fiber. Chem. Eng. 2020, 392, 123768. [Google Scholar] [CrossRef]
  33. Mariana, M.; Mahidin, M.; Mulana, F.; Agam, T.; Hafdiansyah, F. Reactivity improvement of Ca(OH)2 sorbent using diatomaceous earth (DE) from Aceh Province. IOP Conf. Ser. Mater. Sci. Eng. 2018, 345, 012001. [Google Scholar] [CrossRef]
  34. Zaidi, N.A.H.M.; Lim, L.B.L.; Usman, A. Enhancing adsorption of Pb(II) from aqueous solution by NaOH and EDTA modified Artocarpus odoratissimus leaves. J. Environ. Chem. Eng. 2018, 6, 7172–7184. [Google Scholar] [CrossRef]
  35. Zhang, Y.; Song, X.; Xu, Y.; Shen, H.; Kong, X.; Xu, H. Utilization of wheat bran for producing activated carbon with high specific surface area via NaOH activation using industrial furnace. J. Clean. Prod. 2019, 210, 366–375. [Google Scholar] [CrossRef]
  36. Ma, Z.; Chen, D.; Gu, J.; Bao, B.; Zhang, Q. Determination of pyrolysis characteristics and kinetics of palm kernel shell using TGA–FTIR and model-free integral methods. Energy Convers. Manag. 2015, 89, 251–259. [Google Scholar] [CrossRef]
  37. Pavia, D.L.; Lampman, G.M.; Kriz, G.S.; Vyvyan, J.A. 2008 Introduction to Spectroscopy (Chapter 2); Cengage Learning: Weinheim, Germany, 2002. [Google Scholar]
  38. Nasution, Z.A.; Rambe, S.M. Karakterisasi dan identifikasi gugus fungsi dari karbon cangkang kelapa sawit dengan metode methano-pyrolysis. J. Din. Penelit. Ind. 2013, 24, 108–113. [Google Scholar]
  39. Şencan, A.; Kılıç, M. Investigation of the Changes in Surface Area and FT-IR Spectra of Activated Carbons Obtained from Hazelnut Shells by Physicochemical Treatment Methods. J. Chem. 2015, 2015, 651651. [Google Scholar] [CrossRef] [Green Version]
  40. Khalil, H.; Jawaid, M.; Firoozian, P.; Rashid, U.; Islam, A.; Akil, H.M. Activated carbon from various agricultural wastes by chemical activation with KOH: Preparation and characterization. J. Biobased Mater. Bioenergy 2013, 7, 708–714. [Google Scholar] [CrossRef]
  41. Das, D.; Samal, D.P.; Meikap, B. Preparation of activated carbon from green coconut shell and its characterization. J. Chem. Eng. Technol. 2015, 6, 1–7. [Google Scholar] [CrossRef]
  42. Zhou, P. Regenstein, Effects of alkaline and acid pretreatments on Alaska pollock skin gelatin extraction. J. Food Sci. 2005, 70, c392–c396. [Google Scholar] [CrossRef]
  43. Mariana, M.; Mulana, F.; Sofyana, S.; Dian, N.P.; Lubis, M.R. Characterization of adsorbent derived from Coconut Husk and Silica (SiO2). IOP Conf. Ser. Mater. Sci. Eng. 2019, 523, 012022. [Google Scholar] [CrossRef]
  44. Tan, K.A.; Morad, N.; Teng, T.T.; Norli, I.; Panneerselvam, P. Removal of Cationic Dye by Magnetic Nanoparticle (Fe3O4) Impregnated onto Activated Maize Cob Powder and Kinetic Study of Dye Waste Adsorption. APCBEE Procedia 2012, 1, 83–89. [Google Scholar] [CrossRef] [Green Version]
  45. Thi, T.T.L.; Le Van, K. Adsorption behavior of Pb (II) in aqueous solution using coffee husk-based activated carbon modified by nitric acid. Am. J. Eng. Res. 2016, 5, 120–129. [Google Scholar]
  46. Ngapa, Y.D. Kajian Pengaruh Asam-Basa Pada Aktivasi Zeolit dan Karakterisasinya sebagai Adsorben Pewarna Biru Metilena. J. Kim. Pendidik. Kim. 2017, 2, 90–96. [Google Scholar] [CrossRef] [Green Version]
  47. Weng, C.-H.; Lin, Y.-T.; Hong, D.-Y.; Sharma, Y.C.; Chen, S.-C.; Tripathi, K. Effective removal of copper ions from aqueous solution using base treated black tea waste. Ecol. Eng. 2014, 67, 127–133. [Google Scholar] [CrossRef]
  48. Wartelle, L.H.; Marshall, W.E. Citric acid modified agricultural by-products as copper ion adsorbents. Adv. Environ. Res. 2000, 4, 1–7. [Google Scholar] [CrossRef]
  49. Gaya, U.I.; Otene, E.; Abdullah, A.H. Adsorption of aqueous Cd (II) and Pb (II) on activated carbon nanopores prepared by chemical activation of doum palm shell. SpringerPlus 2015, 4, 458. [Google Scholar] [CrossRef] [Green Version]
  50. Mulana, F.; Muslim, A.; Alam, P.N. Adsorption of Pb (II) Heavy Metals from Wastewater Using Modified Rice Husk as Adsorbent. In Proceedings of the Annual International Conference, Syiah Kuala University-Life Sciences and Engineering, Banda Aceh, Indonesia, 9–11 September 2015; Syiah Kuala University: Aceh, Indonesia, 2015; Volume 5, pp. 12–17. [Google Scholar]
  51. Faisal, M. Efisiensi penyerapan logam Pb2+ dengan menggunakan campuran bentonit dan enceng gondok. J. Tek. Kim. 2015, 4, 20–24. [Google Scholar] [CrossRef] [Green Version]
  52. Muslim, A. Australian pine cones-based activated carbon for adsorption of copper in aqueous solution. Int. J. Eng. Sci. Technol. 2017, 12, 280–295. [Google Scholar]
  53. Muslim, A.; Aprilia, S.; Suha, T.; Fitri, Z. Adsorption of Pb (II) ions from aqueous solution using activated carbon prepared from areca catechu shell: Kinetic, isotherm and thermodynamic studies. J. Korean Chem. Soc. 2017, 61, 89–96. [Google Scholar]
  54. Muslim, A.; Ellysa, E.; Said, S.D. Cu (II) Ions Adsorption Using Activated Carbon Prepared from Pithecellobium Jiringa (Jengkol) Shells With Ultrasonic Assistance: Isotherm, Kinetic and Thermodynamic Studies. J. Eng. Technol. Sci. 2017, 49, 472–490. [Google Scholar] [CrossRef] [Green Version]
  55. Kyzas, G.Z.; Siafaka, P.I.; Lambropoulou, D.A.; Lazaridis, N.K.; Bikiaris, D.N. Poly(itaconic acid)–Grafted Chitosan Adsorbents with Different Cross-Linking for Pb (II) and Cd (II) Uptake. Langmuir 2014, 30, 120–131. [Google Scholar] [CrossRef] [PubMed]
  56. Karatas, M. Removal of Pb (II) from water by natural zeolitic tuff: Kinetics and thermodynamics. J. Hazard. Mater. 2012, 199–200, 383–389. [Google Scholar] [CrossRef]
  57. Theivarasu, C.; Mylsamy, S. Removal of Malachite Green from Aqueous Solution by Activated Carbon Developed from Cocoa (Theobroma Cacao) Shell–A Kinetic and Equilibrium Studies. E-J. Chem. 2018, 8, 714808. [Google Scholar] [CrossRef] [Green Version]
Figure 1. Scanning electron microscopy (SEM) imaging of (a) non-activated, (b) HCl-activated, and (c) NaOH-activated CE sorbents (magnification of 500× (a-1,b-1,c-1), and 5000× (a-2,b-2,c-2)).
Sustainability 13 03050 g001
Figure 2. Infra-red (IR) results of the CE sorbents without activation and with activation using NaOH and HCl.
Sustainability 13 03050 g002
Figure 3. X-ray diffraction (XRD) pattern of non-activated, HCl-activated, and NaOH-activated CE sorbents.
Sustainability 13 03050 g003
Figure 4. Effect of contact time (min) on the adsorption efficiency (%) of Pb with initial adsorbate concentration of 300 mg/L.
Sustainability 13 03050 g004
Figure 5. Effect of contact time (min) on the adsorption capacity of Pb with initial adsorbate concentration of 300 mg/L.
Sustainability 13 03050 g005
Figure 6. Effect of activator types on the adsorption efficiency and adsorption capacity of Pb with initial adsorbate concentration of 300 mg/L and contact time of 120 min.
Sustainability 13 03050 g006
Figure 7. Pseudo-first order kinetic of Pb adsorption using NaOH-activated, HCl-activated, and non-activated CE sorbents at initial concentration of 300 mg/L.
Sustainability 13 03050 g007
Figure 8. Pseudo-second order kinetic of Pb adsorption using NaOH-activated, HCl-activated, and non-activated CE sorbents at initial concentration of 300 mg/L.
Sustainability 13 03050 g008
Table 1. Quality characteristics of coffee endocarp (CE) sorbents.
ParameterSNI No. 06-3730-1995 StandardActivatorResults
Water contentMax. 15%NaOH 0.5 M1% ± 0.72
HCl 0.5 M4% ± 0.03
-4% ± 0.12
Ash contentMax. 10%NaOH 0.5 M3.5% ± 0.22
HCl 0.5 M3.5% ± 0.37
-4% ± 0.53
Iodine numberMin. 750 mg/gNaOH 0.5 M1628.6 mg/g ± 1.67
HCl 0.5 M1226.7 mg/g ± 1.29
-994.05 mg/g ± 2.44
Table 2. X-ray fluorescence (XRF) analysis results.
Component% w/w
Non-ActivatedHCl-ActivatedNaOH-Activated
SiO247.3256.7260.0
Al2O312.468.96.8
Fe2O39.988.218.11
MgO9.846.967.52
SO30.160.230.21
K2O0.450.360.35
CaO15.5413.913
Na2O0.070.110.9
P2O50.1610.1610.161
TiO20.3770.3620.355
Mn2O30.1630.1460.139
CrO30.0780.1350.112
SrO0.260.290.26
BaO0.050.070.05
ZnO0.030.070.03
CuO0.0790.0890.079
MnO0.4020.50.34
K2O2.161.791.16
Eu2O30.320.90.32
Re2O70.10.10.1
Table 3. Summary of the CE-based adsorbents properties.
Adsorbent TypeSurface Area (m2/g)Pore Volume (cm3/g)Pore Size (Å)Surface Area to Pore Volume Ratio
Non-activated1.8405 0.001836 39.9030 1002.451
HCl-activated1.40570.00126242.82151113.866
NaOH-activated0.97070.00068947.86711408.853
Table 4. Comparison of adsorption capacity of NaOH-activated CE-based adsorbents with other bio-based adsorbents reported in literature.
Adsorbent MaterialMaximum Capacity of Adsorption (mg/g)Reference
Arabica Gayo CE (NaOH-activated)272.56This work
Peanut shell39[1]
Rice husk5.08[50]
Bentonite-water hyacinth0.987[51]
Australian Pine Cones151.515[52]
Areca Catechu Shell55.25[53]
Oil Palm Empty Fruit Bunches9.319[54]
Table 5. The constants of isotherm model acquired from the adsorption of Pb using NaOH-activated CE sorbent and sorbent which is based on other materials.
Langmuir IsothermFreundlich IsothermDubinin–Radushkevich IsothermReference
qmKLR2nKFR2qs (mg/g)Kad (mol2/kJ2)R2
434.780.040.993.10.280.855.86−0.0030.96This work
16.810.300.991.52.880.826.80.0640.83[56]
9.321.550.991.4−0.130.33---[54]
54.950.370.991.50.030.91---[52]
5000.0040.9910.021---[49]
Table 6. Pseudo-first order kinetic model values of Pb adsorption using various adsorbents.
AdsorbentK1 (minute−1)R2
NaOH-activated CE−0.0220.943
HCl-activated CE−0.0240.988
Non-activated CE−0.0520.661
NO3-activated Coffee husk [45]0.01030.8867
Peanut shell [1]0.01840.999
Table 7. Pseudo-first order kinetic model values of Pb adsorption using various adsorbents.
AdsorbentK2 (g/mg min)R2
NaOH-activated CE0.0630.938
HCl-activated CE0.1000.999
Non-activated CE0.0700.097
NO3-activated Coffee husk [45]0.007530.9998
Peanut shell [1]0.000520.999
Publisher’s Note: MDPI stays neutral with regard to jurisdictional claims in published maps and institutional affiliations.

