Article

Analysis of the Activity and Travel Patterns of the Elderly Using Mobile Phone-Based Hourly Locational Trajectory Data: Case Study of Gangnam, Korea

Railroad Policy Research Team, Korea Railroad Research Institute, Uiwang 16105, Korea
*
Author to whom correspondence should be addressed.
Sustainability 2021, 13(6), 3025; https://doi.org/10.3390/su13063025
Submission received: 29 January 2021 / Revised: 27 February 2021 / Accepted: 5 March 2021 / Published: 10 March 2021
(This article belongs to the Section Sustainable Transportation)

Abstract

:
Rapid demographic ageing is a global challenge and has tremendous implications for transportation planning, because the mobility of elderly people is an essential element for active ageing. Although many studies have been conducted on this issue, most of them have been focused on aggregated travel patterns of the elderly, limited in spatiotemporal analysis, and most importantly primarily relied on sampled (2–3%) household travel surveys, omitting some trips and having concerns of quality and credibility. The objectives of this study are to present more in-depth analysis of the elderly’s spatiotemporal activity and travel behaviors, to compare them with other age and gender groups, and to draw implications for sustainable transportation for the elderly. For our analysis, we used locational trajectory-based mobile phone data in Gangnam, Korea. The data differs from sampled household travel survey data, as mobile phone data represents the entire population and can capture comprehensive travelers’ movements, including peculiarities. Consistent with previous researches, the results of this study showed that there were differences in activity and travel patterns between age and gender groups. However, some different results were obtained as well: for instance, the average nonhome activity time per person for the elderly was shorter than that of the nonelderly, but the average numbers of nonhome activities and trips were rather higher than those of nonelderly people. The results of this study and advantage of using mobile phone data will help policymakers understand the activities and movements of the elderly and prepare future sustainable transportation.

1. Introduction

Rapid demographic ageing is a global challenge faced by all countries in the world. Population ageing is a long-term development that exists because of declining fertility, increasing longevity, and reduced family size [1,2]. The growing number and proportion of older people have various implications for society in relation to the economy, housing and living conditions, transportation systems, safety and health care, retirement systems, poverty and social exclusion, and social life [3].
Although there is no clear definition of the term “elderly,” elderly people are normally defined as those aged 65 and over [1,3]. The worldwide population of elderly people was 703 million in 2019 [1]. This number is projected to double to 1.5 million by 2050. Further, the percentage of elderly people increased from 6% in 1990 to 9% in 2019 and is projected to escalate to 16% by 2050. Like in many other countries, the population in Korea is ageing at a considerable rate. As of 2019, there were about 7.68 million elderly people in Korea, accounting for about 15% of the population [4]. However, the proportion of the elderly is projected to increase to 20.3% by 2025 and 43.9% by 2060. Statistics Korea [4] reports an ageing index defined as the number of the elderly per 100 people younger than 15 years old. This index was 100.1 in 2016 but increased to 119.4 in 2019 in Korea.
Because of the unprecedented rapid growth of the elderly population, understanding and addressing issues associated with all aspects of the elderly have become high priorities for policymakers. The lifestyles, activity, and travel behaviors of the elderly are different from those of the nonelderly. Clearly, the increase in the elderly population has significant implications for transportation planning. Considering that Korea is a high-density country, the rapid growth of the older population is expected to affect the transportation system significantly. It is essential for transportation planners and urban policymakers to understand the activity and transportation issues that affect the elderly as well as their socioeconomic characteristics.
In this regard, numerous studies with varying degrees of depth and sophistication have been conducted by focusing on the travel patterns and behaviors of the elderly. Existing research has been focused on diverse issues, including the travel characteristics and mobility of the elderly [2,5,6,7,8], mode choice [9,10,11,12,13,14,15], travel behavior changes over time [16,17], trip chaining [18,19], influence of the built environment [12,20,21,22,23,24,25], and quality of life related to feelings of loneliness [25].
A literature review of these studies suggests that the travel of elderly people is characterized by relatively fewer trips, short distances, and travel times than that of the nonelderly [2,6,10,11,24]. The activity patterns of the elderly are also different from those of the nonelderly: the elderly tend to participate in fewer activities [6,24], spend more time at home, and conduct activities such as visiting, shopping, recreation, and leisure [2,6]. In addition, a distinction should be made between younger elderly and older elderly people because their travel patterns are not homogenous [2,10,26,27,28].
Although many studies on diverse issues have been conducted to analyze the travel behaviors of the elderly, some shortcomings remain. First, most previous studies on the travel behaviors of elderly people have been exclusively based on data from developed or Western countries, probably due to data limitation in other countries. Very few studies have been conducted outside Western developed countries [7,10]. However, unlike in Western developed countries, land use is mixed, and the public transportation system is well developed in Korea. Therefore, activity and travel patterns are expected to be different from those in other countries. Second, previous research on the travel behaviors of the elderly has mainly been concentrated on the aggregated patterns of elderly people instead of individual movements and activities. Therefore, these studies have provided limited analysis of the spatiotemporal activity and travel characteristics of the elderly. Third, and most importantly, surveys constitute the most common method of collecting information on travel patterns, and most previous studies have relied on data sampled in this manner, such as household travel survey data. Household travel surveys constitute one of the principal data sources for transportation planning because they provide systematic records of trip information along with the household and personal characteristics. However, surveys require significant time and cost for collection and analysis. Further, such data sets represent only a small portion of the population (normally less than 5%), which may not be sufficiently large to clarify the spatiotemporal activity and travel characteristics of all people concerned. In addition, there are concerns regarding the sampled data quality and credibility; that is, some participants fail to recall their trips or record their trips faithfully [29,30,31,32,33].
Because many existing studies have been heavily based on household travel surveys, it has been difficult to capture various factors regarding the mobility of people who have not participated in such surveys. However, new data types, such as mobile phone data, Global Positioning System (GPS) data, and smart card data, have recently become available due to technological developments in data collection. There is a growing interest in studying travel behaviors using these new data sources in transportation research. Several studies have highlighted the potential and significance of new data sources [31,34,35,36,37,38,39,40], because they can include various sociodemographic and travel characteristics of all people without exception. Although most GPS-based studies have still been based on a sampled data, mobile phone data that represent the total population have been analyzed in a few recent studies [41,42]. Analysis using data representative of the total population is crucial for fully understanding the activity and mobility behaviors of people and is especially interesting when studying a population that may experience different activity and trip patterns between age groups.
The mobility of the elderly is an essential element for active ageing [
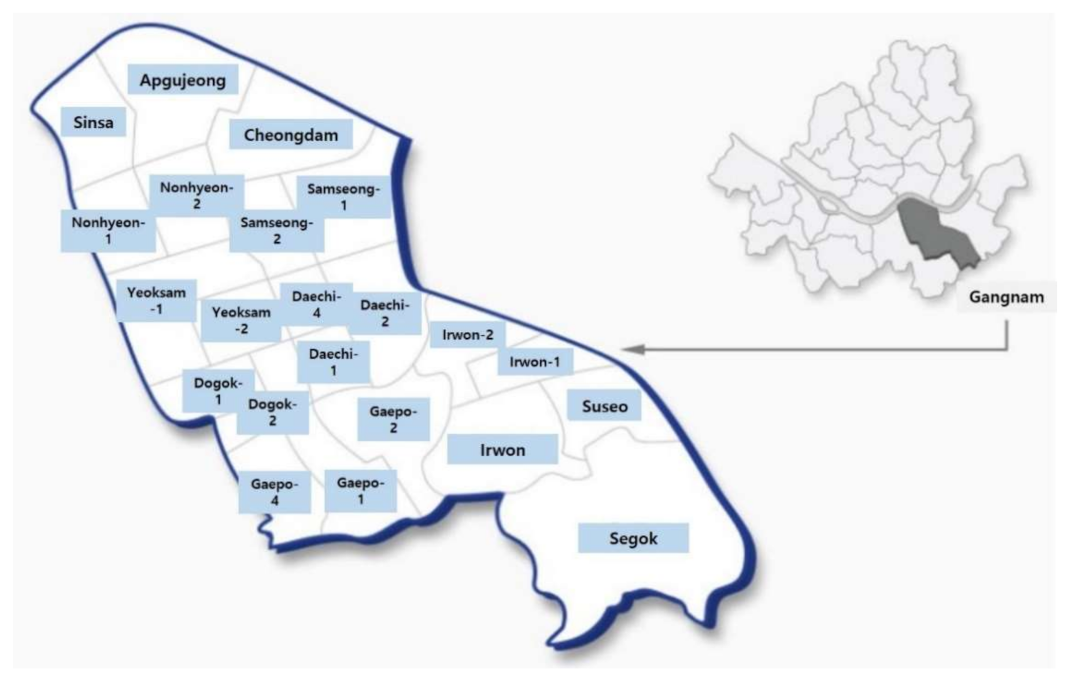
43]. Given the impact of the ageing on our society and the importance of future sustainable transportation services for the elderly, it is urgent to understand the travel characteristics of the elderly. However, previous studies had some limitations on the analysis in terms of spatiotemporal activity and travel behaviors of the elderly due to using aggregated and sampled travel data. Therefore, the objectives of this study are (1) to present a detailed picture of spatiotemporal activity and travel patterns of elderly people using mobile-phone-based hourly locational trajectory data, which contain trip chains of individual and represent the total population as a whole, (2) to compare activity and travel patterns of the elderly with other age and gender groups, and (3) to draw implications for future sustainable transportation for the elderly. For this purpose, we present a case study of Gangnam, Korea, which has a well-developed public transportation system and mixed land uses. It is expected that this study will help to provide useful information and insights for the development of sustainable transportation systems for the elderly in the future.
The remainder of this paper is structured as follows. Section 2 presents a literature review relevant to this study. Section 3 describes the hourly location data obtained from mobile phones. Section 4 presents the hourly present-in-area population categorized by age, gender, and location of residence; the activity participation by time, type, and location; the activity duration by type; and the trip frequencies and start times. Finally, Section 5 provides a discussion on insights for transportation policy, including sustainable transportation for the elderly, and concludes the paper with the summary of findings, limitations of the present study, and topics for future work.

2. Literature Review

Numerous researchers have analyzed the travel behaviors and activity participation of the elderly from different perspectives. Fatima et al. [5] presented systematic literature reviews on the accessibility and mobility of elderly people, including travel patterns, mode preferences, infrastructure solutions, accessibility indices, mode choice models and datasets. Corresponding studies have been conducted on the factor influencing the travel behaviors of the elderly, including gender, employment status, driver’s license ownership, educational level, and household income. For instance, women and the unemployed elderly have low frequencies of travel and short travel distances, and women more rely on public transport [8]; the possession of a driver’s license is associated with frequent travel [12]; and a higher level of education is associated with more frequent travel and the use of public transportation among the elderly [11]. In general, it is understood that older people take fewer trips, shorter trips in terms of travel time and distance, and more non-car-driving trips as driving ability decreases with age [2,6,10,11,24,44,45]. Schmocker et al. [28] estimated the trip generation of elderly and disabled people using London-area travel survey data. The authors concluded that increasing age results in both fewer trips and shorter distances traveled. Household structure, car ownership, and possession of a driver’s license were also found to affect trip rate and distance. Income was highly related to frequency of recreational trips and total distance traveled.
Although most previous studies have indicated that there are differences in travel behavior between the elderly and others, some studies have suggested different or mixed results. Johansson-Stenman [46] found that both the probability of driving and expected annual driving distance reach their peaks at about the age of 50. On the other hand, van den Berg et al. [47] found no significant age effects on travel distance or time between young adults and the elderly in the Netherlands. He et al. [48] also found no significant difference on mobility between older and younger people in Hong Kong. Buehler and Nobis [17] presented an interesting study comparing the travel behaviors of the elderly between Germany and the U.S. In both countries, elderly people were found to be more mobile today than in the past, but the elderly in the U.S. tend to make more trips by car than those in Germany. The Federal Highway Administration [16] summarized the trends in household and personal travel patterns in the U.S. based on household travel survey data. According to the report, the average numbers of daily trips per person taken by all people younger than 65 in 2017 were significantly lower than those in 1995, 2001, and 2009. However, the average number of trips per person taken by the elderly in 2017 was not decreased much compared to those in previous years. On the other hand, mixed results were obtained for the travel patterns of the elderly: the number of vehicle trips per driver in 2017 was lower than that in 2009, whereas the number of trips and miles of travel per person both increased for the elderly.
Some researchers have analyzed transportation mode choices of elderly people. Both neighborhood and trip characteristics and personal and household characteristics are associated with the mode choices [12,13,14,15,44,49,50,51,52,53]. Wong et al. [43] analyzed factors influencing on travel decisions of the elderly in Hong Kong, and the key factors were public transport modes, travel fare, walking and wait times, seat availability, and numerous socioeconomic factors. Jian et al. [45] found that younger people in Beijing have higher propensities to drive a private car after they are over 65 years old, while improving public transport service can increase ridership of public transport for the elderly in the future. Zhang et al. [54] analyzed travel patterns of elderly people during the morning peak hours. They found that bus is the most important transportation mode for the elderly, but the free bus program has induced only 4.85% of elderly’s bus travel. Liu et al. [9] examined travel characteristics and access mode choice of elderly urban rail riders in Denver, Colorado, and found that the built environment and vehicle ownership were important variables for the mode choice of elderly people.
In addition, several studies have investigated the travel patterns of the elderly and compared them with those of other age groups and among subgroups of the elderly population [2,10,51,52]. Shao et al. [55] examined elderly people’s travel patterns between weekday and weekend, and compared them with younger people. Jordan et al. [26] investigated travel time and duration of the two elderly groups and showed their disparities. Shi et al. [56] investigated bus travel characteristics of the elderly using smart card data and compared them with nonelderly people. Boschmann and Brady [6] found that total number of trips and mean distance decline with age, but each age group among the elderly exhibits unique behaviors. Kuppam and Pendyala [57] found that the elderly aged 60 or older tend to engage in fewer nonhome activities than people in other age groups [13]. According to Liu et al. [10], middle-aged and younger people with high household incomes had few trips, whereas the opposite was the case for older people. In the elderly group, women had fewer trips than men, but there was no difference in the number of trips between genders in the middle-aged and younger groups.
Although many studies have been conducted on the travel behaviors of the elderly as reviewed above, most of them have been focused on Western countries. The activity and travel behaviors of elderly people in the rest of the world is not well known, and there is limited corresponding research. The international case studies on the elderly’s travel behaviors are China [10], Hong Kong [2,43,48], Nigeria [7].
By now, there is quite a substantial body of literature on the activity and travel behaviors of the elderly. However, most previous studies have relied heavily on household travel survey data. Household travel surveys are primarily used to understand travel behaviors because they provide daily trip information along with the household and personal characteristics of travelers. For instance, the household travel survey in Korea consists of two levels: (1) person and household characteristics, including age, gender, type of job, number of household members, housing type, driver’s license ownership, private vehicle availability, and household income; (2) a complete record of every trip of the day, including the departure and arrival times, origin and destination, transport mode used, and trip purpose. Even though household travel survey data are crucial for fully understanding mobility patterns, several researchers have noted the limitations of survey data [29,30,31,39,40]. First, a survey represents a small subset of the population of interest (normally less than 5%). Second, data collection requires significant time and cost. Third, survey data acquisition requires the active involvement of the respondents as they must record the details of their trips. In addition, there is an issue regarding the accuracy and credibility of the data, because the respondents must rely on their memory and often fail to record their trips faithfully [29,30,31,32,33]. Some researchers have compared data from travel diaries and corresponding GPS monitoring. Houston et al. [58] summarized the corresponding studies, and the rates at which trips were not reported in travel surveys were identified in GPS data and varied substantially. The rates of unreported trips ranged from 7% in a survey in Sydney to 81% in the case of the survey in Laredo, Texas.
Recently, the rapid development and availability of inexpensive and reliable tracking devices has received increasing attention by transportation and urban planners [31,34,35,36,37,38,39,40]. The emerging data sources, including mobile phones, GPS, and transit smart cards, provide more accurate information, the opportunity for high temporal and spatial resolutions, and new insights for policymakers. What these three types of data have in common is that they are all trajectory data. Such data are now used in various ways in the transportation field. Advances in GPS technology have received substantial attention and can offer researchers the opportunity to understand travel patterns due to the advantages of low respondent burden, high resolution and precision of spatiotemporal information, and low cost of data collection. Dujardin et al. [34] explored the potential opportunities of mobile phone data and applied the data to investigate climate change adaptation. Zhang et al. [36] developed commute mode choice model by integrating actively and passively collected travel data, including in-vehicle GPS data and transit smart card data. There are many other studies using the advanced technology and data, such as GPS [31,39,59,60,61,62], mobile phone data [30], and smart card data [29,63,64].
In particular, with the increasing popularity of smartphones, mobile phone data constitute one of the most intensively used types of trajectory data in transportation studies. These data were originally corrected by cellular network providers for billing purposes. However, the data contain rich spatiotemporal information about human mobility patterns from a large user population. In addition to their spatiotemporal information, the most unique feature of mobile phone data is their prevalent scale and the overwhelming sampling penetration of the entire population, which has not been achieved using other types of data [40]. For this reason, extensive research has been conducted using mobile phone data. Several studies have been focused on movement patterns [42,65,66], travel behaviors [67,68], origin/destination (O/D) trips [41,69,70], and identification of activity locations [71] using mobile phone data.

3. Hourly Location Data, Research Method, and Case Study Area

3.1. Overview Mobile Phone Data

There are three telecommunication operators in Korea, one of which is SK Telecom (SKT). We obtained mobile phone data from SKT, who consistently holds about half of the mobile phone users in Korea. The data have their own distinct features. First, they are different from the Call Detail Record (CDR) data typically utilized in previous studies. CDR data include call records only when making/receiving a call; thus, only the times and locations at which calls are made and received are available. Therefore, CDR data provide limited spatiotemporal information. On the other hand, SKT mobile phone records include the locations of users over time regardless of whether a call is made or received or a text is sent or received. SKT mobile phone data are Long Term Evolution (LTE)-based signal data; that is, a phone is always connected to a base tower to maintain signal connection, and the base tower sends a push-alarm signal to the phone of the user every 15 min on average. In this manner, every record of the location of the user at each time is stored repeatedly as long as the phone is turned on [32,41]. Second, the mobile phone data represent all mobile phone users in Korea. For this purpose, SKT preprocessed and expanded the raw data to represent the entire population by adjusting the number of SKT users by their market share in each region. Note that SKT holds a massive penetration rate (about 50% of all mobile phone users in Korea) [72]. Therefore, we assume that the data used in this study can reasonably represent the travel behaviors of the entire population. Third, the data used in this study were hourly locational trajectory data. Therefore, we could identify the movements of each person in each hour and whether or not the user stayed at home. SKT mobile data consist of full records and are the most accurate location data available. It should be noted that the dataset included all people of interest regardless of their home location. The dataset used in this study included all people residing in and/or visiting to the study area.
SKT retains the raw data, and the data used in this study were preprocessed by SKT into an anonymized and aggregated format before they were provided for research purposes, as is necessary to avoid privacy concerns. There were two important rules in the preprocess. First, the raw data were aggregated by space (i.e., census block level or county level) and time (i.e., hourly basis). Second, the records of each individual person were converted into an aggregated format to avoid direct references to a person based on the spatiotemporal trajectories. Therefore, if there was only one person who had a certain combination of 24 locations in order within a particular gender and age group, his/her record were removed from the dataset. This step was essential to avoid privacy concerns, because including such cases would introduce the possibility of identifying a particular person. It should be also noted that the mobile phone data do not reveal whether an individual stays at a location to perform an activity or is moving to another location. It is also difficult to identify the type of activity or the mode of transportation while moving. These limitations apply to any mobile phone data available in the world, unless it is postprocessed after combining with additional information (i.e., travel survey data).

3.2. Description of Hourly Locational Trajectory Data

The dataset used in this study contained the location of each user in each hour and the number of people with exactly the same combination of locations throughout the 24 h in a day. Specifically, there were 27 columns in the dataset, and Figure 1 shows a sample of them. The first and second columns indicate gender and age; the third–26th columns represented the location IDs in each hour; and the 27th column shows the numbers of people with exactly the same combinations of location IDs for all 24 h who belong to the same age and gender groups.
The ages were grouped in five-year intervals. There were two types of location IDs depending on whether or not the location was inside Gangnam. If the location was in Gangnam, the ID was 10 digits, representing the census block group ID, whereas if the location was not in Gangnam, the ID contained five digits, representing the county ID. Note that the location indicated the last location in each hour regardless of all the locations identified within that hour. Therefore, locations identified in the middle of the hours that differed from the last locations were ignored. The last column, “count,” represents the number of people with the same combination of 24 locations in order according to the hours of the day that belonged to the same gender and age groups. Because the records of the unique individuals in terms of locations and age and gender groups were excluded to ensure privacy, there are at least two people in the “count” entry.

3.3. Research Method

The household travel survey data, which is used frequently in previous studies, include travel information only on aggregated format and represent only a small portion of the total population. On the other hand, mobile phone data represent total population as a whole and contain individual movements of people in detail. Because the size of the raw data of mobile phone covering Seoul metropolitan area is very big (i.e., about 5 GB and over 50 million records), the data mining method was used in this study. Records of travelers, who are residents or visitors of Gangnam for at least 2 h, were first extracted from the raw data. The final dataset used in this study contains about 804,710 records in total. We performed descriptive and comparative analysis by several data mining procedures: (1) counting the hourly service population by age, gender, and residence (presented in Section 4.1), (2) analyzing activities categorized by home and nonhome activity types and calculating hourly numbers of people by residence and activity types and ratios of nonhome activity by age groups (Section 4.2), (3) examining nonhome activity locations (Section 4.3), and (4) calculating activity time and duration and analyzing trip behaviors including trip chaining, trip frequency and departure time (Section 4.4). Conducting these specific analyses on activity and travel behaviors were possible thanks to the use of locational trajectory-based mobile phone data, which represent total population as well as contain spatiotemporal information of each individual. In this way, our analysis provides more accurate and specific outputs than previous studies.

3.4. Case Study Area

The case study area was Gangnam, Korea, which is one of 25 counties in Seoul, Korea and is located in southeast Seoul (Figure 2). There are 22 census block groups and 1085 census blocks in Gangnam. The public transportation system is well developed, and lots of blocks are mixed land use areas. Gangnam provides various types of facilities, and many people visit this area. Therefore, it is one of the most popular and congested areas in Seoul. As of March 2017, the number of total residents registered in Gangnam was 565,550 [73].
We obtained SKT mobile phone trajectory data on March 23 (Thursday), 2017. The total number of records of the dataset was 804,710, including about 1,780,000 people of all ages and 131,160 people over 65 years old. As described in the previous section, individuals with unique trajectories and the age and gender groups were removed from the dataset. When comparing to the hourly total present-in-area population of 1.21 million people at 2:00 p.m. in the raw data, the individuals removed from the dataset accounted for about 25%; thus, the dataset in this study represents about 75% of the actual population in Gangnam.

4. Analysis of Activity and Travel Patterns

4.1. Hourly Present-in-Area Population

The most commonly used population count is the resident population, which is normally collected for the population census purposes. The resident population count is the number of registered residents at the time of the census. However, the resident population count is a monthly count at best and does not accurately represent the present-in-area population [74]. Consequently, the United Nations recommended using a service population count if the usual resident population count does not accurately represent the demand for or provision of services in a country or part of a country [74]. For example, a significant number of nonresident people visit Gangnam, and the present-in-area population far exceeds the resident population. As of March 2017, the total number of residents registered in Gangnam was 565,550 [73], whereas the population during the daytime observed based on mobile phone data was over 1.2 million people at 2:00 p.m.
The service population can be readily obtained from the mobile phone data and represents the present-in-area population in each hour in a specific area. Based on the locational trajectory mobile phone data, Figure 3 shows the population existing in Gangnam in each hour and compares the populations for two age groups: nonelderly and elderly. The number of elderly people ranges from 49,143 at 3:00 a.m. to 62,358 at 12:00 p.m., while that of the nonelderly ranges from 445,891 at 3:00 a.m. to 794,414 at 2:00 p.m. The number of elderly people increases by only 27% at 12:00 p.m. compared to that at 3:00 a.m., whereas the number of nonelderly people increases by 78% at 2:00 p.m. compared to that at 3:00 a.m. Thus, many nonelderly people such as workers and tourists were visiting from outside Gangnam during the daytime. Elderly people constitute between 6.5% and 9.5% of the total population. The overall rising and falling patterns of the curves of the two groups are similar, as expected: the lowest number occurs in the very early morning, whereas the highest number is found at daytime. However, the hourly variations differ considerably between the two age groups: the hourly variations of the elderly population are relatively small, whereas the rises (between T8 and T9) and falls (after T18) of the population occur sharply for the nonelderly. The proportion of the elderly is high during the night and low during the day.
We further classified the total population of the dataset by residence location (Gangnam resident vs. nonresident) as well as age and gender, as shown in Table 1. In fact, the actual location of the home of each person cannot be determined from the mobile phone data. However, we assumed that the location of each person at 3:00 a.m. was his/her home. We found that lots of nonresidents visited Gangnam: specifically, 71% of total population were nonresidents (1,213,943 people), whereas only 29% of people (495,034) were Gangnam residents. Among the residents, the proportions of men and women performing activities in Gangnam were very similar. On the other hand, many of the nonresident people visiting Gangnam were men (58%). Looking at the age groups, most people (92%) were nonelderly, and the groups containing people in their 30s, 40s, and 50s each constituted about 24–25%.

4.2. Activities

It is difficult to identify the specific purpose of the activity of a person based on mobile phone data. However, home and nonhome activities can be distinguished based on the location at 3:00 a.m., which is the home. Accordingly, we analyzed the two activity types and compared them by age and gender. Nonhome activities are critical to numerous aspects of the quality of life of elderly people, because active social interaction is associated with quality of life. Table 2 shows the numbers of people and nonhome activities, as well as the average numbers of nonhome activities. A few interesting results can be obtained from the corresponding analysis. First, there are about 1.578 million nonelderly people and 131 thousand elderly people. However, elderly people (3.85 times/person per day on average) tend to participate in more out-of-home activities per day than other people (3.77 times/person per day on average). It is presumed that nonelderly people have fewer external activities due to holding a stable job, whereas the elderly who have relatively large amounts of time to spare and nonmandatory schedules can perform diverse activities in various places. Second, the distribution of the number of activities looks like a normal distribution curve: that is, the average number of nonhome activities gradually increases from the people in their 20s (3.4 times/person) to those aged 50–65 (4.17 times/person) and gradually decrease after age 65. Finally, men (4.24 times/person for the nonelderly and 4.42 times/person for the elderly) had more activities than women (3.20 times/person for the nonelderly and 3.08 times/person for the elderly). Thus, men of all ages participated in more and more varied activities than women in multiple ways.
Figure 4 shows the results of analyzing the hourly nonhome activities a day. It confirms that the overall patterns of elderly and nonelderly people are similar, but nonelderly people engage in more nonhome activities in the afternoon and evening (T15–T22) than elderly people. The most populated nonhome activity time for the elderly is T13, with 39,045 elderly people. The highest number of nonelderly people engaging in nonhome activities is 628,156 at T14. Considering that there were 445,891 nonelderly people at T3, about 141% of the resident nonelderly people performed activities outside the home at T14, indicating that many nonelderly people visited Gangnam. In the case of the elderly, the highest number of people performing nonhome activities is 39,045 at T13. Considering that there were 49,143 older people in Gangnam at T3, only about 79% of the elderly participated in nonhome activities at T13. The ratio of the number of nonhome elderly people at all hours is less than 100% of the number of elderly people at T3, which means that many elderly people stayed at home and not many nonresident elderly people visited Gangnam.
We further investigated the hourly numbers of people by residence (Gangnam residents and nonresidents) and activity type (home and nonhome activities). Figure 5 and Figure 6 illustrate the numbers of people categorized by home and nonhome activities performed by Gangnam residents and nonresidents for the nonelderly and elderly, respectively. As expected, the percentage of elderly people conducting home activities is higher than that of nonelderly people at all times. However, the behaviors of the elderly and nonelderly vary over time. There are differences in the time intervals in which the proportions of nonhome activity by both the residents and nonresidents are over half: that is, T8–T19 for the nonelderly and T9–T17 for the elderly. In other words, elderly people tend to be more active during the daytime than late in the evening.
The highest number of people performing nonhome activities among the nonelderly was about 1.23 million at T14 (about 78% of the total nonelderly population), of which 628,156 people participated in nonhome activities in Gangnam. On the other hand, there were 88,397 elderly people at T13 (about 67.4% of the total elderly population), of which 39,045 people were in Gangnam. When comparing the nonhome activities during the daytime, nonelderly people participated in more nonhome activities in Gangnam, while elderly people were more active outside Gangnam.
Table 3 shows the ratios of hourly nonhome activities for nonelderly people by age and gender. The cells with more than 50% of nonhome activities are indicated in gray. The largest percentage of nonhome activity is 84%, which corresponds to men in their 40s at T14. In general, over 50% of all nonelderly people performed nonhome activities between T8 and T19. Specifically, more than 50% of the nonelderly people performed nonhome activities at T10–T17 among all genders and ages, but the hours of nonhome activity differ slightly by gender and age. For example, all men over the age of 30 have activity rates over 50% from T8, whereas women aged 50–65 have nonhome activity rates less than 50% even at T9. There is also a difference in the time at which the proportion of the nonhome activity becomes less than 50%: specifically, the end time for men is later than that for women. Thus, as we expected, the nonhome activity duration for men is greater than that of women. In particular, the difference in the times during which the nonhome activity rate is greater than 50% differs between men and women in their 40s, being T8–T20 for men and T9–T18 for women. Similarly, the difference in duration between men and women in their 50s is large. This difference is presumed to exist because women in their 40s and 50s need to go home early and take care of their children or do housework (i.e., prepare dinner).
Table 4 lists the ratios of hourly nonhome activities for the elderly, and their activity behaviors are very different from those of the nonelderly. The time period during which over 50% of all elderly people performed nonhome activities is T9–T17, which is shorter than the corresponding time period for nonelderly people. The ratios are also small overall compared to those of the nonelderly, and the maximum rate is 74% for men aged 65–70. However, as in the case of the nonelderly, the nonhome activity duration of elderly men is generally longer than that of women. It is interesting to note that the time ranges with over 50% of nonhome activity differ slightly for people over 80 years old: T10–T15 for men and T11–T16 for women.

4.3. Nonhome Activity Location

Figure 7 compares the nonhome activity locations at 2:00 p.m. between the nonelderly (bar graph corresponding to the left vertical axis) and the elderly (line graph corresponding to the right vertical axis). From the analysis, we found that both nonelderly and elderly people are very active in Yeoksam-1 and the least active in Gaepo-1. The number of individuals engaging in nonhome activities is quite large in Yeoksam-1, with 129,539 nonelderly people (20.6% of the total nonelderly population) and 5807 elderly people (15.0% of the total elderly population). Thus, Yeoksam-1 provides diverse activity places and facilities for both nonelderly and elderly people and attracts more of them. The second place with the most nonhome activity is Samseong-1, with 67,789 nonelderly people (10.8% of the total nonelderly population) and 3309 elderly people (8.6% of the total elderly population). However, comparing the activity spaces of nonelderly and elderly people, Nonhyeon-2, Samseong-1, and Yeoksam-1 have relatively large numbers of nonelderly people, whereas Daechi-1, Dogok-1, Gaepo-2, Irwon, and Suseo have relatively large numbers of elderly people.
Figure 8 shows the places where residents of Gangnam engage in nonhome activities at 2:00 p.m. There are differences in the places between nonelderly and elderly people. In addition, this graph shows that the locations of nonhome activities performed by residents differ slightly from those of total population, as shown in Figure 7. For Gangnam residents, Yeoksam-1, Samseong-1, and Nonhyeon-2 are the places where nonelderly people engage in many nonhome activities. On the other hand, Samseong-1, Yeoksam-1, and Nonyeon-2 are, in order, the places at which the elderly residents of Gangnam frequently engage in nonhome activities. Nonelderly people are more active in Nonhyeon-1, Cheongdam, and Yeoksam-1 than elderly people, whereas elderly people are more active in Dgok-2, Gaepo-2, and Irwon-2. However, Yeoksam-1 still has the most nonhome activity for both nonelderly (13,339 people, 14.5%) and elderly (810 people, 8.9%) Gangnam residents.

4.4. Activity Time and Duration

In this study, home and nonhome activities were distinguished by assuming the location at 3:00 a.m. to be the home. Table 5 summarizes the proportions of home activities aggregated every 4 h for the nonelderly and elderly. As expected, the hours of home activity for the elderly are longer than those for the nonelderly: most of the nonelderly spent about 9–16 h at home (with 34.0% spending 9–12 h and 26.4% spending 13–16 h), whereas most of the elderly spent 13–24 h at home (with 26.8% spending 13–16 h, 23.5% spending 17–20 h, and 21.4% spending 21–24 h).
There are also differences by age and gender, as shown in Table 6. The average home activity time of the nonelderly is 13.51 h, whereas that of the elderly is 15.65 h. The elderly stayed at home for about 2 h and 10 min longer than the nonelderly. The nonelderly spent less than 14 h a day at home on average, and the least average home activity time is 13.24 h, corresponding to people in their 30s. On the other hand, the average time of home activities for the elderly is over 15 h. The age group that stayed at home for the longest was over 80, with an average of 16.74 h. However, the more elderly people within this group (over 85 years) spent less time to spent at home compared to the less elderly (80–85 years), specifically, 16.91 h for those aged 80–85 and 16.31 h for those aged over 85. This difference is probably evident because elderly people over 85 years of age frequently visit hospitals and stay in nursing homes for health reasons. The home activity time of women is high in all age groups; specifically, the average home activity times are 12.68 h for nonelderly men, 14.51 h for nonelderly women, 14.83 h for elderly men, and 16.76 h for elderly women.
We also analyzed the average nonhome activity time and average duration, as shown in Table 7. Note that the average nonhome activity time is the time spent engaged in nonhome activities per person based on the total number of nonhome activities during a day, and the average duration is the duration per nonhome activity per person. As expected, the average nonhome times are longer for the younger people. The average nonhome activity times are 10.39 h for the nonelderly and 8.25 h for the elderly. Therefore, the average time spent engaged in nonhome activities for the nonelderly is about 2 h 9 min longer than that for the elderly. Specifically, the average nonhome activity time is more than 10 h per person for those under 50 years of age, between 8 h and 10 h for those aged 50–75, and less than 8 h for those aged 75 and over.
The average duration per activity is 3.53 h for the nonelderly and 2.58 h for the elderly, i.e., about 1 h more for the nonelderly people. As expected, the younger people have longer nonhome activity durations per person. Those under the age of 65 have more than 3 h of average duration per nonhome activity. People in their 20s have the greatest duration of 3.9 h/person/activity, whereas those over the age of 80 have the least duration of 2.29 h/person/activity.
The average nonhome activity time of nonelderly men (11.20 h) is longer than that of women (9.41 h). However, the average nonhome activity duration per person is longer for women (3.60 h) than for men (3.47 h). In other words, the average number of hours spent engaged in nonhome activities is high for men, but the duration per activity is not as long as that for women, which implies that the number of activities engaged in by men is relatively high but the duration of each activity is short. In the case of the elderly people, both the average nonhome activity time and average duration per activity are longer for men than for women.

4.5. Trip

The pattern of making trips can suggest interesting travel behaviors among different groups of people. In particular, trip chaining involves the linking together of trips. We examined not only number of trips, but also the trip chaining complexity of individuals, including trip frequency and departure time. First, we analyzed the trip frequencies of each person. Table 8 shows the numbers of trips and averages summarized by age and gender. The average number of trips is slightly higher for the elderly (4.90 trips/person) than for the nonelderly (4.74 trips/person). These results are similar to those for the average number of nonhome activities shown in Table 2, because elderly people tend to have flexible schedules and take more trips to perform various outside activities. The highest numbers of trips are 21 and 20 trips a day for the nonelderly and elderly, respectively. These very high numbers are presumed to be influenced by the travel patterns of delivery drivers who have to visit several locations. Nevertheless, they are very high numbers that are difficult to find in typical travel survey data based on sampling. In a typical survey, it is possible for trips to be omitted because the respondents should depend on their memory. Further, various trip behaviors can be missed because unusual travel behaviors may not be reported due to the small sampling of 2–3% of all households. However, all travel patterns, including unusual ones, can be identified from mobile phone data. Because the data completely record all movements of people, trips are less likely to be missing. This characteristic is a huge advantage of using mobile phone data to understand the diverse travel patterns of people.
As with the number of activities shown in Table 2, the average number of trips by age also increases from the 20s (4.29 trips/person) to the 50s (5.21 trips/person) and then decreases for people aged 65 or older. The average trip frequency is higher for men than for women both in the nonelderly and elderly groups. However, elderly men (5.50 trips/person) took more frequent trips than nonelderly men (5.17 trips/person), whereas nonelderly women (4.20 trips/person) took more frequent trips than elderly women (4.09 trips/person).
The travel departure time of each trip was analyzed every hour from 6:00 a.m. to 8:00 p.m. The proportions of trips based on departure time out of the total frequency during the time are shown in Figure 9. In the case of the nonelderly, there are two distinct peaks: the morning peak (T7–T9) and the afternoon peak (T18 and T19). On the other hand, the trips are not concentrated at specific times for the elderly. The most frequent departure times for the elderly are 11:00 a.m. (8.7%) and 10:00 a.m. (8.6%). During the peak hours of the morning, the elderly travelled much less, which demonstrates that they tend to avoid peak hour congestion. Even during the evening peak, the compositions of departures for the elderly are 6.8% at 5:00 p.m., 5.8% at 6:00 p.m., and 4.1% at 7:00 p.m.
When the trips are arranged in order by reflecting trip chains and the departure times for each trip are compared, differences in the departure time patterns for the nonelderly and elderly are to be expected. The ratios of trips categorized by travel sequence from 6:00 a.m. to 8:00 p.m. are shown in Figure 10 and Figure 11 for the nonelderly and elderly, respectively. The proportion of the first trip for nonelderly people is 24.4% of all nonelderly trips during the time, 24.0% for the second trip, 19.7% for the third trip, 15.0% for the fourth trip, and 10.1% for the fifth trip. Consequently, the first and second trips account for about 48% of all trips, and the first to fourth trips account for 83% of all trips. In the case of elderly people, the first trip accounts for 21.7%, the second trip 23.0%, the third trip 19.8%, the fourth trip 15.9%, and the fifth trip 11.4%. As expected, two obvious first-trip peaks for nonelderly people occur at 7:00 a.m. and 8:00 a.m. in the morning peak hours. Comparing the time periods during which the first trip rate is high between the nonelderly and elderly, there is a different in the departure time pattern: that is, 8:00 a.m. (20% of the nonelderly), 7:00 a.m. (18%), and 9:00 a.m. (13%) for nonelderly people but 9:00 a.m. (13% of the elderly), 8:00 a.m. (12%), 7:00 a.m. (10%), and 10:00 a.m. (10%) for elderly people. In other words, the first trips of the nonelderly are concentrated during the two peak commuting hours, whereas they are evenly distributed between 6:00 a.m. and 11:00 a.m. for the elderly. In the case of the second trip, the departure time for nonelderly people is concentrated from 8:00 a.m. to 10:00 a.m., but that of the elderly is distributed from 8:00 a.m. to 12:00 p.m. In addition, travel departures are concentrated before 10:00 a.m. for nonelderly people and there are relatively few travel departures after 10:00 a.m., but for the elderly, the second, third, and fourth trips continue to occur evenly until 6:00 p.m.

5. Discussion and Conclusions

5.1. Discussion

Our approach differs from previous studies relying heavily on sampled household travel survey data, as we used mobile phone-based hourly locational trajectory data. The data have several advantages over existing household travel survey data. Since typical travel survey data represent only 2–3% of the total population, making it difficult to understand the activity and travel pattern characteristics of the entire population. In particular, the reliability of such data is limited; for instance, some trips may be omitted because travel surveys rely upon the memories of the respondents. On the other hand, because the mobile phone data represent the entire population and capture the location of each person each hour, it is possible to identify peculiarities and behaviors that cannot be found in travel survey data and to analyze activity and travel characteristics by age and gender.
Mobile phone data provides important clues for understanding the travel behaviors of all age groups, including individual activity (i.e., time, place, and duration) and travel patterns (i.e., location and time of trip, trip chains). The only missing information from the data is the identification of transportation mode used by travelers. Most of the elderly are retiree and in-vehicle travel time may not be a key factor of transport mode choice for the elderly. As previous studies indicated, other factors seem to be more important, including perceived health condition, income, region of residence, gender, travel fare, travel distance, wait times, and built environment [9,10,43,49]. However, existing researches contain conflicting stories. Private car, public transportation, and walking are the main means of mobility for the elderly. While the use of transit and walking is crucial for sustainable transportation, the use of private vehicle is gradually increasing [22,44,45,75]. In addition, personal mobility (i.e., kickboard) and demand responsive transit were introduced as a means of first- and last-mile accessibility. Accordingly, it is necessary to examine whether these new mobilities are suitable for the elderly. Uses of public transport, walking, and shared riding are vital for sustainable society and transport in the future. Hoof et al. [76] emphasized the importance of making cities age-friendly. They presented two examples of projects in the Netherlands and Poland. UN [77] established 17 sustainable development goals and published the 2030 agenda for a sustainable future, including sustainable transport. It has been demonstrated in a number of literatures that, as individual vehicles decrease and use of active modes increase, it has a positive impact on the environment, such as greenhouse gas emission [78,79,80,81]. Therefore, urban and transportation planners should prepare how to create a sustainable and healthy society for the future transportation, especially for elderly people. In addition, accessible built environment, for instance access to bus stop or subway station, is another important issue for the elderly. In this study, we found that Yeoksam-1 is the area where elderly people are most active, so that adequate accessibility, convenience and safety for the use of public transport and walking environment in this area need to be evaluated.
The population of old people in Korea is growing extremely rapidly and is expected to grow at an even faster rate in the near future. Consequently, there is an increasing need to provide transportation services for nondriving older people in Korea. The elderly population was found to be more active because of higher income and health levels than in the past, and as a result, the amount of movement was large. In fact, many elderly people still drive, and traffic accidents are increasing as a result. Some countries have implemented policies to reinstate driver’s licenses for the elderly, but in Korea, the return rate is very low because mobility by private car is still convenient for the elderly. Therefore, it is necessary to expand transportation services at the level of passenger cars to resolve the active mobility needs of the elderly population and to implement a safe transportation policy. In particular, when autonomous vehicles are introduced for practical use, the main service target can be the elderly, and the expansion of demand-responsive public transportation is necessary. Further, the policy of introducing short-distance personal mobility modes that consider the activity locations and travel distances of the elderly is necessary. Knowing when and where older people are active is particularly important for providing transportation systems and facilities and developing efficient and effective transportation strategies.

5.2. Conclusions

The populations of most countries around the world are ageing. The rapid increases in the elderly population and the proportion of elderly people in society have tremendous implications for transportation planning, because the elderly represent a distinctive component of society. Transportation systems in the development era have been lacking in consideration of transportation welfare and services. In cities with a large number of elderly populations, the introduction of transportation systems and services for the elderly’s activities and mobility is becoming more important. Korea is also experiencing a significant demographic transition to a more aged society. The rapidly increasing number of older people necessitates new infrastructure and places for these individuals as well as easily accessible transportation systems. Hence, an understanding of the activity and travel characteristics of elderly people is crucial for transportation planning and the entire society to maintain mobility and accessible living environments.
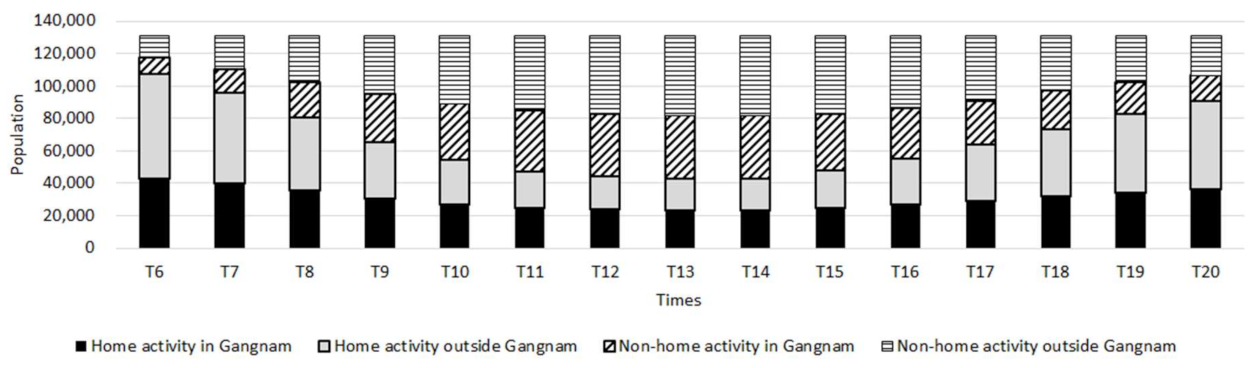
The objective of this study was to explore the activity and travel patterns of the elderly and nonelderly. Analysis was performed with high temporal and spatial resolutions thanks to the use of locational trajectory-based mobile phone data, considering Gangnam, Korea as a case study. Based on hourly locational trajectory mobile phone data, we investigated the hourly present-in-area population and performed detailed analysis by age, gender, and residence of the average numbers of home and nonhome activities, amounts and locations of nonhome activity by hours per day, average numbers of trips reflecting trip chaining, average activity time and duration, and travel departure time.
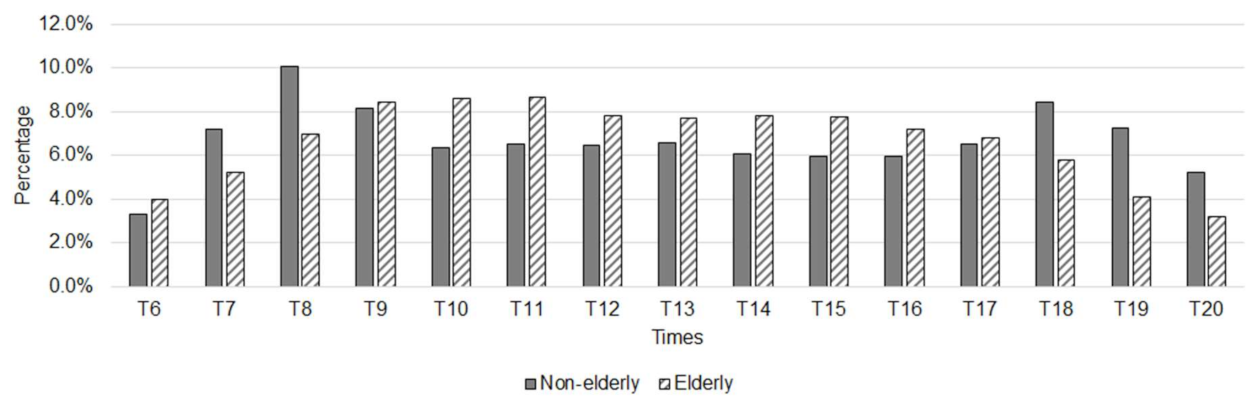
The overall results of this study were consistent with common sense and the existing research. New findings that could not be analyzed using the existing household travel survey data were also presented. Above all, it was confirmed that the activity and travel patterns differed between nonelderly and elderly people and between men and women. Although hourly present-in-area population showed the similar patterns to both elderly and nonelderly people in Gangnam, nonelderly population increased rapidly during the daytime. We found that more than twice as many nonresidents visited from outside Gangnam, where there are many work and business offices. It implies that there are limited facilities or amenities for elderly people. In terms of activity behaviors by age group, the home activity time and duration were longer for the elderly than for the nonelderly. Elderly people also tend to participate in more nonhome activities per day than other people. Similar to previous studies, our analysis showed not only heterogeneous activity and travel patterns by age group but also slightly differences within the elderly group. Specifically, the average number of nonhome activities gradually increased from the people in their 20s to those aged 50–65 (4.17 times/person), then gradually decreased after age 65. In addition, men of all ages had more activities than women, which shows consistent results with previous studies (i.e., [8]). We also found that average duration of nonhome activities of nonelderly men was shorter than that of nonelderly women, while average duration of nonhome activities of elderly men was longer than that of elderly women. Time periods for major nonhome activity were also different by age group. The nonelderly’s activities were mostly occurred from 8:00 a.m. to 7:00 p.m., while the elderly’s activities were occurred from 9:00 a.m. to 5:00 p.m., as it is consistent with the existing literatures (i.e., [2,5]). Elderly people do not engage in nonhome activities in the evening as much as nonelderly people. Most of the activities of the elderly are characterized by leisure and other activities (i.e., hospital visit, social gatherings, visiting to senior citizens’ centers, etc.). For this reason, short-distance and high-frequency trips occur due to various activities where the elderly involved, unlike ordinary adults who have fixed schedules at work and work-related activities. Elderly people also tend to delay departure times to avoid the traffic congestion peak in the morning and return home earlier than the nonelderly. It is worth considering transit services that meet these characteristics of the elderly and dissimilar travel patterns and destinations by different age group. For example, school buses operated by private businesses are mainly serviced in the early morning and late evening hours, so they can be operated as mobility services for the elderly during the daytime.
However, some results of this study differed from those of previous studies, and the following summarizes the observed trends that are unusual or different from those obtained in the existing research. Many previous studies have indicated that the numbers of trips taken and participation in activities by the elderly are reduced compared to those by the nonelderly [2,5,6,10,11,24], but this study interestingly showed that this situation is not necessarily the case. The average nonhome activity time per person for the elderly was shorter by about two hours than that for the nonelderly, but the average numbers of nonhome activities and trips were higher than those of the nonelderly. The reason for this difference is probably that elderly people are more likely to have driver’s licenses and take more trips, making them more mobile than ever before. In addition, the complete movement patterns of people can be analyzed in mobile phone data based on the hourly locational trajectory of each person, and peculiar traffic patterns such as those of delivery drivers could be found, which are difficult to obtain from typical household travel survey data because of the small number of samples. The characteristics of these data are expected to be useful for future travel demand forecasting and urban facility planning. In particular, it is necessary to understand properly the differences in travel behaviors through an in-depth comparison between the existing household travel survey data and the mobile phone data used in this study and to find a way to combine the advantages of the two types of data.
A number of limitations of this study suggest particular needs for further investigation. First, although the activity and travel needs of the elderly are increasing, their travel patterns and degrees of mobility are expected to differ by country and region as well as household and personal characteristics. Therefore, additional research is needed to see if there are differences in the activity and travel behaviors of the elderly according to region and local conditions. Another limitation is related to the data. Mobile phone data provide new, previously unfeasible, insights due to intensive sampling with high temporal and spatial resolutions. However, the data themselves do not provide comprehensive trip information and may not replace traditional household survey data. For instance, mobile phone data do not provide information on the specific activity type, trip purpose, mode of transportation, or exact home location, and it is very difficult to identify whether a traveler is moving or staying at a location. For a much deeper understanding of spatiotemporal mobility of elderly people, this emerging data source needs to be combined with other data sources.

Author Contributions

Conceptualization, K.-S.L. and J.K.E.; methodology, K.-S.L.; software, K.-S.L.; validation, J.K.E., J.L. and S.K.; formal analysis, K.-S.L.; investigation, J.L.; resources, J.L.; data curation, J.K.E.; writing-original draft preparation, K.-S.L.; writing-review and editing, K.-S.L. and J.K.E.; visualization, S.K.; supervision, J.L.; project administration, J.K.E.; funding acquisition, J.K.E. All authors have read and agreed to the published version of the manuscript.

Funding

This research was funded by a grant from R&D program (PK2101C4) of the Korea Railroad Research Institute, Korea.

Data Availability Statement

Not applicable.

Acknowledgments

Support for this research from the R&D program of the Korea Railroad Research Institute, Korea is gratefully acknowledged.

Conflicts of Interest

The authors declare no conflict of interest.

References

  1. UN. World Population Ageing 2019 Highlights; Department of Economic and Social Affairs, United Nations: New York, NY, USA, 2019. [Google Scholar]
  2. Szeto, W.; Yang, L.; Wong, R.; Li, Y.; Wong, S. Spatio-temporal travel characteristics of the elderly in an ageing society. Travel Behav. Soc. 2017, 9, 10–20. [Google Scholar] [CrossRef] [Green Version]
  3. Eurostat. Ageing Europe: Looking at the Lives of Older People in the EU; Eurostat: Luxembourg, 2019. [Google Scholar]
  4. Statistics Korea. Statistics on the Elderly in Korea. 2019. Available online: http://kostat.go.kr/portal/korea/kor_nw/1/1/index.board?bmode=read&aSeq=377701 (accessed on 17 April 2020).
  5. Fatima, K.; Moridpour, S.; De Gruyter, C.; Saghapour, T. Elderly Sustainable Mobility: Scientific Paper Review. Sustainability 2020, 12, 7319. [Google Scholar] [CrossRef]
  6. Boschmann, E.E.; Brady, S.A. Travel behaviors, sustainable mobility, and transit-oriented developments: A travel counts analysis of older adults in the Denver, Colorado metropolitan area. J. Transp. Geogr. 2013, 33, 1–11. [Google Scholar] [CrossRef]
  7. Ipingbemi, O. Travel characteristics and mobility constraints of the elderly in Ibadan, Nigeria. J. Transp. Geogr. 2010, 18, 285–291. [Google Scholar] [CrossRef]
  8. Paez, A.; Scott, D.; Potoglou, P.; Kanarogou, P.; Newbold, K.B. Elderly mobility: Demographic and spatial analysis of travel making in the Hamilton CMA, Canada. Urban Stud. 2007, 44, 123–146. [Google Scholar] [CrossRef]
  9. Liu, C.; Bardaka, E.; Palakurthy, R.; Tung, L.-W. Analysis of travel characteristics and access mode choice of elderly urban rail riders in Denver, Colorado. Travel Behav. Soc. 2020, 19, 194–206. [Google Scholar] [CrossRef]
  10. Liu, W.; Lu, H.; Sun, Z.; Liu, J. Elderly’s Travel Patterns and Trends: The Empirical Analysis of Beijing. Sustainability 2017, 9, 981. [Google Scholar] [CrossRef] [Green Version]
  11. Bocker, L.; Amen, P.; Helbich, M. Elderly travel frequencies and transport mode choices in Greater Rotterdam, the Netherlands. Transportation 2017, 44, 831–852. [Google Scholar] [CrossRef] [Green Version]
  12. Kim, S. Assessing mobility in an aging society: Personal and built environment factors associated with older people’s subjective transportation deficiency in the US. Transp. Res. Part F Traffic Psychol. Behav. 2011, 14, 422–429. [Google Scholar] [CrossRef]
  13. Kim, S.; Ulfarsson, G.F. Travel Mode Choice of the Elderly: Effects of Personal, Household, Neighborhood, and Trip Characteristics. Transp. Res. Rec. J. Transp. Res. Board 2004, 1894, 117–126. [Google Scholar] [CrossRef]
  14. Lucas, T.Y.I.; Archilla, A.R.; Papacostas, C.S. Mode Choice Behavior of Elderly Travelers in Honolulu, Hawaii. Transp. Res. Rec. J. Transp. Res. Board 2007, 2013, 71–79. [Google Scholar] [CrossRef]
  15. Moniruzzaman, M.; Páez, A.; Habib, K.M.N.; Morency, C. Mode use and trip length of seniors in Montreal. J. Transp. Geogr. 2013, 30, 89–99. [Google Scholar] [CrossRef]
  16. FHWA. Summary of Travel Trends: 2017 National Household Travel Survey; U.S. Department of Transportation, Federal Highway Administration: Washington, DC, USA, 2017. [Google Scholar]
  17. Buehler, R.; Nobis, C. Travel behavior in aging societies: Comparison of Germany and the United States. Transp. Res. Rec. J. Transp. Res. Board 2010, 2182, 62–70. [Google Scholar] [CrossRef]
  18. Golob, T.F.; Hensher, D.A. The trip chaining activity of Sydney residents: A cross-section assessment by age group with a focus on seniors. J. Transp. Geogr. 2007, 15, 298–312. [Google Scholar] [CrossRef] [Green Version]
  19. Schmöcker, J.-D.; Su, F.; Noland, R.B. An analysis of trip chaining among older London residents. Transportation 2009, 37, 105–123. [Google Scholar] [CrossRef]
  20. Camporeale, R.; Wretstrand, A.; Andersson, M. How the built environment and the railway network can affect the mobility of older people: Analyses of the southern Swedish region of Scania. Res. Transp. Bus. Manag. 2019, 30, 100368. [Google Scholar] [CrossRef]
  21. Siu, B.W. Assessment of physical environment factors for mobility of older adults: A case study in Hong Kong. Res. Transp. Bus. Manag. 2019, 30, 100370. [Google Scholar] [CrossRef]
  22. Cheng, L.; Chen, X.; Yang, S.; Cao, Z.; De Vos, J.; Witlox, F. Active travel for active ageing in China: The role of built environment. J. Transp. Geogr. 2019, 76, 142–152. [Google Scholar] [CrossRef]
  23. Yang, Y.; Xu, Y.; Rodriguez, D.A.; Michael, Y.; Zhang, H. Active travel, public transportation use, and daily transport among older adults: The association of built environment. J. Transp. Health 2018, 9, 288–298. [Google Scholar] [CrossRef]
  24. Feng, J. The influence of built environment on travel behavior of the elderly in urban China. Transp. Res. Part D Transp. Environ. 2017, 52, 619–633. [Google Scholar] [CrossRef]
  25. van den Berg, P.; Kemperman, A.; de Kleijn, B.; Borgers, A. Ageing and loneliness: The role of mobility and the built environment. Travel Behav. Soc. 2016, 5, 48–55. [Google Scholar]
  26. Jordan, G.A.; Anastasopoulos, P.C.; Peeta, S.; Somenahalli, S.; Rogerson, P.A. Identifying elderly travel time disparities using a correlated grouped random parameters hazard-based duration approach. Res. Transp. Bus. Manag. 2019, 30. [Google Scholar] [CrossRef]
  27. Alsnih, R.; Hensher, D.A. The mobility and accessibility expectations of seniors in an aging population. Transp. Res. Part A Policy Pract. 2003, 37, 903–916. [Google Scholar] [CrossRef]
  28. Schmöcker, J.-D.; Quddus, M.; Noland, R.; Bell, M. Estimating Trip Generation of Elderly and Disabled People: Analysis of London Data. Transp. Res. Rec. J. Transp. Res. Board 2005, 1924, 9–18. [Google Scholar] [CrossRef]
  29. Ma, X.; Liu, C.; Wen, H.; Wang, Y.; Wu, Y.-J. Understanding commuting patterns using transit smart card data. J. Transp. Geogr. 2017, 58, 135–145. [Google Scholar] [CrossRef]
  30. Nitsche, P.; Widhalm, P.; Breuss, S.; Brändle, N.; Maurer, P. Supporting large-scale travel surveys with smartphones—A practical approach. Transp. Res. Part C Emerg. Technol. 2014, 43, 212–221. [Google Scholar] [CrossRef]
  31. Shoval, N.; Auslander, G.; Cohen-Shalom, K.; Isaacson, M.; Landau, R.; Heinik, J. What can we learn about the mobility of the elderly in the GPS era? J. Transp. Geogr. 2010, 18, 603–612. [Google Scholar] [CrossRef]
  32. Chen, C.; Bian, L.; Ma, J. From traces to trajectories: How well can we guess activity locations from mobile phone traces? Transp. Res. Part C Emerg. Technol. 2014, 46, 326–337. [Google Scholar] [CrossRef]
  33. Golob, T.T.; Meurs, H. Biases in response over time in a seven-day travel diary. Transportation 1986, 13, 163–181. [Google Scholar] [CrossRef]
  34. Dujardin, S.; Jacques, D.; Steele, J.; Linard, C. Mobile phone data for urban climate change adaptation: Reviewing applications, opportunities and key challenges. Sustainability 2020, 12, 1501. [Google Scholar] [CrossRef] [Green Version]
  35. Lynch, J.; Dumont, J.; Greene, E.; Ehrlich, J. Use of a Smartphone GPS Application for Recurrent Travel Behavior Data Collection. Transp. Res. Rec. J. Transp. Res. Board 2019, 2673, 89–98. [Google Scholar] [CrossRef]
  36. Zhang, R.; Ye, X.; Wang, K.; Li, D.; Zhu, J. Development of Commute Mode Choice Model by Integrating Actively and Passively Collected Travel Data. Sustainability 2019, 11, 2730. [Google Scholar] [CrossRef] [Green Version]
  37. Nahmias-Biran, B.-H.; Han, Y.; Bekhor, S.; Zhao, F.; Zegras, C.; Ben-Akiva, M. Enriching Activity-Based Models using Smartphone-Based Travel Surveys. Transp. Res. Rec. J. Transp. Res. Board 2018, 2672, 280–291. [Google Scholar] [CrossRef]
  38. NCHRP. Cell Phone Location Data for Travel Behavior Analysis; National Cooperative Highway Research Report 868; TRB’s National Cooperative Highway Research Program: Washington, DC, USA, 2018. [Google Scholar]
  39. Vij, A.; Shankari, K. When is big data big enough? Implications of using GPS-based surveys for travel demand analysis. Transp. Res. Part C Emerg. Technol. 2015, 56, 446–462. [Google Scholar] [CrossRef] [Green Version]
  40. Yue, Y.; Lan, T.; Yeh AG, O.; Li, Q.-Q. Zooming into individuals to understand the collective: A review of trajectory-based ravel behavior studies. Travel Behav. Soc. 2014, 1, 69–78. [Google Scholar] [CrossRef]
  41. Eom, J.K.; Lee, K.-S.; Seong, M.-E. Development and application of the Activity-BAsed Traveler Analyzer (ABATA) system. Futur. Gener. Comput. Syst. 2020, 106, 135–153. [Google Scholar] [CrossRef]
  42. Lee, K.-S.; You, S.Y.; Eom, J.K.; Song, J.; Min, J.H. Urban spatiotemporal analysis using mobile phone data: Case study of medium- and large-sized Korean cities. Habitat Int. 2018, 73, 6–15. [Google Scholar] [CrossRef]
  43. Wong, R.; Szeto, W.; Yang, L.; Li, Y.; Wong, S. Public transport policy measures for improving elderly mobility. Transp. Policy 2018, 63, 73–79. [Google Scholar] [CrossRef] [Green Version]
  44. Mohd, S.; Latiff, A.R.A.; Senadjki, A. Travel Behavior of Elderly in George Town and Malacca, Malaysia. Sustainability 2019, 11, 5251. [Google Scholar] [CrossRef] [Green Version]
  45. Jian, M.; Shi, J.; Liu, Y. Dependence of the Future Elderly on Private Cars: A Case Study in Beijing. Promet TrafficTransp. 2018, 30, 45–55. [Google Scholar] [CrossRef]
  46. Johansson-Stenman, O. Estimating individual driving distance by car and public transport use in Sweden. Appl. Econ. 2002, 34, 959–967. [Google Scholar] [CrossRef]
  47. Van den Berg, P.; Arentze, T.; Timmermans, H. Estimating social travel demand of senior citizens in the Netherlands. J. Transp. Geogr. 2011, 19, 323–331. [Google Scholar] [CrossRef]
  48. He, S.Y.; Cheung YH, Y.; Tao, S. Travel mobility and social participation among older people in a transit metropolis: A socio-spatial-temporal perspective. Transp. Res. Part A 2018, 118, 608–626. [Google Scholar] [CrossRef]
  49. Ryan, J.; Wretstrand, A. What’s mode got to do with it? Exploring the links between public transport and car access and opportunities for everyday activities among older people. Travel Behav. Soc. 2019, 14, 107–118. [Google Scholar] [CrossRef]
  50. Perchoux, C.; Brondeel, R.; Wasfi, R.; Klein, O.; Caruso, G.; Vallee, J.; Klein, S.; Thierry, B.; Dijst, M.; Chaix, B.; et al. Walking, trip purpose, and exposure to multiple environments: A case study of older adults in Luxembourg. J. Transp. Health 2019, 13, 170–184. [Google Scholar] [CrossRef]
  51. Truong, L.T.; Somenahalli, S.V. Exploring frequency of public transport use among older adults: A study in Adelaide, Australia. Travel Behav. Soc. 2015, 2, 148–155. [Google Scholar] [CrossRef]
  52. Newbold, K.B.; Scott, D.M.; Spinney, J.E.; Kanaroglou, P.; Páez, A. Travel behavior within Canada’s older population: A cohort analysis. J. Transp. Geogr. 2005, 13, 340–351. [Google Scholar] [CrossRef]
  53. Tacken, M. Mobility of the elderly in time and space in the Netherlands: An analysis of the Dutch National Travel Survey. Transportation 1998, 25, 379–393. [Google Scholar] [CrossRef]
  54. Zhang, Y.; Yao, E.; Zhang, R.; Xu, H. Analysis of elderly people’s travel behaviours during the morning peak hours in the context of the free bus programme in Beijing, China. J. Transp. Geogr. 2019, 76, 191–199. [Google Scholar] [CrossRef]
  55. Shao, F.; Sui, Y.; Yu, X.; Sun, R. Spatio-temporal travel patterns of elderly people–A comparative study based on buses usage in Qingdao, China. J. Transp. Geogr. 2019, 76, 178–190. [Google Scholar] [CrossRef]
  56. Shi, Z.; Pun-Cheng, L.S.C.; Liu, X.; Lai, J.; Tong, C.; Zhang, A.; Zhang, M.; Shi, W. Analysis of the temporal characteristics of the elderly traveling by bus using smart card data. Int. J. Geo-Inf. 2020, 9, 751. [Google Scholar] [CrossRef]
  57. Kuppam, A.R.; Pendyala, R.M. A structural equations analysis of commuters’ activity and travel patterns. Transp. Research Part C Emerg. Technol. 2001, 28, 33–54. [Google Scholar] [CrossRef]
  58. Houston, D.W.; Luong, T.T.; Boarnet, M.G. Tracking daily travel; Assessing discrepancies between GPS-derived and self-reported travel patterns. Transp. Res. Part C Emerg. Technol. 2014, 48, 97–108. [Google Scholar] [CrossRef]
  59. Feng, T.; Timmermans, H.J.P. Transportation mode recognition using GPS and accelerometer data. Transp. Res. Part C Emerg. Technol. 2013, 37, 118–130. [Google Scholar] [CrossRef]
  60. Stopher, P.; Wargelin, L.; Minser, J.; Tierney, K.; Rhindress, M.; O’Connor, S. GPS-Based Household Interview Survey for the Cincinnati, Ohio Region; SRBI, Incorporated: Cincinnati, OH, USA, 2012. [Google Scholar]
  61. Bohte, W.; Maat, K. Deriving and validating trip purposes and travel modes for multi-day GPS-based travel surveys: A large-scale application in the Netherlands. Transp. Res. Part C Emerg. Technol. 2009, 17, 285–297. [Google Scholar] [CrossRef]
  62. Stopher, P.; Fitzgerald, C.; Zhang, J. Search for a global positioning system device to measure person travel. Transp. Res. Part C Emerg. Technol. 2008, 16, 350–369. [Google Scholar] [CrossRef]
  63. Goulet-Langlois, G.; Koutsopoulos, H.N.; Zhao, J. Inferring patterns in the multi-week activity sequences of public transport users. Transp. Res. Part C Emerg. Technol. 2016, 64, 1–16. [Google Scholar] [CrossRef] [Green Version]
  64. Robinson, S.; Narayanan, B.; Toh, N.; Pereira, F. Methods for pre-processing smartcard data to improve data quality. Transp. Res. Part C Emerg. Technol. 2014, 49, 43–58. [Google Scholar] [CrossRef]
  65. Calabrese, F.; Diao, M.; Lorenzo, G.D.; Ferreira, J.; Ratti, C. Understanding individual mobility patterns from urban sensing data: A mobile phone trace example. Transp. Res. Part C Emerg. Technol. 2013, 26, 301–313. [Google Scholar] [CrossRef]
  66. Simini, F.; González, M.C.; Maritan, A.; Barabási, A.-L. A universal model for mobility and migration patterns. Nat. Cell Biol. 2012, 484, 96–100. [Google Scholar] [CrossRef] [PubMed]
  67. Asakura, Y.; Iryo, T. Analysis of tourist behaviour based on the tracking data collected using a mobile communication instrument. Transp. Res. Part A Policy Pract. 2007, 41, 684–690. [Google Scholar] [CrossRef]
  68. Eagle, N.N.; Pentland, A.S. Eigenbehaviors: Identifying structure in routine. Behav. Ecol. Sociobiol. 2009, 63, 1057–1066. [Google Scholar] [CrossRef] [Green Version]
  69. Alexander, L.; Jiang, S.; Murga, M.; González, M.C. Origin–destination trips by purpose and time of day inferred from mobile phone data. Transp. Res. Part C Emerg. Technol. 2015, 58, 240–250. [Google Scholar] [CrossRef]
  70. Iqbal, M.S.; Choudhury, C.F.; Wang, P.; Gonzalez, M.C. Development of origin-destination matrices using mobile phone call data. Transp. Res. Part C Emerg. Technol. 2014, 40, 63–74. [Google Scholar] [CrossRef] [Green Version]
  71. Mamei, M.; Colonna, M.; Galassi, M. Automatic identification of relevant places from cellular network data. Pervasive Mob. Comput. 2016, 31, 147–158. [Google Scholar] [CrossRef]
  72. IT STAT (IT Statistics of Korea). Statistics of Wire/Wireless Communication Service Subscribers. Available online: http://www.itstat.go.kr/itstat/kor/statsDta/StatsDtaList.html (accessed on 22 February 2021). (In Korean).
  73. KOSIS (Korean Statistical Information Service). Statistics on Population. 2020. Available online: http://kosis.kr/eng/ (accessed on 7 May 2020).
  74. UN. Principles and Recommendations for Population and Housing Censuses; Revision 3; United Nations: New York, NY, USA, 2017. [Google Scholar]
  75. Shrestha, B.P.; Millonig, A.; Hounsell, N.B.; McDonald, M. Review of Public Transport Needs of Older People in European Context. J. Popul. Ageing 2017, 10, 343–361. [Google Scholar] [CrossRef] [Green Version]
  76. Van Hoof, J.; Kazak, J.K.; Perek-Białas, J.M.; Peek, S.T.M. The Challenges of Urban Ageing: Making Cities Age-Friendly in Europe. Int. J. Environ. Res. Public Health 2018, 15, 2473. [Google Scholar] [CrossRef] [PubMed] [Green Version]
  77. UN, Transforming Our World: The 2030 Agenda for Sustainable Development. 2019. Available online: https://sdgs.un.org/2030agenda (accessed on 20 February 2021).
  78. Falchetta, G.; Noussan, M. The impact of COVID-19 on transport demand, modal choices, and sectoral energy consumption in Europe. IAEE Energy Forum 2020, 48–50, Special Covid-19 Edition. [Google Scholar]
  79. Avetisyan, H.G.; Miller-Hooks, E.; Melanta, S.; Qi, B. Effects of vehicle technologies, traffic volume changes, incidents and work zones on greenhouse gas emissions production. Transp. Res. Part D 2014, 26, 10–19. [Google Scholar] [CrossRef]
  80. Portugal-Pereira, J.O.; Doll CN, H.; Suwa, A.; Puppim de Oliveira, J.A. The sustainable mobility-congestion nexus: A co-benefits approach to finding win-win solutions. Transp. Commun. Bull. Asia Pac. 2013, 82, 19–31. [Google Scholar]
  81. Rosenbloom, S. Sustainability and automobility among the elderly: An international assessment. Transportation 2001, 28, 375–408. [Google Scholar] [CrossRef]
Figure 1. Data structure.
Sustainability 13 03025 g001
Figure 2. Study area of Gangnam.
Sustainability 13 03025 g002
Figure 3. Comparison of hourly present-in-area population in Gangnam.
Sustainability 13 03025 g003
Figure 4. Comparison of hourly nonhome population.
Sustainability 13 03025 g004
Figure 5. Hourly activity type of nonelderly people.
Sustainability 13 03025 g005
Figure 6. Hourly activity type of elderly people.
Sustainability 13 03025 g006
Figure 7. Comparison of the nonhome activity locations at 2:00 p.m.
Sustainability 13 03025 g007
Figure 8. Comparison of the nonhome activity locations of Gangnam resident at 2:00 p.m.
Sustainability 13 03025 g008
Figure 9. Proportion of trips by departure time.
Sustainability 13 03025 g009
Figure 10. Departure time by travel sequence of the nonelderly people.
Sustainability 13 03025 g010
Figure 11. Departure time by travel sequence of the elderly people.
Sustainability 13 03025 g011
Table 1. Overview of dataset classified by age, gender, and residence.
AgeGenderNumber of PeopleRatio
Gangnam ResidentNonresidentGangnam ResidentNonresident
20 ≤ Age < 30Male36,690 91,119 7.4%7.5%
Female46,530 137,916 9.4%11.4%
30 ≤ Age < 40Male60,309 198,723 12.2%16.4%
Female62,258 145,170 12.6%12.0%
40 ≤ Age < 50Male58,607 191,965 11.8%15.8%
Female60,334 99,594 12.2%8.2%
50 ≤ Age < 65Male59,470 170,139 12.0%14.0%
Female61,693 97,300 12.5%8.0%
65 ≤ Age < 70Male11,106 26,542 2.2%2.2%
Female11,259 15,428 2.3%1.3%
70 ≤ Age < 75Male7542 14,717 1.5%1.2%
Female7094 8984 1.4%0.7%
75 ≤ Age < 80Male4383 6734 0.9%0.6%
Female3428 4252 0.7%0.4%
Age ≥ 80Male2043 2630 0.4%0.2%
Female2288 2730 0.5%0.2%
Total495,0341,213,943100.0%100.0%
Table 2. Nonhome activity by age and gender group.
GroupNumber of PeopleNumber of Nonhome ActivitiesAverage Nonhome Activities
20 ≤ Age < 30312,255 1,061,929 3.40
30 ≤ Age < 40466,460 1,676,912 3.59
40 ≤ Age < 50410,500 1,589,696 3.87
50 ≤ Age < 65388,602 1,621,595 4.17
Nonelderly1,577,8175,950,1323.77
65 ≤ Age < 7064,335 263,476 4.10
70 ≤ Age < 7538,337 144,228 3.76
75 ≤ Age < 8018,797 65,691 3.49
80 ≤ Age9691 31,734 3.27
Elderly131,160505,1293.85
Nonelderly men867,022 3,675,671 4.24
Nonelderly women710,795 2,274,461 3.20
Elderly men75,697 334,246 4.42
Elderly women55,463 170,883 3.08
Table 3. Ratio of nonhome activities of the nonelderly (unit: %).
AgeGenderT7T8T9T10T11T12T13T14T15T16T17T18T19T20T21T22
20 ≤ Age < 30Male28465965697274767675747063575041
Female25496368727678808080787262544432
30 ≤ Age < 40Male37597076788082838382807362534536
Female25486268727475767674716352433425
40 ≤ Age < 50Male42617278818283848382787160514334
Female23415462676970706865615345373021
50 ≤ Age < 65Male42576873767879807977726455474032
Female23375058646769706762565042352720
Total32516470737677787776726556484030
Table 4. Ratio of nonhome activity of the elderly (unit: %).
AgeGenderT7T8T9T10T11T12T13T14T15T16T17T18T19T20T21T22
65 ≤ Age < 70Male37506067707273747268635547393328
Female22324454606364635952443832272117
70 ≤ Age < 75Male32445562676970716863564840332723
Female19294152596162605549413428241916
75 ≤ Age < 80Male25364958646768666255473931252018
Female19284150575961605648423530262219
Age ≥ 80Male19294353606364615549413429231916
Female20304049555760615752464136322823
Total27395059646667676458514437312521
Table 5. Total home activities hours by the nonelderly and the elderly people.
HoursRatio of Home Activity by the NonelderlyRatio of Home Activity by the Elderly
1–42.2%2.2%
5–811.6%7.2%
9–1234.0%18.8%
13–1626.4%26.8%
17–2013.8%23.5%
21–2412.0%21.4%
Total100%100%
Table 6. Average home activity times by age and gender group.
GroupNumber of PeopleHours of Home ActivityAverage Time per Person (Hours)
20 ≤ Age < 30312,2554,173,411 13.37
30 ≤ Age < 40466,4606,176,623 13.24
40 ≤ Age < 50410,5005,534,344 13.48
50 ≤ Age < 65388,602 5,424,727 13.96
Nonelderly1,577,81721,309,10513.51
65 ≤ Age < 7064,335972,112 15.11
70 ≤ Age < 7538,337607,877 15.86
75 ≤ Age < 8018,797310,240 16.50
80 ≤ Age9691 162,196 16.74
Elderly131,1602,052,42515.65
Nonelderly men867,022 10,993,658 12.68
Nonelderly women710,795 10,315,447 14.51
Elderly men75,697 1,122,835 14.83
Elderly women55,463 929,590 16.76
Table 7. Analysis of nonhome activity hours.
GroupTotal Hours of Nonhome ActivityAverage Hours per PersonTotal Duration of Nonhome ActivityAverage Duration per Person’s Nonhome Activity
20 ≤ Age < 303,292,331 10.541,217,018 3.90
30 ≤ Age < 404,971,521 10.661,767,216 3.79
40 ≤ Age < 504,278,749 10.421,393,856 3.40
50 ≤ Age < 653,856,669 9.921,184,758 3.05
Average of nonelderly-10.39-3.53
65 ≤ Age < 70564,818 8.78173,626 2.70
70 ≤ Age < 75308,750 8.0598,354 2.57
75 ≤ Age < 80139,284 7.4144,312 2.36
80 ≤ Age69,439 7.1722,174 2.29
Average of elderly-8.25-2.58
Nonelderly men9,710,784 11.203,007,075 3.47
Nonelderly women6,688,486 9.412,555,772 3.60
Elderly men685,023 9.05199,280 2.63
Elderly women397,268 7.16139,186 2.51
Table 8. Average number of trips by age and gender group.
GroupNumber of PeopleNumber of TripsAverage
20 ≤ Age < 30312,255 1,339,846 4.29
30 ≤ Age < 40466,460 2,107,476 4.52
40 ≤ Age < 50410,500 1,998,730 4.87
50 ≤ Age < 65388,602 2,025,447 5.21
Nonelderly1,577,8177,471,4994.74
65 ≤ Age < 7064,335 331,899 5.16
70 ≤ Age < 7538,337 184,999 4.83
75 ≤ Age < 8018,797 85,043 4.52
80 ≤ Age9691 41,061 4.24
Elderly131,160643,0024.90
Nonelderly men867,022 4,485,342 5.17
Nonelderly women710,795 2,986,157 4.20
Elderly men75,697 416,231 5.50
Elderly women55,463 226,771 4.09
Publisher’s Note: MDPI stays neutral with regard to jurisdictional claims in published maps and institutional affiliations.

