Article

The Influence of Consumer Behavior on Climate Change: The Case of Switzerland

Empa, Swiss Federal Laboratories for Materials Science and Technology, Technology and Society Laboratory, Lerchenfeldstrasse 5, CH-9014 St. Gallen, Switzerland
*
Author to whom correspondence should be addressed.
Sustainability 2021, 13(5), 2966; https://doi.org/10.3390/su13052966
Submission received: 26 January 2021 / Revised: 1 March 2021 / Accepted: 3 March 2021 / Published: 9 March 2021
(This article belongs to the Special Issue Environmental Behaviour and Collective Decision Making)

Abstract

:
Reducing material flows and their associated environmental impacts substantially contributes to moving toward a more sustainable society. Both individual consumption behavior and governmental regulations play a crucial role in reaching sustainability goals. In this article, we present a Material Flow Analysis combined with a simplified Life Cycle Assessment of the Swiss economy. Results were linked to an analysis of consumption patterns. This allowed us to evaluate the direct influence of consumer behavior on national greenhouse gas emissions using a consumption-based approach and the quantification of the range of these emissions from different lifestyles. We conclude that the consumer has a direct influence on slightly more than 50% of the greenhouse gas emissions generated by the Domestic Material Consumption. If everybody were to behave like the 20% of the population with the most climate-friendly behavior, emissions would decrease by merely 16%. Cooperation between stakeholders at all levels of society is therefore needed. This study provides a contribution to decreasing material and energy consumption and defining possible future pathways with the final aim to bring anthropogenic greenhouse gas emissions down to zero in Switzerland.

1. Introduction

Anthropogenic climate change is one of the biggest challenges that humanity is facing [1,2,3]. Due to its complexity, time-delayed effects, global dimension, and the variety of actors involved, its consequences are often difficult to grasp, and its mitigation is perceived as beyond the control of governments and individuals [4,5,6].
In 2015, all 196 parties of the United Nations Framework Convention on Climate Change (UNFCCC) adopted the Paris Agreement as an attempt to reduce the risks and impacts of climate change [7]. The goal was set to hold the increase in global average temperature to well below 2 °C above pre-industrial levels, with an intent to limit the rise to 1.5 °C. However, the agreement has not proven its effectiveness yet, as global greenhouse gas (GHG) emissions continue to rise. According to the United Nations Environment Program (UNEP), global GHG emissions in 2016 amounted to about 52 Gt, including the emissions induced by land use changes. By 2019, they had risen to about 59 Gt [8,9]. The reason for this is twofold: on the one hand, countries are not on track to meet their pledges [10]; on the other hand, the pledges do not—in their current state—allow countries to reach the agreement’s goal [11].
Victor et al. [10] argued that to make the Paris Agreement effective, national pledges need to include information on “who will do what by when, how they will do it and at what cost”. In an Environment Synthesis Report [12], the United Nations focused on the role of non-state and subnational actors (NSAs) such as states, regions, cities, companies, investors, foundations, cooperative initiatives, and civil society organizations in bridging the GHG emissions gap. The report showed that NSAs can both help with implementing pledges made at the national level and encourage efforts to go beyond current mitigation commitments. Existing studies quantifying the influence of NSAs in reducing national GHG emissions corroborate this statement [13,14,15,16,17,18,19,20,21]. In these studies, individuals play various roles, such as politicians, business women and men, investors, or activists. Fewer studies specifically analyze what could be the influence in bridging the GHG emissions gap of individuals in their role as consumers. Their contribution could, however, be relevant [22,23,24,25,26,27].
Hence, we believe that there must be a clearer mapping of stakeholders’ influence on national GHG emissions and the elaboration of possible future pathways at the national level that take into account the influence of consumers to bring anthropogenic greenhouse gas emissions down to zero. To do so, we suggest taking a consumption-based approach. This approach differs from the more commonly used territorial (production-based) one in that it considers all emissions released along the supply chain of goods and services consumed by national residents—i.e., emissions also produced outside of political borders [28]. It offers therefore additional emission reduction opportunities.
At the level of individuals, the analysis of consumer behavior allows analyzing the range of possible actions in their role as consumers—that is, actions involved in obtaining, consuming, and disposing of products and services [29]. The study of consumer behavior looks into individual qualities such as demographics, personality, lifestyles, and behavioral variables to explain what moves their consumption. Various publications analyzed, for instance, lifestyle patterns and the induced GHG emissions [22,30,31,32,33,34,35,36,37,38,39]. For example, Druckman and Jackson [33] evaluated the bare necessities of households in the United Kingdom (UK) and estimated the GHG emissions related to them. Results showed that GHG emissions of an average household could decrease by about 37%, still allowing its members to have a “decent” life. Moreover, Ala-Mantila et al. [30], Baiocchi et al. [31], Frömelt et al. [36], and Girod and De Haan [38] found a wide range of GHG emissions among different lifestyles. Baiocchi et al., for example, estimated the range of GHG emissions across lifestyle groups in the UK varying by a factor of 2–3.
Up to now, few studies have analyzed the impact of consumer behavior on the GHG emissions generated by a nation with a consumption-based approach [22,40,41]. Defining hotspots as well as clear roles and responsibilities for reducing GHG emissions would, however, be key to developing effective mitigation strategies as well bringing anthropogenic GHG emissions down to zero as fast as possible. This article aims to provide a step towards filling this gap by answering the following research question: “What is the influence of consumer behavior on GHG emissions generated by the Domestic Material Consumption (DMC) of a nation?”. We suggest that individuals in their role as consumers can have a substantial influence on reducing national GHG emissions. In our analysis, we took Switzerland as a case study, due to its very high GHG emissions per capita [42,43,44,45] and the consequent urgent need to reduce them.
This paper is structured as follows: In Section 1, we first provide an overview of existing studies on stakeholders’ influence on national GHG emissions. We then focus on the influence of consumer behavior and analyze the approaches used. Subsequently, in Section 2, we present the approach and the set of methods selected to answer our research question. We then move to Section 3, where we present the results of the application of our approach to the case of Switzerland. Finally, in Section 4 we provide conclusions concerning the influence of consumer behavior on greenhouse gas emissions generated by the domestic consumption of a nation.

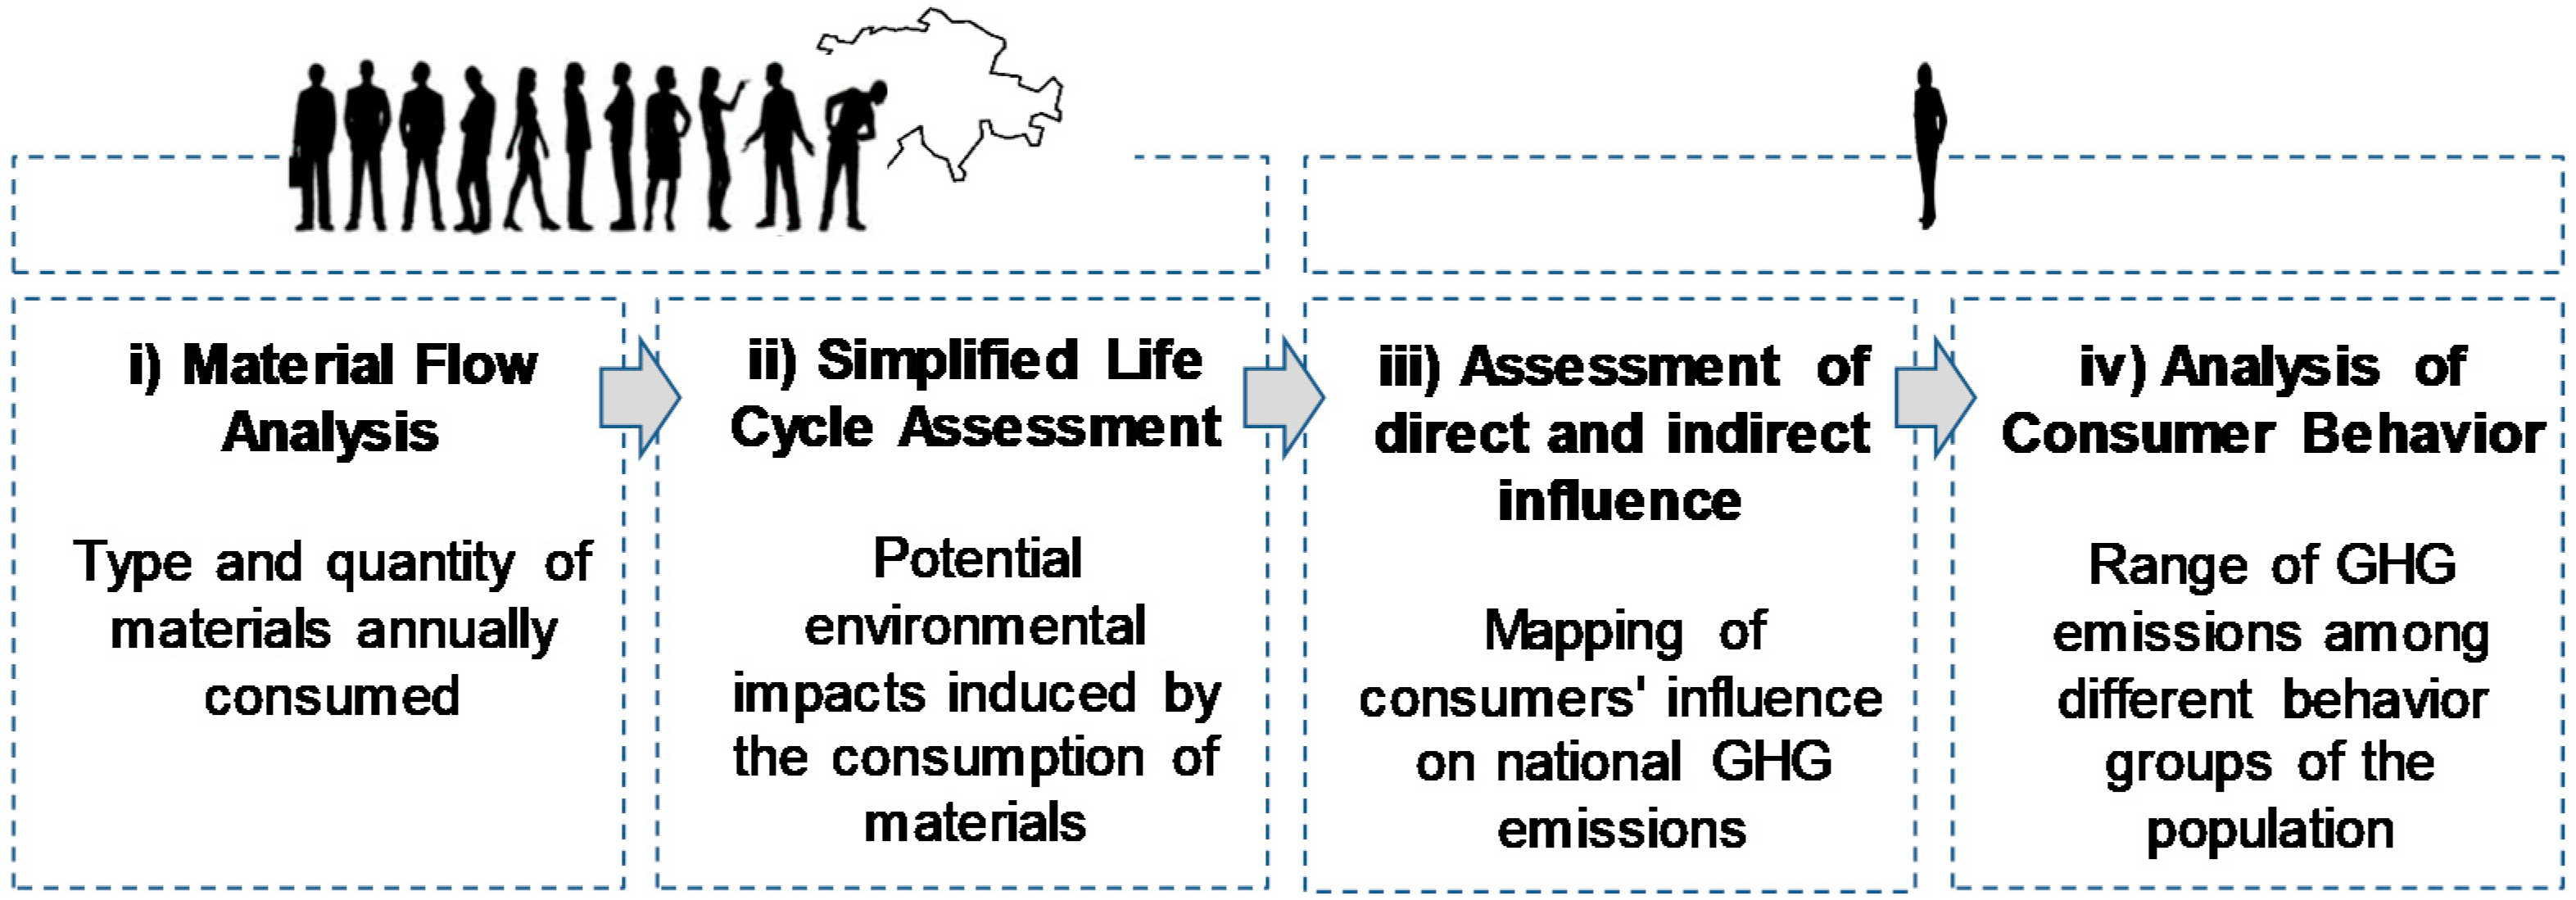
2. Materials and Methods

For our case study, we looked at Switzerland, which is among the 10 countries with the highest material footprint per capita and among the 20 countries with the highest carbon, water, and land footprint per capita worldwide [42]. Swiss consumption has a considerable environmental footprint abroad through the import of raw materials and semi-manufactured and finished products (in short: goods) [43,44,45]. Frischknecht et al. [45] estimate that more than half of the GHG emissions caused by Swiss consumption are generated outside the country. Under the Paris Agreement, Switzerland committed to halving its territorial GHG emissions by 2030 compared to its 1990 levels [46]. In 2019, the Federal Council set a more ambitious target and decided to reduce its net carbon emissions to zero by 2050 [47].
To determine the influence of consumer behavior on GHG emissions generated by Swiss consumption, we used a four-step approach with a set of related methods (Figure 1):
  • We carried out a Material Flow Analysis (MFA) to assess the type and quantity of materials annually consumed in Switzerland;
  • By combining the results of the MFA with impact factors, we subsequently performed a simplified Life Cycle Assessment (LCA). This allowed us to determine the potential environmental impacts induced by the annual consumption of various materials in Switzerland. We focused on quantifying the related emissions of greenhouse gases;
  • Based on steps (1) and (2), we made an educated guess of the direct and indirect influence of an average consumer on generating these emissions based mainly on statistical data provided by the government (see Table A1 in Appendix A);
  • We finally coupled our results with the outcomes of an analysis of consumption patterns developed by Frömelt et al. [36] to evaluate the range of GHG emissions among different behavior groups of the population.
We took the year 2018 as reference. The system boundaries for the MFA are the Swiss political borders: only national extraction and flows of materials that cross these borders in a given year are accounted for. With the LCA, however, the system boundaries are not fixed in space and time; environmental impacts generated alongside the life cycle of materials—no matter where or when they occur—are considered.
Consumer behavior was analyzed at the level of an individual. We considered the total resident population. In 2018, the population of Switzerland amounted to about 8.5 million inhabitants [48].

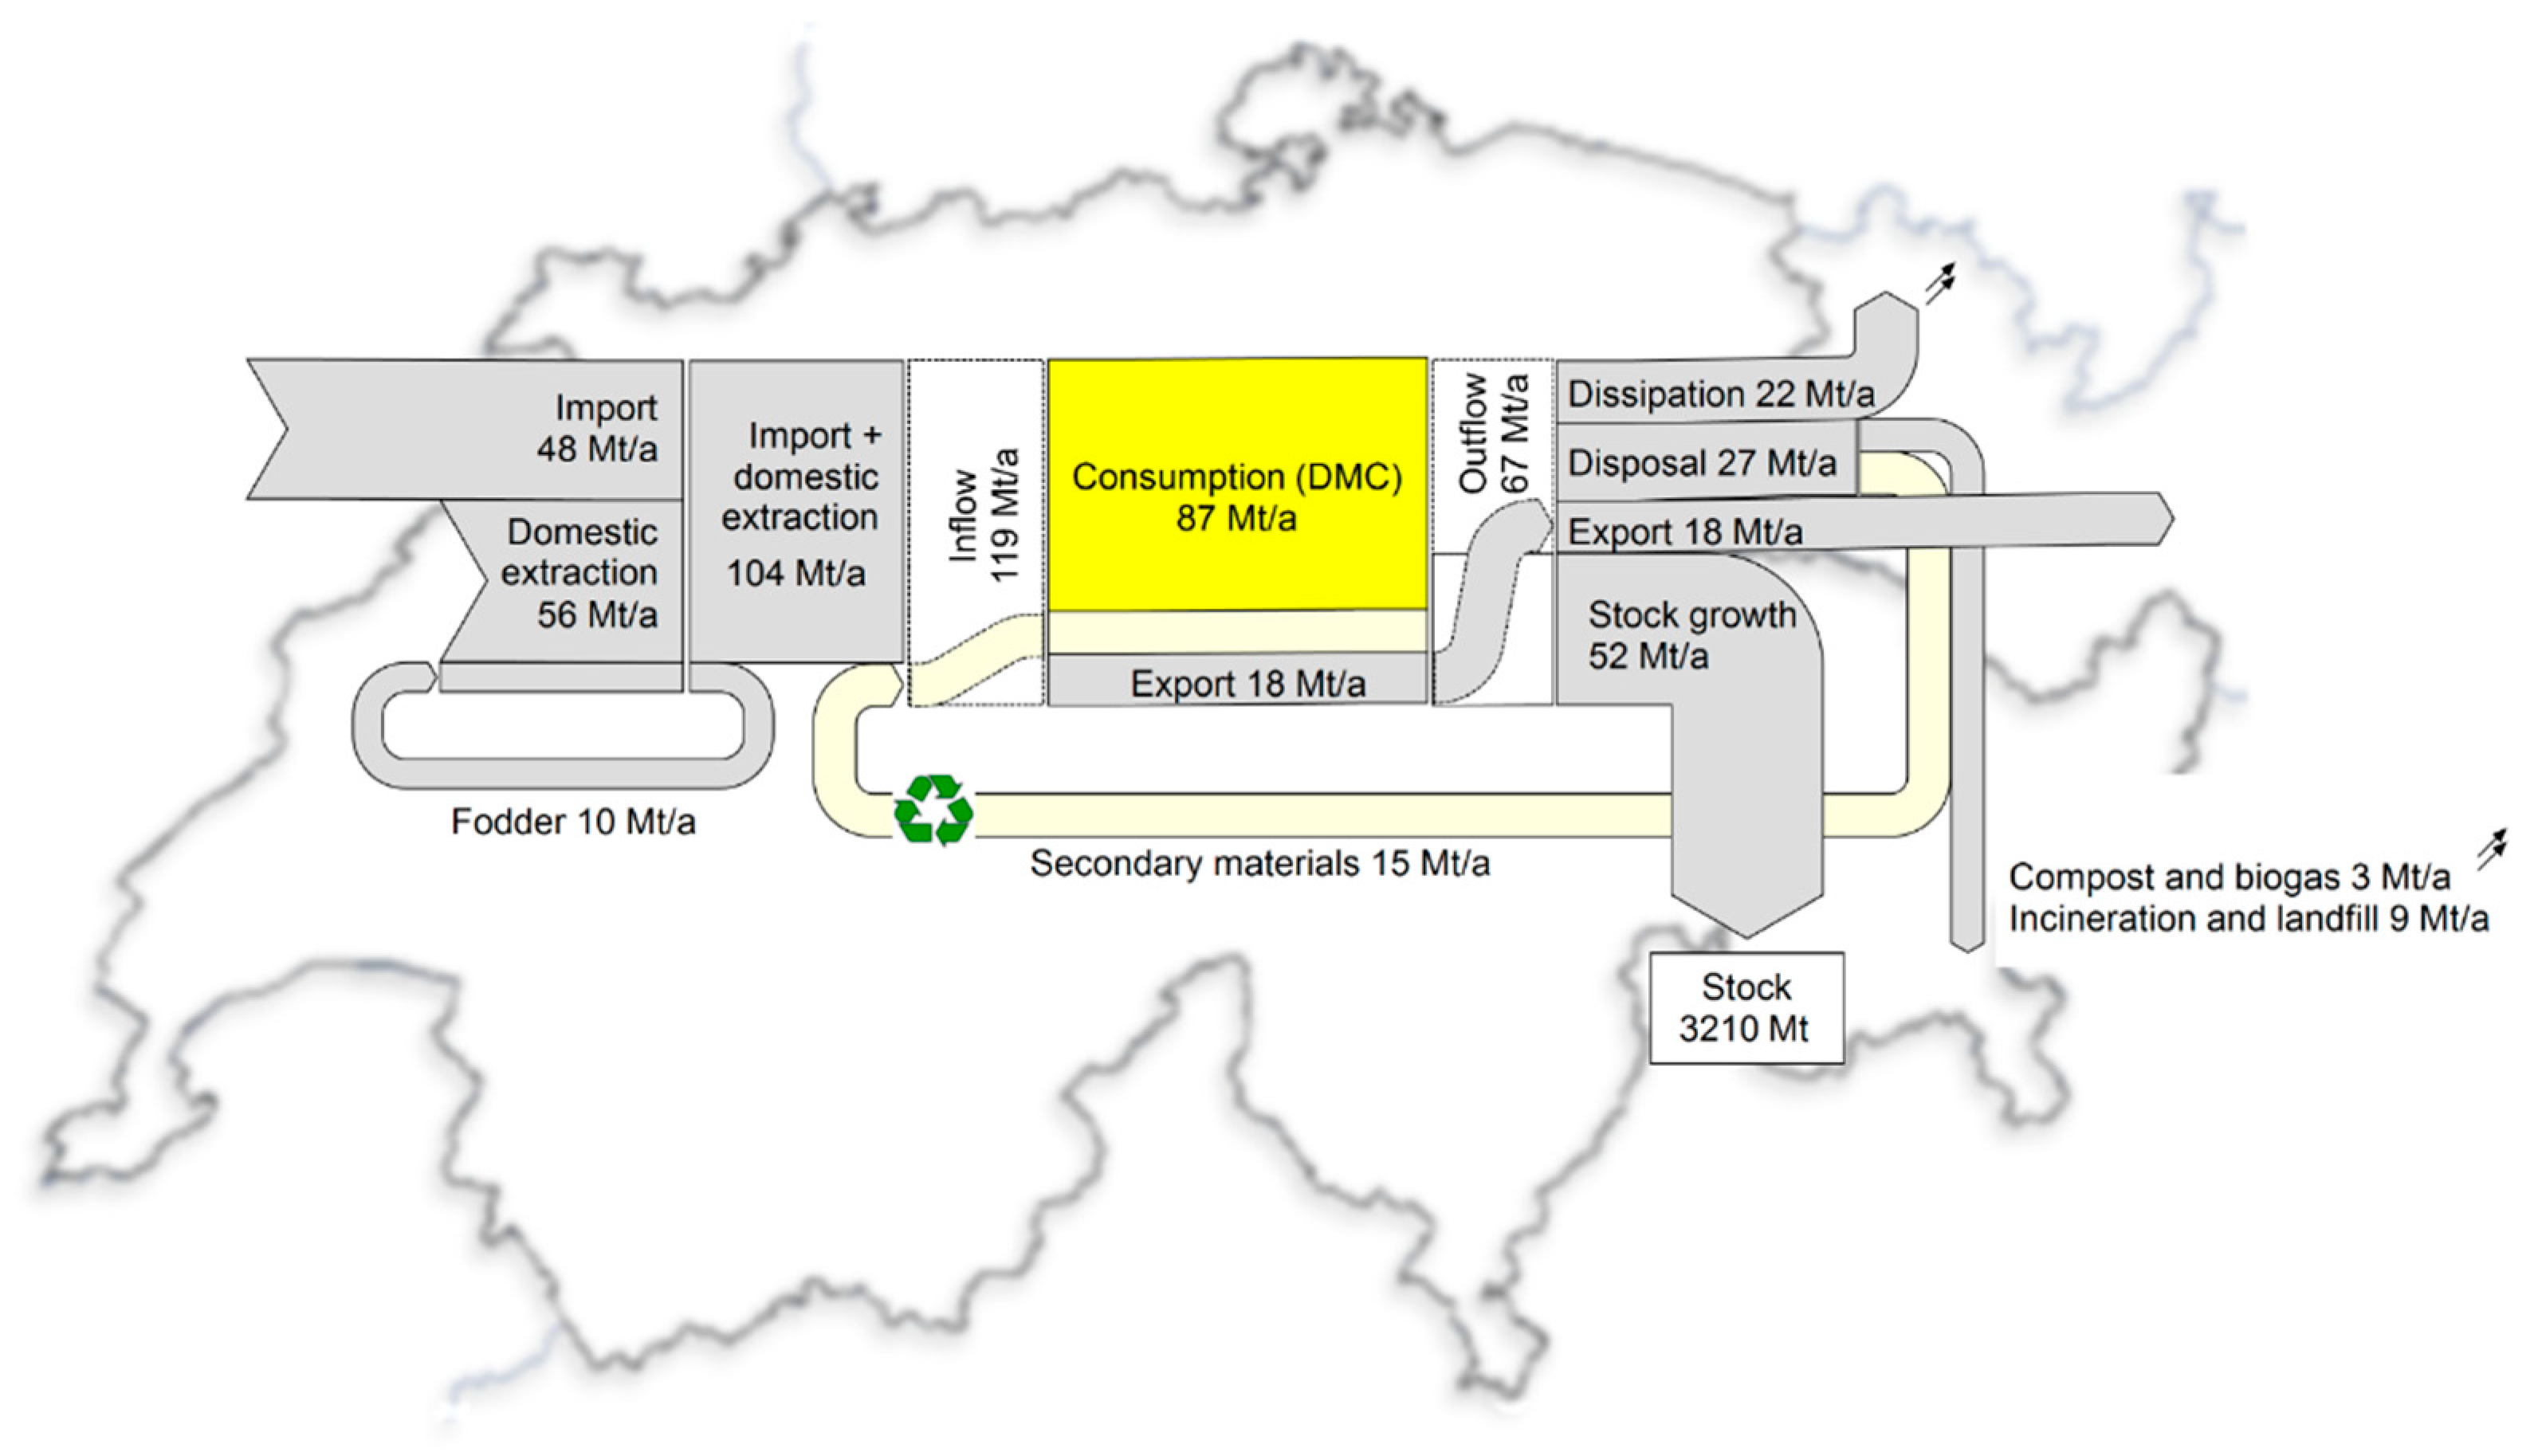
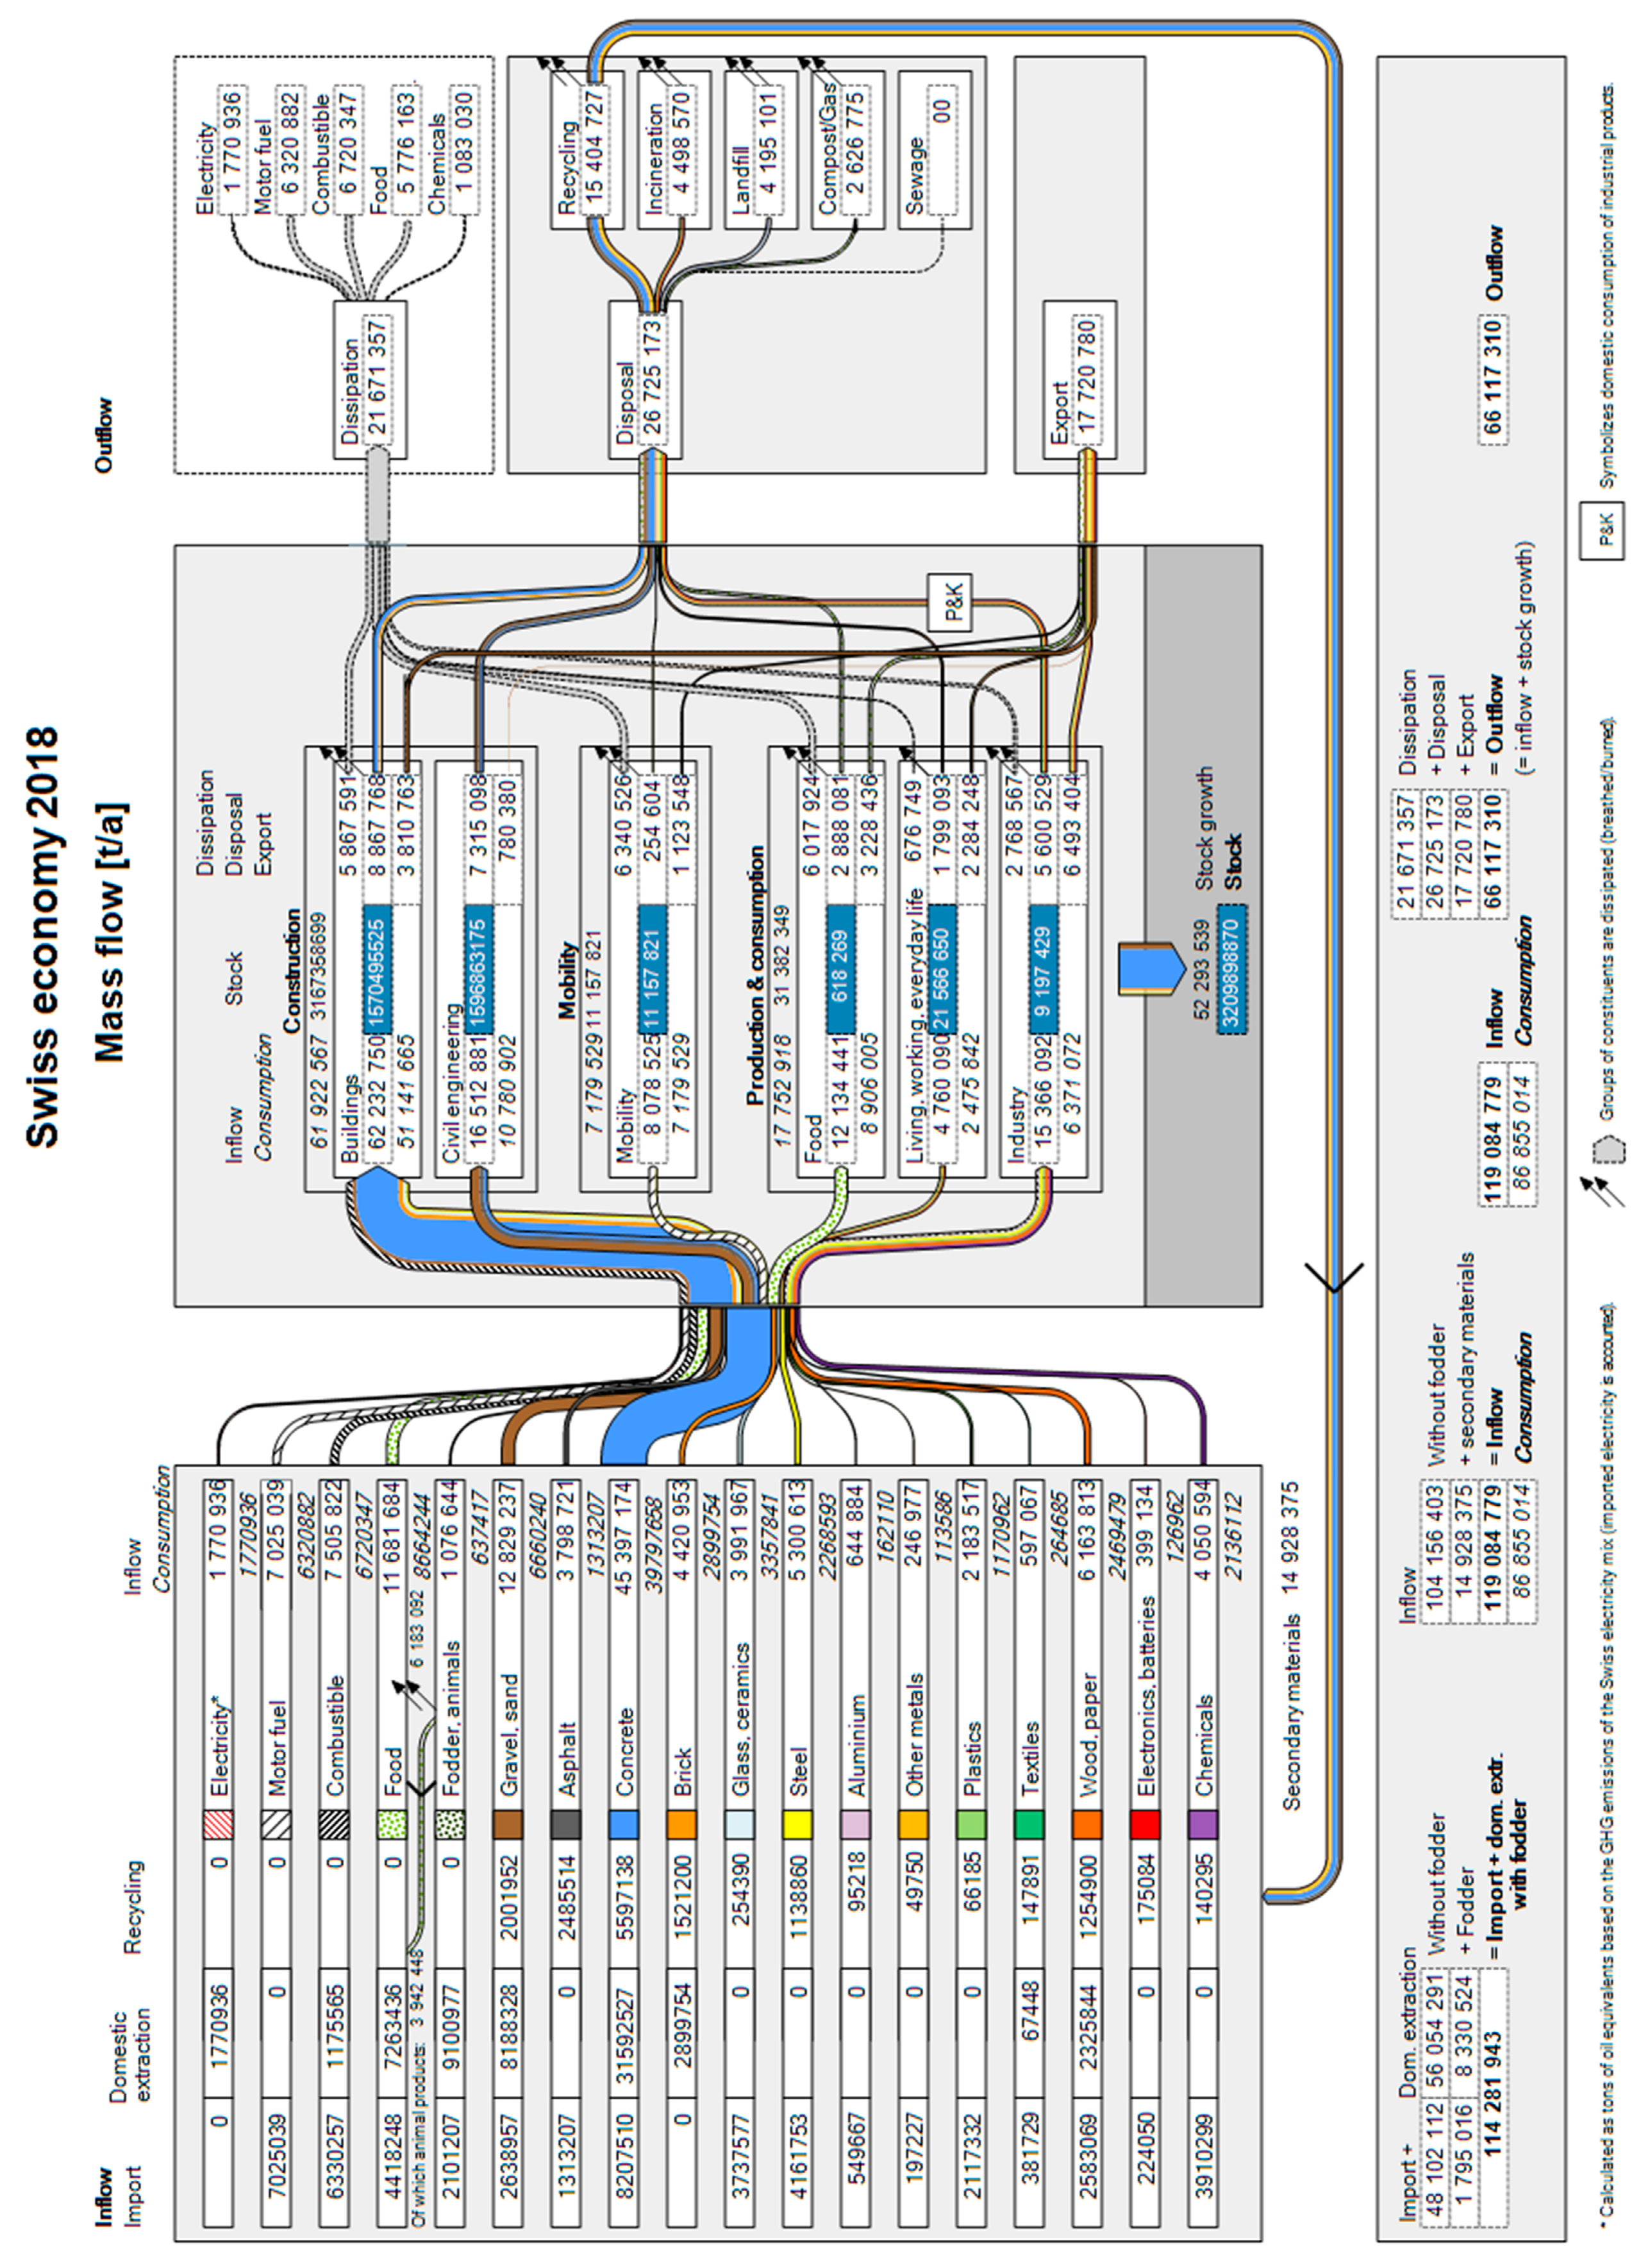
2.1. Material Flows in the Swiss Economy

There are various methods for evaluating material flows in an economy [49]. Among the most common is the MFA method [50,51]. At the macro-economic level, MFA allows investigating material inputs into a national economy, their accumulation within the system, and their output to other economies or the environment [52]. Our MFA is based on both stock-driven and inflow-driven static models. With the first type of model, we calculated inflows and outflows based on information on stocks and lifetimes, and with the second type the outflows and stocks based on the available information on inflows and lifetime [53,54,55]. The latter was applied for the calculation of production and consumption goods stocks and flows due to the lack of information on the existing stock of goods. Calculations were conducted using Microsoft Excel 2016.
To define the total annual consumed mass flow, we calculated the DMC: the annual mass of all imports plus the quantity of raw materials extracted from the domestic territory, minus the mass of all exports (1) as defined by Eurostat [56].
DMC = Imports + domestic extraction − exports.
We did not, however, include fodder in the DMC, as we consider it to be a precursor of animal products such as meat, fish, milk, or eggs.
Data on the masses of imported, domestically extracted, and exported goods provided by the Swiss Federal Customs Administration (FCA) [57], the Federal Statistical Office (FSO) [58,59], the Federal Office of Energy (SFOE) [60], and the Swiss Farmer’s Union [61] served as a basis for the calculations. We moreover made use of data from Wüest & Partner [62] and Rubli [63] on the material stock for buildings and civil engineering, respectively.
The FCA provides information on the amounts of imported and exported goods at different levels of granularity [57], ranging from 97 to 13,000 classes (respectively two-digit and eight-digit level). We made use of the two-digit level, as we considered this to be of sufficient granularity for many of the goods analyzed. Nonetheless, we disaggregated some of the 97 classes into sub-classes when information at the two-digit level was not precise enough. This was done, for example, for chemical products, products of the oil industry, or goods containing precious metals. By doing so, we obtained about 800 consumption classes covering the entire Swiss economy, which we then aggregated into 28 consumption categories (e.g., single-family houses, apartment buildings, passenger cars; see Figure 2). The 28 consumption categories were aggregated into six sub-sectors and three main sectors of the economy—construction, mobility, and production and consumption—following the methodology developed in Gauch et al. [64,65] and Matasci et al. [66].
In addition, for each of the about 800 classes of goods, we determined an average material composition by means of a literature review and the best guess assumptions of the authors. We defined 156 possible types of materials (e.g., crude oil, apples, steel, brass, polyethylene) and aggregated them into 18 material categories (Figure 2). The material categories were then further classified into three groups of constituents: energy carriers, food products, and other solid materials. The resulting matrix (materials x consumption categories) is presented in Figure 2.
Besides this, data on the service lifetime and disposal pathways of the ~800 classes of goods were determined with a literature review (Figure 2). This allowed us to characterize the various ingoing (imports, domestic extraction, recycling), outgoing (dissipative losses, disposal, and exports), and consumed mass flows as well as the size of the stock and its growth rate.

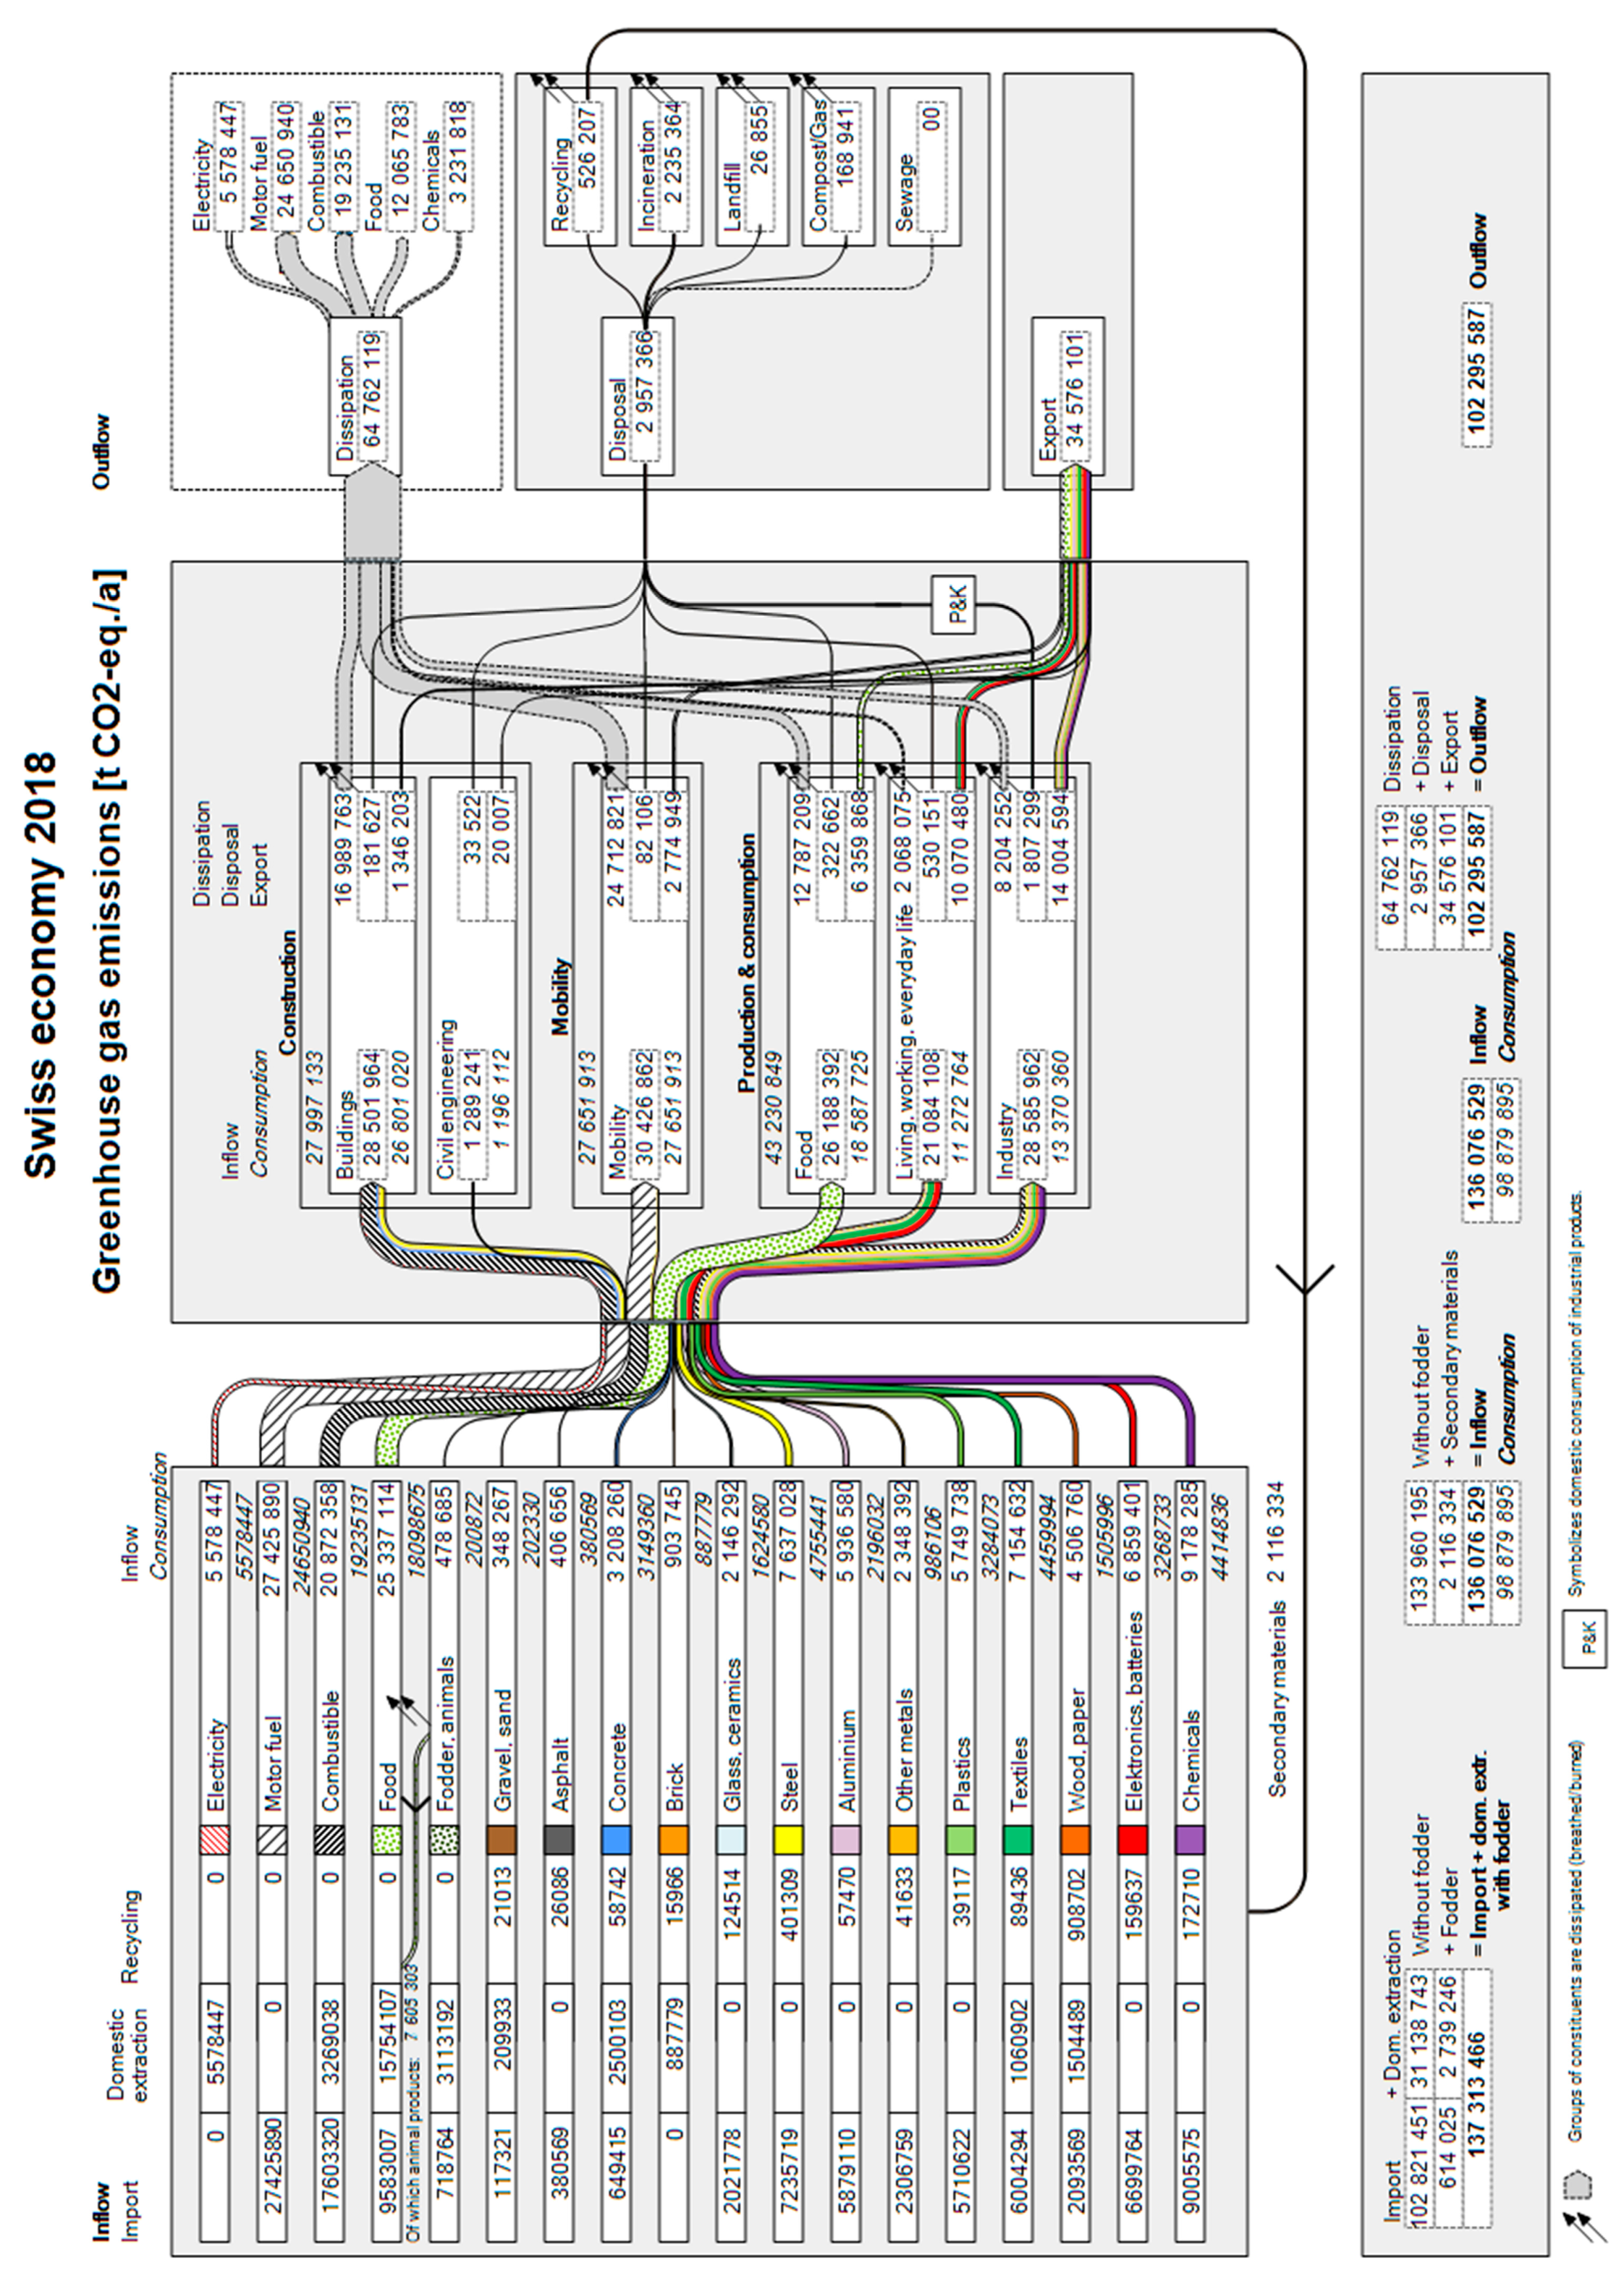
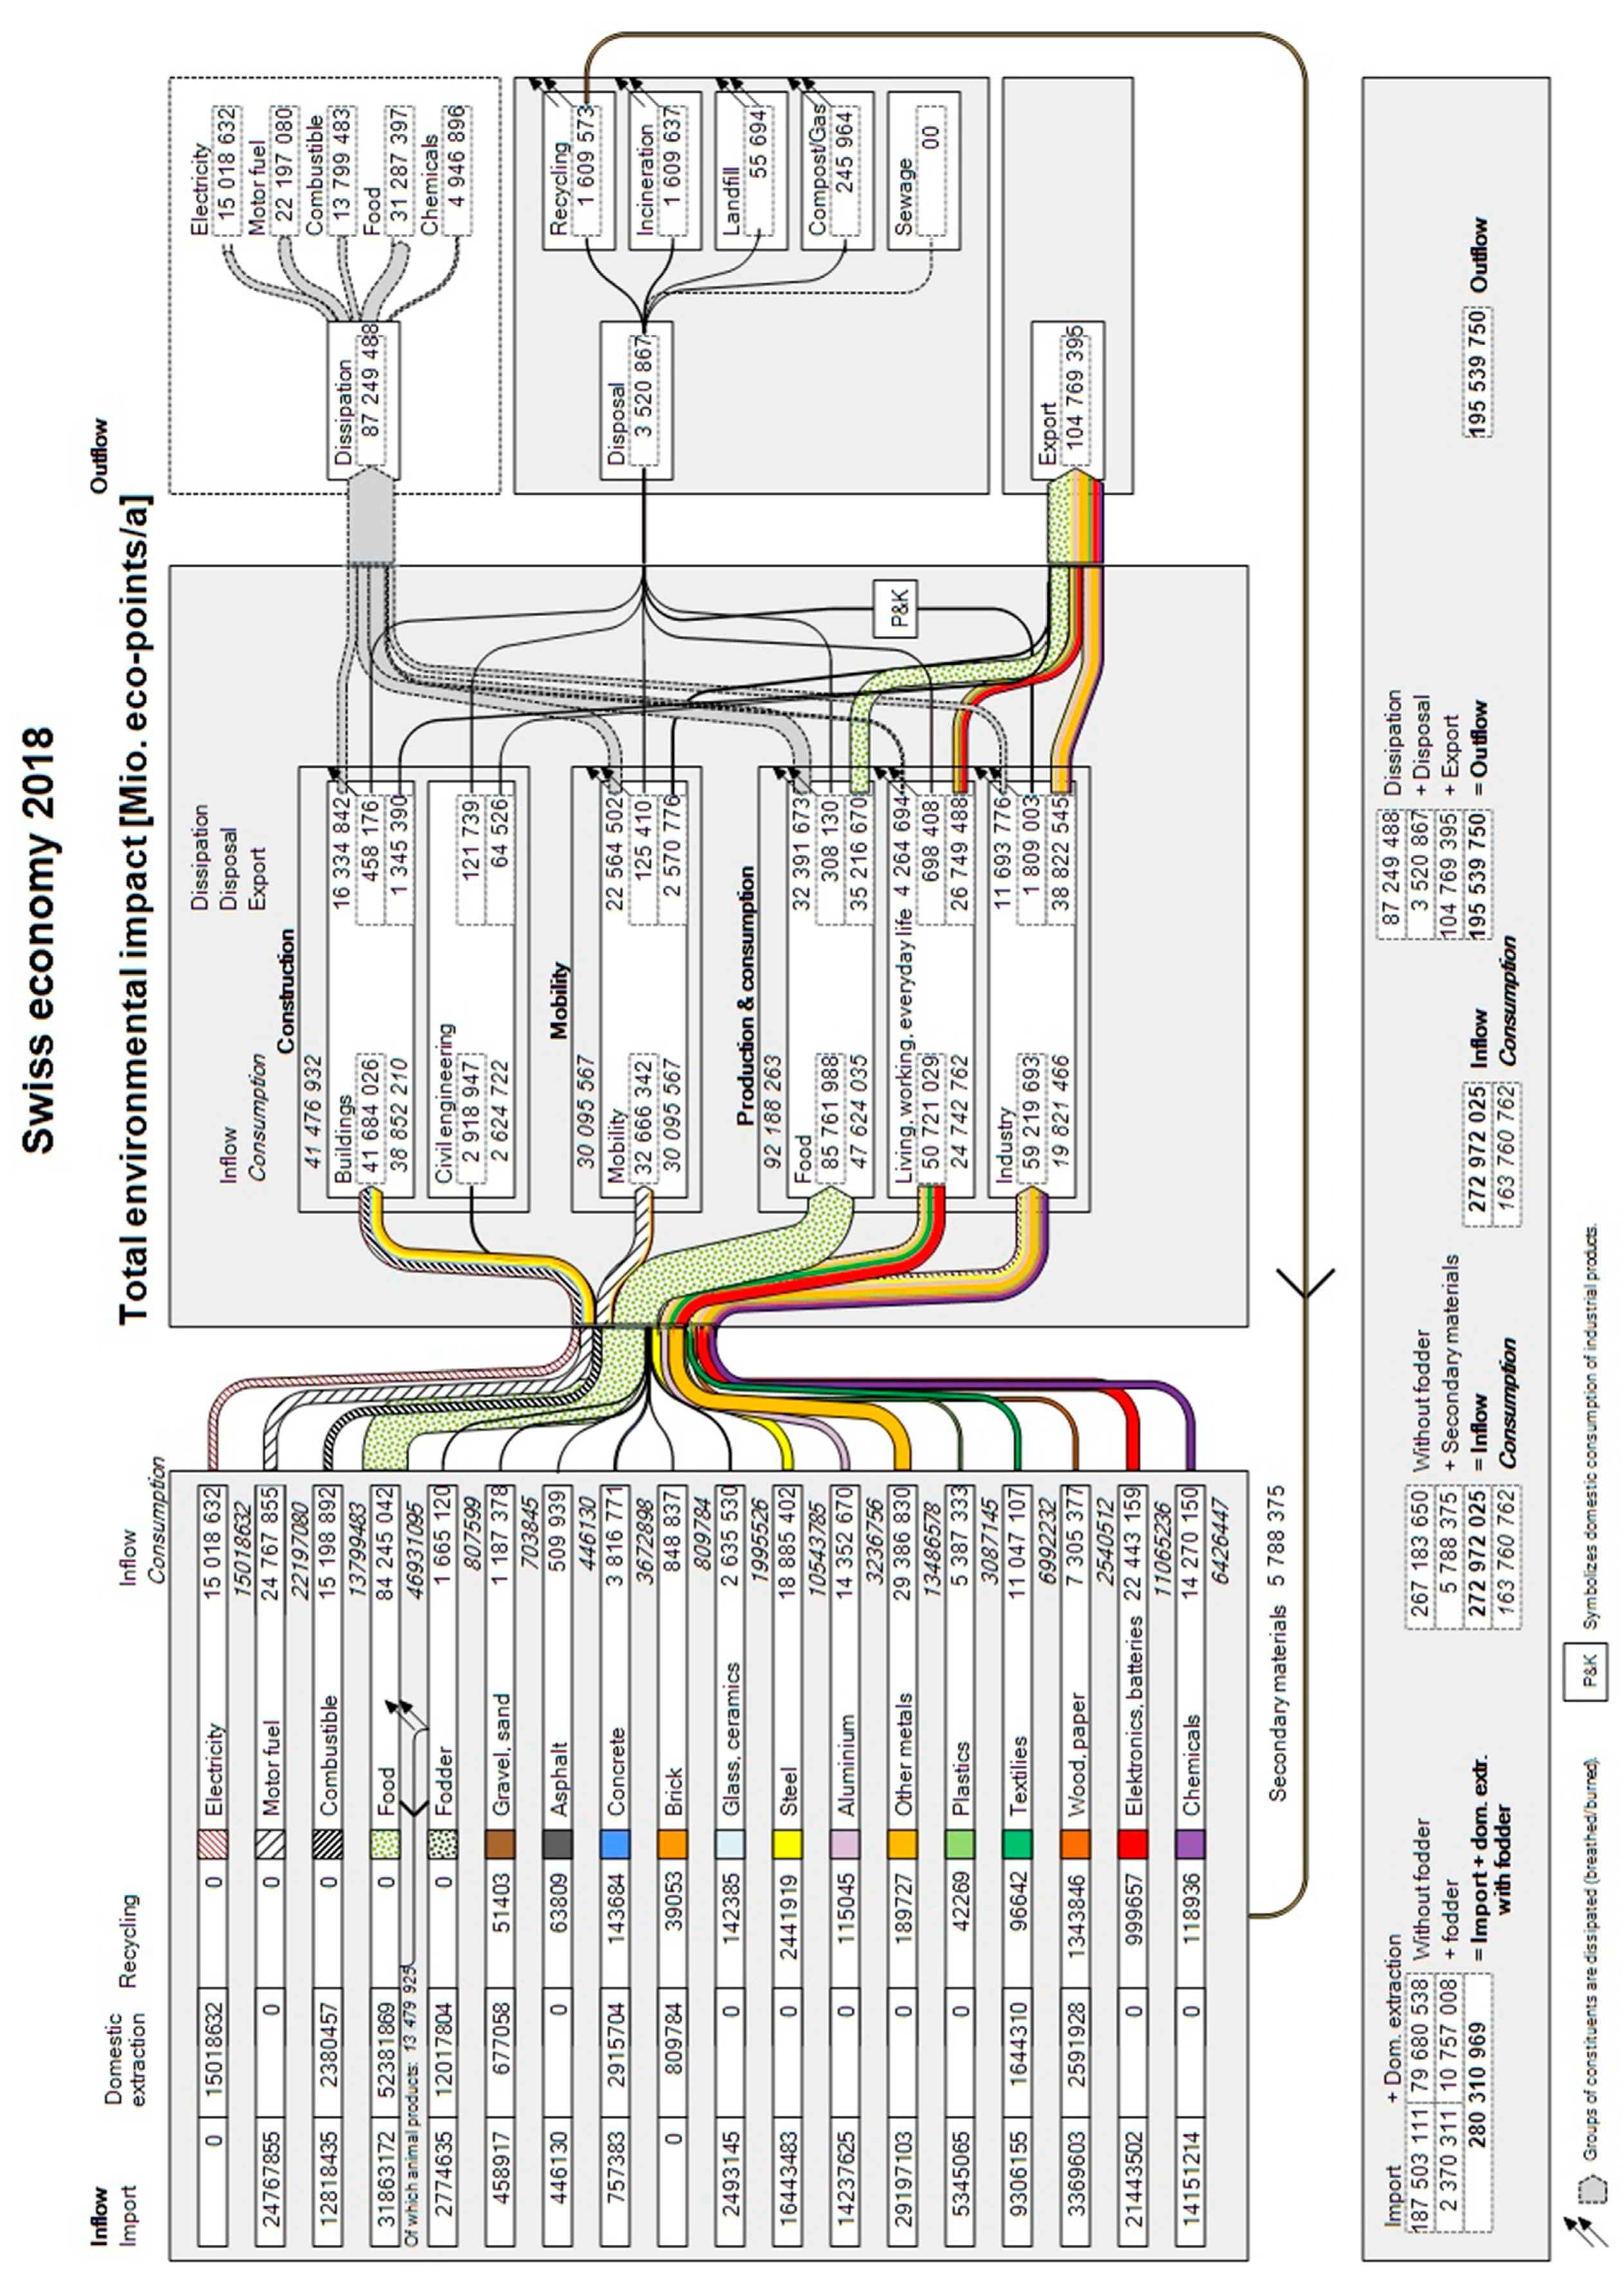
2.2. Environmental Impacts Induced by the Annual Material Flows

There are several methods that enable assessing the environmental impacts associated with these mass flows [49]. Examples are the Ecological Footprint (EF) [67], Input–Output Analysis (IOA) [68], and Life Cycle Assessment (LCA) [69]. Among the various methods, LCA appears to be the most suitable one for analyzing products and services. LCA allows one to assess the environmental impacts associated with the various stages of the life cycle of a product, process, or service from the cradle to the grave [69]. There are various databases providing information on environmental impacts. We selected the Life Cycle Inventory (LCI) database ecoinvent [70,71], as this is one of the most comprehensive and transparent LCI databases available and is best suited for Switzerland.
To each of the 156 types of materials mentioned in Section 2.1 we assigned an ecoinvent product name (e.g., “market for steel, low-alloyed” to steel or “market for polyethylene, high density, granulate” to polyethylene). By weighting the environmental impact of each material with its percentage mass in each of the material categories, we calculated the average amount of GHG emissions per mass unit of material. We subsequently multiplied this value with the various mass flows calculated in the MFA.
Additionally, we calculated the total environmental impact generated by consumption with the Ecological Scarcity Method [72]. This method weights environmental impacts by applying “eco-factors”. The eco-factor of a material is derived from environmental laws or political targets. The more the present level of consumption of resources or emissions exceeds the environmental protection target set, the greater the eco-factor becomes.
Among the Earth system processes considered, we can find, e.g., resource depletion and biodiversity loss. For these processes, planetary environmental boundaries have been exceeded or are in imminent danger of being exceeded [2]. A selection of the results is presented in Appendix A (Figure A1, Figure A4 and Figure A5).

2.3. Influence of Consumer Behavior

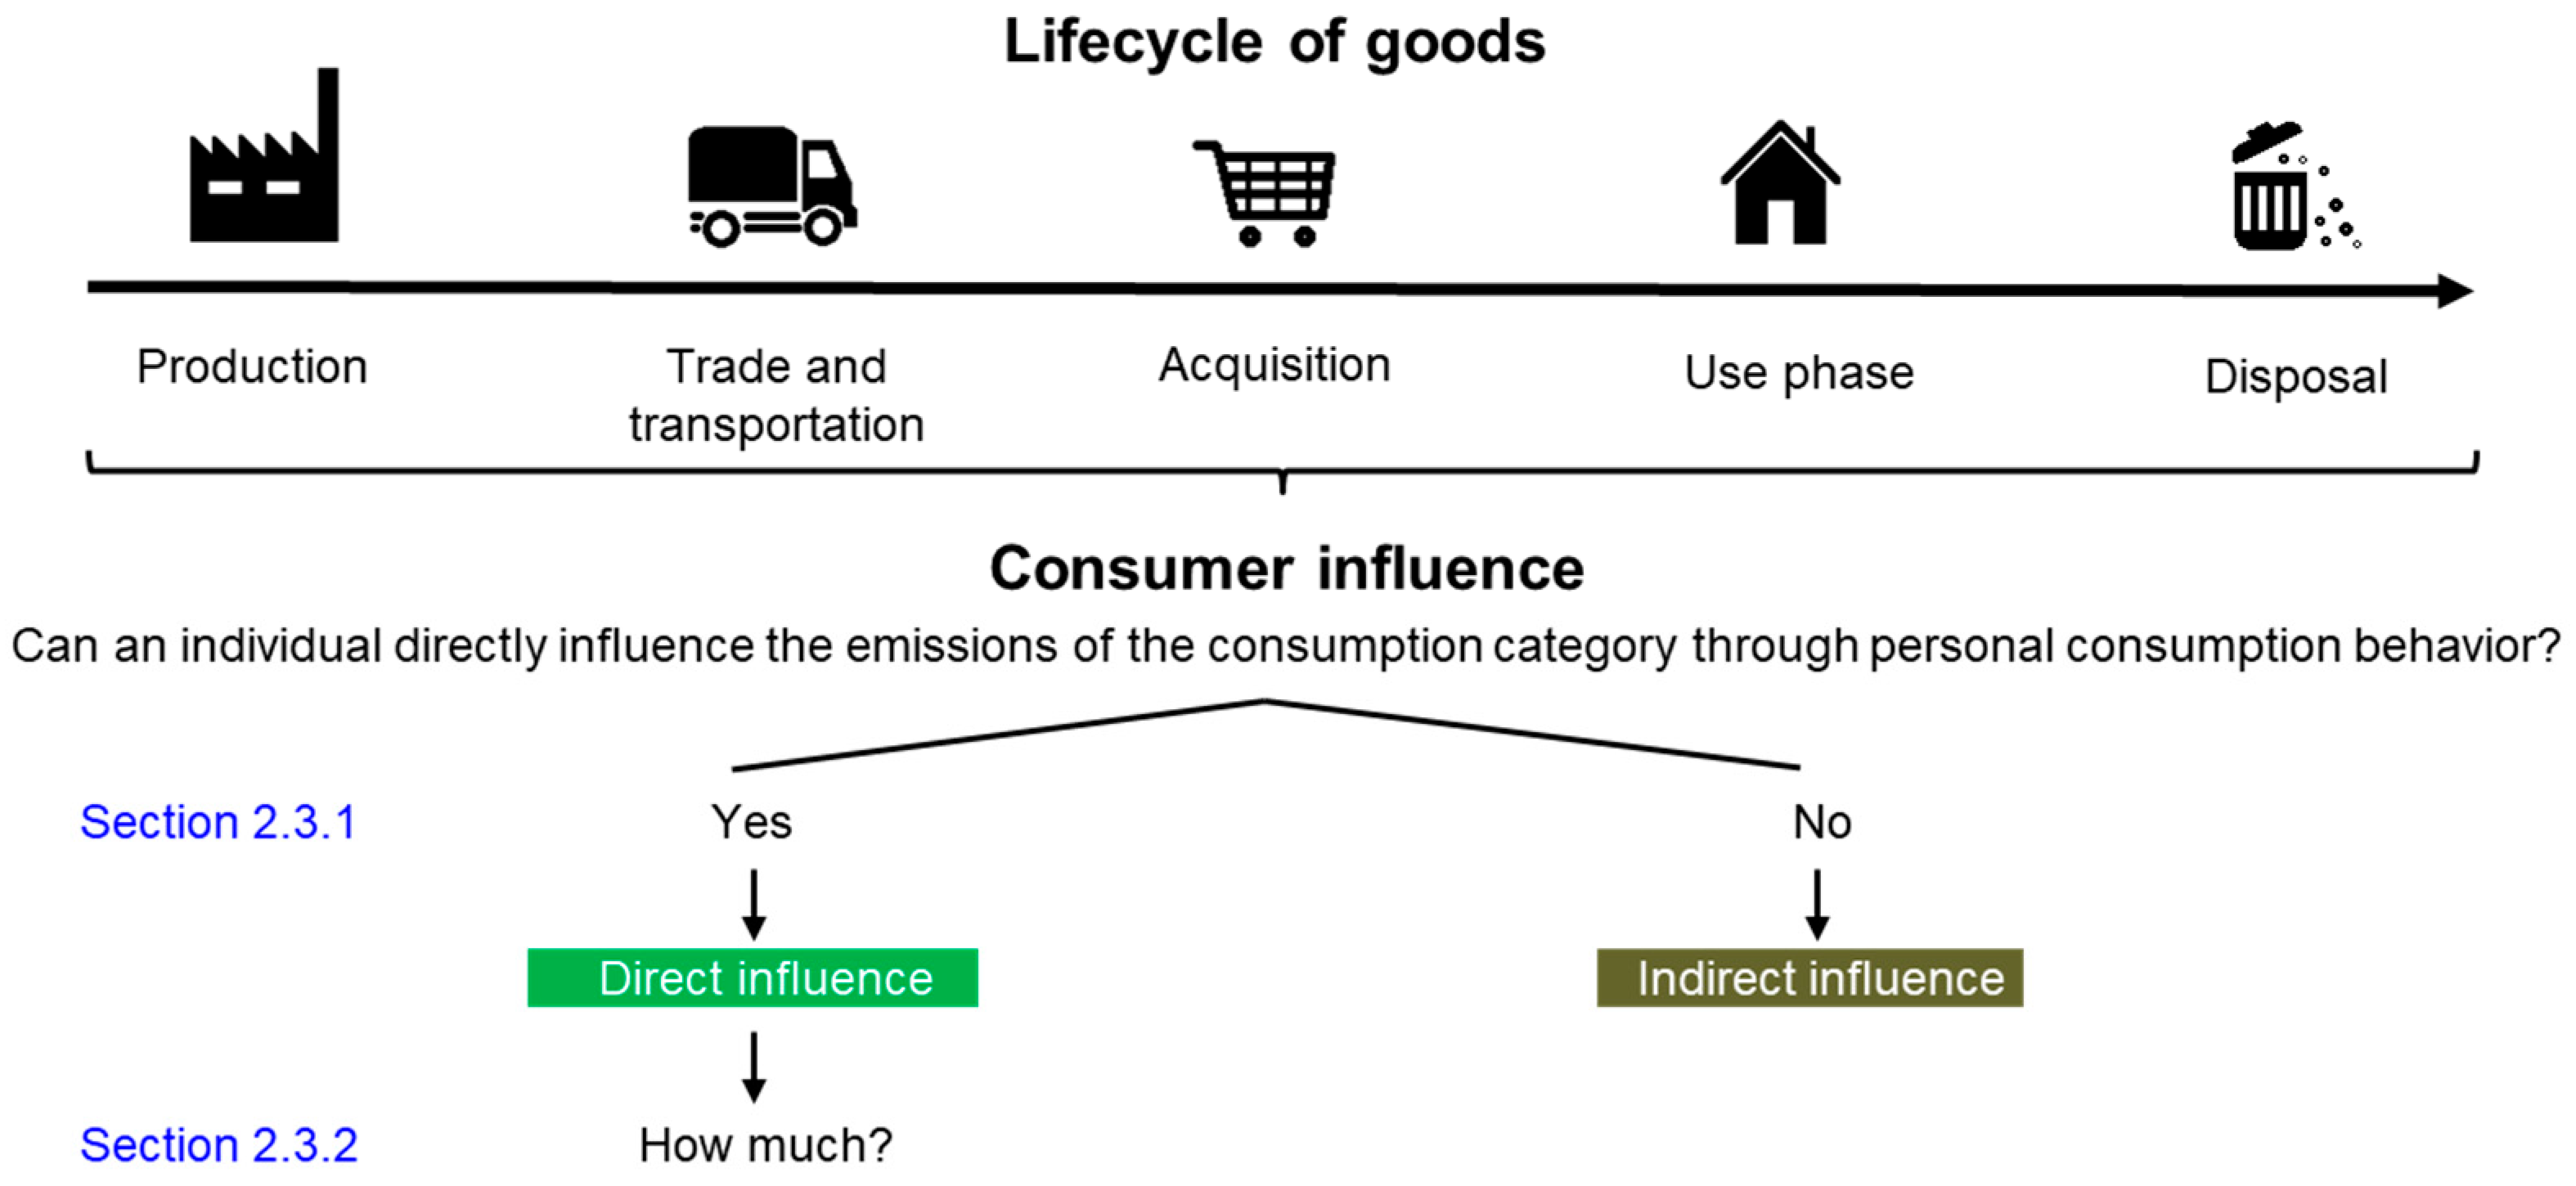
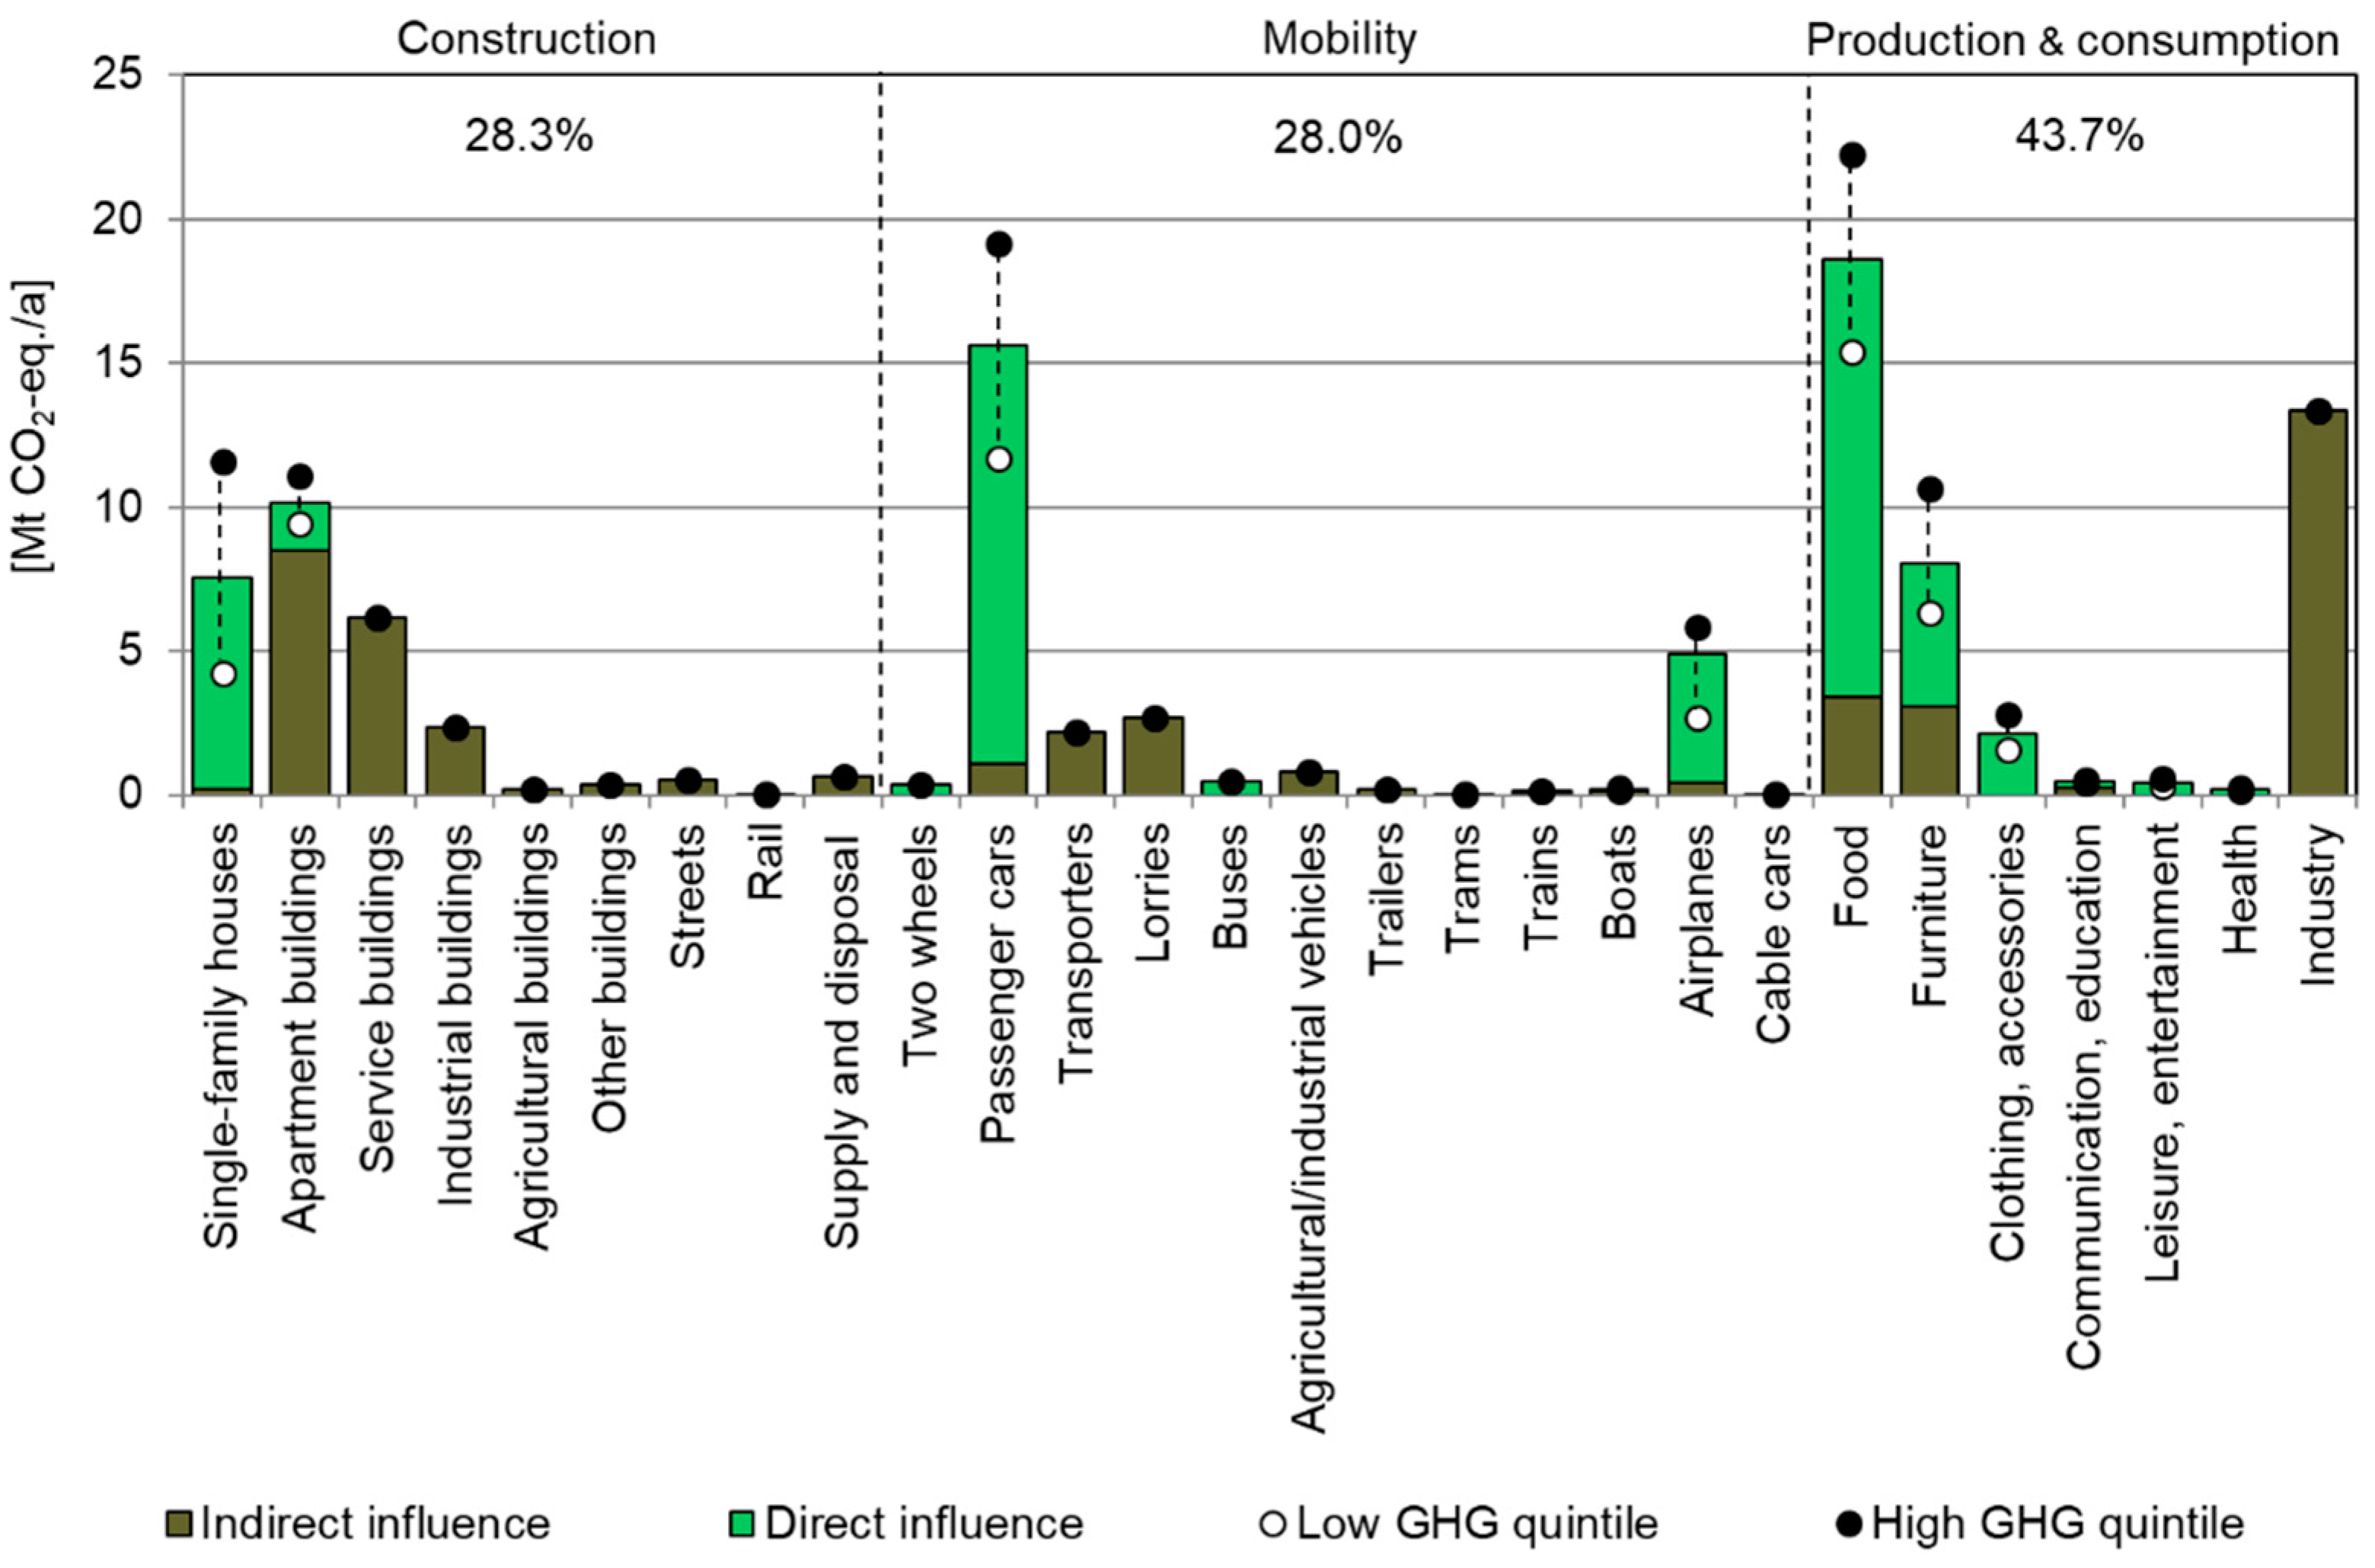
2.3.1. Direct and Indirect Influence of a Consumer

We defined the direct influence of a consumer as one that allows for a modification of the GHG emissions of a nation through consumption behavior. For each of the consumption categories presented in Figure 2, if the answer to the question “Can an individual directly influence the GHG emissions through consumption behavior?” was yes, then we considered the influence to be direct. If the answer was no, the emission was considered to be indirect (Figure 3).
Having a maximum direct influence (equal to 100%) on GHG emissions generated by a consumption category means that the decisions made by the consumer are sufficient to generate the lowest environmental impact possible with the actual state of technology development and persisting cultural values. This applies, for example, to private mobility through the choice of means of transportation and distances covered: if individuals decide not to buy a vehicle but to walk and restrain their mobility, the direct emissions generated are null.
Having a maximum indirect influence (equal to 0% direct influence) on the GHG emissions generated by a consumption category means, on the other hand, that the consumption decisions taken by an individual have no direct influence on the amount of GHGs emitted and that the amplitude of the environmental impacts depends merely on political decisions and/or the economic reality. Here, an individual consumer can only influence GHG emissions, for example, in the role of voter in elections or popular votes or by attempting to influence decisions within a professional role. This often applies to public and quasi-public goods and services, such as, for example, road and rail networks; public buildings such as hospitals and schools; industry and agriculture buildings; or freight transportation [73]. A consumer is not able—through a specific behavior—to directly change the amount of GHG emissions generated to build, maintain, or operate them.
We attributed a percentage of the direct and indirect influence of the consumer to each of the 28 consumption categories. Percentages have been calculated from national statistics or the best guess assumptions of the authors. The assumptions presented in Table A1 include some simplifications: the first one concerns single-family houses and apartment buildings. We assumed that tenants only have an indirect influence on the amount of GHGs emitted, as they cannot decide on the structure and materials of the building nor on its heating system or renovation measures. We did not consider the influence of the occupant’s behavior on energy consumption, such as the influence of opening windows in winter or over-heating their home. This influence can, however, be considerable [74].
A second simplification concerns mobility, including road and rail networks: we assumed that a consumer has total direct influence on the emissions generated by public transportation. We made this decision with the same assumption made for privately owned passenger cars or airplanes: it is the consumer who decides to take or not take a bus or a train and how often. In reality, however, the consumer has no direct influence on the efficiency of public transportation, its geographic coverage, or the source of energy used to operate it.
Finally, we assumed that a consumer has only an indirect influence on the emissions generated by the construction and maintenance of road and rail networks as well as on the emissions generated by fuel consumed for the transportation of goods. De facto, though, there are situations where consumer behavior triggers changes in these networks or in the quantity of fuel consumed for the transportation of goods. For example, more private transportation leads to congested roads, which can bring about an expansion of the road network, and higher consumption leads to more road and rail transportation of goods.

2.3.2. Lifestyle-Dependent Behavior

To evaluate the spectrum of GHG emissions in the population (Figure 3), we used the results generated by Frömelt et al. [36]. In their research, the authors used the Swiss Household Budget Survey (HBS) carried out with 9734 households between 2009 and 2011. The HBS provides detailed information on the characteristics and consumption behavior of these households in terms of money spent and masses consumed for about 350 categories of services and goods. Frömelt et al. translated this information into the GHG emissions of about 200 categories of goods and clustered households into 28 different behavioral archetypes.
At first, we broke the GHG emissions of the 28 different behavioral archetypes down to emissions per person depending on the size of the households in each cluster. We then ranked the 28 behavioral archetypes according to the intensity of these emissions and grouped the archetypes in 20% shares (quintiles) of the population, from the least to the most climate-friendly quintile. In a following step, we attributed each of the GHG emissions generated alongside the life cycle of the ~200 categories of goods analyzed by Frömelt et al. to one of the 28 consumption categories. We then calculated for each quintile and each consumption category the percentage distance to the average emissions of the population for the given category. For this, we considered only the share of emissions on which the consumer has a direct influence (e.g., for personal cars only the share of emissions generated alongside the life cycle of private cars and not the ones generated by the use of company fleets). As a result, we obtained the spectrum of GHG emissions for consumers’ direct influence. The remaining emissions—i.e., the ones for which the consumer only has an indirect influence—were shared equally among the various behavioral archetypes. Finally, we scaled back the emissions to the entire national economy, assuming that everybody would behave like the most or the least climate-friendly quintile of the population.

3. Results

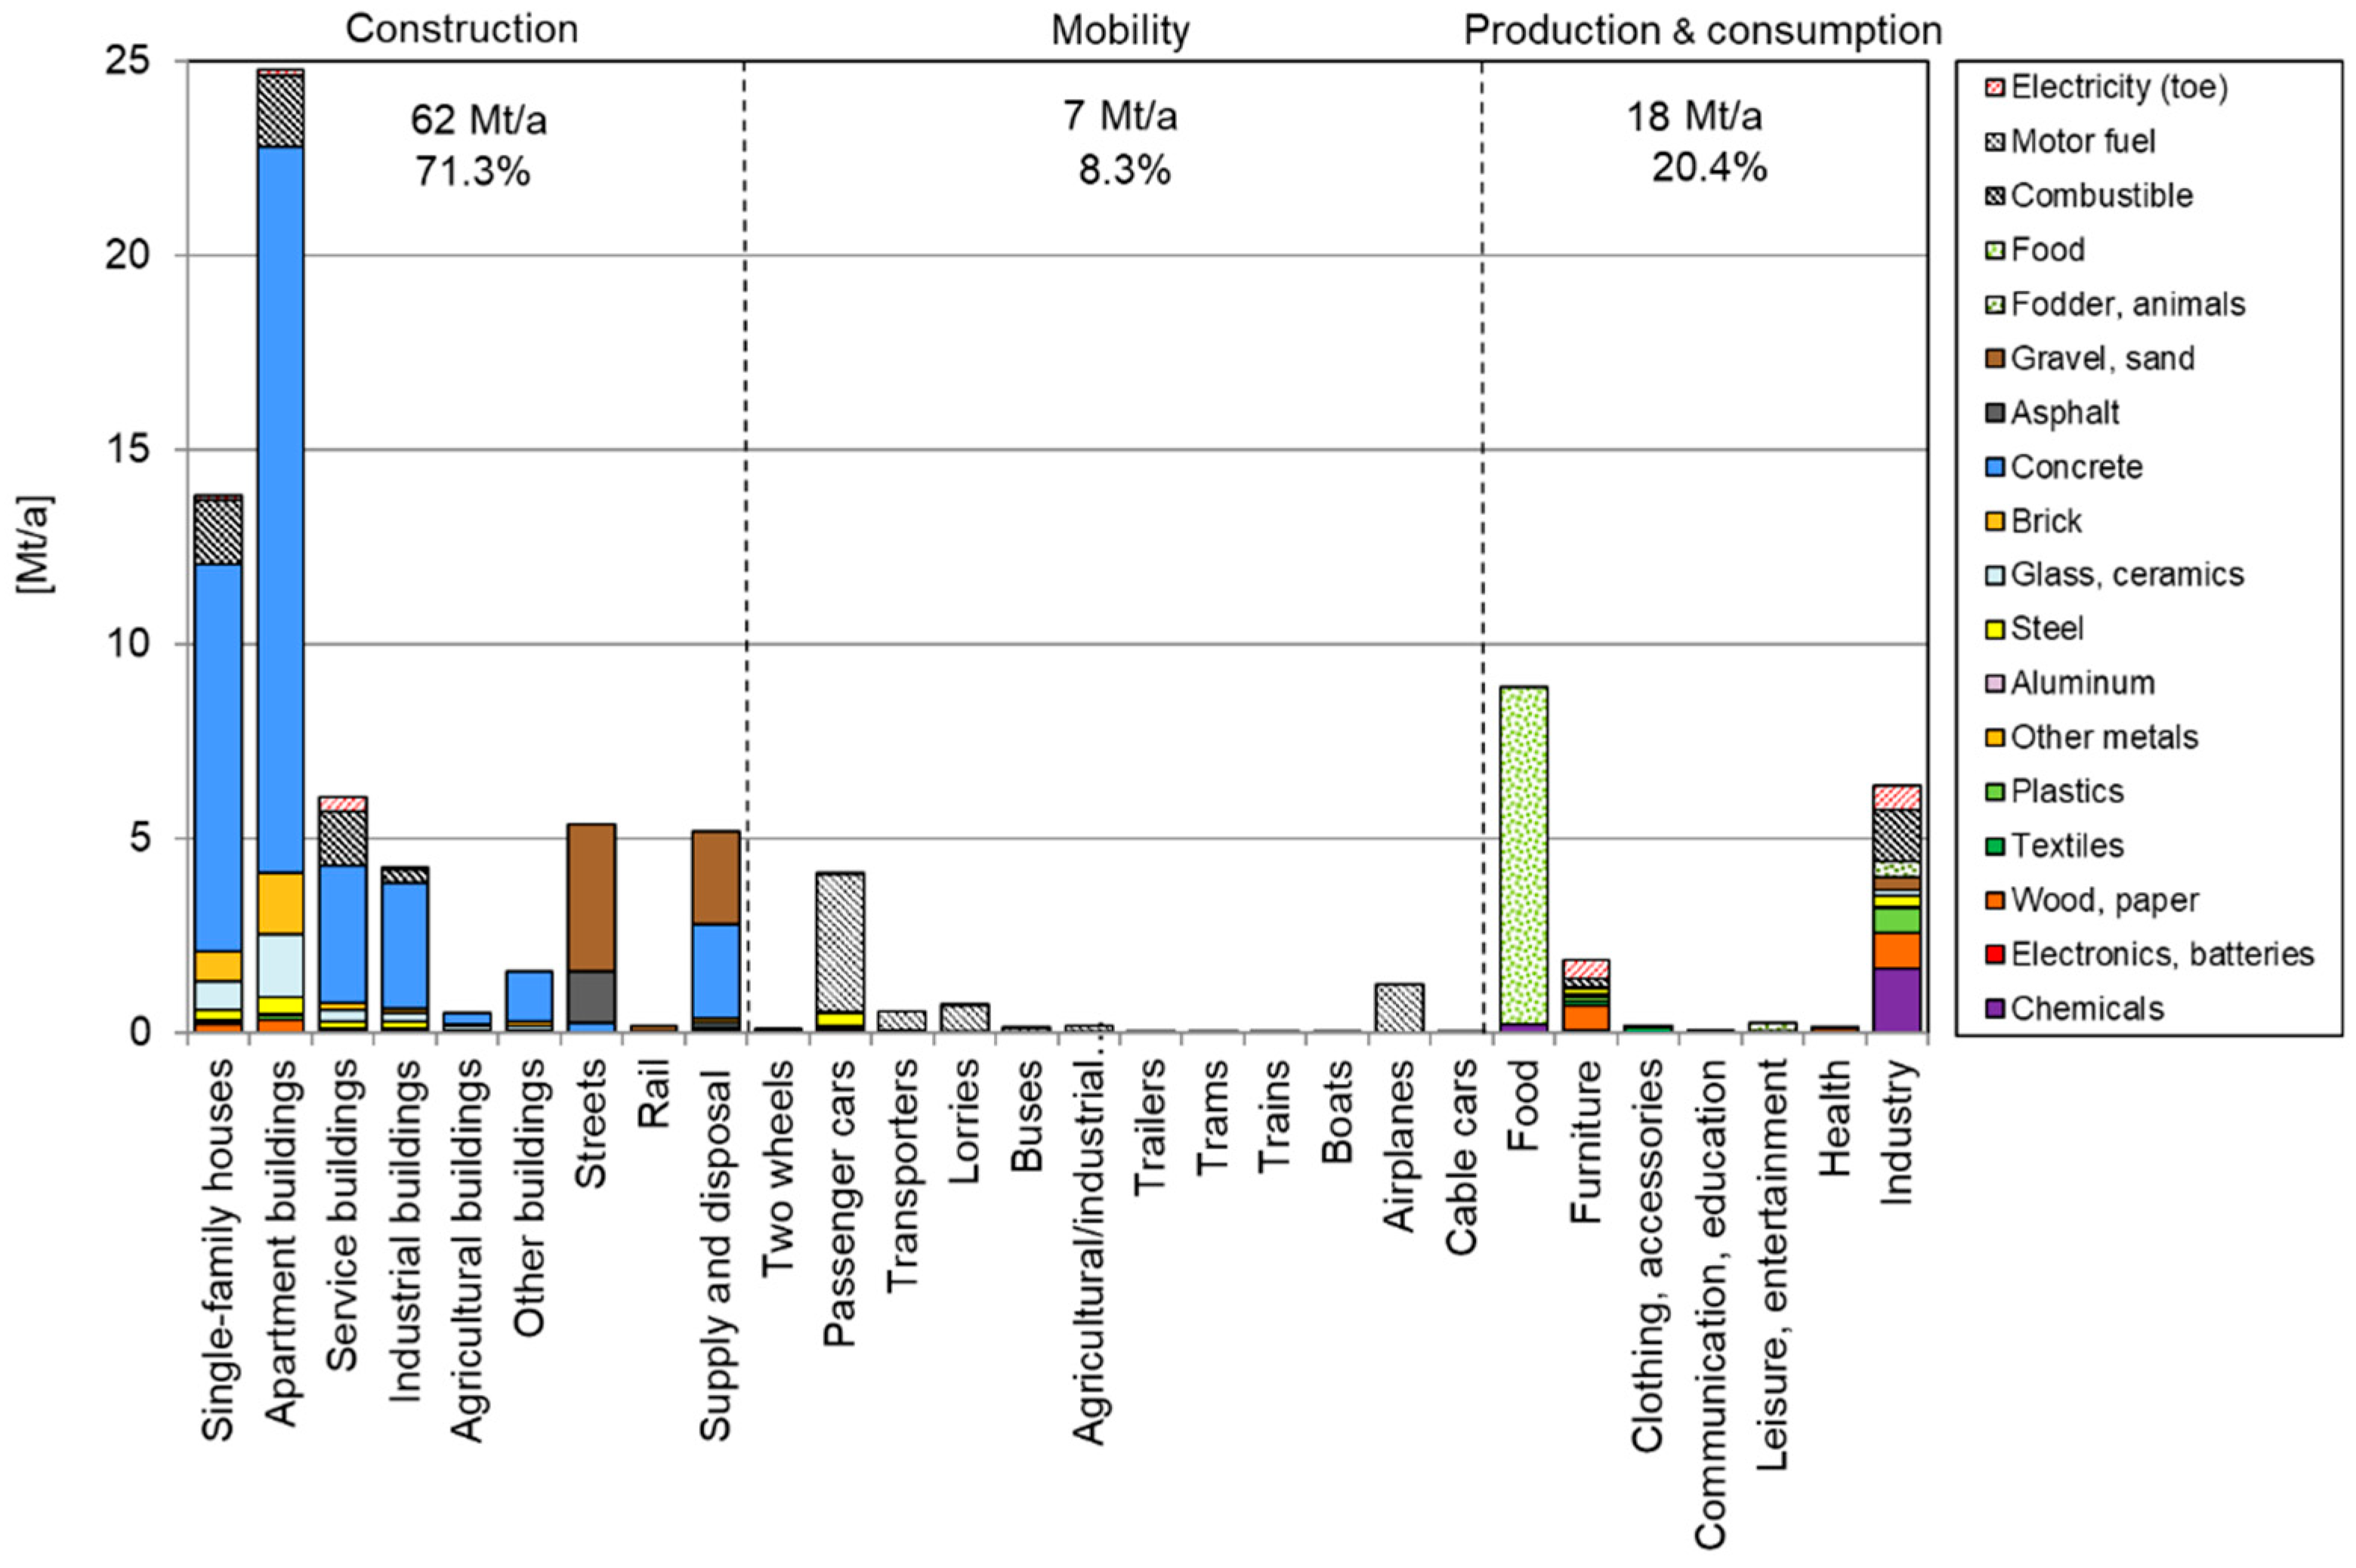
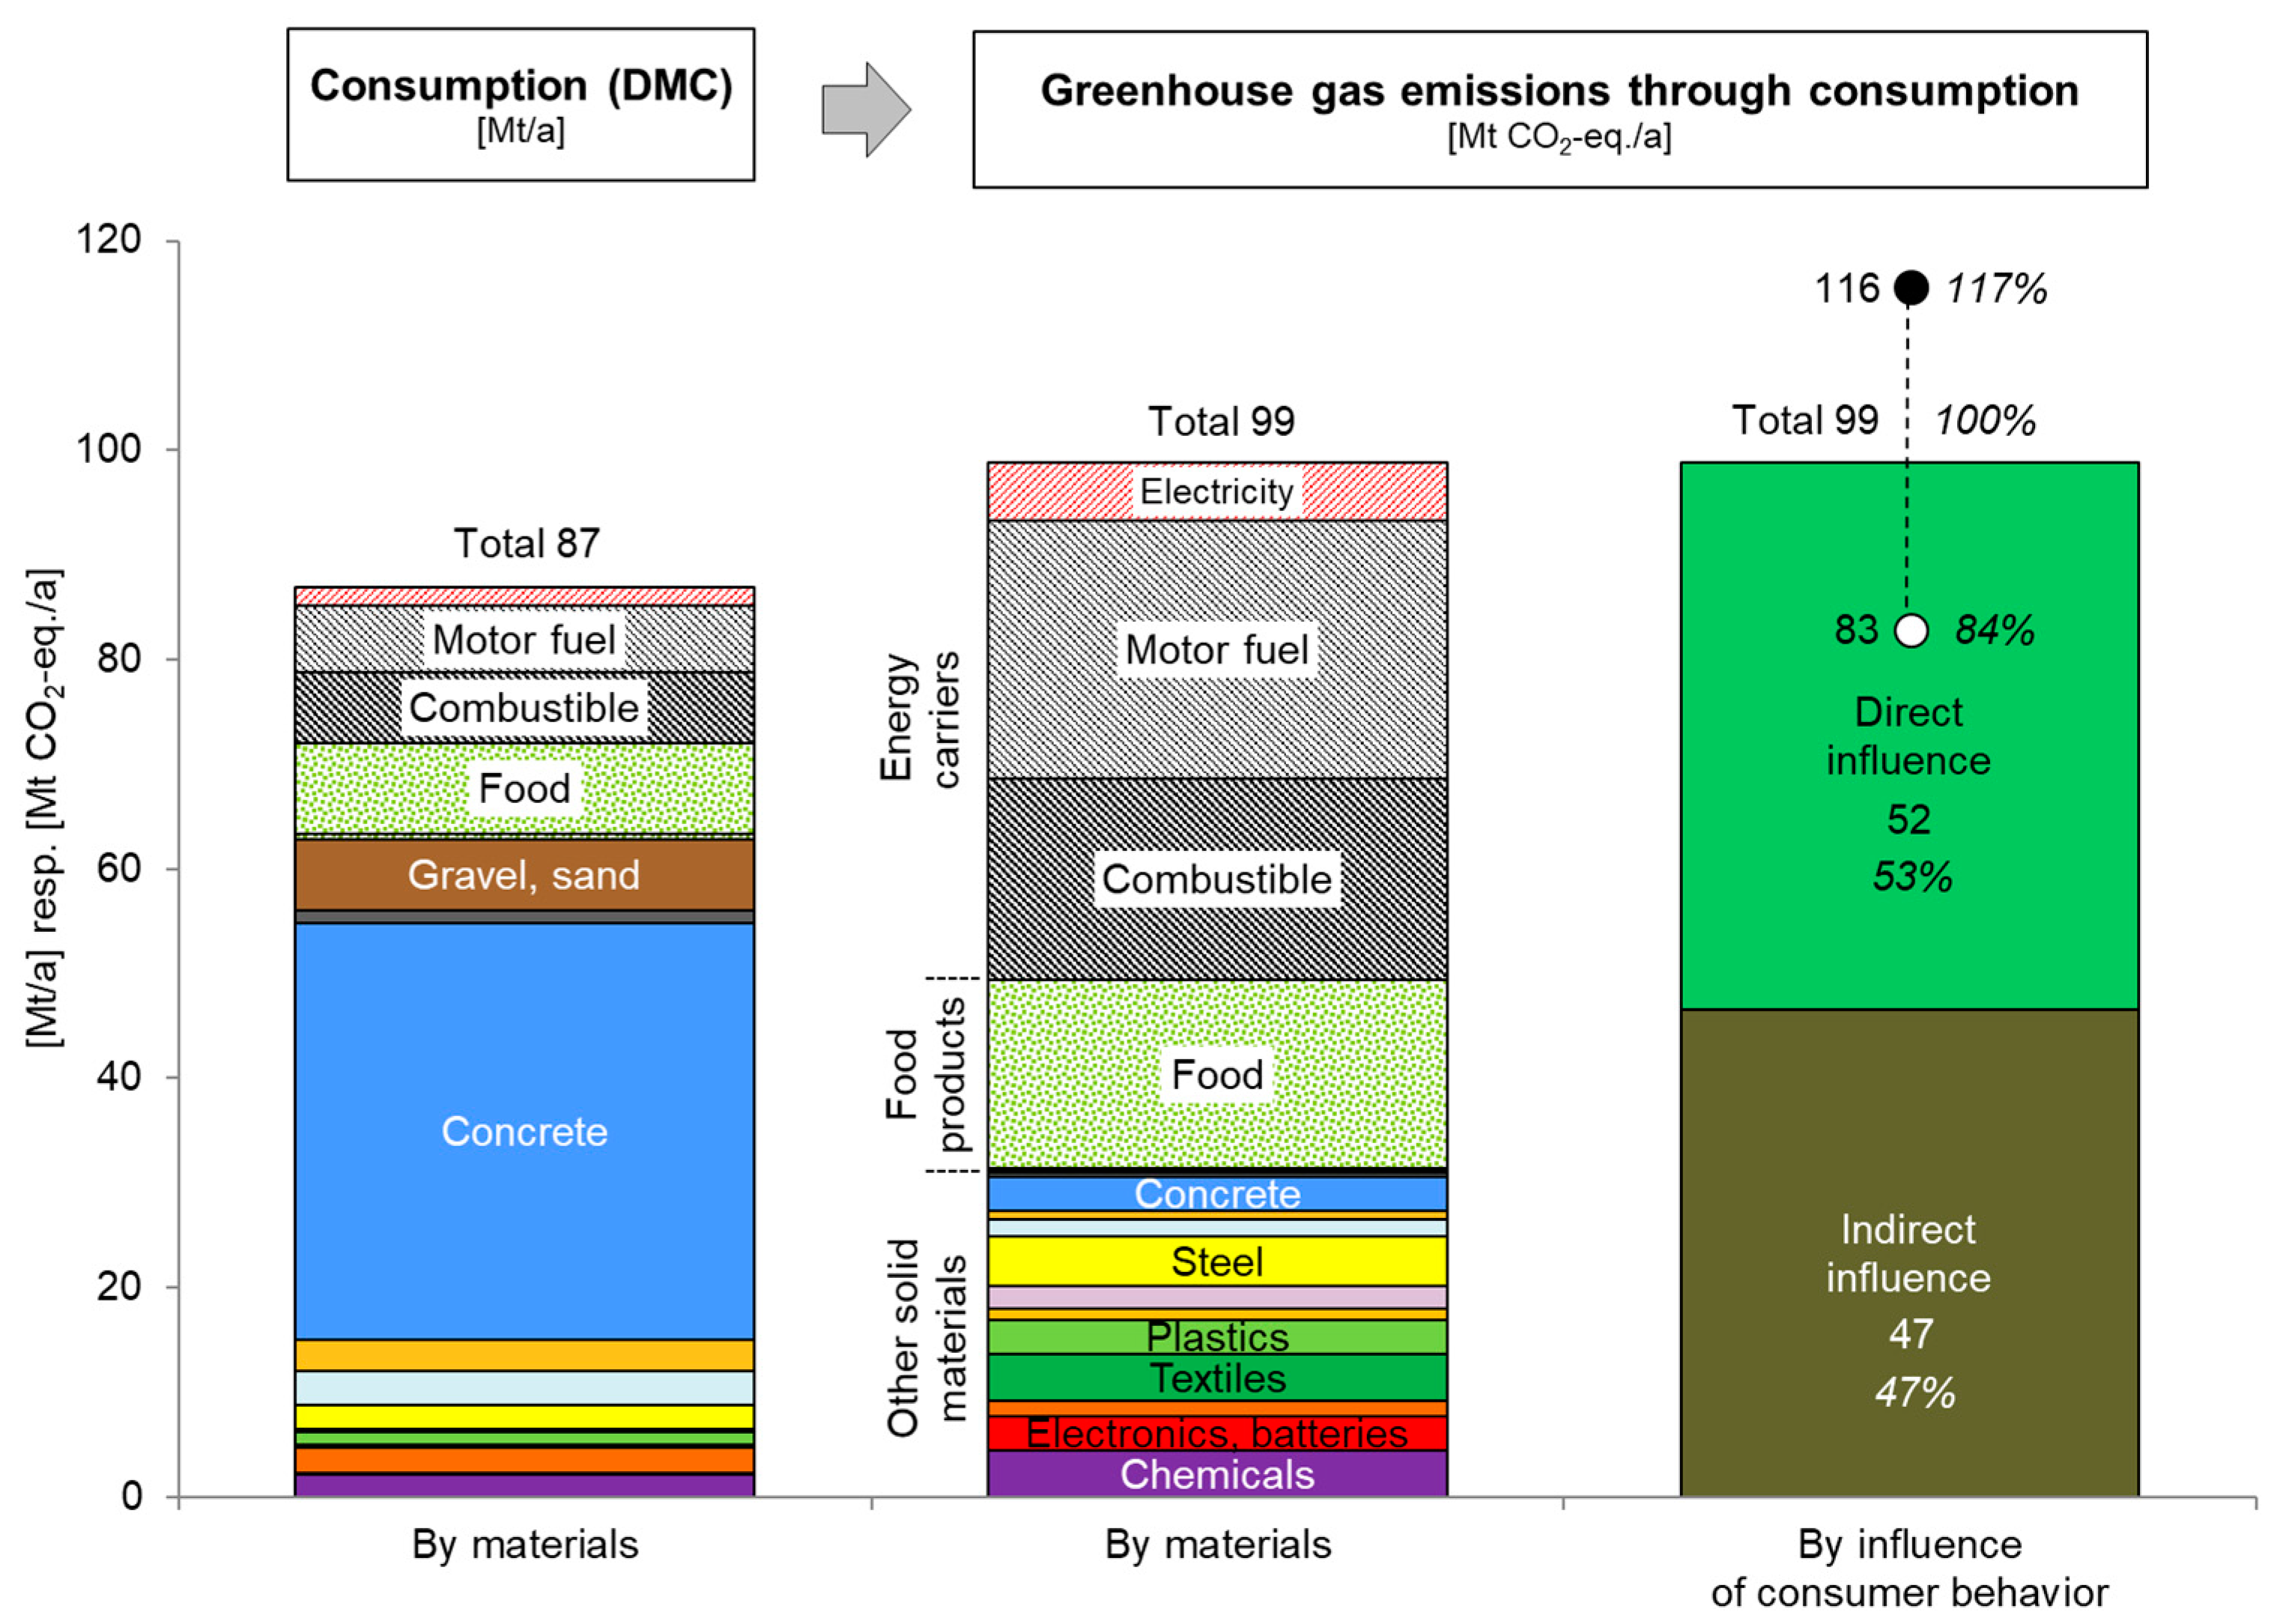
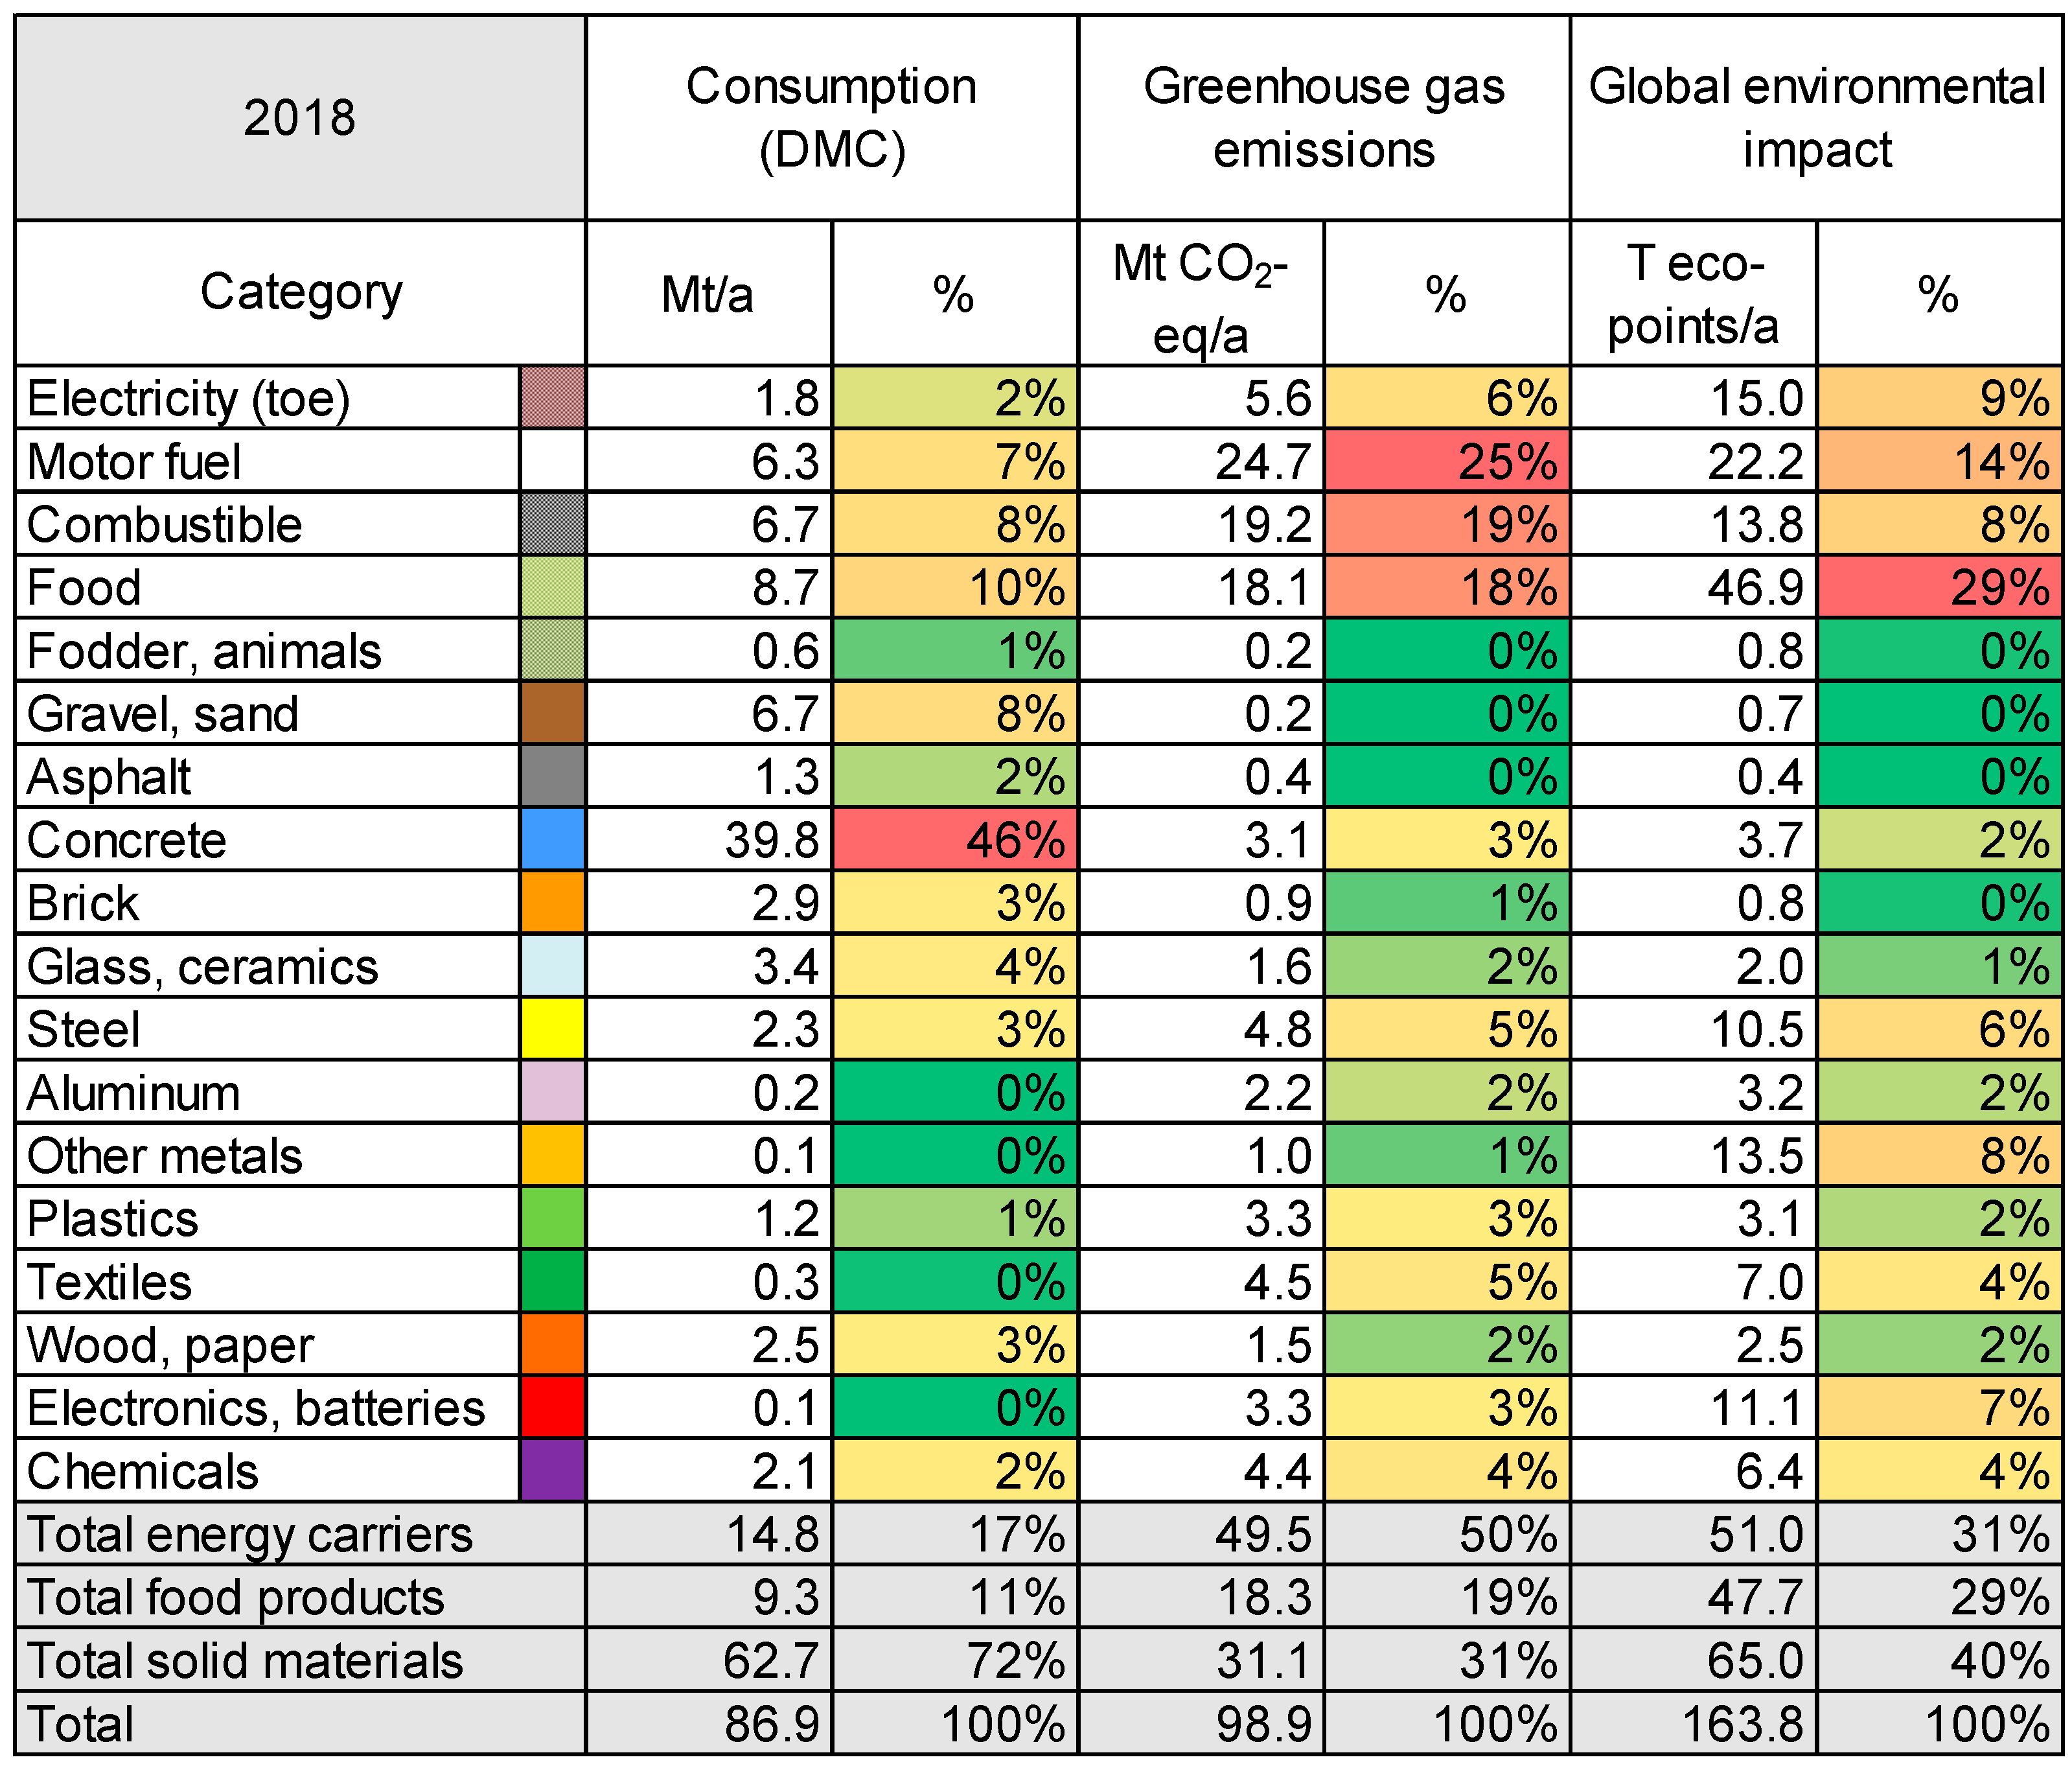
3.1. Material Quantities Consumed Yearly in Switzerland

The Material Flow Analysis shows that, in Switzerland, about 87 Mt of materials are consumed yearly (Figure 4). Altogether, 119 Mt annually enter the system (inflow). Of them, 48 Mt/a are imported, 56 Mt/a are extracted inside the national borders, and 15 Mt/a come from recycled (secondary) materials. About 10 Mt/a of fodder are either imported or produced inside the country to feed livestock. As mentioned in Section 2, we did not account for fodder for animal farms in the DMC, as we consider it to be a precursor of animal products such as meat, milk, and eggs. About half of the inflow—52 Mt/a—accumulates annually in stock. The remaining 67 Mt/a of materials leave the system (outflow), either dissipating into the environment (motor fuel and combustibles, food, some chemicals, etc., 22 Mt/a), being disposed of (27 Mt/a), or being exported (18 Mt/a). A detailed picture of the material flows can be found in Figure A2.
Of the approximately 87 Mt consumed annually, about 62 Mt/a (71.3%) are related to construction (Figure 5). “Production and consumption” accounts for about 18 Mt/a (20.4%) of materials consumed, and mobility for the remaining 7 Mt/a (8.3%). Looking at the categories of materials: about 46% are constituted of concrete and 25% of energy, either in the form of food (10%), combustible (8%), or motor fuel (7%) (Figure A1). Breaking down the mass of consumed materials to the individual level shows that a person in Switzerland consumes about 10.2 tons of raw material annually.
Results are of the same order of magnitude as the ones reported by the FSO [76] (11.0 t/a per person) when fodder is included: 11.3 t/a per person.

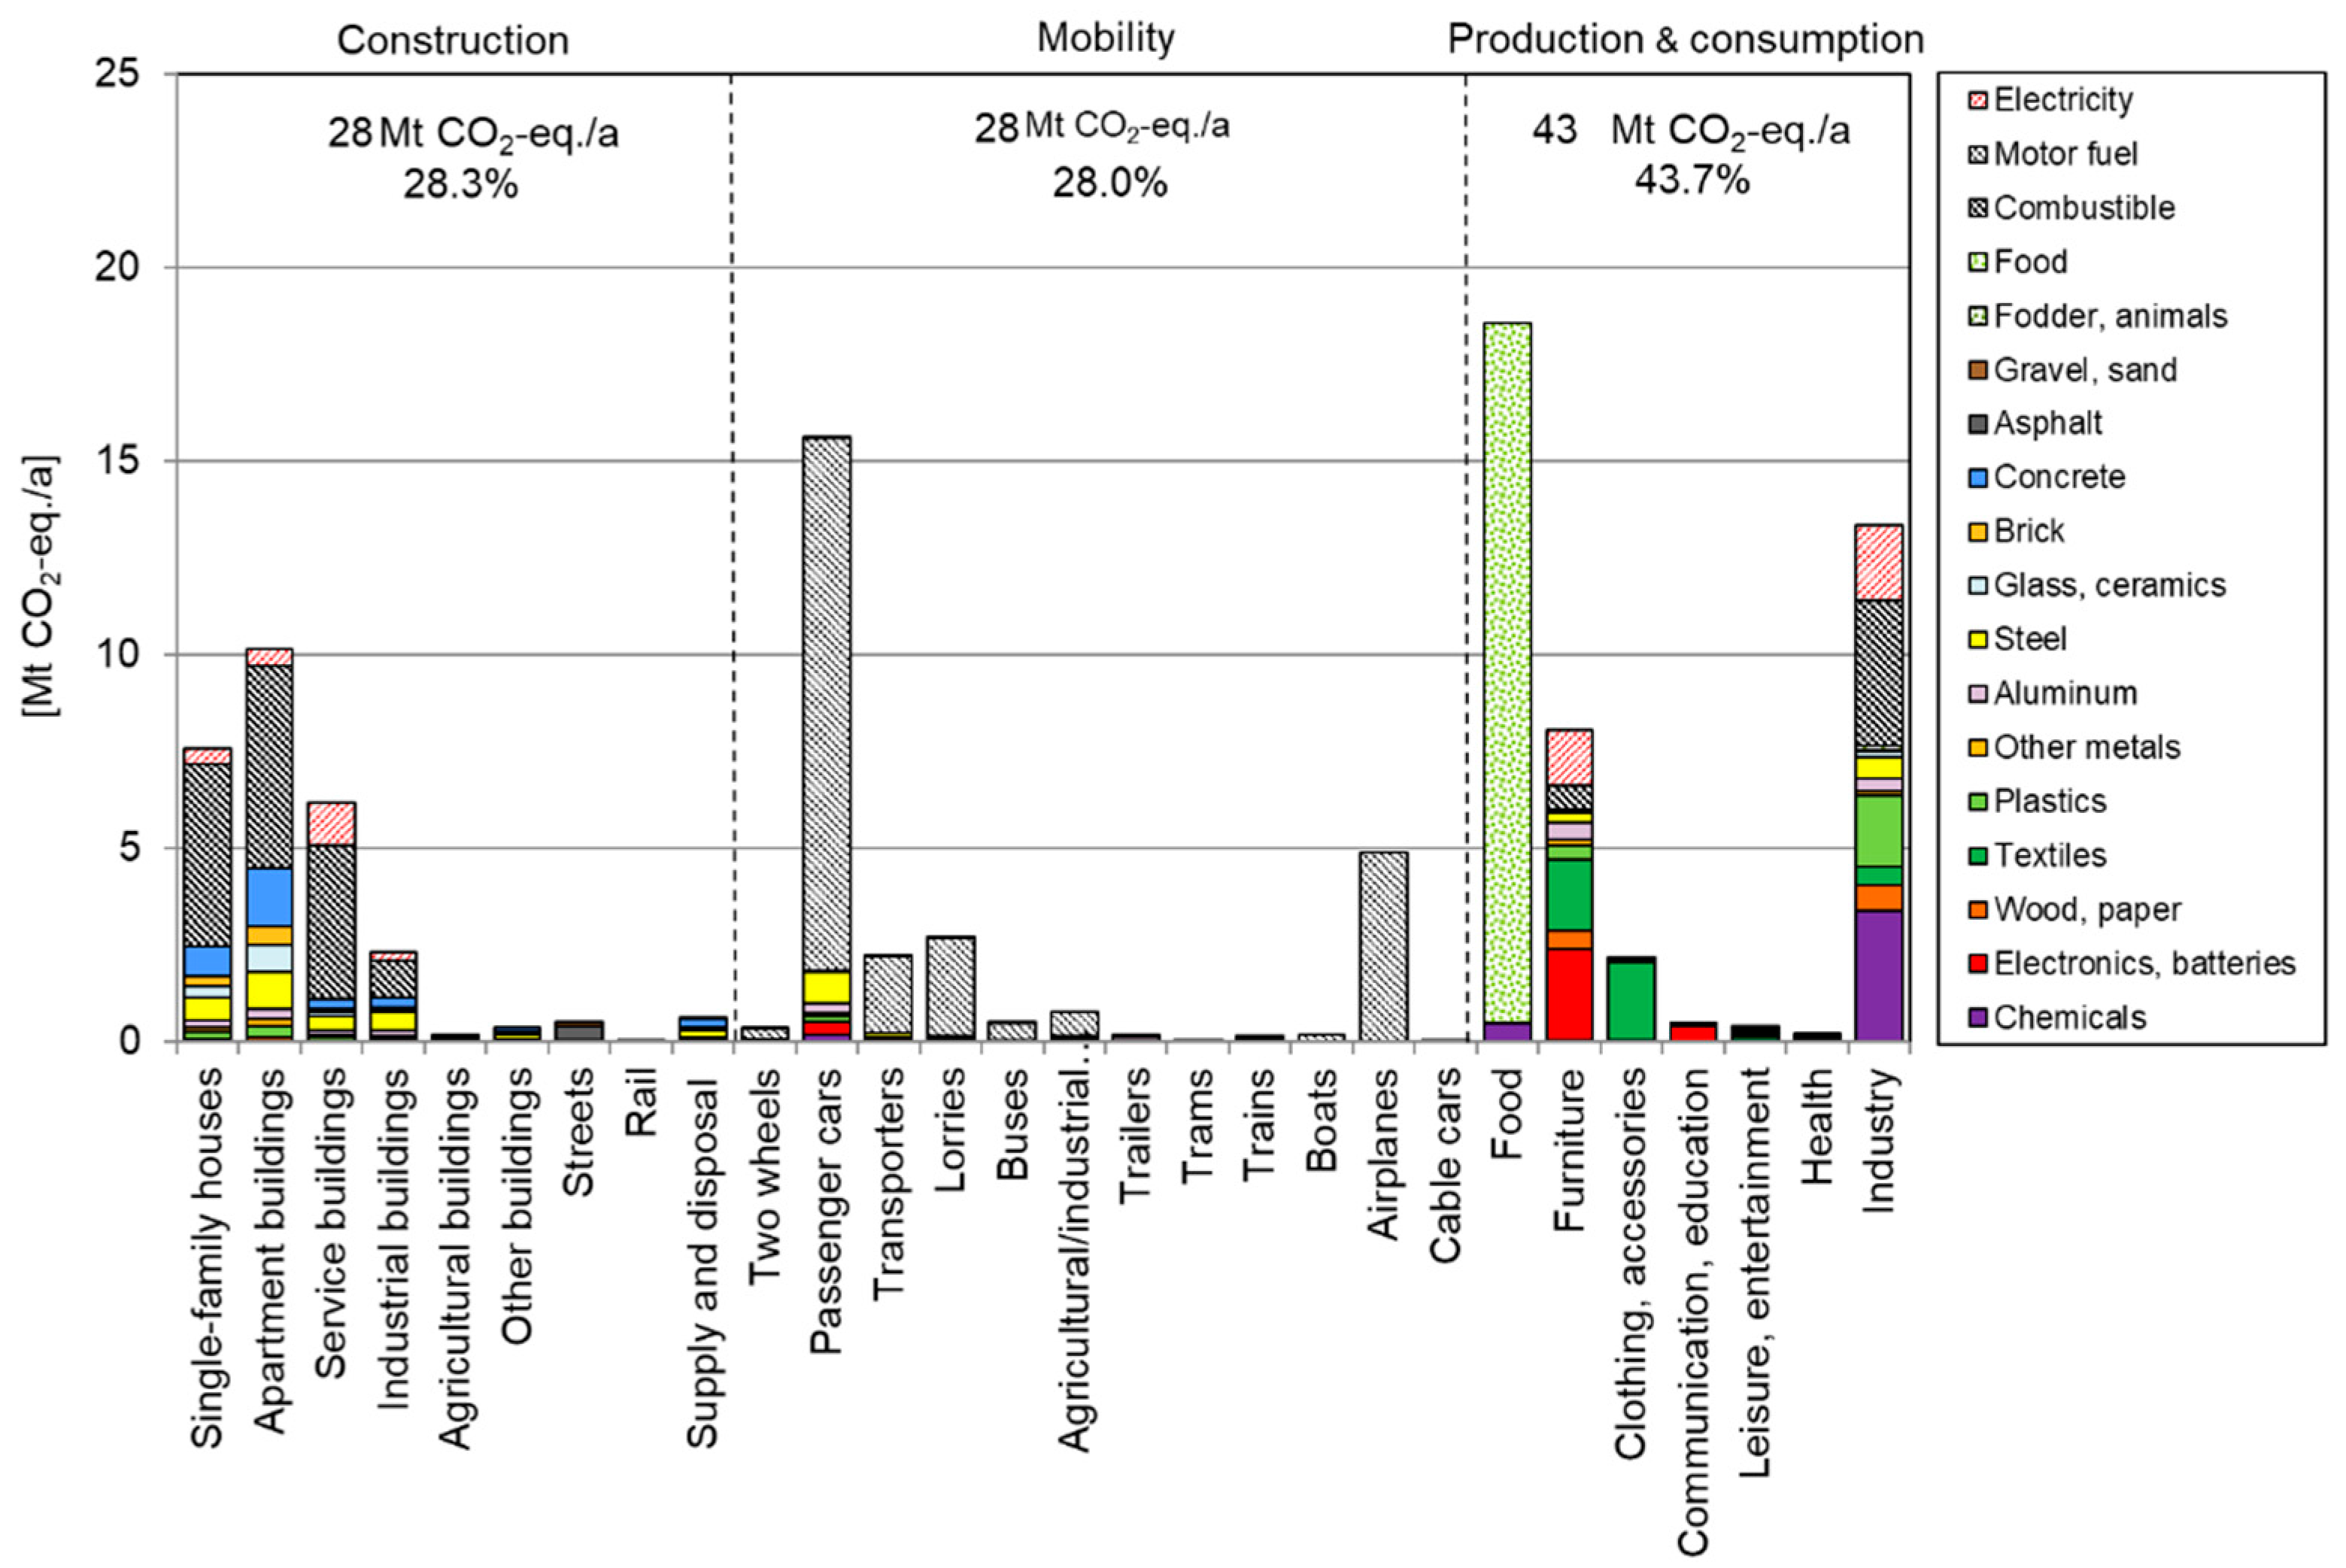
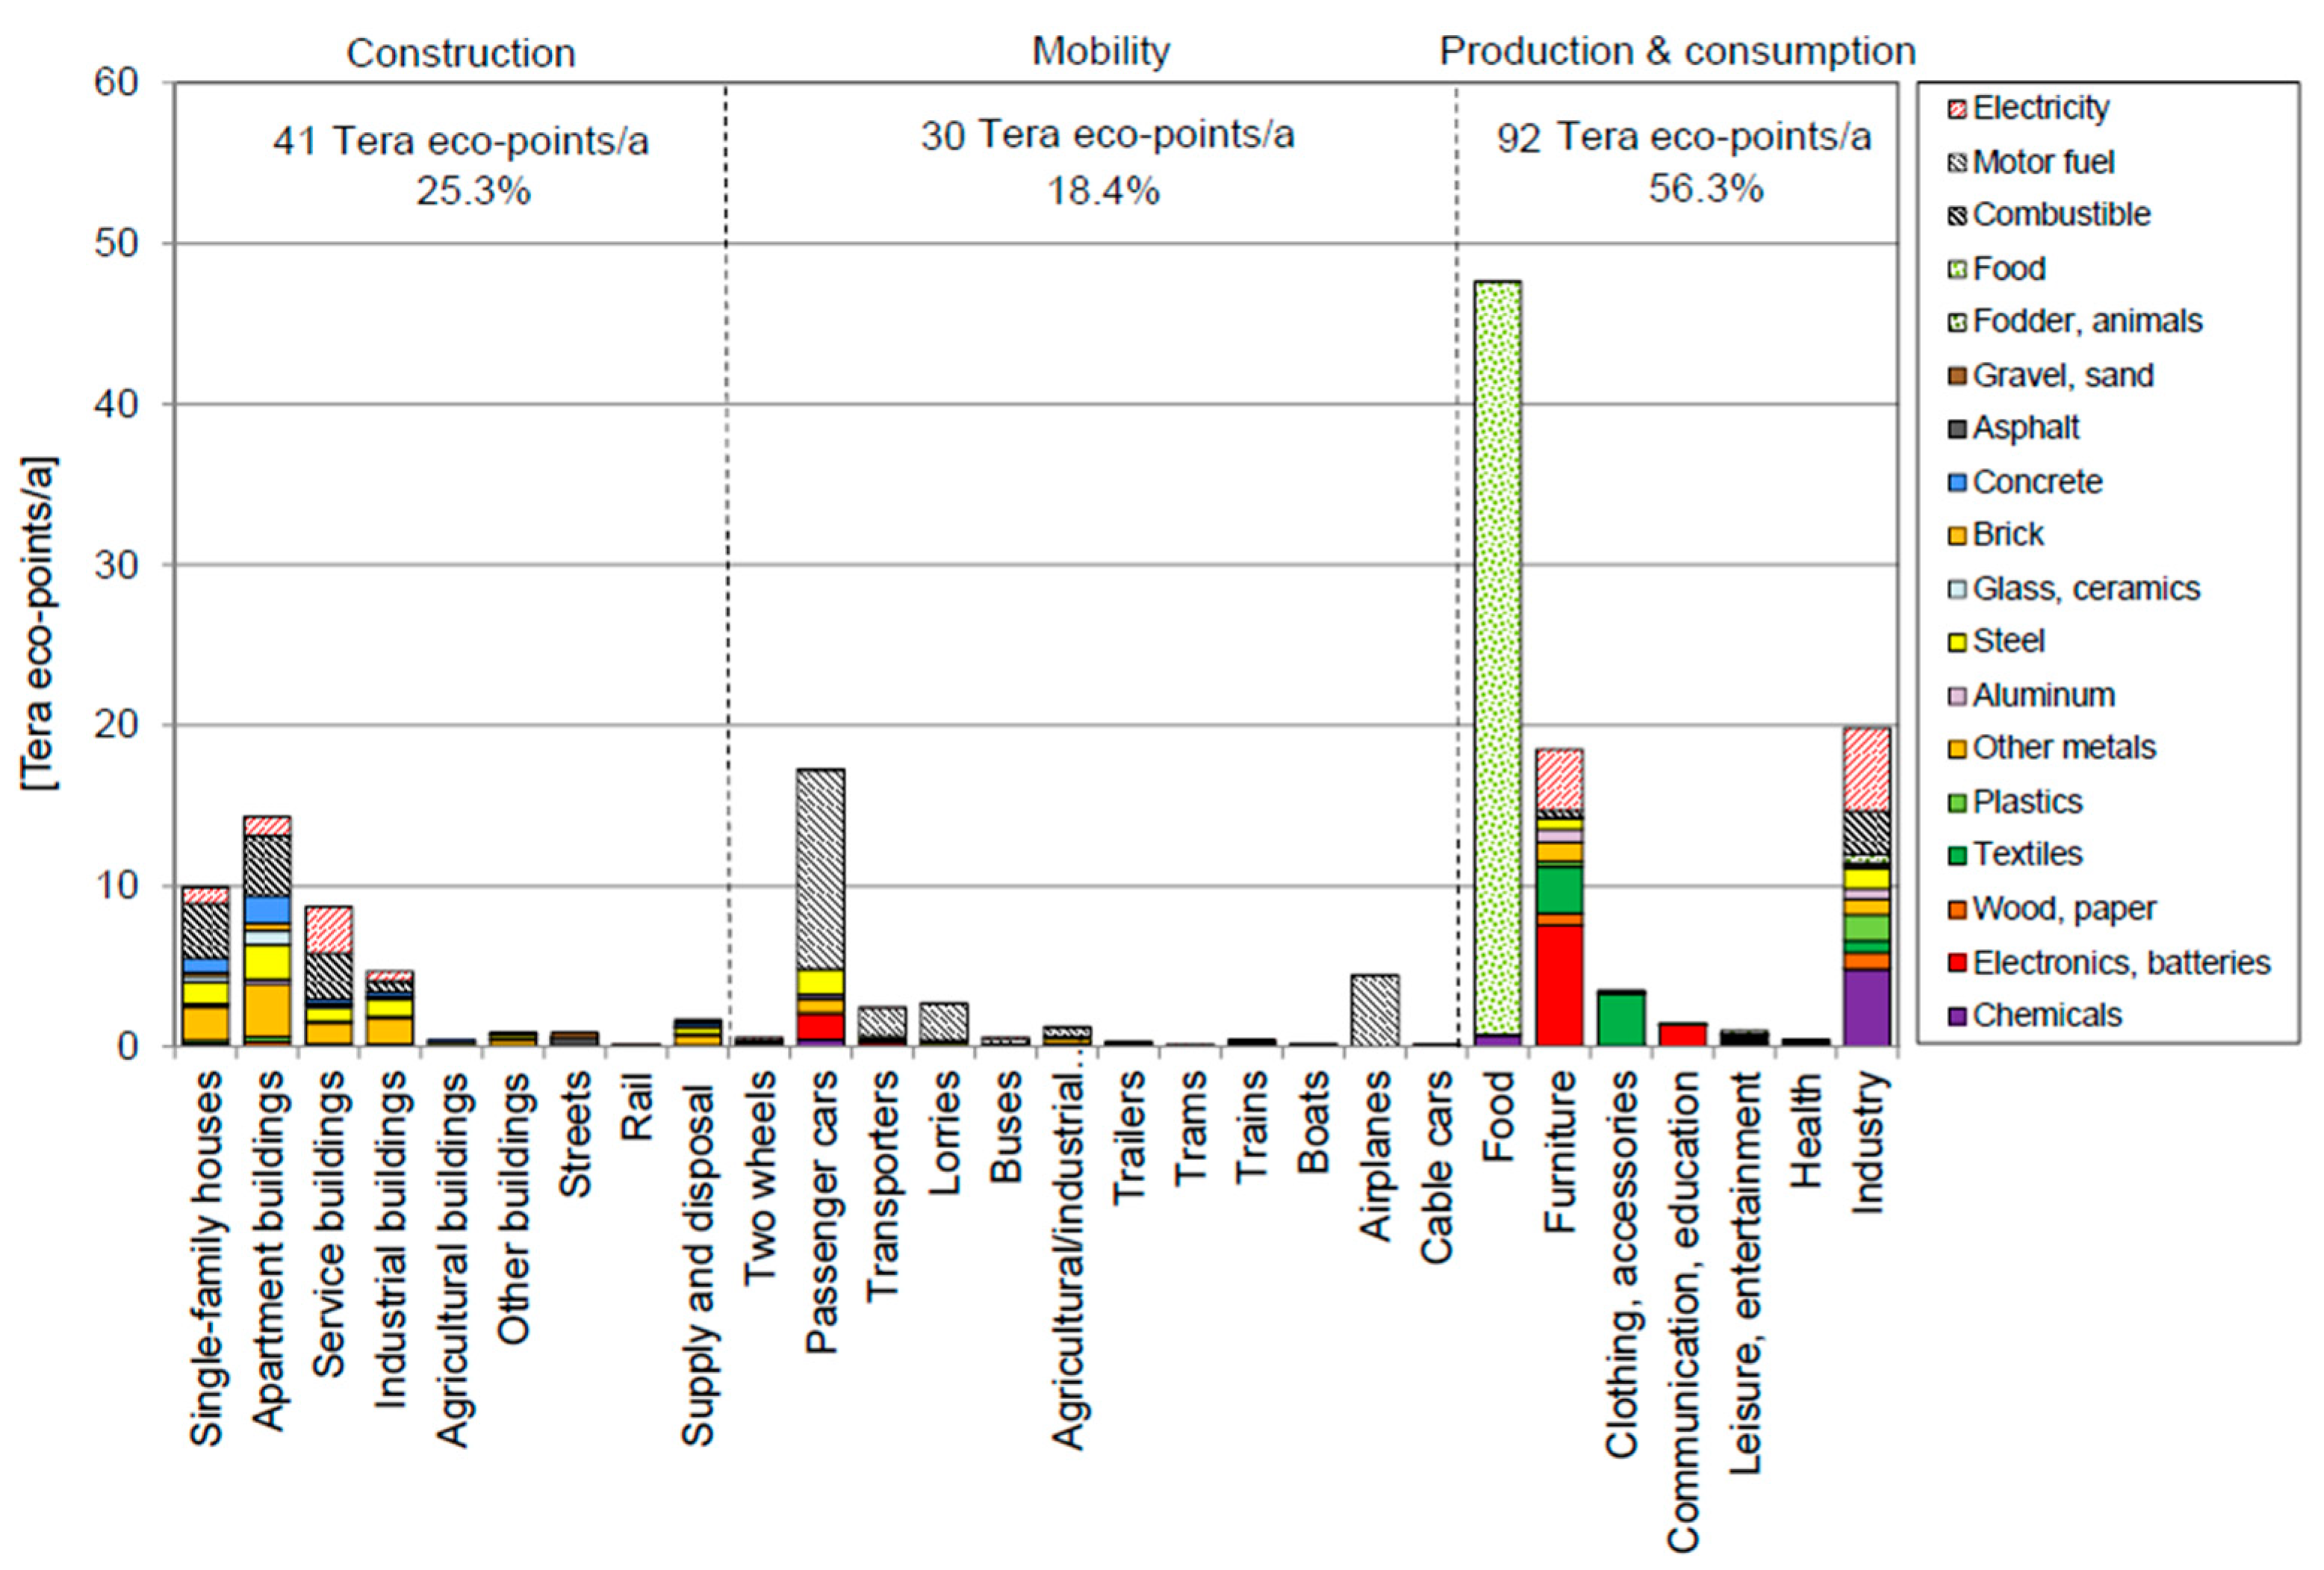
3.2. Environmental Impacts Generated by Consumption.

When linking the DMC to the environmental impacts generated from the extraction up to the consumption of the various materials, results show that it generates about 99 Mt/a of GHG expressed as CO2-eq. annually (Figure 6). About half of these emissions (51.6 Mt CO2-eq./a) occur in the country (excluding emissions generated by aviation). Results are somewhat higher than reported by the Swiss Federal Office for the Environment FOEN [77] for 2018 (46.4 Mt CO2-eq./a). Differences are mainly due to a higher estimation of GHG emissions from the food sector and passenger cars.
The allocation of GHG emissions to the consumption categories does not follow the same pattern as the allocation of the masses. About half of the emissions are generated by production and consumption (43 Mt CO2-eq./a; 43.7%). The remaining emissions are generated almost equally by construction (28 Mt CO2-eq./a, 28.3%) and mobility (28 Mt CO2-eq./a, 28.0%).
The combustion of energy carriers represents the biggest part of the cake, being responsible for half of the emissions. These are shared among the combustion of motor fuel (25%), combustible (19%), and electricity (6%) (Figure A1). Food consumption accounts for about 18% of the emissions. The consumption of concrete, despite its high 46% mass fraction, is responsible for only about 3% of the emissions. A detailed picture of the GHG generated by the annual mass flows can be found in Figure A3.
Results on the total GHG emissions are slightly lower than those found in Frischknecht et al. [44,45] (about 13.6 Mt CO2-eq./a per person or 108 Mt CO2-eq./a for 2011 and 116 Mt CO2-eq./a for 2015). Three factors can explain these differences: (i) The different reference years analyzed (2011, 2015 and 2018). (ii) The different LCI databases used (ecoinvent v.2.2 and treeze Ltd. vs. ecoinvent v.3-2-3.5). Finally, (iii) the fact that Frischknecht et al. [45] also considered indirect warming effects of stratospheric emissions from aircrafts (i.e., specific effects generated by contrails, water vapor, and aviation-induced cirrus clouds). This almost doubled the GHG emissions of aviation.
Swiss inhabitants generate on average about 11.6 tons of CO2 equivalent per person with their annual consumption. These emissions also include the ones on which they have only an indirect influence (about 5.4 t CO2-eq./a)—e.g., emissions generated by the exploitation and use of gravel, sand, and asphalt for the construction or maintenance of streets and rails or the ones generated by the combustion of the motor fuel needed by lorries to transport goods.

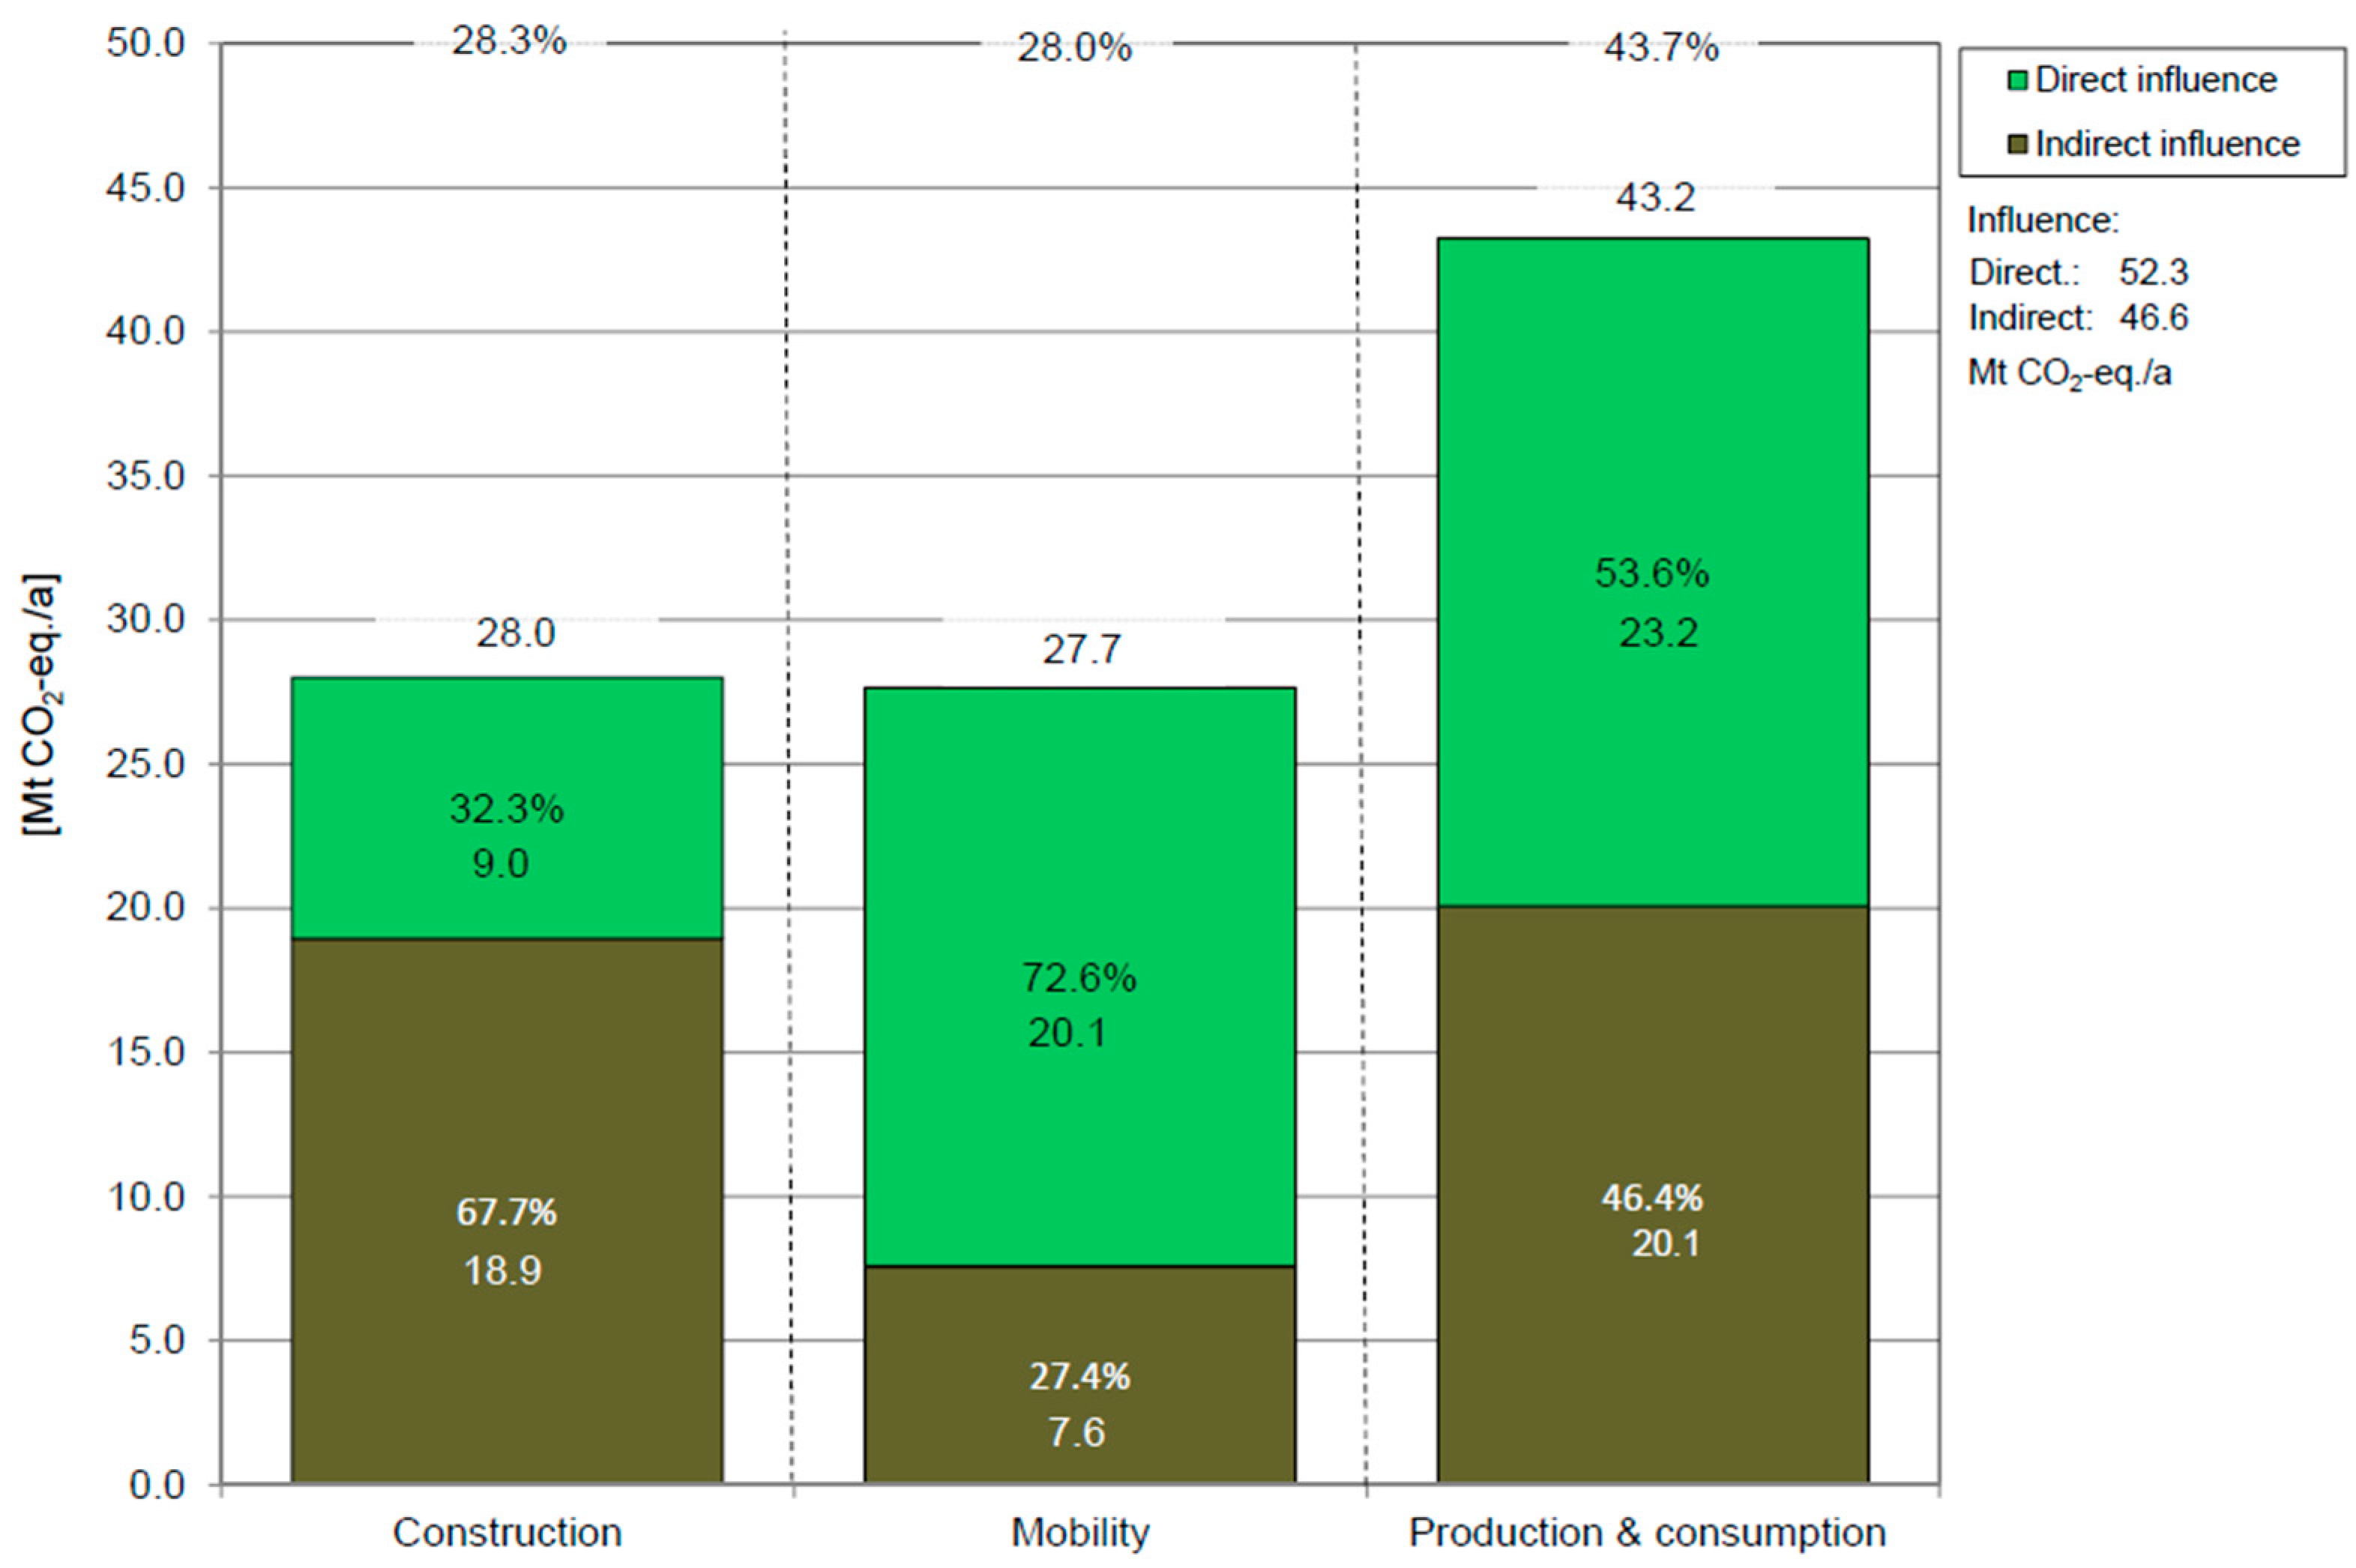
3.3. The Influence of Consumer Behavior

Looking at the three main sectors of the economy (construction, mobility, and production and consumption), the results show that for construction there is a large share of GHG emissions under the indirect influence of consumers (about 68%, Figure A6), as the majority of building surfaces are either part of rented apartment buildings or belong to service and industrial buildings. Single-family houses are an exception to this, as their inhabitants usually own them.
For mobility, on the other hand, there is a high level of direct influence (about 73% of the GHG emissions) due to the individual choice of means of transportation—e.g., for passenger cars or airplanes. Finally, for production and consumption, we found a high amount of public influence on industry, as well as a high amount of consumer influence in other categories for the general consumption of goods such as food, furniture, and clothing (Figure A6).
If the entire population behaved in the same way as the 20% of the population with the most climate-friendly behavior (white dots in Figure 7), GHG emissions would decrease to 83 Mt CO2-eq./a, which represents a 16% reduction in emissions. If, vice versa, the entire population behaved in the same way as the 20% of the population with the least climate-friendly behavior (black dots in Figure 7) GHG emissions would rise to 116 Mt CO2-eq./a, which represents a 17% increase. The spectrum of GHG emissions per person ranges between 9.7 t CO2-eq./a (low GHG quintile) and 13.5 t CO2-eq./a (high GHG quintile).
Looking only at the share under the direct influence of the consumer, average emissions amount to 6.1 t CO2-eq./a. The emissions of the most climate-friendly quintile are 31% lower (4.2 t CO2-eq./a per person), and the ones of the least climate-friendly quintile 32% higher (8.1 t CO2-eq./a) than the average ones.
Figure 8 summarizes the results of this study. The first bar on the left side shows the annual mass consumption of materials of the entire Swiss population. The two remaining bars show the greenhouse gas emissions generated by the consumption of these masses. The second bar shows the emissions attributed to the material categories. The third bar shows the direct vs. indirect influence of the consumers. White and black dots show how the GHG emissions would change if all were to behave like the 20% share of the population with the most or the least climate-friendly consumption behavior, respectively. The 20% most climate-friendly share of the population generates about one third fewer GHG emissions compared with the 20% share of the least climate-friendly one (approx. 83 Mt CO2-eq./a or 84% and approx. 116 Mt CO2-eq./a or 117%, respectively, in comparison to the average).

4. Discussion

4.1. The Effects of Material Consumption on Climate Change

This study allowed us to quantify and categorize the materials consumed annually in Switzerland and evaluate the environmental impacts generated during their life cycle. It showed that masses are considerable: individuals consume, on average, almost 150 times their own average body weight per year, mainly due to the consumption of construction material.
The consumption contributing the most to climate change is linked to the use of energy carriers as well as food consumption. Both combustibles and motor fuels rely heavily on fossil sources, and their consumption releases vast amounts of carbon dioxide, whereas the agricultural production of food is the primary source of methane emissions [78]. These results are in line with those reported by other studies [43,44,45].
Concrete, gravel, and sand are among the most consumed materials. While they account for almost half of the annually consumed mass, their consumption only generates a relatively small environmental impact when looking at the greenhouse gas emissions generated by national consumption (about 3% of the total). A high mass consumed hence does not automatically result in a high level of GHG emissions. The extraction and disposal of these materials nevertheless has other consequences for the environment. These are linked to landfilling capacities and to the increasingly difficulty of accessing primary mineral resources in the country [79]. On the other hand, the consumption of low quantities of materials can generate high environmental impacts. This is true, for example, for materials in electronics and batteries. These goods contain precious metals such as silver, palladium, and platinum or scarce metals such as indium or tantalum with low mass fractions whose extraction and production are often associated with high impacts on the environment [66,80]. Moreover, these metals are often considered critical for the economy [81].

4.2. Influence of Consumer Behavior on Greenhouse Gas Emissions of a Nation

Through their consumer behavior, individuals have an influence on only about half of the GHG emissions related to the DMC of Switzerland. For the other half, they have only an indirect influence—e.g., through their roles as voters or in their professional life. These indirect GHG emissions are generated by the consumption of public and quasi-public goods and services, such as road and rail networks, public buildings (hospitals, schools, industry, agriculture buildings), and freight transportation. Additionally, many dwellings in Switzerland are not owned by their inhabitants, with the country having one of the world’s lowest home ownership rates [82]. For these reasons, consumers have a relatively low direct influence on the emissions generated in the construction sector.
This study also highlights the limited variance in GHG emissions within the population. If we consider only the share of GHG emissions on which consumers have a direct influence, consumer behavior alone cannot bring anthropogenic GHG emissions down to zero. We showed that if everybody would behave like the most climate-friendly quintile of the population, the share of GHG emissions under the direct influence of the consumers would diminish about 31%. Considering the entire GHG emissions generated by consumption, the reduction would be merely 16%. We see three main reasons for this: Firstly, the fact that even the most environmentally friendly option available for many consumption categories often still generates GHG during its lifetime. This can be caused by either the actual state of technology and/or the low penetration of cleaner and energy efficient solutions in the market. Secondly, because individual determinants such as attitudes and beliefs, which are psychological variables influencing an individual consumer’s decision making, are shaped by the socio-economic system (cultural values, beliefs, habits, social norms) in which the person is living, as suggested by Fischer-Kowalski and Amann [83], Bin and Dowlatabadi [22], and O’Rourke and Lollo [84]. Thirdly, the fact that often reduction measures need the collaborative action of various stakeholders at all levels of society [85,86,87]—e.g., concerning mobility options. Without intervention from politics to create and maintain a public transportation system—for example—an individual will have difficulty in switching from private transport to public transport. Often, consumers find themselves “locked in” in consumption patterns that are not sustainable [88].
A concerted strategy at the political level seems, therefore, to be needed for a coordinated and guided change, to enable the shift towards a more climate-friendly behavior on the part of consumers, and to further decrease the environmental impact of even those consumers with the most climate-friendly behavior. Jackson [88] mentions as possible instruments enabling access to pro-environmental choices, incentives structures, and institutional rules. Other authors, such as Lehner et al. [89], highlight the positive effect of nudges, reinforcements, and indirect suggestions in influencing the behavior and decision-making of groups or individuals.

4.3. Uncertainty of the Results

Results are linked with inherent uncertainty, which arises from the limited data quality of different sources. Data uncertainty was estimated in a qualitative way by evaluating six dimensions of quality of the data source: accuracy, validity, reliability, timeliness, relevance, and completeness [90,91] (Table A2).
The highest uncertainty lies in the accuracy and reliability of data on building stock composition, lifespans of goods, and average material composition. This affects in particular the quality of the estimation of flows related to the construction sector, including the estimation of secondary flows re-entering the system. In order to verify the plausibility of the results, we cross-checked our results with official statistics [58,92] and obtained good results for the majority of the flows. However, some of the estimated secondary flow, i.e., of gravel and sand, turned out to be higher. Uncertainty related to the accuracy, validity, and timeliness of material composition data does also affect the quality of results related to “production and consumption”. This affects in particular the quality of the distribution of consumed masses among the different materials. Here, uncertainty is particularly critical for metals, as these can have a very high environmental impact per mass of consumed material. For example, increasing the annual consumed mass of palladium by only 1 t/a (+9%) would increase the total Swiss GHG emissions by about 11,300 t CO2-eq./a (+0.01%). Finally, results related to the mobility sector are expected to have a much lower uncertainty. On the one hand, we could provide a good average material composition and lifetime of the categories of vehicles. On the other hand, we had access to accurate, up to date, and reliable data on national fuel consumption.

4.4. Limitations of This Study and Further Research

This study presents some methodological limitations. Perhaps the main one concerns the authors’ best guess estimations of the direct and indirect influence of a consumer on GHG emissions. As mentioned, the differentiation between direct and indirect influence has to be seen as a strong simplification of reality. Nonetheless, it provides a first basis for discussion with transparent assumptions. Another limitation of this study concerns data availability. Information on the material composition of goods comes from different sources with different quality, and sometimes the best guess assumptions of the authors were necessary. In addition, it was not always possible to find an equivalent product name in the ecoinvent database for each type of material mentioned in Section 2.1, and sometimes proxies were chosen instead. Finally, a last limitation relates to the methodological difference in calculating material flows in the three main sectors (construction, mobility, and production and consumption) using stock-driven and inflow-driven approaches. Yet, care has been taken in avoiding double-counting and including all possible material flows. A comparison with national statistics confirms the plausibility of the results obtained [76]. Nonetheless, in the future a common methodology along all sectors of the economy should be used instead.
In the assessment of the environmental impacts, we focused on climate change and the achievement of the Paris Agreement goals. However, there are other major human-induced environmental changes threatening planetary habitability. Rockström et al. [1] and Steffen et al. [2] defined what they called the “planetary boundaries” of a “planetary playing field” for humanity. We addressed some of them—such as the alteration in biogeochemical flows, biosphere integrity, and land-system changes—in an aggregated way with the Ecological Scarcity Method (see Appendix A). However, it would be important to look at all planetary boundaries in a systemic way in order not to shift the environmental burden to other resources or other places.
In addition, this study only considers the influence of consumers on climate change. However, as mentioned by Hsu et al. [12], other state and non-state actors also play an important role in mitigating GHG emissions, and cooperation among them is often needed. A multi-stakeholder analysis would be a relevant follow-up to this research.
Finally, a further important dimension that ought to be considered in addition to the what (which materials are consumed, which impacts are generated) and the who (which stakeholders are involved) is the how: How do material flows need to be changed? How do stakeholders need to act and when? Which possible future pathways allow the transition back to a safe operating space? Research on this topic is still scarce (see, e.g., Günther et al. [93]).

Author Contributions

Conceptualization, C.M. and M.G.; methodology, M.G. and C.M.; data curation, C.M.; writing—original draft preparation, C.M.; writing—review and editing, M.G., H.B., and P.W.; visualization, C.M. and M.G.; supervision, H.B.; project administration, H.B.; funding acquisition, H.B. All authors have read and agreed to the published version of the manuscript.

Funding

This research was funded by the Swiss Federal Office for the Environment, FOEN.

Institutional Review Board Statement

Not applicable.

Informed Consent Statement

Not applicable.

Data Availability Statement

The data presented in this study are available on request from the corresponding author

Acknowledgments

This paper has been written as part of the MatCH-Project “Material and Energy Resources and their Environmental Impacts in Switzerland”, funded by the Swiss Federal Office for the Environment, FOEN. We would like to thank Bernhard Hammer, Michel Monteil, Sibyl Anwander, Peter Gerber, and Andreas Hauser (FOEN), as well as Marta Roca Puigròs and Andreas Gerber (Empa) for the specific thoughts and comments provided. Special thanks go to Andreas Frömelt (Swiss Federal Institute of Technology Zurich, ETHZ) for providing us with his data and for the information and discussion.

Conflicts of Interest

The authors declare no conflict of interest. The funders had no role in the design of the study; in the collection, analysis, or interpretation of data; in the writing of the manuscript; or in the decision to publish the results.

Appendix A

Figure A1. Annual Domestic Material Consumption (DMC) in Switzerland for 2018 and the environmental impacts generated by it (toe: tons oil equivalents).
Sustainability 13 02966 g0a1
Figure A2. Detailed representation of the mass flows generated by Swiss Domestic Material Consumption in 2018.
Sustainability 13 02966 g0a2
Figure A3. Detailed representation of the greenhouse gas (GHG) emissions generated by the mass flows of the Swiss economy in 2018.
Sustainability 13 02966 g0a3
Figure A4. Detailed representation of the total environmental impact generated by the mass flows of the Swiss economy in 2018.
Sustainability 13 02966 g0a4
Figure A5. Representation of the total environmental impact generated by the Swiss Domestic Material Consumption (DMC) divided into 18 material categories and 28 consumption categories.
Sustainability 13 02966 g0a5
Table A1. Assessment of the direct and indirect influence of consumer behavior for the 28 consumption categories considered in the frame of this study.
Consumption CategoryIndirect
Influence
Direct
Influence
Description
Single-family houses3%97%When owned: direct influence, as owners can decide on the composition and structure of the building, its heating system, and renovation measures.
Rented: indirect influence.
The percentage is calculated from the number of owned and rented single-family houses, resp. apartments buildings in Switzerland [94,95], regardless of their size.
Apartment buildings84%16%
Service buildings100%0%Indirect influence. Single individuals cannot—with their consumption behavior—modify the emissions generated by the construction, maintenance, and end-of-life of this infrastructure.
The entire population benefits from this infrastructure. Even if someone does not own a car, for example, the person depends on the road network for the transportation of goods or when using public transportations.
Industrial buildings100%0%
Agricultural buildings100%0%
Other buildings100%0%
Streets100%0%
Rail100%0%
Supply and disposal100%0%
Two wheels0%100%Direct influence. Individuals’ personal decisions to use a bike or a motorbike or not and how much to use it.
Passenger cars7%93%Privately owned: direct influence. Decision of the individual to own or not a passenger car, of which type, and how much it is driven. Owners are, however, often in a locked-in situation (you ride what you have).
Company fleets: indirect influence.
The percentage is calculated from the total distance daily covered within the country for private reasons vs. for business [96].
Transporters100%0%Indirect influence. An individual cannot influence the attributes of the vehicles and the distance they cover. The transportation of goods benefits the entire society.
Lorries100%0%
Buses0%100%Direct influence. The individual decides to either use public transportation or not. In reality, however, the use of public transportation is not merely demand-driven. The offer of public transportation is also a result of political and economic decisions.
Agricultural and industrial vehicles100%0%Indirect influence. The consumer cannot influence the type of vehicles used and their performance. Vehicles serve the entire society.
Trailers100%0%
Trams0%100%Same as for buses.
Trains20%80%Public transportation: direct influence. Predominantly there is a direct influence on whether to use trains as a mean of transportation or not. In reality, however, the use of public transportation is not only demand-driven; the network is also a result of political and economic decisions.
Freight transportation: indirect influence.
The percentage has been calculated from the operating performance of trains (million vehicles.km for the transportation of goods vs. passenger traffic) [97].
Boats67%33%Public transportation and private vehicles: direct influence.
Transportation of goods: indirect influence for goods transportation.
The percentage has been calculated from the share of motor fuel consumption between cargo ships vs. public passenger and private passenger ships [64].
Airplanes8%92%Public transportation and private vehicles: direct influence (no distinction between private and business travels).
Transportation of goods: indirect influence.
Percentage calculated from the mass of transported goods vs. the estimated mass of transported passengers [98,99].
Cable cars0%100%Direct influence. Individuals own decision to use cable cars or not.
Food18%82%From the moment food is bought: direct influence. Individuals make decisions on the type, origin, and quantity of food consumed as well as the amount of food wasted.
Supply chain: indirect influence.
Percentage calculated from the share of food waste taking place before and after the consumer buys the product [66].
Furniture38%62%Goods in dwellings: direct influence.
Goods in service and industrial buildings: indirect influence.
The percentage has been calculated from the share of mass of single-family houses and apartment buildings (direct influence) vs. the mass of the remaining types of buildings (indirect influence) [65,100].
Clothing, accessories0%100%Direct influence. Individuals make decisions on the type, origin, and quantity of clothing and accessories they buy.
Communication, education50%50%Private goods: direct influence
Goods in services and the industry: indirect influence.
Percentage estimated by authors as no available data found.
Leisure, entertainment0%100%Direct influence. Individuals make decisions on the type and quantity of leisure and entertainment activities they engage in.
Health0%100%Direct influence. Individuals make decisions on the type, origin, and amount of body care products, cleaning agents, and drugs they buy.
Industry100%0%Indirect influence. The type and quantity of materials and energy used by the industry are beyond the control of a consumer.
Table A2. Classification of data uncertainties according to six data quality dimensions [90,91]: from A: “High quality of data” to E: “Low quality of data”.
Data inputsSourceType of DataAccuracyValidityReliabilityTimelinessRelevanceCompleteness
Accurate enough for intended useCompliance with requirementsCollection process consistentAge of data is appropriate for the task at handData applicable and useful for intended useThe information is comprehensive enough to match data needs
Imports[57]Statistical databaseAAAAAA
Exports[57]Statistical databaseAAAAAA
Domestic extraction[58]Statistical databaseAABBAA
Electricity consumption[60]Statistical databaseAAAAAA
Animal products[61]Statistical databaseAABBAA
Built stock[62,63]Scientific reportsCACCAB
Mobility stock[59]Statistical databaseAABBAA
Material compositionLiterature review and best guess assumptions of the authorsStatistical databases, scientific reports and articles, online sources and expert estimatesCAB-CDAB
LifespansLiterature review and best guess assumptions of the authors CACCAB
Environmental impacts[70,71]Scientific reports (LCI) database)AAABAA
Direct and indirect influence of consumerLiterature review and best guess assumptions of the authors (see Table A1) BAB-CAAB
Figure A6. Allocation of the greenhouse gas emissions through consumption to the direct and indirect influence of the resident population for construction, mobility, and production and consumption, respectively.
Sustainability 13 02966 g0a6

Appendix B

The conversion of electricity in tons of oil equivalents (toe) has been calculated as follows: first, we defined the amount of GHG emissions per unit of Swiss electricity mix at the socket (including import shares) provided in the ecoinvent database [71]. This amounts to 0.102 kg CO2-eq. per kWh (or 28.3 tons of CO2-eq. per TJ). We then divided this value by the emission factor of oil products provided by the Swiss Federal Office for the Environment (FOEN), which amounts to 3.15 kg of CO2-eq. per kg of oil [101]. We therefore obtained a value of 0.03 kg of oil equivalents per kWh (or 8.97 toe per TJ) [64].

References

  1. Rockström, J.; Steffen, W.; Noone, K.; Persson, Å.; Chapin, F.S.; Lambin, E.F.; Lenton, T.M.; Scheffer, M.; Folke, C.; Schellnhuber, H.J.; et al. A safe operating space for humanity. Nature 2009, 461, 472–475. [Google Scholar] [CrossRef] [PubMed]
  2. Steffen, W.; Richardson, K.; Rockström, J.; Cornell, S.E.; Fetzer, I.; Bennett, E.M.; Biggs, R.; Carpenter, S.R.; de Vries, W.; de Wit, C.A.; et al. Planetary boundaries: Guiding human development on a changing planet. Science 2015, 347, 1259855. [Google Scholar] [CrossRef] [Green Version]
  3. IPCC. AR5 Synthesis Report: Climate Change 2014. In Intergovernmental Panel on Climate Change IPCC; IPCC: Geneva, Switzerland, 2014. [Google Scholar]
  4. Weber, E.U. Experience-Based and Description-Based Perceptions of Long-Term Risk: Why Global Warming does not Scare us (Yet). Clim. Chang. 2006, 77, 103–120. [Google Scholar] [CrossRef]
  5. Capstick, S.B. Public Understanding of Climate Change as a Social Dilemma. Sustainability 2013, 5, 3484–3501. [Google Scholar] [CrossRef] [Green Version]
  6. Aitken, C.; Chapman, R.; McClure, J. Climate change, powerlessness and the commons dilemma: Assessing New Zealanders’ preparedness to act. Glob. Environ. Chang. 2011, 21, 752–760. [Google Scholar] [CrossRef]
  7. UN. Paris Agreement; United Nations: Paris, France, 2015. [Google Scholar]
  8. UNEP. Emissions Gap Report 2017; United Nations Environment Programme UNEP: Nairobi, Kenya, 2017. [Google Scholar]
  9. UNEP. Emissions Gap Report 2020; United Nations Environment Programme UNEP: Nairobi, Kenya, 2020. [Google Scholar]
  10. Victor, D.G.; Akimoto, K.; Kaya, Y.; Yamaguchi, M.; Cullenward, D.; Hepburn, C. Prove Paris was more than paper promises. Nature 2017, 548, 25–27. [Google Scholar] [CrossRef]
  11. Rogelj, J.; den Elzen, M.; Höhne, N.; Fransen, T.; Fekete, H.; Winkler, H.; Schaeffer, R.; Sha, F.; Riahi, K.; Meinshausen, M. Paris Agreement climate proposals need a boost to keep warming well below 2  °C. Nature 2016, 534, 631–639. [Google Scholar] [CrossRef] [Green Version]
  12. Hsu, A.; Widerberg, O.; Weinfurter, A.; Chan, S.; Roelfsema, M.; Lütkehermöller, K.; Bakhtiari, F. Bridging the gap—The role of non-state and subnational actors. In Emissions Gap Report 2018; United Nations Environment Programme UNEP: Nairobi, Kenya, 2018. [Google Scholar]
  13. Hsu, A.; Höhne, N.; Kuramochi, T.; Vilariño, V.; Sovacool, B.K. Beyond states: Harnessing sub-national actors for the deep decarbonisation of cities, regions, and businesses. Energy Res. Soc. Sci. 2020, 70, 101738. [Google Scholar] [CrossRef]
  14. Sheng, C. Not just the state: The role of entrepreneurs in China’s energy transition. Energy Res. Soc. Sci. 2020, 70, 101814. [Google Scholar] [CrossRef]
  15. UNEP. Climate Commitments of Subnational Actors and Business: A Quantitative Assessment of Their Emission Reduction Impact; United Nations Environment Programme UNEP: Nairobi, Kenya, 2015. [Google Scholar]
  16. ICLEI. Measuring Up 2015: How US Cities Are Accelerating Progress toward National Climate Goals; World Wildlife Fund (WWF): Gland, Switzerland; ICLEI Local Governments for Sustainability: Bonn, Germany, 2015. [Google Scholar]
  17. Hsu, A.; Xie, Y.; Feierman, A.; Nicolai-Scanio, Z.; Rauber, R.; Weinfurter, A.; Huang, T.; Martin, G.; Thomas, R.; Janaskie, S.; et al. Who’s Acting on Climate Change? Subnational and Non-State Global Climate Action; Yale Data Driven Environmental Solutions Group (Data-Driven Yale): New Haven, NC, USA, 2017. [Google Scholar]
  18. Hsu, A.; Cheng, Y.; Weinfurter, A.; Xu, K.; Yick, C. Track climate pledges of cities and companies. Nature 2016, 532, 303–306. [Google Scholar] [CrossRef] [Green Version]
  19. Chan, S.; Ellinger, P.; Widerberg, O. Exploring national and regional orchestration of non-state action for a <1.5 °C world. Int. Environ. Agreem-P 2018, 18, 135–152. [Google Scholar] [CrossRef] [Green Version]
  20. Hale, T.N.; Chan, S.; Hsu, A.; Clapper, A.; Elliott, C.; Faria, P.; Kuramochi, T.; McDaniel, S.; Morgado, M.; Roelfsema, M.; et al. Sub- and non-state climate action: A framework to assess progress, implementation and impact. Clim. Policy 2020, 21, 406–420. [Google Scholar] [CrossRef]
  21. Kuramochi, T.; Roelfsema, M.; Hsu, A.; Lui, S.; Weinfurter, A.; Chan, S.; Hale, T.; Clapper, A.; Chang, A.; Höhne, N. Beyond national climate action: The impact of region, city, and business commitments on global greenhouse gas emissions. Clim. Policy 2020, 20, 275–291. [Google Scholar] [CrossRef] [Green Version]
  22. Bin, S.; Dowlatabadi, H. Consumer lifestyle approach to US energy use and the related CO2 emissions. Energy Policy 2005, 33, 197–208. [Google Scholar] [CrossRef]
  23. Dietz, T.; Gardner, G.T.; Gilligan, J.; Stern, P.C.; Vandenbergh, M.P. Household actions can provide a behavioral wedge to rapidly reduce US carbon emissions. Proc. Natl. Acad. Sci. USA 2009, 106, 18452. [Google Scholar] [CrossRef] [PubMed] [Green Version]
  24. van de Ven, D.J.; González-Eguino, M.; Arto, I. The potential of behavioural change for climate change mitigation: A case study for the European Union. Mitig. Adapt. Strateg. Glob. Chang. 2018, 23, 853–886. [Google Scholar] [CrossRef]
  25. Moran, D.; Wood, R.; Hertwich, E.; Mattson, K.; Rodriguez, J.F.D.; Schanes, K.; Barrett, J. Quantifying the potential for consumer-oriented policy to reduce European and foreign carbon emissions. Clim. Policy 2020, 20, 28–38. [Google Scholar] [CrossRef] [Green Version]
  26. Ivanova, D.; Stadler, K.; Steen–Olsen, K.; Wood, R.; Vita, G.; Tukker, A.; Hertwich, E. Environmental impact assessment of household consumption. J. Ind. Ecol. 2016, 20, 526–536. [Google Scholar] [CrossRef]
  27. Vandenbergh, M.P. The Carbon-Neutral Individual; Vanderbilt Law and Economics Research Paper No. 07-29, Vanderbilt Public Law Research Paper No. 07-22; New York University Law Review: New York, NY, USA, 2007; Volume 82, Available online: https://ssrn.com/abstract=1024159 (accessed on 22 September 2020).
  28. Davis, S.J.; Caldeira, K. Consumption-based accounting of CO2 emissions. Proc. Natl. Acad. Sci. USA 2010, 107, 5687. [Google Scholar] [CrossRef] [Green Version]
  29. Engel, J.F.; Blackwell, R.D.; Miniard, P.W. Consumer Behavior; Dryden Press: New York, NY, USA, 1990. [Google Scholar]
  30. Ala-Mantila, S.; Heinonen, J.; Junnila, S. Relationship between urbanization, direct and indirect greenhouse gas emissions, and expenditures: A multivariate analysis. Ecol. Econ. 2014, 104, 129–139. [Google Scholar] [CrossRef]
  31. Baiocchi, G.; Minx, J.; Hubacek, K. The Impact of Social Factors and Consumer Behavior on Carbon Dioxide Emissions in the United Kingdom. J. Ind. Ecol. 2010, 14, 50–72. [Google Scholar] [CrossRef]
  32. Druckman, A.; Jackson, T. Understanding households as drivers of carbon emissions. In Taking Stock of Industrial Ecology; Clift, R., Druckman, A., Eds.; Springer International Publishing: Berlin/Heidelberg, Germany, 2016; pp. 181–203. [Google Scholar] [CrossRef] [Green Version]
  33. Druckman, A.; Jackson, T. The bare necessities: How much household carbon do we really need? Ecol. Econ. 2010, 69, 1794–1804. [Google Scholar] [CrossRef] [Green Version]
  34. Druckman, A.; Jackson, T. The carbon footprint of UK households 1990-2004: A socio-economically disaggregated, quasi-multi-regional input-output model. Ecol. Econ. 2009, 68, 2066–2077. [Google Scholar] [CrossRef] [Green Version]
  35. Dubois, G.; Sovacool, B.; Aall, C.; Nilsson, M.; Barbier, C.; Herrmann, A.; Bruyère, S.; Andersson, C.; Skold, B.; Nadaud, F.; et al. It starts at home? Climate policies targeting household consumption and behavioral decisions are key to low-carbon futures. Energy Res. Soc. Sci. 2019, 52, 144–158. [Google Scholar] [CrossRef]
  36. Frömelt, A.; Dürrenmatt, D.; Hellweg, S. Using data mining to assess environmental impacts of household consumption behaviors. Environ. Sci. Technol. 2018, 52, 8467–8478. [Google Scholar] [CrossRef]
  37. Girod, B.; De Haan, P. More or Better? A Model for Changes in Household Greenhouse Gas Emissions due to Higher Income. J. Ind. Ecol. 2010, 14, 31–49. [Google Scholar] [CrossRef]
  38. Girod, B.; De Haan, P. GHG reduction potential of changes in consumption patterns and higher quality levels: Evidence from Swiss household consumption survey. Energy Policy 2009, 37, 5650–5661. [Google Scholar] [CrossRef]
  39. Kok, R.; Benders, R.M.J.; Moll, H.C. Measuring the environmental load of household consumption using some methods based on input–output energy analysis: A comparison of methods and a discussion of results. Energy Policy 2006, 34, 2744–2761. [Google Scholar] [CrossRef]
  40. Ding, Q.; Cai, W.; Wang, C.; Sanwal, M. The Relationships between Household Consumption Activities and Energy Consumption in China—An input-output analysis from the lifestyle perspective. Appl. Energy 2017, 207, 520–532. [Google Scholar] [CrossRef]
  41. Zhou, X.Y.; Gu, A.L. Impacts of Household Living Consumption on Energy Use and Carbon Emissions in China Based on the Input–output Model. Adv. Clim. Chang. Res. 2020, 11, 118–130. [Google Scholar] [CrossRef]
  42. Tukker, A.; Bulavskaya, T.; Giljum, S.; de Koning, A.; Lutter, S.; Simas, M.; Stadler, K.; Wood, R. The Global Resource Footprint of Nations—Carbon, Water, Land and Materials Embodied in Trade and Final Consumption Calculated with EXIOBASE 2.1; The Netherlands Organisation for Applied Scientific Research: Leiden/Delft/Vienna/Trondheim, The Netherlands, 2014. [Google Scholar]
  43. Jungbluth, N.; Stucki, M.; Leuenberger, M. Environmental Impacts of Swiss Consumption and Production; Swiss Federal Office for the Environment FOEN: Ittigen, Switzerland, 2011. [Google Scholar]
  44. Frischknecht, R.; Nathani, C.; Büsser Knöpfel, S.; Itten, R.; Wyss, F.; Hellmüller, P. Entwicklung der Weltweiten Umweltauswirkungen der Schweiz—Umweltbelastung von Konsum und Produktion von 1996 bis 2011; Swiss Federal Office for the Environment FOEN: Ittigen, Switzerland, 2014. [Google Scholar]
  45. Frischknecht, R.; Nathani, C.; Alig, M.; Stolz, P.; Tschümperlin, L.; Hellmüller, P. Umwelt-Fussabdrücke des Schweizer Konsums—Zeitlicher Verlauf 1996 bis 2015; Swiss Federal Office for the Environment FOEN: Ittigen, Switzerland, 2018. [Google Scholar]
  46. FOEN. Switzerland’s Climate Policy. Implementation of the Paris Agreement; Swiss Federal Office for the Environment FOEN: Ittigen, Switzerland, 2018. [Google Scholar]
  47. Federal Council Aims for a Climate-Neutral Switzerland by 2050. Available online: https://www.admin.ch/gov/en/start/documentation/media-releases.msg-id-76206.html (accessed on 9 February 2021).
  48. FSO. Switzerland’s Population in 2018; Swiss Federal Statistical Office FSO: Neuchâtel, Switzerland, 2019. [Google Scholar]
  49. Finnveden, G.; Moberg, Å. Environmental systems analysis tools—An overview. J. Clean. Prod. 2005, 13, 1165–1173. [Google Scholar] [CrossRef]
  50. Baccini, P.; Brunner, P. Metabolism of the Anthroposphere: Analysis, Evaluation, Design, 2nd ed.; MIT Press: Cambridge, MA, USA, 2012. [Google Scholar]
  51. Brunner, P.H.; Rechberger, H. Practical Handbook of Material Flow Analysis; Lewis Publishers: New York, NY, USA, 2004. [Google Scholar]
  52. OECD. Measuring Material Flows and Resource Productivity—Synthesis Report; Organisation for Economic Cooperation and Development OECD: Paris, France, 2008. [Google Scholar]
  53. Müller, D.B. Stock dynamics for forecasting material flows—Case study for housing in The Netherlands. Ecol. Econ. 2006, 59, 142–156. [Google Scholar] [CrossRef]
  54. Müller, E.; Hilty, L.M.; Widmer, R.; Schluep, M.; Faulstich, M. Modeling Metal Stocks and Flows: A Review of Dynamic Material Flow Analysis Methods. Environ. Sci. Technol. 2014, 48, 2102–2113. [Google Scholar] [CrossRef]
  55. Augiseau, V.; Barles, S. Studying construction materials flows and stock: A review. Resour. Conserv. Recy. 2017, 123, 153–164. [Google Scholar] [CrossRef]
  56. Glossary: Domestic Material Consumption (DMC). Available online: https://ec.europa.eu/eurostat/statistics-explained/index.php/Glossary:Domestic_material_consumption_%28DMC%29 (accessed on 22 September 2020).
  57. Swiss-Impex. Available online: https://www.gate.ezv.admin.ch/swissimpex/ (accessed on 22 September 2020).
  58. STAT-TAB—Interactive Tables. Available online: https://www.pxweb.bfs.admin.ch/pxweb/en/px-x-0204000000_101/-/px-x-0204000000_101.px/?rxid=21e64571-0902-4080-ac2d-d0d9b7663e4e (accessed on 22 September 2020).
  59. Road Vehicles—Stock, Level of Motorization. Available online: https://www.bfs.admin.ch/bfs/en/home/statistics/mobility-transport/transport-infrastructure-vehicles/vehicles/road-vehicles-stock-level-motorisation.html (accessed on 22 September 2020).
  60. SFOE. Schweizerische Gesamtenergiestatistik 2018; Swiss Federal Office of Energy SFOE: Bern, Switzerland, 2018. [Google Scholar]
  61. Agristat. Statistische Erhebung und Schätzungen über Landwirtschaft und Ernährung 2014; Swiss Farmers’ Union: Brugg, Switzerland, 2014. [Google Scholar]
  62. Wüest & Partner. Bauabfälle in der Schweiz—Hochbau; Swiss Federal Office for the Environment FOEN: Ittigen, Switzerland, 2015. [Google Scholar]
  63. Rubli, S. Excel-Daten: Materiallager und Bauabfälle Tiefbau CH 2013; On Behalf of the Swiss Federal Office for the Environment FOEN: Ittigen, Switzerland, 2015. [Google Scholar]
  64. Gauch, M.; Matasci, C.; Hincapié, I.; Böni, H. Projekt “MatCH Mobilität”—Material- und Energieressourcen sowie Umweltauswirkungen der Mobilität Schweiz; Empa, Technology and Society Laboratory on behalf of the Swiss Federal Office for the Environment FOEN: St. Gallen, Switzerland, 2017. [Google Scholar]
  65. Gauch, M.; Matasci, C.; Hincapié, I.; Hörler, R.; Böni, H. Projekt “MatCH Bau”—Material- und Energieressourcen sowie Umweltauswirkungen der baulichen Infrastruktur der Schweiz; Empa, Technology and Society Laboratory on behalf of the Swiss Federal Office for the Environment FOEN: St. Gallen, Switzerland, 2016. [Google Scholar]
  66. Matasci, C.; Gauch, M.; Böni, H. Projekt “MatCH Produktion&Konsum”—Material- und Energieressourcen von Produktion und Konsum in der Schweiz; Empa, Technology and Society Laboratory on behalf of the Swiss Federal Office for the Environment FOEN: St. Gallen, Switzerland, 2018. [Google Scholar]
  67. Rees, W.E.; Wackernagel, M. Ecological footprints and appropriated carrying capacity: Measuring the natural capital requirements of the human economy. In Investing in Natural Capital: The Ecological Economics Approach to Sustainability; Island Press: Washington, DC, USA, 1994. [Google Scholar]
  68. Miller, R.E.; Blair, P.D. Input-Output Analysis Foundations and Extensions; Cambridge University Press: New York, NY, USA, 2009. [Google Scholar]
  69. EU JRC. Handbook—Specific Guide for Life Cycle Inventory Data Sets; European Commission—Joint Research Centre EU JRC—Institute for Environment and Sustainability: International Reference Life Cycle Data System (ILCD): Luxembourg, 2010. [Google Scholar]
  70. Ecoinvent, 2016. Ecoinvent Database v.3.2 (Status January 2016). Available online: https://www.ecoinvent.org/database/ecoinvent-32/ecoinvent-32.html (accessed on 30 November 2015).
  71. Ecoinvent, 2018. Ecoinvent Database v.3.5 (Status August 2018). Available online: https://www.ecoinvent.org/database/older-versions/ecoinvent-35/ecoinvent-35.html (accessed on 23 August 2018).
  72. Frischknecht, R.; Büsser Knöpfel, S. Swiss Eco-Factors 2013 according to the Ecological Scarcity Method; Swiss Federal Office for the Environment FOEN: Ittigen, Switzerland, 2013. [Google Scholar]
  73. McConnell, C.R.; Brue, S.L.; Flynn, S.M. Economics: Principles, Problems, and Policies, 19th ed.; McGraw-Hill/Irwin: New York, NY, USA, 2011. [Google Scholar]
  74. Paone, A.; Bacher, J.-P. The Impact of Building Occupant Behavior on Energy Efficiency and Methods to Influence It: A Review of the State of the Art. Energies 2018, 11, 953. [Google Scholar] [CrossRef] [Green Version]
  75. Matasci, C.; Gauch, M.; Böni, H. How to Increase Circularity in the Swiss Economy. Detritus 2021, in press. [Google Scholar] [CrossRef]
  76. Materialflüsse in der Schweiz. Available online: https://www.bfs.admin.ch/bfs/en/home/statistics/territory-environment.assetdetail.13327326.html (accessed on 22 September 2020).
  77. FOEN. Treibhausgasemissionen der Schweiz 1990–2018; Swiss Federal Office for the Environment FOEN: Ittigen, Switzerland, 2020. [Google Scholar]
  78. Nemecek, T.; Kägi, T. Life Cycle Inventories of Swiss and European Agricultural Production Systems; Agroscope Reckenholz-Tänikon Research Station ART: Zurich, Switzerland, 2007. [Google Scholar]
  79. swisstopo. Bericht über die Versorgung der Schweiz mit Nichtenergetischen Mineralischen Rohstoffen (Bericht Mineralische Rohstoffe); Swiss Federal Office of Topography swisstopo—Landesgeologie: Wabern, Switzerland, 2017. [Google Scholar]
  80. Nuss, P.; Eckelman, M. Life Cycle Assessment of Metals: A Scientific Synthesis. PLoS ONE 2014, 9, e101298. [Google Scholar] [CrossRef]
  81. Schrijvers, D.; Hool, A.; Blengini, G.A.; Chen, W.Q.; Dewulf, J.; Eggert, R.; van Ellen, L.; Gauss, R.; Goddin, J.; Habib, K.; et al. A review of methods and data to determine raw material criticality. Resour. Conserv. Recycl. 2020, 155, 104617. [Google Scholar] [CrossRef]
  82. Fisher, L.; Jaffe, A. Determinants of International Home Ownership Rates. Hous. Financ. Int. 2003, 18, 34–37. [Google Scholar]
  83. Fischer-Kowalski, M.; Amann, C. Beyond IPAT and Kuznets Curves: Globalization as a Vital Factor in Analysing the Environmental Impact of Socio-Economic Metabolism. Popul. Environ. 2001, 23, 7–47. [Google Scholar] [CrossRef]
  84. O’Rourke, D.; Lollo, N. Transforming Consumption: From Decoupling, to Behavior Change, to System Changes for Sustainable Consumption. Annu. Rev. Env. Resour. 2015, 40, 233–259. [Google Scholar] [CrossRef] [Green Version]
  85. Lemos, M.C.; Agrawal, A. Environmental Governance. Annu. Rev. Env. Resour. 2006, 31, 297–325. [Google Scholar] [CrossRef]
  86. Fröhlich, J.; Knieling, J. Conceptualising Climate Change Governance. In Climate Change Governance; Knieling, J., Leal Filho, W., Eds.; Springer: Berlin/Heidelberg, Germany, 2013; pp. 9–26. [Google Scholar] [CrossRef]
  87. Walk, H. Partizipative Governance: Beteiligungsformen und Beteiligungsrechte im Mehrebenensystem der Klimapolitik; Wiesbaden, V.S., Ed.; Verlag für Sozialwiss: Wiesbaden, Germany, 2008. [Google Scholar]
  88. Jackson, T. Motivating Sustainable Consumption. Sustain. Dev. Res. Netw. 2005, 29, 30–40. [Google Scholar]
  89. Lehner, M.; Mont, O.; Heiskanen, E. Nudging—A promising tool for sustainable consumption behaviour? J. Clean. Prod. 2016, 134, 166–177. [Google Scholar] [CrossRef]
  90. Fleckenstein, M.; Fellows, L. Data Quality. In Modern Data Strategy; Springer: Berlin/Heidelberg, Germany, 2018. [Google Scholar]
  91. Herzog, T.; Scheuren, F.J.; Winkler, W.E. Data Quality and Record Linkage Techniques; Springer: Berlin/Heidelberg, Germany, 2008. [Google Scholar]
  92. Waste Statistics. Available online: https://www.bafu.admin.ch/bafu/en/home/topics/waste/state/data.html (accessed on 9 February 2021).
  93. Günther, J.; Lehmann, H.; Nuss, P.; Purr, K. Resource-Efficient Pathways towards Greenhouse-Gas. Neutrality—RESCUE Summary Report; UBA: Dessau-Roßlau, Germany, 2019. [Google Scholar]
  94. Bewohnte Wohnungen bzw. Wohneigentumsquote Nach Haushaltstyp. Available online: https://www.bfs.admin.ch/bfs/de/home/statistiken/bau-wohnungswesen/wohnungen.assetdetail.7346166.html (accessed on 22 September 2020).
  95. Wohnverhältnisse nach Zimmerzahl und Bewohnertyp. Available online: https://www.bfs.admin.ch/bfs/en/home/statistics/catalogues-databases/tables.assetdetail.7346167.html (accessed on 22 September 2020).
  96. FSO. Population’s Transport Behaviour 2015—Key Results of the Mobility and Transport Microcensus; Swiss Federal Statistical Office FSO: Neuchâtel, Switzerland, 2017. [Google Scholar]
  97. SBB. SBB Facts and Figures 2019; Swiss Federal Railways SBB: Bern, Switzerland, 2020. [Google Scholar]
  98. Civil Aviation—Overview. Available online: https://www.bfs.admin.ch/bfs/en/home/statistics/mobility-transport/cross-sectional-topics/civil-aviation.html (accessed on 22 September 2020).
  99. FSO. Güterverkehr in der Schweiz 2017; Swiss Federal Statistical Office FSO: Neuchâtel, Switzerland, 2018. [Google Scholar]
  100. FSO. Bau- und Wohnungswesen 2016; Swiss Federal Statistical Office FSO: Neuchâtel, 2018. [Google Scholar]
  101. FOEN. CO2-Emissionsfaktoren des Treibhausgasinventars der Schweiz; Swiss Federal Office for the Environment FOEN: Ittigen, Switzerland, 2019. [Google Scholar]
Figure 1. The four-step approach used in this study. The first two steps analyze the entire Swiss economy, whereas the last two steps analyze consumer behavior at the level of an individual.
Sustainability 13 02966 g001
Figure 2. Material and consumption categories investigated in the frame of this study. The color code for the material categories is consistently used throughout this article.
Sustainability 13 02966 g002
Figure 3. The concept behind the calculation of the direct and indirect influence of consumer behavior applied in this study.
Sustainability 13 02966 g003
Figure 4. Aggregated material flows for Switzerland in 2018. The Domestic Material Consumption (DMC) is in yellow. The flow of secondary materials re-entering the system is in light yellow. Reproduced with permission from Matasci et al., Detritus; published by CISA Publisher, in press [75].
Sustainability 13 02966 g004
Figure 5. Swiss Domestic Material Consumption (DMC) allocated to 18 material and 28 consumption categories. Electricity is expressed in tons of oil equivalents (toe), the mass of oil that would produce the same amount of greenhouse gas emissions as the used electricity mix. An explanation of the methodology can be found in Appendix B.
Sustainability 13 02966 g005
Figure 6. Greenhouse gas emissions through the Domestic Material Consumption (DMC) allocated to 18 material and 28 consumption categories.
Sustainability 13 02966 g006
Figure 7. Greenhouse gas (GHG) emissions through consumption allocated to 28 consumption categories. In dark green, the GHG emissions indirectly influenced by consumers; in light green, the GHG emissions directly influenced by them. White dots show emissions that would result if the entire resident population were to behave like the quintile that groups behavioral archetypes with the lowest GHG emissions per capita. Black dots show emissions that would result if the entire resident population were to behave like the quintile that groups behavioral archetypes with the highest GHG emissions per capita.
Sustainability 13 02966 g007
Figure 8. Consumption and greenhouse gas emissions of the Swiss population in 2018, differentiated according to materials and the influence of consumer behavior. White dots show emissions that would result if the entire resident population were to behave like the quintile that groups behavioral archetypes with the lowest GHG emissions per capita. Black dots show emissions that would result if the entire resident population were to behave like the quintile that groups behavioral archetypes with the highest GHG emissions per capita.
Sustainability 13 02966 g008
Publisher’s Note: MDPI stays neutral with regard to jurisdictional claims in published maps and institutional affiliations.

