Abstract
To remain competitive, companies must continuously improve the processes at hand, be they administrative, production, or logistics. The objective of the study described in this paper was to develop a decision-making tool based on a simulation model to support the production of knits and damask fabrics. The tool was used to test different control strategies for material flow, from the raw material warehouse to the finished product warehouse, and thus can also be used to evaluate the impacts of these strategies on the productivity. The data upon which the decision support tool was built were collected from five sectors of the plant: the raw material warehouse, knit production, damask production, finishing work, and the finished product warehouse. The decision support tool met the objectives of the project, with all five strategies developed showing positive results. Knit and damask production rates increased by up to 8% and 44%, respectively, and a reduction of 75% was observed in the waiting time on the point of entry to the finishing work area, compared to the company’s existing system.
1. Introduction
Continuous improvement has emerged as an essential strategy in enhancing competitiveness in a world where excellence prevails. Today’s manufacturing companies continuously strive to become operationally excellent by improving the efficiency of their manufacturing shop floors [1]. Shop floor efficiency can be improved by addressing operational issues to achieve fast or smooth flow of raw materials, work-in-progress, and information within a production network. The study described in this paper was part of an industrial project carried out at a textile company to analyze and improve the flow of inbound raw materials.
The company has dedicated its capabilities to produce the highest quality of materials for the mattress industry. The company specializes in jacquards, providing a wide range of apricots and weaving, in addition to having a strong knitting, velvet and fabric spacer production capacity, using top-of-the-range equipment and raw materials. The company is fully aware that the full production capacity can only be achieved through the use of qualified professionals, as well as with the implementation of the latest technology in machinery and processes. Due to market competition, the company is constantly under pressure to provide products and solutions that are increasingly demanding in terms of new design, high quality, and quick delivery. For this reason, the company has dedicated lines of fibers and innovative finishes in the manufacture of apricots and knits intended for mattress covers, but nonetheless, it does require robust control strategies for the material flows.
Working within the production planning department, the study described in this paper aimed to evaluate different control strategies for material flows from the raw material warehouse through to the production lines and finished product warehouse. A simulation-based tool was developed to support the decision making, from parameterization and definition of the control strategies to testing of the strategies using the purpose-built simulation model. The way in which we developed the simulation model as a decision support tool for the control strategy of inbound material flow demonstrates the academic contributions of this paper.
The paper is divided into five sections. Section 2 presents a review of the literature pertaining to computer simulation in manufacturing. Section 3 describes the method used to undertake this study. Section 4 illustrates the development of the decision-making support system and the analysis, before the conclusions in Section 5.
2. Literature Review
Kotler in (Coimbra, 2009) [2] defined the term logistics as “the planning, implementation and control of the physical flow of materials and finished products, from the point of origin to the point of use to meet customer needs, with profit.” In the context of internal logistics, the flow of materials incorporates five distinct concepts, including supermarkets, mizusumashi (logistics train), synchronization, production leveling, and a pull system [3]. Control strategies are needed to regulate the movement and timing of material release from one part of the manufacturing line to the other until the products are completely manufactured [4].
To reduce bottlenecks and increase the responsiveness of the production line, control strategies are often planned and validated using material flow simulation [5]. To this end, simulation has proven to be useful as a form of validating or refuting possible measures for the improvement of processes in a company [6,7]. The use of simulations for material flow analysis in this instance ultimately helps in the evaluation and planning of the material flow [8]. Simulation is also useful to control the production scheduling at a telecommunications factory for the pro-vision of resources, considering the constraints of the incoming warehouse, which otherwise may jeopardize the material flow process [9]. In a job-shop production system, simulation of material flow is useful to monitor the execution of production by providing support to job scheduling [10]. In terms of productivity improvement, material flow simulation can be used to pinpoint the additional space freed up in nearby workstations of a furniture assembly plant, resulting in an increase in the throughput rate [11].
Within the inbound logistics area, a discrete-event simulation model was developed to understand and compare the effects of changes in delivery windows, inventory management policies, transport types, etc., on sustainable inbound logistics [12]. One possible way of improving inbound logistics operations is to evaluate the various scheduling patterns under different terms and conditions [13]. In the context of warehousing, loading and unloading systems were modeled and simulated to minimize the length of stay of any truck on the dock [14]. Similarly, in transport logistics, simulation was employed to optimize transport distances in the context of picking orders [15] and to allocate charging stations for electric vehicles, which was based on a model of urban traffic and vehicle energy consumption [16].
Opacic et al. (2018) [17] carried out a study that incorporates a decision support system to analyze, evaluate, and possibly alter the production process at a factory that manufactures wooden products. A decision support system often features graphical simulation allowing users to visually interrogate the system, identify new configurations for the process, reduce worker operation time, as well as increase the number of units produced [18]. A simulation-based decision support system may also be combined with process re-engineering with a view to improving the capacity of ceramic production facilities and reducing their production times [19] and to reducing the negative impact of machine breakdowns on the performance of packaging and filling lines producing fast-moving consumer goods [20].
Being the early adopter of manufacturing simulation, the automotive sector is at the forefront of simulation-based decision making. Ferreira et al. (2011) [21] used it to assess the impact generated on the number of vehicles produced by the number of pallets circulating on the closed-loop network configuration. Ladbrook et al. (2011) [22] subsequently went one step ahead to use it as a basis of investment decisions. The latter was demonstrated by their study at the Ford production lines in Valencia, Spain.
Despite the widespread use of simulation-based decision-making applications, especially in the manufacturing domain, the extant work focusing on control strategies for material flow appears to be lacking, and consequently, this paper will extensively employ simulation modeling to purposely fill the gap.
3. Material and Method
A simulation-based decision-making process allows for the modeling and analysis of the performance of complex systems and processes [6,23,24,25,26]. Simulation constitutes an instrument, providing the user with possibilities that include developing a model based on a real system, predicting actions ensuing from previously collected data, predicting areas with the potential for improvement, and evaluating the impact of different types of strategies on these and other areas [27,28,29,30,31,32,33]. For these reasons, simulation was employed extensively within the five distinct phases in our research method.
Phase I: Literature review in the area of industrial simulation. Desk-based research was undertaken on the existing literature pertaining to the stages required to develop a simulation project and how to maximize its implementation.
Phase II: Collection of indicators from the Departments of Production, Finishing and Warehouse at the company, with the purpose of gaining insight into its supply policies for material flow. Based on the knowledge acquired in the previous phase, a survey was carried out at this point to collect data inherent to the working method at the company (e.g., mapping of production processes through flowcharts, the manner of machine use, and its times and speeds, amongst others).
Phase III: Data analysis and proposals of solutions for the problems being addressed. During this phase, the data were analyzed in order to evaluate the main points or places where problems were found. Subsequently, solutions for the improvement of current processes were proposed.
Phase IV: Development of a decision support tool and implementation of the delineated strategies. This phase dealt with the development of the model that measured the company’s current performance [34]. It also included the implementation of strategies that aim to improve flows and materials.
Phase V: Model validation and analysis of the results achieved. The final stage consisted of model validation that essentially compared the model against the real system. An analysis of the results obtained was also undertaken in order to evaluate the feasibility of the implementation of the strategies developed.
4. Analysis and Development of the Decision Support System
The development of knit fabric and damasks includes five sections in the production department: raw material warehouse, production of knits/damasks, finishing, palletizing, and shipping of the finished product. Figure 1 shows the flowchart of the company’s operation, which will allow for a better appreciation of the production environment in each of these areas (see Figure 1).
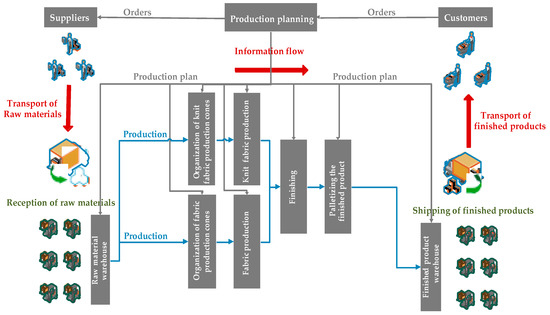
Figure 1.
Flowchart of the internal logistics at the company.
4.1. Problem Formulation
At present, there are bottlenecks in two specific zones: one at the exit of knit pro-duction and the other on entry to the knit and damask inspection area. This is caused by two factors: the first is due to the inadequate flow of materials between the production and finishing zones. The operator of the mesh-opening machine sometimes has to transfer the finished pieces from production in order to process them in his department. Consequently, that operator is often confronted with an inordinate accumulation of pieces, with the rolls of mesh frequently being distributed incorrectly on the trolleys. In the case of the inspection of knits and damasks, the cause lies in the distribution of knits and damasks on each machine. There are three machines used for inspection: one is dedicated to damasks and the other two to knit fabrics. However, when the production of damasks is higher than knits, one of these machines can inspect the damask fabrics. The problem resides in the poor application of this capacity. Besides these two situations, there is a proposal to solve other issues that concern the setup times for the production area of knit fabrics, as well as the time required to transport materials from one workstation to another. The objective is to develop a model based on simulation that will act as a decision support tool and allow for the optimization of the resources allocated. The above-mentioned problems will then be addressed by means of the control of a certain number of entry variables, thus enabling the analysis of different control and assessment options.
4.2. Definition of the Strategies to Be Implemented
To implement the improvement, six strategies were proposed to address the problem at hand. These strategies, along with a description of the objective of each during the course of the simulation model developed, are described below:
- Strategy 0: the current modelThis strategy is used to confirm that the collected data and the simulation model created are in accordance with the real operations at the company.
- Strategy 1: Priority per article typeThis strategy seeks to provide one or more responses to the bottleneck problem at the entry of the mesh-opening procedure. It creates the possibility of simulation, whereby the order of entry is determined by the type of knit fabric. By using a numerical scale, the user selects which type of product has priority over another, and this one is then moved forward. The product being worked in the following sectors and what stage they are currently at must be taken into consideration. For example, if the special finishing machine is currently finishing its process on a fabric, the logical choice for the mesh-opening procedure is to select a knit fabric that usually takes less time to open and thus to enter in the special finishing machine. If we have more time until the entering of fabrics in the special finishing machine, then the choice should drop on the fabrics that are more time consuming on the mesh-opening procedure. This strategy was also adapted for the entry of damask fabrics in the finishing area.
- Strategy 2: priority dependent on the length of the waiting lineSimilar to the strategy above, this approach aims to deal with the problem of the accumulation of knit fabrics near the mesh-opening machine. In this case, priority is defined by the type of knit, which has the greatest number of rolls in this area so that the article can be cleared. This means that instead of randomly selecting a roll of knit fabric, the user will collect several rolls of the same type of knit fabric and then work them all at once, maximizing the use of the mesh-opening machine and the following processes. This strategy can also be adapted to damask fabrics.
- Strategy 3: improvement of material flow at critical pointsStrategy 3 was developed to evaluate a solution for the problem in question. In this case, the strategy is to carry out the integration of a logistics train in the production process of knits and damasks or the implementation of a platform system of mobile cones for the production of knit fabrics, thus enhancing transport times between sections. The aim is to reduce the number of workers. Instead of having one to two people making several journeys between warehouse and production areas (depending on the number of cones needed), only one person makes one journey with a logistics train.
- Strategy 4: crossover between strategies 1 and 3As the name suggests, this strategy seeks to assess the possibilities of combining the strategy of priority per article type with the improvement of material flow at critical points.
- Strategy 5: crossover between strategies 2 and 3By applying the same methodology above, this strategy makes it possible to evaluate a combination of strategies 2 and 3.
4.3. Data Collection and Analysis
Data collection is crucial in any simulation study. After gaining an understanding of general operations at the textile company where the study took place, pertinent data consisting of more than 50 samples each were collected. This process was executed in phases, according to the areas of interest. This information was then analyzed and applied to the simulation model presented. After this stage, the ARENA simulation tool known as the Input Analyzer was employed. From a file containing the collected data, the type of distribution that is most suitable for a specific process can be determined.
4.4. Decision-Making Tool to Enhance Material Flow
The system that supports decision making is presented via a graphical user interface (Figure 2), which is developed through ARENA Visual Basic for Applications (VBA). This enables the user to interact with the model without possessing any knowledge of system modeling as such. Its operation, from the initial parameterization to the selection of strategies, can be interpreted from the flowchart presented in Figure 3. Therefore, this tool allows for the definition of entry variables inherent to each of the company’s sectors, thus representing the way in which it operates. It also enables the selection of the strategy that should be used to present new trial scenarios of the real system.
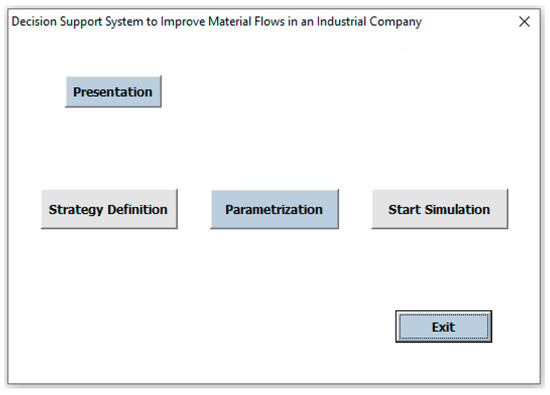
Figure 2.
Graphical user interface—main screen.
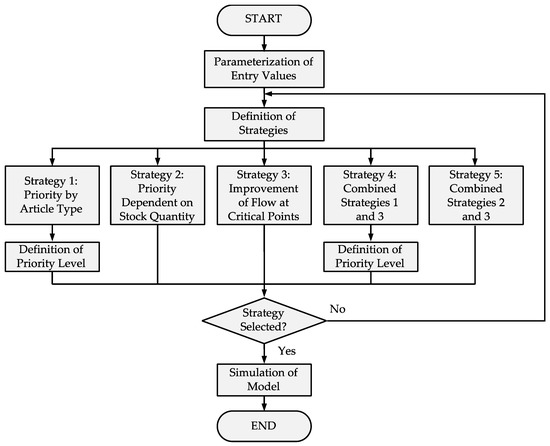
Figure 3.
Information flow for the operation of the graphical user interface.
Figure 4 allows the user to access the area of strategy definition, where a selection is made of the type of strategy. In accordance with the chosen strategy, the user might have to enter specific values, which will then vary the procedure (strategies 1 and 4). For these strategies to be activated, a new window will appear (see Figure 5). This window is used to define the priorities for the knit fabrics (between 1 and 4) and the damask fabrics (between 1 and 3), which must be provided by the user. It should be pointed out that there is a joining of the double-jacquard and high-relief knit fabric types. This ensues from the fact that the production times registered during collection and treatment are rather similar. In addition, the same machine is used for these two types of knits. The same occurs in the case of high-grammage and spacer knit fabrics.
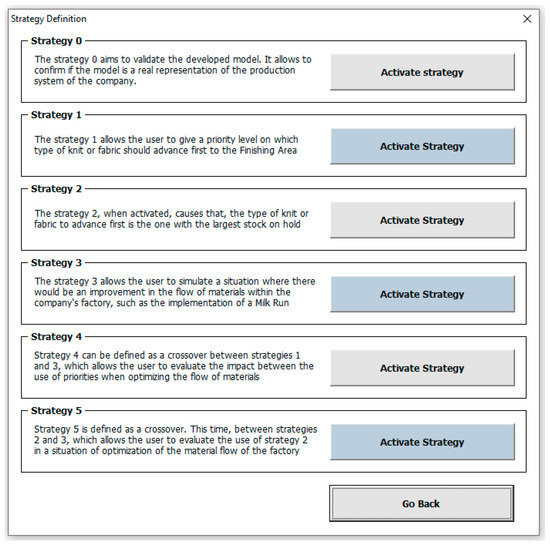
Figure 4.
Graphical user interface—strategy definition.
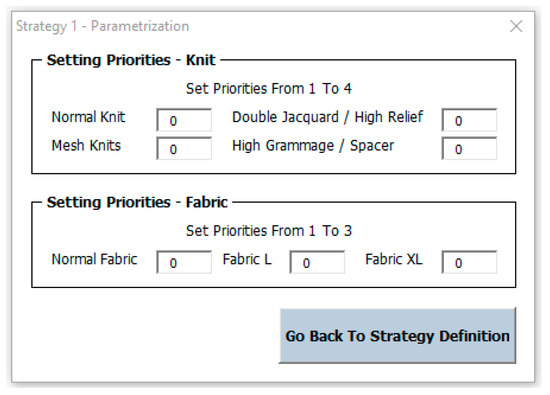
Figure 5.
Graphical user interface (strategy 1—parameterization).
The interface constitutes the apex of the work in question and of the product presented to the end customers. However, the background work consists of a complex development of the simulation model that is based on ARENA software. Thus, by means of the information collected, whether or not it pertains to the flow of materials in the company or the processing times at each workstation, there is subsequent development of a simulation model that seeks to represent the company’s real system. Furthermore, the model also includes strategies that allow for the analysis of potential improvements that might be implemented within the company. Figure 6 demonstrates an animation of the model developed to simplify the factory layout, where the different sections in the company and its connections can be visualized.
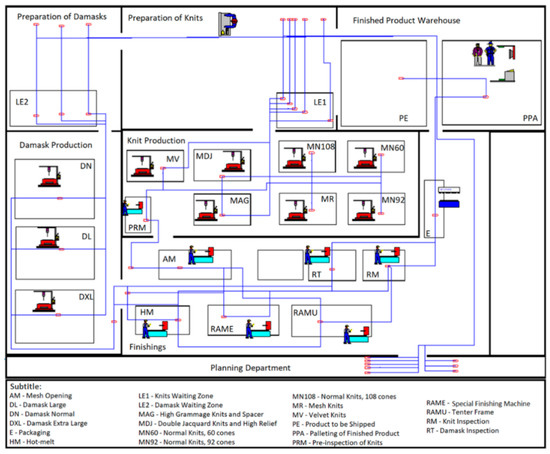
Figure 6.
Animated example of the developed model.
4.5. Model Validation
The validation of the simulation model has proven to be vitally important to the project, since it defines whether or not the model is indeed a true representative of the real system. The starting point of the model validation uses values derived from the real system (in this case, the number of rolls of knit and damask fabrics produced in one week). These were then compared to the values generated by the simulation model, considering the same entry variables. Due to the variability of the real system, the productivity was estimated so that the validation of the program would not be altered. Table 1 indicates the quantity of rolls produced during the company’s current process, as well as the average results obtained through the simulation model after five replications. Table 1 also shows a small variability between the values of the current process and those produced by the simulation model. In the case of knit fabrics, the percentage error is under 1%, while damask fabrics present an error of 6.1%. The simulation models are therefore valid and correspond to a correct representation of the company’s process. As such, they can be used as a decision support tool.

Table 1.
Model validation.
4.6. Analysis of the Results
Figure 7 shows a brief assessment of the five strategies developed. It compares the average production figures relating to each strategy after five replications and subsequently reaches the conclusions derived therefrom.
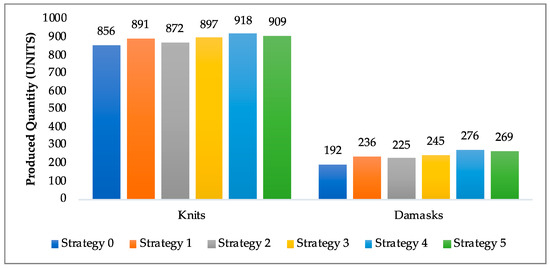
Figure 7.
Comparison between the control strategies.
The first of these conclusions deals with the most striking approach (strategy 4) and alludes to the possibilities of enhancing the impact of each strategy. From the graph, it can be concluded that for the same entry values, any of the strategies used will produce a positive impact on the system. When observed individually (strategies 1, 2, and 3), strategy 3 stands out most, with a production increase of 5% and 28% for the rolls of knit and damask fabrics, respectively. A greater focus is also placed on the improvement or optimization of routing times between processes, as well as other procedures that can be enhanced further, i.e., within the area of knit production. In relation to the crossover strategies (strategies 4 and 5), the first of these produces better results, with an increase of 8% in knit rolls and 44% in damask rolls. The ultimate objective is to establish priorities based on the type of article in order to minimize bottlenecks at the entrance of the finishing area, as well as enhance the reduction of routing and process times to ensure greater speed in the production system as a whole. Experimentation to the model was conducted following the approach to select the most feasible outcome that considered minimization of effort/investment to implement the improvement [35].
Table 2 presents a brief summary of information pertaining to the average performance assessment undertaken after five replications.
Table 2.
Results of the performance assessment undertaken.
5. Conclusions
During the course of this study, a simulation-based decision support tool was developed with the goal to analyze the existing supply processes and propose potential improvements in the different departments of a textile company. The decision support tool included two distinct complementary stages: the development of a simulation model and the construction of a graphical user interface. The latter was undertaken with the participation of staff members of the company so that, by inserting specific entry variables, they will be able to determine the strategy that should be implemented. By means of the analysis of results undertaken in the previous sections, it can be concluded that the use of simulation and the development of control strategies have enabled various possibilities of improvement in the company’s current system and that the strategies can be implemented in the real system. This was demonstrated by the existence of considerable improvements in the system during a specific period of time (seven days), with the indication that strategy 4 would be the most effective for the context at hand. In this strategy, knit and damask production increased by up to 8% and 44%, respectively, and reduced waiting times of 75% were observed on entry into the finishing works area when compared to the company’s existing system. Future work will be focused on further integrating the decision support tool with other production planning systems so as to achieve a better control of the manufacturing lines.
Author Contributions
Conceptualization, V.S. and L.P.F.; methodology, F.J.G.S., B.T., and P.Á.; investigation, V.S., L.P.F., and B.T.; supervision: L.P.F., F.J.G.S., and P.Á.; writing original draft—re-viewing and editing, V.S., L.P.F., F.J.G.S., B.T., and P.Á. All authors have read and agreed to the published version of the manuscript.
Funding
This research received no external funding.
Institutional Review Board Statement
Not applicable.
Informed Consent Statement
Not applicable.
Conflicts of Interest
The authors declare no conflict of interest.
References
- Rashid, A.; Masood, T.; Erkoyuncu, J.A.; Tjahjono, B.; Khan, N.; Shami, M.U.D. Enterprise systems’ life cycle in pursuit of resilient smart factory for emerging aircraft industry: A synthesis of Critical Success Factors’(CSFs), theory, knowledge gaps, and implications. Enterp. Inf. Syst. 2018, 12, 96–136. [Google Scholar] [CrossRef]
- Coimbra, E.A. Total Flow Management: Achieving Excellence with Kaizen and Lean Supply Chains; Kaizen Institute: Scottsdale, AZ, USA, 2009. [Google Scholar]
- Coimbra, E.A. Kaizen in Logistics and Supply Chains; McGraw-Hill Education: New York, NY, USA, 2013. [Google Scholar]
- Graves, R.J.; Konopka, J.M.; Milne, R.J. Literature review of material flow control mechanisms. Prod. Plan. Control 1995, 6, 395–403. [Google Scholar] [CrossRef]
- Reinhardt, H.; Weber, M.; Putz, M. A survey on automatic model generation for material flow simulation in discrete manufacturing. Procedia CIRP 2019, 81, 121–126. [Google Scholar] [CrossRef]
- Mourtzis, D.; Doukas, M.; Bernidaki, D. Simulation in Manufacturing: Review and Challenges. Procedia CIRP 2014, 25, 213–229. [Google Scholar] [CrossRef]
- Peirleitner, A.J.; Altendorfer, K.; Felberbauer, T. Simulation Based Manufacturing System Improvement Focusing on Capacity and MRP Decisions—A Practical Case from Mechanical Engineering. In Proceedings of the 2017 Winter Simulation Conference (WSC), Las Vegas, NV, USA, 3–6 December 2017; pp. 3876–3887. [Google Scholar]
- Duplakova, D.; Duplak, J.; Mital, D.; Soltes, P.; Sukic, E. Analysis of approaches to the material flow in the production process with the use of simulation. J. Soc. Technol. Dev. 2020, 1, 36–44. [Google Scholar]
- Soares, D.; Quaglia, E.J.; Montenegro, H. Material flow simulation for process development at a telecommunication’s factory in the Amazon region. In Proceedings of the 2012 Winter Simulation Conference (WSC), Berlin, Germany, 9–12 December 2012. [Google Scholar]
- Bracht, U.; Masurat, T. The Digital Factory between vision and reality. Comput. Ind. 2005, 56, 325–333. [Google Scholar] [CrossRef]
- Nyemba, W.R.; Mbohwa, C. Modeling, Simulation and Optimization of the Materials Flow of a multi-product assembling plant. Procedia Manuf. 2017, 8, 59–66. [Google Scholar] [CrossRef]
- Muñoz-Villamizar, A.; Velázquez-Martínez, J.C.; Haro, P.; Ferrer, A.; Mariño, R. The environmental impact of fast shipping ecommerce in inbound logistics operations: A case study in Mexico. J. Clean. Prod. 2021, 283, 125400. [Google Scholar] [CrossRef]
- Mittal, A.; Krejci, C.C. A hybrid simulation model of inbound logistics operations in regional food supply systems. In Proceedings of the 2015 Winter Simulation Conference (WSC), Huntington Beach, CA, USA, 6–9 December 2015; pp. 1549–1560. [Google Scholar]
- Liong, C.Y.; Loo, C.S.E. A Simulation Study of Warehouse Loading and Unloading Systems Using ARENA. J. Qual. Meas. Anal. 2009, 5, 45–46. [Google Scholar]
- Bucková, M.; Krajcovic, M.; Edl, M. Computer simulation and optimization of transport distances of order picking processes. TRANSCOM 2017: International scientific conference on sustainable, modern and safe transport. Procedia Eng. 2017, 192, 69–74. [Google Scholar]
- Sebastiani, M.T.; Lüders, R.; Fonseca, K.V.O. Allocation of Charging Stations in an Electric Vehicle Network Using Simulation Optimization. In Proceedings of the 2014 Winter Simulation Conference, Savannah, GA, USA, 7–10 December 2014; pp. 1073–1083. [Google Scholar]
- Opacic, L.; Sowlati, T.; Mobini, M. Design and development of a simulation-based decision support tool to improve the production process at an engineered wood products mill. Int. J. Prod. Econ. 2018, 199, 209–219. [Google Scholar] [CrossRef]
- Viana, H.A.C. Melhoria do Processo de Picagem da Empresa SNA EUROPE Através da Simulação. Master’s Thesis, Instituto Superior de Engenharia do Porto, Porto, Portugal, 2017. (In Portuguese). [Google Scholar]
- Balan, S. Using simulation for process reengineering in refractory ceramics manufacturing—A case study. Int. J. Adv. Manuf. Technol. 2017, 93, 1761–1770. [Google Scholar] [CrossRef]
- Bartkowiak, T.; Pawlewski, P. Reducing Negative Impact of Machine Failures on Performance of Filling and Packaging Production Line—A Simulative Study. In Proceedings of the 2016 Winter Simulation Conference, Washington, DC, USA, 11–14 December 2016; pp. 2912–2923. [Google Scholar]
- Ferreira, L.P.; Gómez, E.A.; Lourido, G.P.; Salgado, M.; Quintas, J.D. Analysis on the Influence of the Number of Pallets Circulating on an Automobile Closed-Loops Assembly Line. (IJAEST) Int. J. Adv. Eng. Sci. Technol. 2011, 2, 119–123. [Google Scholar]
- Ladbrook, J.; Tjahjono, B.; de Sanabria Sales, R.R.; De Rueda, A.G.; Lizarazu, U.; Temple, C. Simulation study for investment decisions on the EcoBoost camshaft machining line. Proc. Inst. Mech. Eng. Part B J. Eng. Manuf. 2011, 225, 2124–2137. [Google Scholar] [CrossRef]
- Ferreira, L.P.; Gómez, E.A.; Lourido, G.P.; Lázaro, A.R.; Pérez, C.J.L.; Tjahjono, B. Simulation of a Closed-Loops Assembly Line. Key Eng. Mater. 2012, 502, 127–132. [Google Scholar] [CrossRef]
- Carillo, M.; Cordasco, G.; Serrapica, F.; Scarano, V.; Spagnuolo, C.; Szufel, P. Distributed simulation optimization and parameter exploration framework for the cloud. Simul. Model. Pract. Theory 2017, 83, 108–123. [Google Scholar] [CrossRef]
- Ferreira, L.P.; Gómez, E.A.; Lourido, G.P.; Tjahjono, B. Optimization of a Multiphase Multiproduct Production Line based on Virtual Cells. In Proceedings of the World Congress on Engineering (WCE 2011), London, UK, 6–8 July 2011; pp. 616–621. [Google Scholar]
- Benedettini, O.; Tjahjono, B. Towards an improved tool to facilitate simulation modeling of complex manufacturing systems. Int. J. Adv. Manuf. Technol. 2008, 43, 191–199. [Google Scholar] [CrossRef]
- Ferreira, L.P.; Ares Gómez, E.; Lourido, G.C.P.; Diéguez Quintas, J.; Tjahjono, B. Analysis and optimisation of a network of closed-loop using simulation. Int. J. Adv. Manuf. Technol. 2011, 59, 351–366. [Google Scholar] [CrossRef]
- Ingalls, R.G.; White, K.P., Jr. The Basics of Simulation. In Proceedings of the 2017 Winter Simulation Conference, Las Vegas, NV, USA, 3–6 December 2017; pp. 505–519. [Google Scholar]
- Jian, N.; Henderson, S.G. An Introduction to Simulation Optimization. In Proceedings of the 2015 Winter Simulation Conference, Huntington Beach, CA, USA, 6–9 December 2015; pp. 1780–1794. [Google Scholar]
- Pasupathy, R.; Nagaraj, K. Modeling Dependence in Simulation Input: The Case for Copulas. In Proceedings of the 2015 Winter Simulation Conference, Huntington Beach, CA, USA, 6–9 December 2015; pp. 1850–1864. [Google Scholar]
- Carson, J.S., II. Introduction to Modeling and Simulation. In Proceedings of the 2005 Winter Simulation Conference, Orlando, FL, USA, 4–7 December 2005; pp. 16–23. [Google Scholar]
- Ferreira, L.P. Geração Automática de Modelos de Simulação de uma Linha de Produção na Indústria Eletrónica. Master’s Thesis, Escola de Engenharia da Universidade do Minho, Braga, Portugal, 2003. (In Portuguese). [Google Scholar]
- Ferreira, L.P.; Gómez, E.A.; Lourido, G.P.; Tjahjono, B. Modeling a complex production line using virtual cells. In Electrical Engineering and Intelligent Systems; Springer: New York, NY, USA, 2013; pp. 361–373. [Google Scholar]
- Moreira, M.; Tjahjono, B. Applying performance measures to support decision-making in supply chain operations: A case of beverage industry. Int. J. Prod. Res. 2016, 54, 2345–2365. [Google Scholar] [CrossRef]
- Tjahjono, B.; Fernández, R. Practical approach to experimentation in a simulation study. In Proceedings of the 2008 Winter Simulation Conference (WSC), Miami, FL, USA, 7–10 December 2008; pp. 1981–1988. [Google Scholar]


Publisher’s Note: MDPI stays neutral with regard to jurisdictional claims in published maps and institutional affiliations. |
© 2021 by the authors. Licensee MDPI, Basel, Switzerland. This article is an open access article distributed under the terms and conditions of the Creative Commons Attribution (CC BY) license (http://creativecommons.org/licenses/by/4.0/).