Article

The Effect of Air Quality and Weather on the Chinese Stock: Evidence from Shenzhen Stock Exchange

1
Division of Chinese Foreign Affairs and Commerce, Hankuk University of Foreign Studies, Seoul 02450, Korea
2
Department of Economics, University of Pretoria, Pretoria 0002, South Africa
3
Indian Institute of Management Lucknow, Prabandh Nagar off Sitapur Road, Lucknow 226013, Uttar Pradesh, India
4
Department of Economics, Pusan National University, Busan 46241, Korea
*
Author to whom correspondence should be addressed.
Sustainability 2021, 13(5), 2931; https://doi.org/10.3390/su13052931
Submission received: 12 December 2020 / Revised: 3 March 2021 / Accepted: 4 March 2021 / Published: 8 March 2021
(This article belongs to the Special Issue Green Finance, ESG and Financial Risk Management)

Abstract

:
We investigated the impact of air quality and weather on the equity returns of the Shenzhen Exchange. To capture the air quality and weather effects, we used dummy variables created by employing a moving average and moving standard deviation. The important results are as follows. First, in the whole sample period (2005–2019), we find that high air pollution and extremely high temperature have significant and negative influence on the equity returns. In the sub-period I (2005–2012), the 11-day model and 31-day model show that high air pollution have significant and negative impacts on the Shenzhen stock returns. Second, the results of the quantile regression show that high air pollution have significant and negative effects during bullish market phase, and extremely high temperature have significant and negative effects during bearish market phase. This implies that the air quality and weather effects are asymmetric. Third, the weather effect of the abnormal temperature on the stock returns is greater in severe bearish market. Whereas the effect of the air pollution on the stock returns is greater in the bullish market. Fourth, the least squares method underestimates the air quality and weather effects compared to the quantile regression method, suggesting that the quantile regression method is more suitable in analyzing these effects in a very volatile emerging market such as the Shenzhen stock market.

1. Introduction

Recently, China has experienced serious air pollution problems. Chinese residents’ material and cultural living standards are increasing day by day, and people are increasingly concerned about and sensitive to the air quality problems that depend on them. The air quality and its changes will trigger and affect people’s psychology and behavior in an in-depth and comprehensive manner [1]. Regarding behavioral finance, investors in Chinese stock market are interested in the air quality and weather impact on equity returns. More concretely, investment decisions of domestic investors can be influenced by local weather conditions in China and, thus, the impact of extreme weather conditions on Chinese stock markets may come to exist.
Some weather variables, such as temperature, sunlight, humidity, and daylight are regarded as collective mood or sentiment proxies for many investors and are known to be significantly connected with movement of equity returns. For instance, by employing the degree of cloud cover in New York City as the proxy of trader mood, Saunders [2] discovered that the amount of sunshine (or cloud cover) is significantly linked to the U.S. stock market returns. Following this pioneering research, Hirshleifer and Shumway [3] revealed similar evidence using the data of 26 countries and regions. Chang et al. [4] further found a significant and negative linkage between cloud cover and investors’ behavior.
Yoon and Kang [5] investigated connectedness between returns of the Korean stock market and the weather conditions of cloud cover, humidity, and temperature. They attempted to determine these relationships using a moving average and moving standard deviation (MA-MSD) method and found that market structural changes resulting from the 1997 Asian financial crisis reduced the existence of a weather effect. Jiang et al. [6] investigated the influence of extreme weather conditions on the equity returns of the Shenzhen and Hong Kong markets. For the weather conditions, the study incorporated dummy variables created by employing a MA-MSD method. The study found that extreme weather conditions have a significant influence on the equity returns of the Shenzhen market, implying that the stock market is not informationally efficient. The study also found that, during the pre-QFII (Qualified Foreign Institutional Investor) program, extreme weather conditions have a strong influence on the equity returns of the Shenzhen market, however the effect is significant but weaker after the QFII program. This result indicates that the informational efficiency of the Shenzhen market has significantly enhanced after the QFII program due to the market openness to foreign institutional investors.
Some studies explored the impact of cognitive perception of environmental problems on Chinese equity market. For instance, Li and Peng [7] explored the impact on equity returns of depressed moods caused by air pollution. They revealed a linkage from air pollution levels to equity returns. The evidence indicates that air pollution is a behavioral factor with some linkage to equity returns in China.
Our study aims to investigate the impact of air quality and extreme weather conditions on the returns of Shenzhen stock market indices, Shenzhen Component Index (SZI), which is a representative index of the Shenzhen Stock Exchange. For this purpose, we use the daily index of air quality (AQI), and the weather variable (sunshine, humidity, and temperature) from January 2005 to June 2019 (except 2013).
The contributions of this study are as follows. First, most empirical studies on weather effect or air pollution effect analyzed the data of Shanghai exchange. Whereas the study using the data of Shenzhen exchange is very rare, although the Shenzhen exchange is 7th biggest stock exchange in the world (the Shanghai exchange is 4th biggest exchange) by market capitalization measured in US dollar. We focus to uncover the existence of weather effect or air pollution effect in the Shenzhen exchange. Although, in the mainland stock markets, the Shanghai stock market is well known as the market representing the Chinese stock market, the Shenzhen stock market has its own multi-tier capital market characteristics but is the less known stock market. In light of this situation, we will explain the structure and operation of the Shenzhen stock market in detail, and, based on this, we will look at the impact of investor sentiment on the movement of Shenzhen stock price. Second, unlike previous studies, we identify the variables of air quality and weather conditions using a MA-MSD approach of Yoon and Kang [5]. We conduct empirical analysis in three categories: 11-day/21-day/31-day moving average models. Third, most of the previous studies use the least-squares estimation method, whereas we use the quantile regression method to consider the volatile fluctuation of Shenzhen stock price. The quantile regression method can capture the nonlinearity and asymmetry of the influence of air quality and weather conditions on the movement of the Shenzhen stock price. Fourth, we analyze the volatility effect in addition to the price effect of air quality and weather conditions. The impact of air quality and weather conditions on volatility is important because the Shenzhen stock market is very volatile and displays boom and crash frequently. Fifth, most of the previous studies focus on only one of the weather effect and air quality effect in their analysis. However, we will incorporate these two effects simultaneously in the analysis.
The main findings of our study are as follows. First, in the whole sample period (2005–2019), we find that a p H (extremely high air pollution) and t m H (extremely high temperature) have significant and negative effects on the Shenzhen stock returns. In the sub-period I (2005–2012), the 11-day model and 31-day model show that a p H has have significant and negative influence on the Shenzhen equity returns. Second, the results of the quantile regression show that a p H has have significant and negative effects in the bull market, and t m H has have significant and negative effects in the bear market. This implies that the air quality and weather effects are asymmetric. Third, the more the Shenzhen stock returns drop, the greater the effect of the abnormal temperature is. Whereas the more the Shenzhen stock returns increase, the greater the effect of the abnormal air quality is. Fourth, the least squares method underestimates the air quality and weather effects compared to the quantile regression method, suggesting that the quantile regression method is more suitable in analyzing these effects in very volatile emerging market such as the Shenzhen stock market.
The rest of this paper is organized as follows. Section 2 reviews literature on the impact of weather (air quality) on the equity market. Section 3 presents detailed description Chinese stock markets and statistical characteristics of the markets. Section 4 describes the measurement method of the air quality and weather conditions employing the 11 (21, 31)-days moving averages and standard deviations. Section 5 investigates the results of the linkage between weather (air quality) and Shenzhen stock returns. Finally, Section 6 provides some conclusions.

2. Literature Review

In financial studies, environmental spur such as temperature, daylight, and sunshine are often used as proxy variables for investors’ collective mood/sentiment swings to uncover their influence on the investors’ behavior in the equity market. Saunders [2] and Hirshleifer and Shumway [3] reported that cloud cover negatively influences daily equity returns. Recently, researchers consider more various weather conditions.
There are several empirical studies on weather effect in the Chinese stock market. Among others, Yi and Wang [8] provided evidence of the weather effects (wind and humidity) on the Shanghai Composite Index. Han [9,10] and Han and Wang [11] found a significant influence of weather conditions on the Shanghai and Shenzhen markets. Kang et al. [12] considered the market openness effect of Shanghai B-stock market to domestic investors and compared the weather effect between before and after the stock market openness. The study found a strong weather effect on the B-share returns only after the market openness, implying that the weather effect can be induced from the participation of domestic investors. However, these studies did not analyze air quality effects.
Lepori [1] investigated the data of Italy, U.S., Germany, and Spain, and discovered that air pollution negatively influences equity returns. Levy and Yagil [13] explored the linkage between daily equity returns and air quality index (AQI) levels in the U.S. They revealed that air pollution is negatively linked to equity returns. Levy and Yagil [14] uncovered a similar negative linkage in the Netherlands, Canada, Hong Kong, and Australia.
Many studies in behavior finance have applied the findings from medicine and psychology in research on the association between environmental spur and equity price movement. Some of them considered actual air quality in their analysis, and found that in some developed countries, poor air quality causes negative emotional responses and then negatively influences equity returns. For example, Levy and Yagil [13] found that air pollution renders negative moods and risk-aversion behaviors among investors, leading to a negative linkage between air pollution and equity returns. This finding indicates that in the U.S., air pollution near the areas where stock exchanges are located negatively correlates with equity returns. However, Lepori [15] confirmed that this negative linkage only exists when stock exchange facilities use trading floor technology.
Recently, Chinese scholars have actively conducted the research on this issue and reported several results. For example, Guo and Zhang [16] found that air quality may influence equity market participants and ultimately affect equity returns through the channels of emotion, policy and expectation. This study empirically analyzed whether air quality affects stock market by using the data of Shanghai air quality index and Shanghai stock index and the multivariate progressive methods. They found that the air quality has influences on the equity returns, turnover rate and volatility, suggesting that the emotion and other channels of the air quality’s effect on stock market exist. Li and Peng [7] investigated the effect on Chinese stock returns of depressed moods induced by air pollution. They found that a contemporaneous negative and a two-day lagged positive relationship exists between air pollution levels and stock returns. They concluded that air pollution is a behavioral factor linked to stock returns in China. Wu et al. [17] explored the linkage between air pollution and equity prices of locally headquartered firms in China. They found that severe air pollution leads to low returns and volatility. They also found that the relationship between air pollution and local firms’ performance is insignificant, meaning that the influence of air pollution can be accounted for investor mood bias rather than economic factors.
Dong et al. [18] found a negative relation between air pollution during corporate site visits by investment analysts and subsequent earnings forecasts. The study examines data obtained from site visit disclosures and analysts’ reports on the firm. Thus, the study focuses the effect of the air pollution of a firm’s location on the analysts’ forecasting bias and does not consider the effect of the local AQI of stock exchange on investor’s sentiment and stock returns. Li et al. [19] investigated whether air pollution can intensify the cognitive bias using data of the Chinese mutual fund markets in 247 cities and found that air pollution significantly increases investors’ disposition effects. Ding et al. [20] investigated the effect of the local AQI on stock returns and found a negative relation between air pollution and a firm’s stock return. Interestingly, the study assumes that stock returns of a firm is affected by the corporate core business activities and does not consider the demand and supply in the stock market. In this regard, the study uses a firm’s headquarters as a proxy for the firm’s location, and do not consider the location of stock exchange. Wu and Lu [21] explored how the individual investor mood affects stock pricing in the Chinese stock market by a firm-level index for measuring the mood of individual investors induced by air pollution. The study focuses on firms headquartered in 34 major Chinese cities, not stock market where the investors are trading. Similarly, Wu et al. [22] investigated how the moods of open-end fund managers affect stock returns by using a firm-level measure of fund-manager mood induced by local air pollution. The results show that a depressed fund-manager mood significantly decreases the returns of funds located in 34 major Chinese cities.
He and Liu [23] considered the effects of public perception of environment on the price movement in the Chinese equity market. The study showed that public environmental perception negatively affects trading activities in equity market. All these studies demonstrate that both air quality and perception of environmental problems can affect investor behavior and equity price movement. Xu et al. [24] examined whether air pollution trigger collective mood swings and influence investment decisions. From empirical analysis, they found few and inconsistent results regarding the relationship between air pollution and stock returns and claimed that public awareness may be a missing key, which is playing an intermediate role in the link between air pollution and stock returns.
As shown above, all previous studies focus on only one of the weather effect and air quality effect in their analysis. However, we will incorporate these two effects simultaneously in the analysis. Most previous studies use least squares method, whereas we use the quantile regression method to capture the nonlinearity and asymmetry in the relationship of a very volatile market.

3. Overviews of Chinese Stock Markets

3.1. Overviews of Mainland and Hong Kong Stock Markets

Table 1 briefly displays the key statistics of Hong Kong and mainland stock markets. The Hong Kong Exchange is one of the global financial centers, and its exchanges and clearing houses supply a wide range of financial service to investors, private firms, and financial intermediaries. After 29 years of rapid development, the two mainland exchanges (Shanghai and Shenzhen) have grown into a comprehensive, open, and service-oriented exchange. The Shanghai and Shenzhen stock markets have rapidly developed both in the size and the number of investors, making the exchanges one of the most representative emerging financial markets.
Chinese firms can be listed on H-Shares in the Hong Kong market and on A-Shares in the mainland market through IPOs. The Hong Kong equity market is strategically set as a regional financial center to finance many Asian and multinational corporations. The Shenzhen-Hong Kong Stock Connect, QFII and Renminbi QFII (RQFII) programs are channels through which global investors can invest in the Chinese capital market. Although the programs share many similarities, these three channels have differences as well (For more details on the difference among the three channels, see the below webpage. http://www.szse.cn/enSzhk/introduction/cscqr/index.html (accessed on 31 July 2020)).

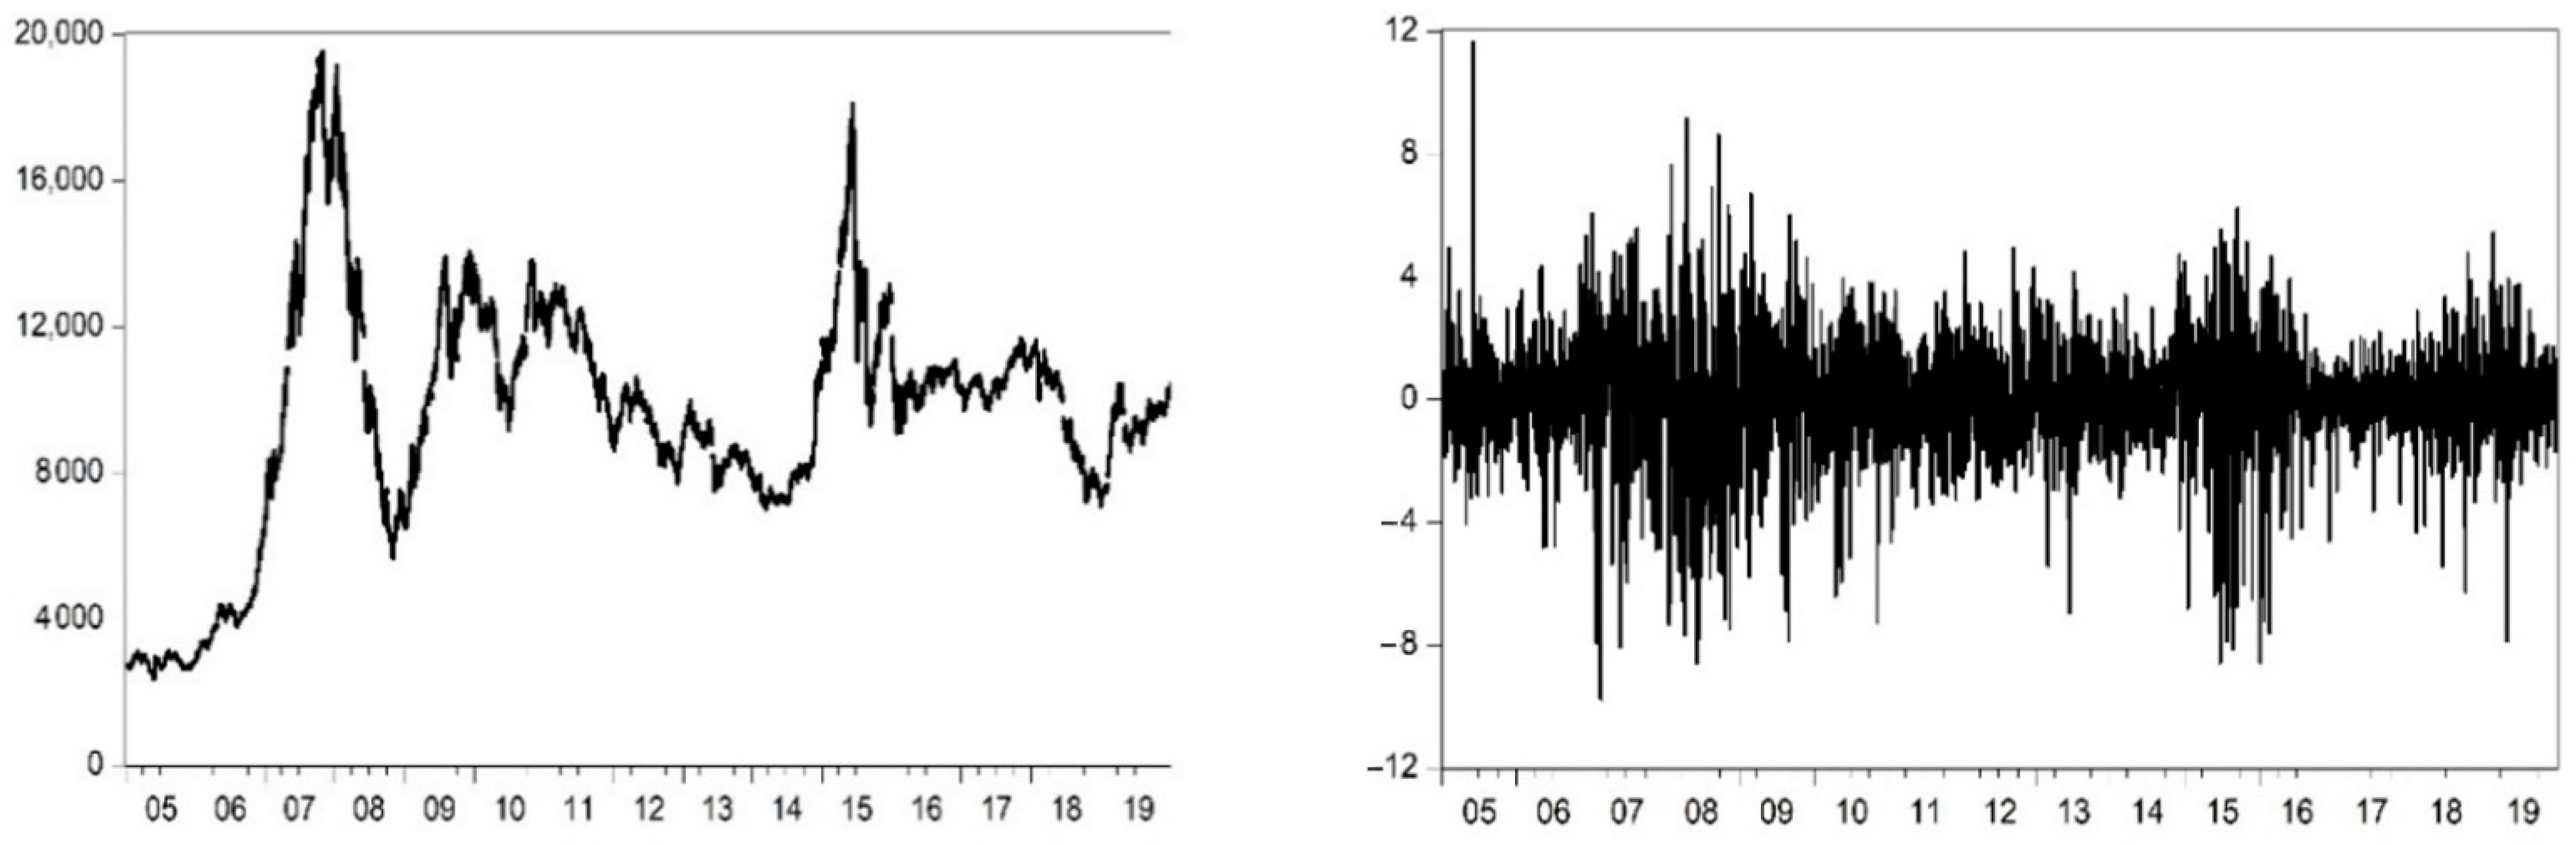
3.2. Overview of Shenzhen Stock Markets

This study focuses the Shenzhen stock market. As displayed in Table 1, the Shenzhen Stock Exchange (SZSE) has two major sub-markets: the A-share (A-shares, or RMB-denominated common shares, which refers to ordinary shares issued by companies which are incorporated and listed in mainland Chinese stock market, and subscribed and traded in RMB), and the B-share (B-shares refer to RMB-denominated special shares subscribed and traded in foreign currencies. B-shares are foreign investment shares listed and traded in mainland Chinese exchanges). As of December 2019, the SZSE has 2195 listed firms with a combined market capitalization of RMB 23,689 billion in A-share market.
The SZSE is established for developing China’s multi-tiered capital market system, serving national economic development and transformation, and supporting the national strategy of independent innovation. The Small and Medium Enterprise (SME) Board was inaugurated in May 2004. The ChiNext market was launched in October 2009. Thus, the SZSE has basically been started in a framework of multi-tiered capital market incorporating the Main Board, SME Board, and the ChiNext market. Table 2 summarizes the listed securities in the SZSE. The subsidiary markets of SZSE are as follows.
Main Board: The Main Board evolved and grew along with the shareholding system reform in state-owned-enterprises (SOEs) and in response to SOE development. The SZSE Main Board market has raised RMB 881 billion (USD 139.8 billion) and has become a vital financing channel for major firms.
SME Board: The Small and Medium Enterprise (SME) Board, which was found in June 2004, offers services for small and medium enterprises listing. It is an important component of Shenzhen multi-tier capital market system. The SME Board highlights its role in supporting independent innovation.
ChiNext: The ChiNext market was launched in the SZSE on 23 October 2009. It offers a new capital platform tailor-made for the needs of enterprises engaged in independent innovation and other growing venture enterprises. The ChiNext market promotes allocation of social funds to innovative businesses and emerging industries.
B-shares: The B-shares refer to the RMB-denominated special shares with their par values marked in RMB in their circulation. The trading of B-shares was launched in 1992, giving foreign investors the access to Chinese equity market. Now, domestic investors can also invest in the B-shares using foreign currencies.
Table 3 shows the composition of investors in the Shenzhen stock market. As shown in this table, during 2011 to 2018, number of individual investors increased 2.7 times, while number of institutional investors increased 1.9 times. As of 2018, individual investors are 430 times larger than institutional investors. Local individual investors dominate more than 80% of the market. The number of foreign investors is relatively very small.
Chinese stock market is known to be speculative. The stock market was established in 1991. In the beginning, there were only individual investors. Many individual investors did not care about the quality of the business, but only concerned about the rise and fall of the stock price. As a result, speculation was rampant in the early Chinese equity market. In Table 3, we can find that there are many individual investors in Chinese market, and the rate of increase is also speedy. In contrast, there are few institutional investors. Since 1998, the market has learned from foreign experiences and introduced investment funds. The result is that many funds not only speculate but also operate to manipulate the market price of stocks [26].
For example, as is well known, the formation of the NYSE stock price is mainly based on market maker quotations. Given the concentration of the world’s top financial institutions and investors in the Manhattan area of New York, the office locations of these market makers are also concentrated near Lower Manhattan. Therefore, it is easy to understand how the bidding behavior of the market makers is influenced by the weather in Manhattan. For another stock price formation mechanism, the order-driven trading system, there is still a lack of research on the linkage between weather and equity trading. The establishment of a stock exchange in the mainland of China is relatively late. Since its establishment, it has fully adopted an electronic order-driven trading system. There are no market makers, and investors enter all trading quotes through brokers into the matching system of the exchange.
Due to the regional nature of air quality, the direct impact of air quality on investor sentiment is mainly limited to local investors, especially individual investors. Of course, air pollution may also impact the stock market by influencing the mood/sentiment of stock traders.
At present, the two major stock exchanges in mainland China adopt the order-driven system rather than the quote-driven system (or market-maker system). All are buying and selling quotations are entered into the matching system of the exchange by investors through agent brokers. As a trader of an order trading system operator, when their emotions are influenced by local air pollution, they may also reduce their due rational judgment and choice ability to make irrational trading behaviors and cause fluctuations in stock prices.
Table 4 shows the trading volume ranking of cities where the securities are traded. As shown in this table, the top 8 cities are Shanghai 30,224 Billion yuan, accounting for 14.99% of total trading volume; Shenzhen 23,309 Billion Yuan, accounting for 11.56% of the transactions; Beijing 16,275 Billion yuan, accounting for 8.07%; Guangdong 9328 Billion yuan, accounting for 4.62%; Guangzhou 8111 Billion yuan, accounting for 4.02%. Additionally, foreign investors accounted for 2.36%. Shenzhen, Guangdong, and Guangzhou account for 20% of the transactions, which provides a basis for us to study whether the weather and air quality index impact the order-driven stock trading behavior. As the proportion of local individual investors in the Shenzhen equity market is very high, the market is supposed to be sensitive to local air quality and weather conditions near the Exchange.

3.3. Summary Statistics of Sample Returns

For the empirical analysis, we utilize the daily returns of Shenzhen Stock Exchange. The stock market indices employed are the Shenzhen Component Index (SZI), which is the most popular market index to represent the performance of the Shenzhen exchange. The SZI data is obtained from Infomax database. Daily returns were calculated as r t = ln ( P t / P t 1 ) × 100 , where P t is the current index and P t 1 is the previous day’s index.
Figure 1 displays the movements of daily price and return series of SZI. The return series show volatility clustering. Table 5 shows the summary statistics of SZI returns. As represented in the table, the value of the Jarque-Bera test statistic demonstrates that the sample returns are not normally distributed. Results of two unit root tests (ADF and PP tests) show that the Shenzhen stock returns are stationary series.
The 30 years of economic prosperity have brought severe environmental degradation to China, most notably poor air quality. There are two reasons for this result. First, perception of air pollution has soared in China since 2009 (Around the middle of 2009, the U.S. Embassy started to monitor the level of PM2.5 in Beijing and Shanghai and posted the automated air quality measurements on Twitter every day [7]). The second reason is that in February 2012, the State Council of China first requested local governments to publish PM2.5 level (The term PM (particulate matter) indicates the pollutant that could most possibly causing disease and death to humans. PM2.5 refers to tiny particles or droplets in the air that are two- and one-half microns or less in width). After that, the terms of haze and PM2.5 have frequently emerged on various media, and air pollution has attracted a major concern [28]. The daily data of air pollution were collected from the website of the Ministry of Environmental Protection of China (https://datacenter.mee.gov.cn (accessed on 13 February 2020)) and covers the period from January 2005 to December 2019.
The air quality index (AQI) offers information on the degree of local air pollution and focuses on health issue that people may experience after exposure unhealthy air. The larger the AQI value, the higher the air pollution level and the greater the threat to health. Notably, since 2013, the AQI has been widely used in China instead of the original air pollution index (API) (The 2013 data of the API and the AQI were not published). For convenience of discussion, we refer to both the AQI and the API as the AQI in the following sections. We divide the whole sample period (2005–2019) into two sub-periods in the analysis: sub-period I (2005–2012) and sub-period II (2014–2019).
Daily data of weather conditions were used: temperature (TEMP), humidity (HUMI), and Sunshine (SUNSH). The data series were obtained from the Hong Kong Observatory (http://www.weather.gov.hk/ (accessed on 13 February 2020). The weather in Hong Kong and Shenzhen is very similar, because the two regions are in fact the same area. In this region, the weather is very hot, humid, and rainy in summer, while relative mild and humid in winter). Temperature is measured in terms of Celsius degrees; humidity in terms of relative humidity (the percentage of moisture contained in the air); sunshine in terms of the hours of sunshine duration. Table 6 displays the descriptive statistics of the AQI and weather condition variables. The empirical analysis of this study is divided into three cases by the length for moving average. For that reason, there are three data sets that should be measured.

4. Methodology

4.1. Weather Variables

To investigate the influence of air quality and weather conditions on the Shenzhen equity market, the air quality and three weather conditions considered were changed into dummy variables because they are prone to seasonal factors. For instance, in Shenzhen area, 14 °C in winter is relatively warm, but the same temperature in summer is felt relatively cold. Thus, use of raw weather data may result in seasonal bias in the measurement of the effect of weather on equity returns. To relieve the seasonal bias, following Yoon and Kang [5], we generated weather dummy variables employing moving averages (MA) and moving standard deviations (MSD). Concretely, we employed the following the 11-day (21-day; 31-day) MA and MSD method (See Yoon and Kang [5] for the case of the 21-day method, and Kang et al. [12] for the case of the 31-day method. See Jiang et al. [6] for the case of the 11-day method. Our study uses all these three methods):
M A t = 1 11 i = 5 5 V t + i
M S D t = 1 10 i = 5 5 { V t + i M A t } 2
M A t = 1 21 i = 10 10 V t + i
M S D t = 1 20 i = 10 10 { V t + i M A t } 2
M A t = 1 31 i = 15 15 V t + i
M S D t = 1 30 i = 15 15 { V t + i M A t } 2
where V t is the values of air quality and three weather variables—AQI, TEMP, HUMI, and SUNSH—at day t . Since extreme weather (or air quality) conditions are supposed to be more likely to substantially augment the weather (or air quality) effects on equity returns than normal conditions, two dummy variables using each raw variable were generated as follows:
If   V t < ( M A t M S D t ) ,   then   V L = 1 ;   otherwise ,   V L = 0 , If   V t > ( M A t M S D t ) ,   then   V H = 1 ;   otherwise ,   V H = 0 ,
where V L represents a dummy variable for extremely below-average weather (or air quality) and V H for extremely above-average weather (or air quality). The air quality and weather dummies considered in this study are summarized in Table 7.

4.2. Estimation Model

Using the air quality and weather dummies created by the MA-MSD method, we estimated the below model for analyzing the impact of air quality and weather conditions on equity returns:
R t = μ 0 + μ 1 a p L + μ 2 a p H + μ 3 t m L + μ 4 t m H + μ 5 h m L + μ 6 h m H + μ 7 s n L + μ 8 s n H + θ J a n u a r y + φ M o n d a y + ε t
where R t represents the returns of the Shenzhen market; μ i represents the coefficients of air quality and weather dummies (The calculated values of correlation among air quality variables and weather dummies are very low, and thus there is no multicollinearity problem in the estimation. We also considered several interaction variables between the air quality and weather condition variables as regressors in our estimation models, and found all the interaction variables are not statistically significant. We did not report the estimation results of these extended models to save the space);   J a n u a r y and M o n d a y represent the dummies for January and Monday effects, respectively. Additionally, we took into account the nonlinear problem of time varying heteroskedasticity in the error of the above model by employing the following GARCH (1,1) model:
h t = ω + α ε t 1 2 + β h t 1 ,   ε t = z t σ t ,   z t ~ N ( 0 , 1 ) ,
where ε t represents an independent time series with a zero mean and an unconditional variance, σ t 2 , and h t represents the conditional variance. All parameters ( ω ,   α , and β ) are supposed to be positive for non-negativity of variance, and the sum of ( α + β ) indicates the degree of persistence of shocks to volatility. The GARCH (1,1) model can capture the feature of volatility clustering in the return dynamics of Shenzhen stock market.
Since proposed by Koenker and Bassett [29], the quantile regression method has been developed as a very important research tool in applied economics due to its advantages of offering detailed information about the conditional distribution of dependent variable and allowing nonlinearity and asymmetry in the causal relationship.
For quantile regression, Equation (8) is transformed into the following form:
Q τ ( R t ) = μ 0 + μ 1 τ a p L + μ 2 τ a p H + μ 3 τ t m L + μ 4 τ t m H + μ 5 τ h m L + μ 6 τ h m H + μ 7 τ s n L + μ 8 τ s n H + θ τ J a n + φ τ M o n + ε t
where μ i τ   ( i = 1 ,   2 , ,   8 ) represents the parameters that needs to be estimated, τ represents the quantile point, and Q represents the quantile regression estimate. High quantile implies bull market, while low quantile implies bear market. We will compare the results between the high and low quantiles.

5. Empirical Results

5.1. Effects of Air Quality and Weather Conditions

Table 8 displays the impact of extreme air quality and weather conditions on the SZI returns employing the 11-day MA-MSD method. As shown in this table, the estimates of parameters ( ω , α and β ) in the GARCH model are positive and ( α + β ) < 1 , indicating that the non-negativity restriction and stationarity in the conditional variances hold, respectively. Furthermore, the estimates of January effect ( J a n u a r y ) and Monday effect ( M o n d a y ) are not significant, meaning no market anomaly, such as calendar effects, in the Shenzhen market.
As shown in this table, for the whole sample period, we can see the estimated value of the a p H variable is negative and significant. We also find that the estimate of the a p H is even more significant (with greater estimate and higher t -value) in case of the sub-period I (2005–2012). These results imply that equity returns decrease when air pollution increases, consistent with the view that investors who are affected by air pollution have less demand on equity market and, hence, depress current equity prices and returns. However, a significant linkage between air quality and returns is not exhibited during the second sub-period II (2014–2019).
Table 9 (Table 10) demonstrates the impact of air quality and weather on the SZI returns using the 21-day (31-day) MA-MSD method. As displayed in these table, the estimates of parameters ( ω , α , and β ) in the GARCH model are positive and ( α + β ) < 1 . Thus, we can confirm that the non-negativity restriction and stationarity in the conditional variances hold. As well, we cannot find any calendar effects, J a n u a r y and M o n d a y , in both models.
As shown in Table 9, the weather variable of extremely high temperature ( t m H ) is statistically significant in the whole sample period case, providing evidence for the existence of weather effect. Although the temperature is usually high in Shenzhen, extremely high temperature can make investors feel unpleasant and their investment sentiment negatively. Thus, extremely high temperature leads to negative impacts on Shenzhen stock returns, as supposed. As summarized in Table 10, the test results using the 31-day MA-MSD method are similar to the results from the 11-day MA-MSD method. The high air pollution has significantly negative impact on the equity returns in sub-period I.
The test results of Table 8, Table 9 and Table 10 are represented in Table 11. As displayed in this table, the estimate of a p H is significantly negative in several cases: whole period and sub-period I using the 11-day MA-MSD method, and sub-period I using the 31-day MA-MSD method. These results suggest evidence of air quality effect, implying high air pollution has negative effect on the returns of Shenzhen market. The estimate of t m H is significantly negative in case of whole period, implying that extremely high temperature has negative impact on the stock returns in the market. However, we cannot find these effects in the sub-period. Overall, from this table, we can conclude that there are air quality and weather effects in the Shenzhen market.
These findings reveal that domestic investors are influenced in their investment decision by local air quality and temperature in a certain period. Investor sentiment is influenced by various factors, such as air quality, weather conditions, and stock market ups and downs, etc. In a theoretical point of view, if the efficient market hypothesis of Fama [30] holds, these factors should not affect investors’ decisions. However, as investors in Chinese (Shenzhen) market are mainly individual investors, these individual investors are more affected by sentiment than institutional investors. We think that the anomaly of air quality and weather effects is because of the trader composition of the Shenzhen stock market.

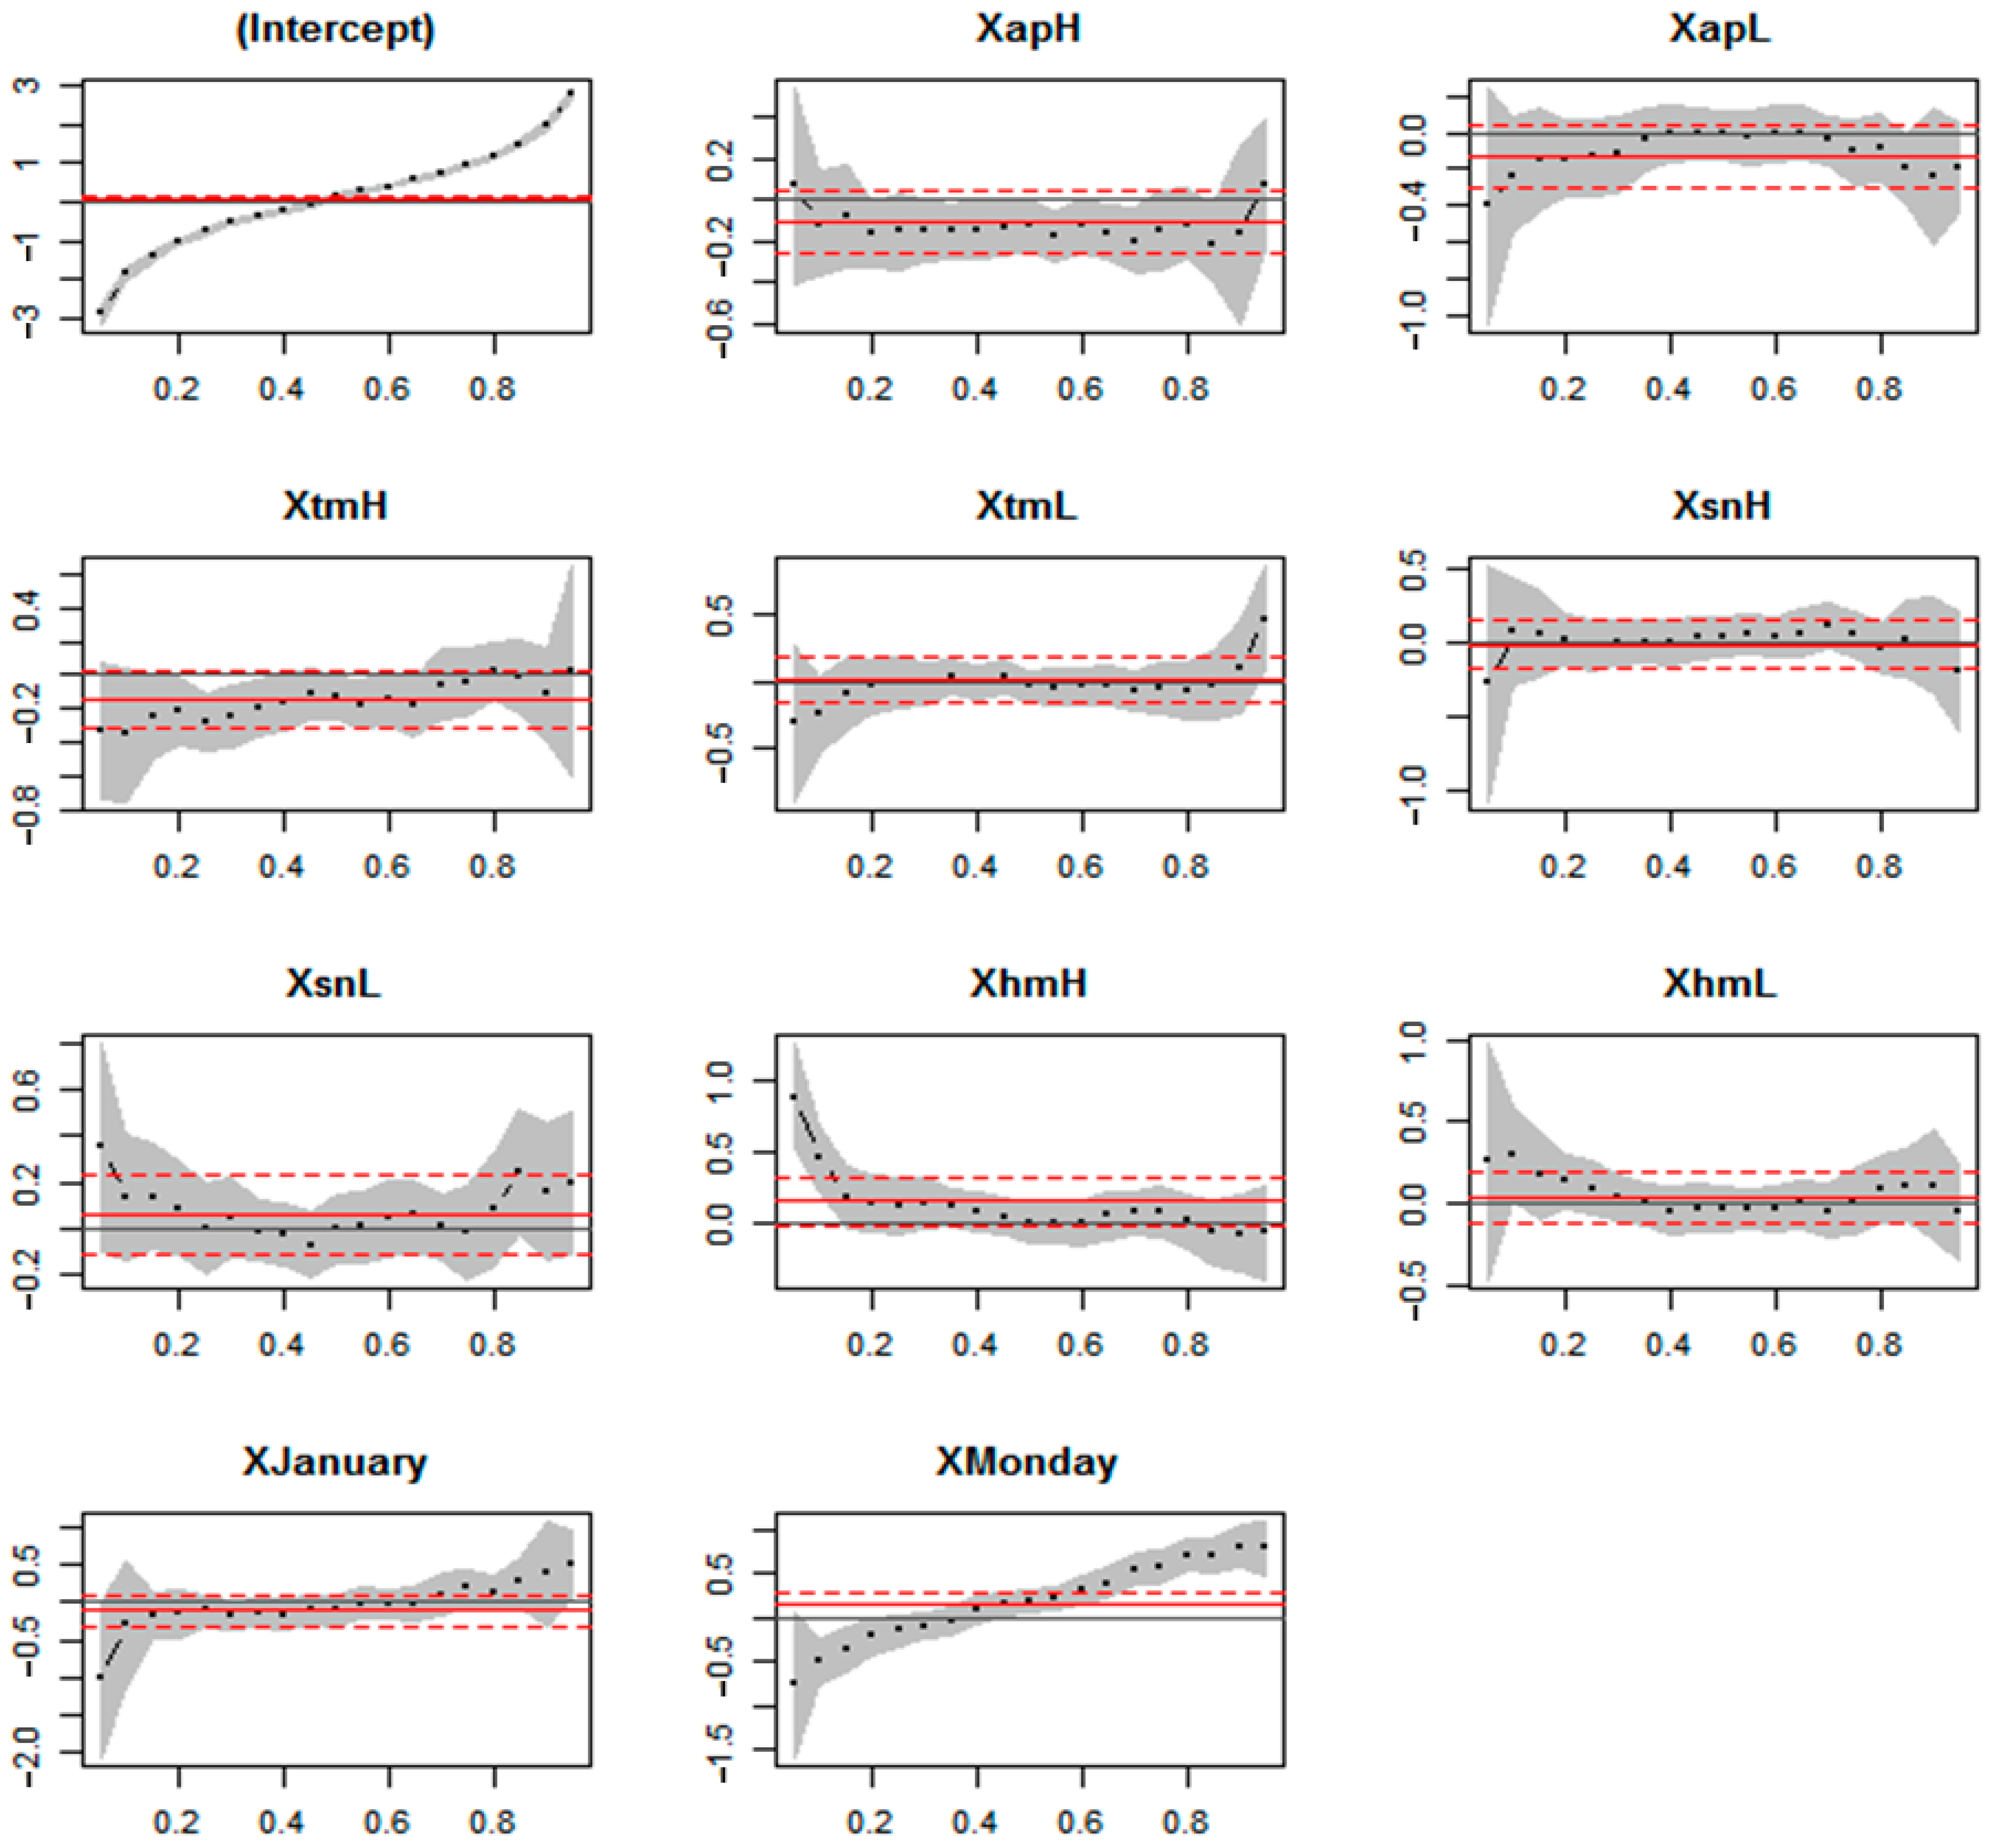
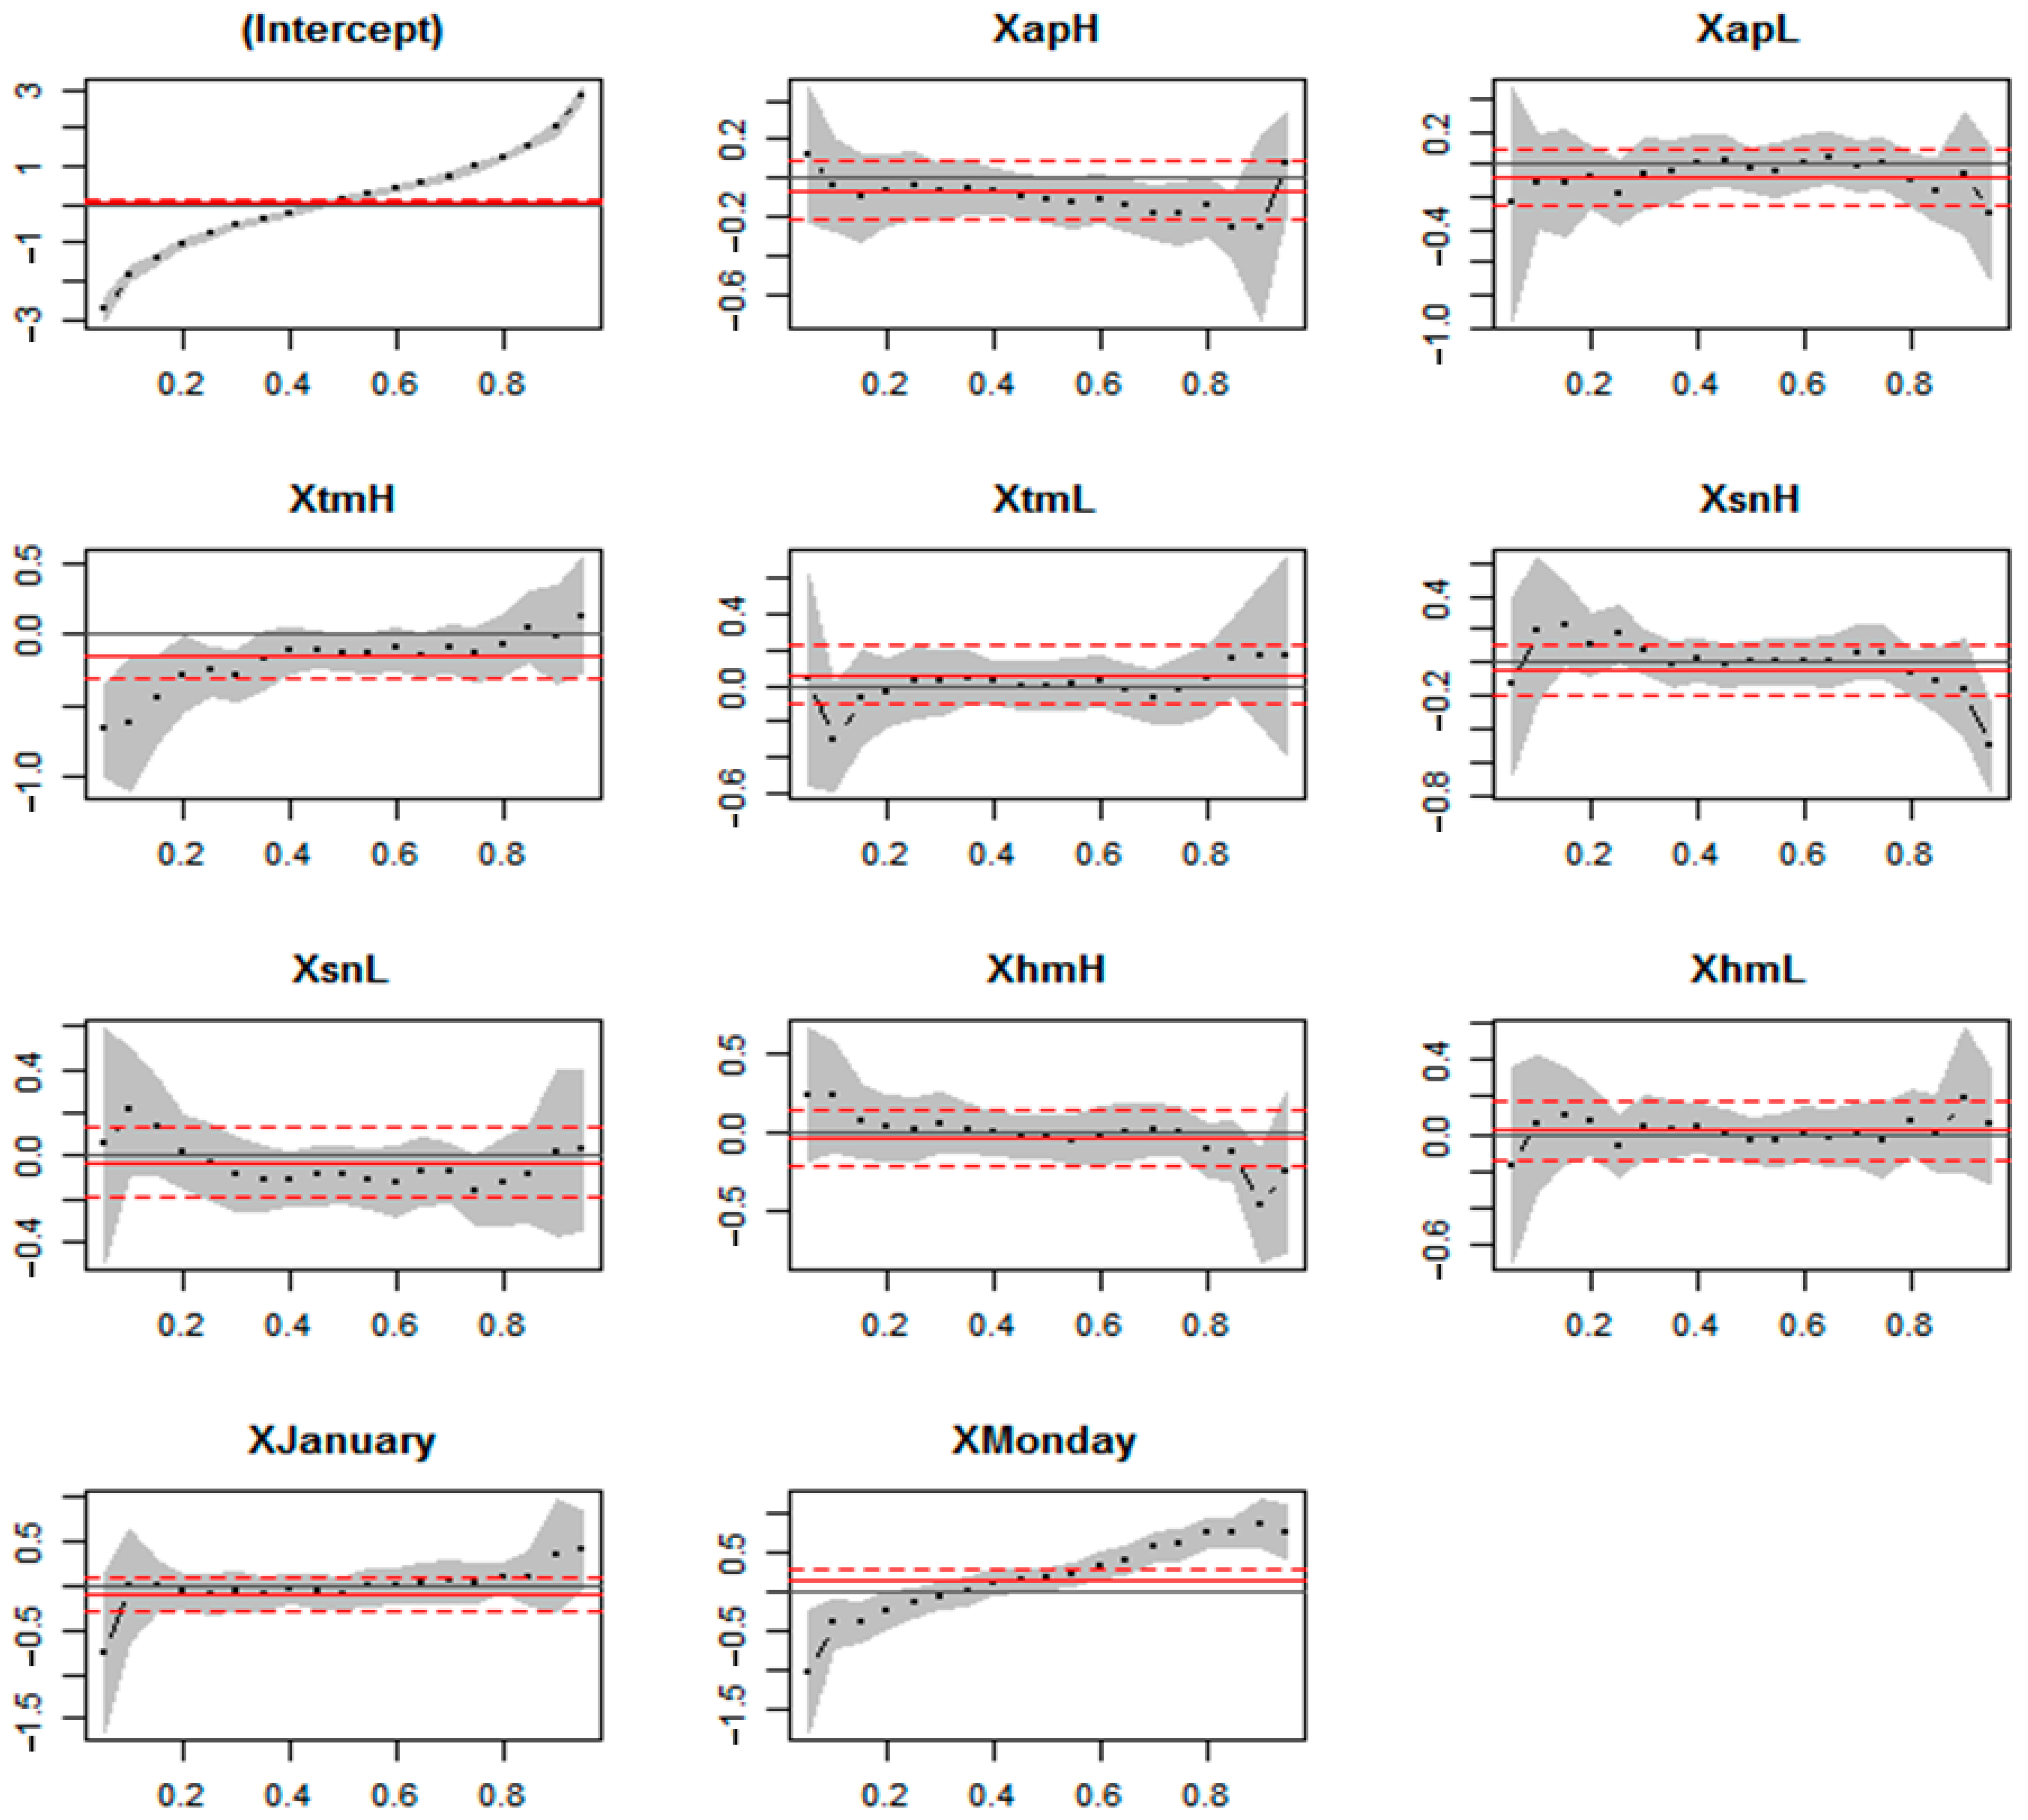
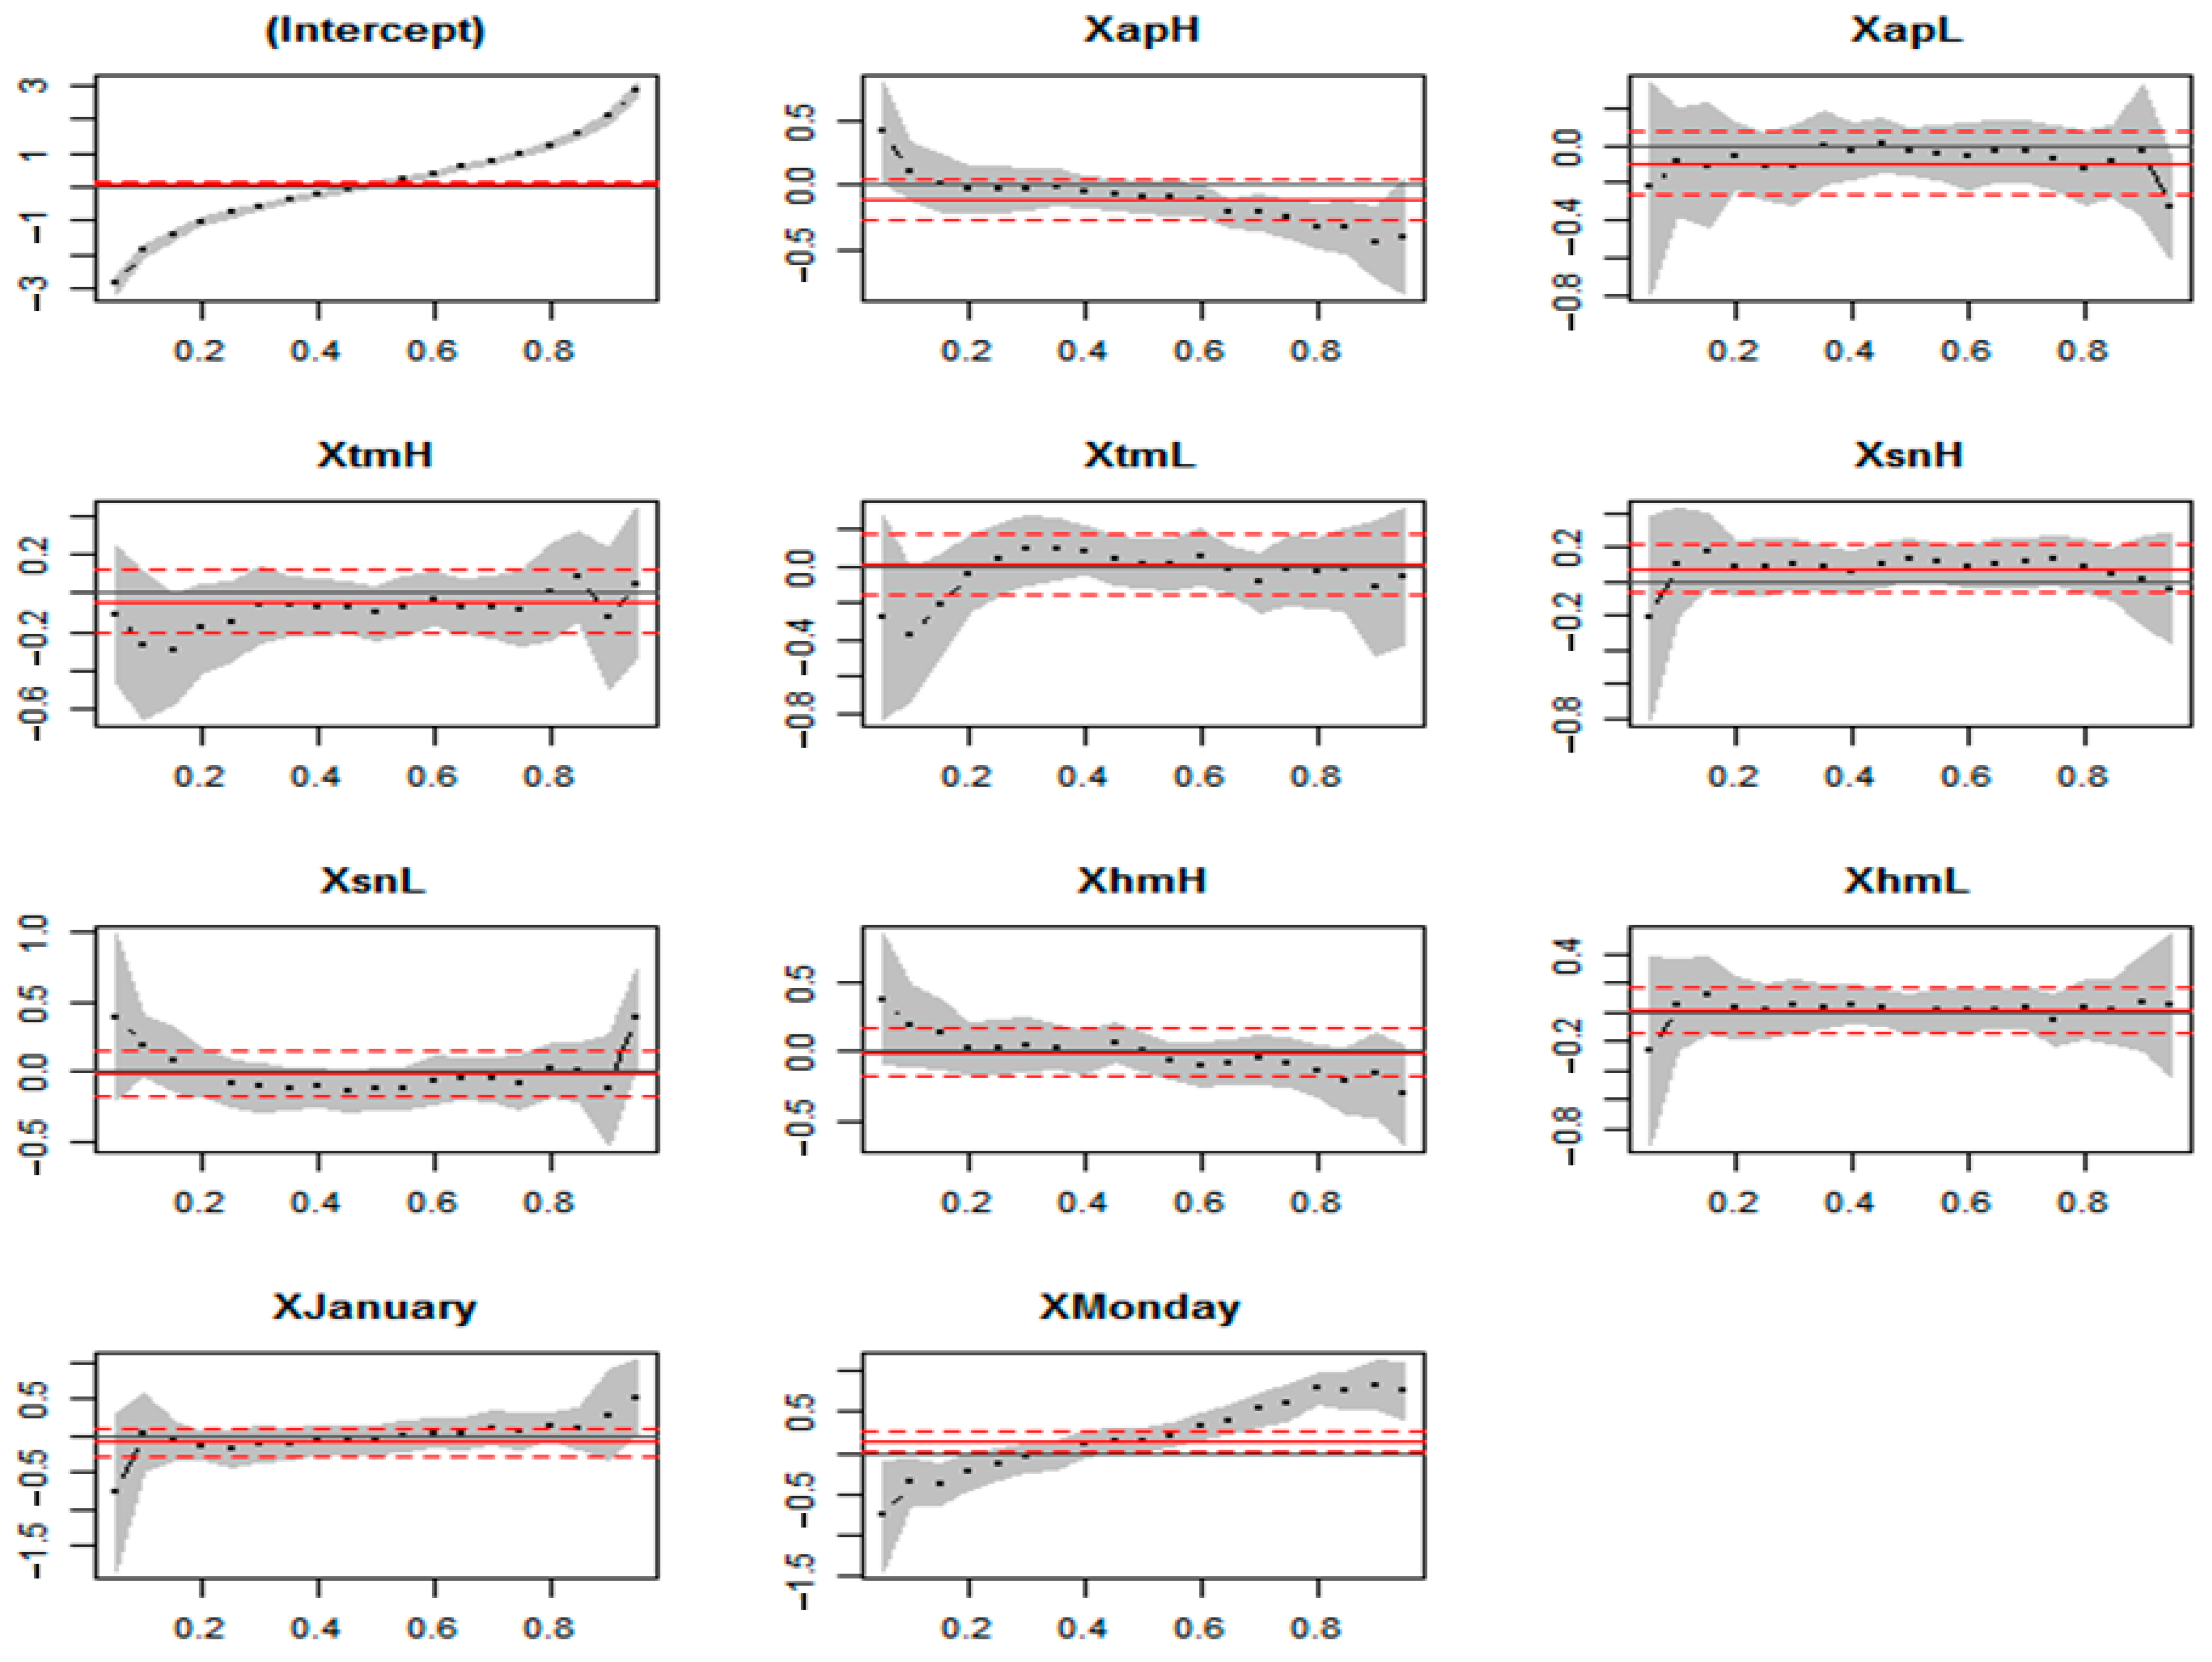
5.2. Effects of Air Quality and Weather on the Stock Returns Using Quantile Regression

The volatility of Chinese stock markets was extremely high during 2005 to 2009, as displayed in Figure 1. Chinese equity market experienced the ‘roller-coaster’ effect during that period, which is affected by the very unstable investors’ sentiment. This abnormal fluctuation is due to the composition of traders in the equity market. Individual investors dominate the Chinese stock market, and they usually do not have sufficient professional knowledge and analytical capabilities. At the same time, they have insufficient experience, so they are more likely to be affected by the decisions of other investors than institutional investors. The information they possess relies heavily on public opinion, and they blindly follow other investors’ decisions. Under these circumstances, the air quality and weather conditions can trigger some investors’ sentiment favorable (unfavorable) to stock price movement. Once optimistic (pessimistic) sentiment is formed, many investors will rush for the stock market and buy (sell) stocks. If the irrational sentiment is serious, the movement of herding behavior can be visible.
In the Shenzhen stock market, there are far more individual investors than institutional investors. Individual investors in China are not interested in the financial statements and business management of companies and are mainly interested in profit-taking. For this reason, the Chinese stock market has turned into a speculative market. Many listed companies do not have self-sustaining power, and such companies do not pay dividends properly. For this reason, individual investors are trying to profit from speculative trading [26]. In markets in this state, there is a probability of herding behavior due to investors’ sentiment.
As the price dynamics in Shenzhen stock market is very volatile, it is a good choice to analyze the linkage between air quality and weather and equity market returns using the quantile regression method, because the quantile regression can capture the asymmetry and nonlinearity in the price dynamics, i.e., the difference of the relationship in the bull and bear markets. Table 12, Table 13 and Table 14 summarize the estimation results of quantile regression of the 11-day, 21-day, and 31-day MA-MSD models.
In Table 12, the results of the quantile regression using the 11-day MA-MSD model, we can find that high air pollution has significant and negative effects in the bull market ( τ = 0.7 ) , and extremely high temperature has significant and negative effects in the bear market ( τ = 0.3 ) . This implies that the air quality and weather effects exist but are asymmetric in the Shenzhen stock market. It is notable that we succeed to identify the air quality and weather effects by employing quantile regression approach. This evidence on the existence of air quality effect and weather effect in the Shenzhen stock market is consistent with the findings of empirical studies focusing on the Shanghai Exchange [5,8,9,10,11,12,17,18,19,20,21,22].
In Table 13, the results of the quantile regression using the 21-day MA-MSD model, we can find that high air pollution has significant and negative effects in the bull market ( τ = 0.7 ) , and extremely high temperature has significant and negative effects in the bear market ( τ = 0.1   and   τ = 0.3 ) . Interestingly, we can find that the weather effect of the abnormal temperature on the stock returns is greater in severe bearish market, as we compare the values of significant coefficient by quantile ( 0.63   for   τ = 0.1   and   0.28   for   τ = 0.3 ) .
In Table 14, the results of the quantile regression using the 31-day MA-MSD model, we can find that high air pollution has significant and negative effects in the bull market ( τ = 0.7 ,   τ = 0.8   and   τ = 0.9 ) . Interestingly, we can find that the effect of the air pollution on the stock returns is greater in the bullish market, as we compare the values of significant coefficient by quantile ( 0.21   for   τ = 0.7 ,   0.32   for   τ = 0.8   and   0.44   for   τ = 0.9 ) .
If we put the above results together, the air pollution has a negative impact on the SZI in the high quantile ( τ 0.7 ;   bull   market ) , whereas the extremely high temperature has negative influence on the SZI in the low quantile ( τ 0.3 ;   bear   market ) . This suggests that the air quality and weather have asymmetric effects in the Shenzhen stock market (Qualitatively similar conclusions in terms of asymmetric effects of air pollution on the Shenzhen returns were drawn based on the quantiles-based causality test of Chuang et al. [31]. Complete details of these results are available upon request from the authors). Interestingly, in several cases, we can find that the Monday effect is significant, however the sign of the effect is also asymmetric.
Figure 2 (for the 11-day model), Figure 3 (for the 21-day model), and Figure 4 (for the 31-day model) show the estimation results of quantile regression comparing the result of least squares estimation method. In these figures, the black dotted line displays the impact of influencing factors on stock returns at different quantiles. The shaded area denotes the 95% confidence interval for estimates of the quantile regression. The red straight line means the estimated coefficient of the least-squares regression. The red dotted line denotes the 95% confidence interval for estimates of the least squares regression. Looking at these figures, we can find that the least squares method underestimates the air quality and weather effects compared to the quantile regression method, suggesting that the quantile regression method is more suitable in analyzing these effects in a very volatile emerging market such as the Shenzhen stock market.

6. Conclusions

The literature explains that air quality and weather can affect investors’ sentiment/mood and inhibit them from coming to reasonable investment decisions. The influence of air quality and weather conditions on the investor’s decision-making process can be reflected in the movement of equity returns. Especially, air pollution has become considerably worse recently in China. Aggravating air pollution causes mental and physical health influences on individuals. As well as increased perception of air pollution promotessentiment/mood effects of air pollution and then affects individual preference and investment decision making. Therefore, air pollution as well as weather condition may have a remarkable effect on stock market returns.
This study examined the influence of air quality and weather conditions on stock returns using the Shenzhen Component Index (SZI) data, a representative stock market index of the Shenzhen Stock Exchange. For this purpose, we applied the 11-day (21-day and 31-day) MA-MSD method to the daily index of the variable (air quality, temperature, humidity and sunshine duration) from January 2005 to December 2019 (except 2013). We divided the whole sample period (2005–2019) into two sub-periods: sub-period I (2005–2012) and sub-period II (2014–2019).
The main findings are as follows. First, in the whole sample period (2005–2019), we find that high air pollution and extremely high temperature have significant and negative effects on the Shenzhen stock returns. In the sub-period I (2005–2012), the 11-day model and 31-day model show that high air pollution has significant and negative effects on the Shenzhen stock returns. Second, the results of the quantile regression reveal that high air pollution has significant and negative effects in the bull market, and extremely high temperature has significant and negative effects in the bear market. This implies that the influence of air quality and weather conditions on the Shenzhen returns are asymmetric. Third, the weather effect of the abnormal temperature on the stock returns is greater in severe bearish market. Whereas the effect of the air pollution on the stock returns is greater in the bullish market. Fourth, the least squares method underestimates the air quality and weather effects on the stock returns compared to the quantile regression method, suggesting that the quantile regression method is more suitable in analyzing these effects in a very volatile emerging market such as the Shenzhen stock market.
The efficient market hypothesis (EMH) indicates that equity prices are not predictable. In behavioral finance theory, these kinds of market anomalies are regarded as inconsistent with the EMH. Our study contributes to the literature on market efficiency by uncovering that air quality and weather conditions play different roles in predicting the equity price movement. Investors need to know that they may make biased decisions due to poor air quality and weather problems rather than rational economic prospects. Our results can be helpful for investors to correct biases in their investment behavior.
As part of future research, it would be interesting to extend the investigation to check if air pollution tends to have higher-moment effects, for instance on volatility, which in turn is an important information for portfolio selection and risk management (Preliminary analysis based on the nonparametric k t h order causality-in-quantiles test of Balcilar et al. [32] does indeed confirm the impact of air pollution on not only returns, but also volatility (as captured by squared returns). Complete details of these results are available upon request from the authors).

Author Contributions

All the authors contributed to the entire process of writing this paper. R.G. and S.-M.Y. conceived the idea and designed the structure of this paper. Z.J. collected and examined the data and devised the methodology. S.S. wrote the draft of Section 1 and Section 2, Z.J. wrote the draft of Section 3 and Section 4. R.G. and S.-M.Y. wrote Section 5 and Section 6, and S.-M.Y. performed a final revision of the entire paper. All authors have read and agreed to the published version of the manuscript.

Funding

This work was supported by the Ministry of Education of the Republic of Korea and the National Research Foundation of Korea (NRF-2020S1A5B8103268).

Institutional Review Board Statement

Not applicable.

Informed Consent Statement

Not applicable.

Data Availability Statement

Publicly available datasets were analyzed in this study. This data can be downloaded here: Ministry of Environmental Protection of China (https://datacenter.mee.gov.cn (accessed on 31 July 2020)), Hong Kong Observatory (http://www.weather.gov.hk (accessed on 31 July 2020)), Shenzhen Stock Exchange (http://www.szse.cn (accessed on 31 July 2020)).

Conflicts of Interest

The authors declare no conflict of interest.

References

  1. Lepori, G.M. Environmental stressors, mood, and trading decisions: Evidence from ambient air pollution. SSRN Electron. J. 2009. [Google Scholar] [CrossRef]
  2. Saunders, E.M., Jr. Stock prices and the Wall Street weather. Am. Econ. Rev. 1993, 83, 1337–1345. [Google Scholar]
  3. Hirshleifer, D.; Shumway, T. Good day sunshine: Stock returns and the weather. J. Financ. 2003, 58, 1009–1032. [Google Scholar] [CrossRef]
  4. Chang, S.-C.; Chen, S.-S.; Chou, R.K.; Lin, Y.-H. Weather and intraday patterns in stock returns and trading activity. J. Bank. Financ. 2008, 32, 1754–1766. [Google Scholar] [CrossRef]
  5. Yoon, S.-M.; Kang, S.H. Weather effects on returns: Evidence from the Korean stock market. Physica A 2009, 388, 682–690. [Google Scholar] [CrossRef]
  6. Jiang, Z.; Kang, S.H.; Cheong, C.; Yoon, S.-M. The effects of extreme weather conditions on Hong Kong and Shenzhen stock market returns. Int. J. Financ. Stud. 2019, 7, 70. [Google Scholar] [CrossRef] [Green Version]
  7. Li, Q.; Peng, C.H. The stock market effect of air pollution: Evidence from China. Appl. Econ. 2016, 48, 3442–3461. [Google Scholar] [CrossRef]
  8. Yi, C.; Wang, J. Weather, seasonal mood disorder and stock returns. Stat. Decis. Mak. 2005, 18, 79–82. (In Chinese) [Google Scholar]
  9. Han, Z.-X. Study on weather effect of China’s stock index returns. J. Beijing Univ. Aeronaut. Astronaut. (Soc. Sci. Ed.) 2005, 18, 10–14. (In Chinese) [Google Scholar]
  10. Han, Z.-X. A study on sunshine effect of Chinese stock index returns. J. Harbin Inst. Technol. 2006, 38, 260–263. (In Chinese) [Google Scholar]
  11. Han, Z.-X.; Wang, Y.-S. A study for SAD effect on Chinese market indices return. J. Huazhong Univ. Sci. Technol. (Soc. Sci. Ed.) 2005, 19, 88–92. (In Chinese) [Google Scholar]
  12. Kang, S.H.; Jiang, Z.; Lee, Y.; Yoon, S.-M. Weather effects on the returns and volatility of the Shanghai stock market. Physica A 2010, 389, 91–99. [Google Scholar] [CrossRef]
  13. Levy, T.; Yagil, J. Air pollution and stock returns in the US. J. Econ. Psychol. 2011, 32, 374–383. [Google Scholar] [CrossRef]
  14. Levy, T.; Yagil, J. Air pollution and stock returns–Extensions and international perspective. Int. J. Eng. Bus. Enterp. Appl. 2013, 4, 1–14. [Google Scholar]
  15. Lepori, G.M. Air pollution and stock returns: Evidence from a natural experiment. J. Empir. Financ. 2016, 35, 25–42. [Google Scholar] [CrossRef] [Green Version]
  16. Guo, Y.J.; Zhang, Y.H. Can air quality affect the stock market? J. Financ. Res. 2016, 428, 71–85. (In Chinese) [Google Scholar]
  17. Wu, Q.; Hao, Y.; Lu, J. Air pollution, stock returns, and trading activities in China. Pac. Basin Financ. J. 2018, 51, 342–365. [Google Scholar] [CrossRef]
  18. Dong, R.; Fisman, R.; Wang, Y.; Xu, N. Air pollution, affect, and forecasting bias: Evidence from Chinese financial analysts. J. Financ. Econ. 2019, 139, 971–984. [Google Scholar] [CrossRef]
  19. Li, J.; Massa, M.; Zhang, H.; Zhang, J. Air pollution, behavioral bias, and the disposition effect in China. J. Financ. Econ. 2019, in press. [Google Scholar] [CrossRef]
  20. Ding, X.; Guo, M.; Yang, T. Air pollution, local bias, and stock returns. Financ. Res. Lett. 2020, 39, 101576. [Google Scholar] [CrossRef]
  21. Wu, Q.; Lu, J. Air pollution, individual investors, and stock pricing in China. Int. Rev. Econ. Financ. 2020, 67, 267–287. [Google Scholar] [CrossRef]
  22. Wu, Q.; Robin, K.; Lu, J. How does air pollution-induced fund-manager mood affect stock markets in China? J. Behav. Exp. Financ. 2020, 28, 100399. [Google Scholar] [CrossRef]
  23. He, X.; Liu, Y. The public environmental awareness and the air pollution effect In Chinese stock market. J. Clean. Prod. 2018, 185, 446–454. [Google Scholar] [CrossRef]
  24. Xu, M.; Wang, Y.; Tu, Y. Uncovering the invisible effect of air pollution on stock returns: A moderation and mediation analysis. Financ. Res. Lett. 2020, 39, 101646. [Google Scholar] [CrossRef]
  25. Shenzhen Stock Exchange. Shenzhen Market. Monthly Report; Shenzhen Stock Exchange: Shenzhen, China, 2019; Volume 12. [Google Scholar]
  26. Lin, J.Y. Demystifying the Chinese Economy; Cambridge University Press: Cambridge, UK, 2011. [Google Scholar]
  27. Shenzhen Stock Exchange. Shenzhen Stock Exchange Fact; Shenzhen Stock Exchange: Shenzhen, China, 2018. [Google Scholar]
  28. Teng, M.; He, X. Air quality levels, environmental awareness and investor trading behavior: Evidence from stock market in China. J. Clean. Prod. 2020, 244, 118663. [Google Scholar] [CrossRef]
  29. Koenker, R.; Bassett, G., Jr. Regression quantiles. Econometrica 1978, 46, 33–50. [Google Scholar] [CrossRef]
  30. Fama, E.F. Efficient capital markets: A review of theory and empirical work. J. Financ. 1970, 25, 383–417. [Google Scholar] [CrossRef]
  31. Chuang, C.C.; Kuan, C.M.; Lin, H.Y. Causality in quantiles and dynamic stock return–volume relations. J. Bank. Financ. 2009, 33, 1351–1360. [Google Scholar] [CrossRef]
  32. Balcilar, M.; Gupta, R.; Nguyen, D.K.; Wohar, M.E. Causal effects of the United States and Japan on Pacific-Rim stock markets: Nonparametric quantile causality approach. Appl. Econ. 2018, 50, 5712–5727. [Google Scholar] [CrossRef]
Figure 1. Dynamics of SZI: daily price (left) and daily returns (right).
Sustainability 13 02931 g001
Figure 2. Quantile regression estimates employing the 11-day MA-MSD method. Notes: The black dotted line displays the impact of influencing factors on returns at different quantiles. The red straight line denotes the results of the least squares regression. The red dotted line shows the 95% confidence curve of the least squares regression. The shaded area denotes the 95% confidence interval for the quantile regression.
Sustainability 13 02931 g002
Figure 3. Quantile regression estimates employing the 21-day MA-MSD method. Notes: The black dotted line displays the impact of influencing factors on returns at different quantiles. The red straight line denotes the results of the least squares regression. The red dotted line shows the 95% confidence curve of the least squares regression. The shaded area denotes the 95% confidence interval for the quantile regression.
Sustainability 13 02931 g003
Figure 4. Quantile regression estimates employing the 31-day MA-MSD method. Notes: The black dotted line displays the impact of influencing factors on returns at different quantiles. The red straight line represents the results of the least squares regression. The red dotted line denotes the 95% confidence curve of the least squares regression. The shaded area shows the 95% confidence interval for the quantile regression.
Sustainability 13 02931 g004
Table 1. Overview of the mainland China and Hong Kong markets.
Hong Kong ExchangeShanghai Stock ExchangeShenzhen Stock Exchange
Main BoardGEMA-ShareB-ShareA-ShareB-Share
No. of listed firms2071378149550219547
No. of listed H-shares26222n.a.n.a.n.a.n.a.
No. of listed red-chips stocks1685n.a.n.a.n.a.n.a.
No. of listed securities12,416379n.a.n.a.n.a.n.a.
Market capitalization (Billion)HK$38,058HK$107RMB 34,609RMB 79RMB 23,689RMB 52.4
Total negotiable capitalization (Billion)n.a.n.a.RMB 29,918RMB 79RMB 18,169RMB 51.6
Average P/E ratio (Times)13.2822.0414.289.0326.2510.17
Total turnover
(Million shares)
80,24735121,6092128,24818
Total turnover (Million)HK$48,434HK$86RMB 220,143RMB 137RMB 307,635RMB 66
Source: Website of Hong Kong Exchange (http://www.hkex.com.hk (accessed on 31 July 2020)). Note: These are the statistics for December 2019.
Table 2. Listed securities in the Shenzhen stock market.
StocksNo. of Listed SecuritiesTotal Issued Capital
(Shares)
Total Negotiable Capital
(Shares)
Total Market Capitalization (RMB Yuan)Negotiable Market Capitalization (RMB Yuan)
Main Board A shares461797,185,123,699696,114,461,4077,686,204,108,1106,779,766,998,846
SME Board943932,212,187,067716,627,455,3059,868,131,938,2277,366,129,440,415
ChiNext791409,711,487,697306,186,903,2326,134,761,852,7014,023,173,660,498
Main Board B shares4712,941,222,93512,811,181,40652,388,606,60951,603,614,196
Source: Shenzhen Market Monthly Report 2019.12 [25]. Note: These are the statistics for December 2019.
Table 3. Investor composition in the Shenzhen stock market (Year-end, 10,000 people).
No. of
Individual Investors
No. of
Institutional Investors
Total
201110,091.1833.4010,124.57
201210,537.8235.4810,573.30
201311,047.5038.0511,085.56
201411,995.2941.5812,036.87
201516,839.7049.2216,888.92
201620,841.0056.1220,897.13
201724,482.5762.5124,545.08
201827,621.2664.0627,685.32
Source: Shenzhen Stock Exchange [27].
Table 4. Trading value and shares by region (RMB, Billion).
Area (Province)Total Trading (RMB)Weight (%)Share Trading
Shanghai30,22414.9918,993
Shenzhen23,30911.5613,332
Zhejiang19,4609.6517,051
Jiangsu16,8658.3612,692
Beijing16,2758.0710,268
Fujian99164.927037
Guangdong93284.627450
Guangzhou81114.025464
Foreign47692.364769
Source: Shenzhen Stock Exchange [25].
Table 5. Summary statistics of SZI returns.
Obs.MeanMax.Min.Std. Dev.Skew.Kurt.Jarque-BeraADFPP
36470.03611.63−9.751.86−0.416.351817.8 ***−55.47 ***−55.68 ***
Notes: The Std. Dev., Skew., and Kurt. denote the standard deviation, skewness, and kurtosis of sample returns, respectively. The Jarque-Bera test statistic is to check the normality of sample returns. ADF is the augmented Dickey-Fuller and PP is the Phillips-Perron unit root test statistics. *** indicates the rejection of the null hypothesis at the 1% significance level.
Table 6. Summary statistics of weather variables of Hong Kong and Shenzhen.
Variables.MeanMax.Min.Std. Dev.Skew.Kurt.Jarque-Bera
AQI53.32 289.00 15.00 22.55 1.35 8.34 5040.5 ***
TEMP23.70 31.80 7.40 5.14 −0.53 2.25 236.6 ***
HUMI78.49 99.00 29.00 10.23 −1.00 4.90 1067.4 ***
SUNSH4.99 12.40 0.00 3.88 0.08 1.52 312.7 ***
Notes: The figures are for the data of the 11-day MA-MSD model. Those for the 21-day and 31-day models are very similar to the above figures. *** denotes significance at the 1% level.
Table 7. Description of extreme air quality and weather condition dummies.
Air Quality and Weather Condition DummiesDescription
a p H Extremely high air pollution (low air quality)
a p L Extremely low air pollution (high air quality)
t m H Extremely high temperature
t m L Extremely low temperature
s n H Extremely long sunshine duration
s n L Extremely short sunshine duration
h m H Extremely high humidity
h m L Extremely low humidity
Table 8. Effects of air quality and weather on stock returns employing the 11-day moving average and moving standard deviation (MA-MSD) method.
SZI
Whole Period
(2005–2019)
Sub-Period I
(2005–2012)
Sub-Period II
(2014–2019)
Coefficient t -Value Coefficient t -Value Coefficient t -Value
μ 0.080 1.906 0.078 1.248 0.084 1.438
a p H −0.174 −2.223 ** −0.322 −2.686 *** −0.072 −0.659
a p L −0.066 −0.865 −0.141 −1.088 −0.037 −0.393
t m H −0.113 −1.414 −0.219 −1.785 −0.013 −0.120
t m L 0.048 0.627 0.075 0.635 0.025 0.241
s n H −0.019 −0.255 −0.001 −0.009 −0.055 −0.534
s n L 0.012 0.136 −0.020 −0.150 0.050 0.434
h m H 0.008 0.092 0.207 1.630 −0.156 −1.330
h m L −0.036 −0.468 0.147 1.276 −0.177 −1.704
J a n u a r y −0.078 −0.947 0.009 0.077 −0.221 −1.767
M o n d a y 0.055 0.997 0.049 0.552 0.075 1.021
ω 0.028 6.43 *** 0.067 4.85 *** 0.016 4.22 ***
α 0.059 13.82 *** 0.064 9.11 *** 0.048 8.84 ***
β 0.934 212.37 ***0.920 106.46 *** 0.946 183.90 ***
Log L −6525.760 −3937.94−2572.62
A I C 3.869 4.0863.577
Notes: log L and A I C denote the calculated values of log-likelihood and Akaike information criterion, respectively. *** and ** indicate significance at the 1% and 5% levels, respectively.
Table 9. Effects of air quality and weather on stock returns employing the 21-day MA-MSD method.
SZI
Whole Period
(2005–2019)
Sub-Period I
(2005–2012)
Sub-Period II
(2014–2019)
Coefficient t -Value Coefficient t -Value Coefficient t -Value
μ 0.054 1.284 0.078 1.246 0.040 0.696
a p H −0.074 −0.964 −0.182 −1.617 0.011 0.103
a p L −0.053 −0.677 0.019 0.141 −0.166 −1.702
t m H −0.163 −2.055 *** −0.164 −1.449 −0.163 −1.402
t m L 0.059 0.846 0.061 0.524 0.041 0.453
s n H 0.072 1.004 0.038 0.344 0.100 1.036
s n L −0.074 −0.962 −0.030 −0.240 −0.097 −0.986
h m H 0.052 0.625 0.003 0.026 0.090 0.792
h m L −0.009 −0.127 0.029 0.241 −0.036 −0.385
J a n u a r y −0.022 −0.269 0.040 0.335 −0.099 −0.873
M o n d a y 0.052 0.929 0.041 0.460 0.069 0.931
ω 0.025 6.33 *** 0.064 4.66 *** 0.015 4.56 ***
α 0.057 13.91 *** 0.062 9.15 *** 0.048 9.20 ***
β 0.937 223.35 *** 0.922 108.97 *** 0.946 196.41 ***
Log L −6521.030 −3940.74−2570.57
A I C 3.871 4.0963.577
Note: See notes of Table 8.
Table 10. Effects of air quality and weather on stock returns employing the 31-day MA-MSD method.
SZI
Whole Period
(2005–2019)
Sub-Period I
(2005–2012)
Sub-Period II
(2014–2019)
Coefficient t -Value Coefficient t -Value Coefficient t -Value
μ 0.065 1.547 0.078 1.241 0.051 0.874
a p H −0.104 −1.364 −0.226 −1.975 ** 0.005 0.045
a p L −0.057 −0.713 0.029 0.218 −0.161 −1.562
t m H −0.103 −1.347 −0.094 −0.832 −0.110 −1.013
t m H −0.055 −0.780 −0.048 −0.429 −0.064 −0.688
s n H 0.048 0.690 0.038 0.371 0.062 0.630
s n L −0.056 −0.708 −0.100 −0.809 −0.027 −0.257
h m H 0.062 0.720 0.067 0.502 0.063 0.551
h m L 0.004 0.049 0.124 1.062 −0.072 −0.752
J a n u a r y −0.020 −0.224 0.063 0.471 −0.091 −0.791
M o n d a y 0.055 0.975 0.038 0.432 0.082 1.100
ω 0.022 5.87 *** 0.054 4.26 *** 0.016 4.44 ***
α 0.054 13.88 *** 0.059 9.32 *** 0.048 9.05 ***
β 0.941 235.83 *** 0.928 117.57 *** 0.946 189.58 ***
Log L −6513.630 −3933.75−2571.64
A I C 3.871 4.0973.578
Note: See notes of Table 8.
Table 11. Summary of significant dummy variables.
Dependent Variable: SZI Returns
Whole Period
(2005–2019)
Sub-Period I
(2005–2012)
Sub-Period II
(2014–2019)
11-day MA-MSD a p H , (-) a p H , (-)
21-day MA-MSD t m H , (-)
31-day MA-MSD a p H , (-)
Table 12. Quantile regression estimates for returns using the 11-day MA-MSD method.
Variables0.1 0.2 0.3 0.4 0.5 0.6 0.7 0.80.9
Intercept−1.87 * −1.03 *−0.54 *−0.20 *0.11 *0.39 *0.73 *1.17 *1.97 *
a p H −0.12−0.17−0.15−0.14−0.12−0.13−0.20 * −0.12−0.17
a p L −0.23−0.14−0.12−0.01−0.01−0.01−0.04−0.08−0.23
t m H −0.35−0.21−0.25 *−0.16−0.13−0.14−0.050.02−0.12
t m L −0.25−0.04−0.02−0.01−0.04−0.03−0.08−0.070.11
s n H 0.080.020.010.000.050.040.12−0.02−0.01
s n L 0.130.090.04−0.030.000.040.010.080.16
h m H 0.450.140.140.080.000.010.070.02−0.08
h m L 0.310.140.04−0.05−0.03−0.04−0.050.090.11
J a n u a r y −0.28−0.14−0.17−0.16−0.11−0.020.100.140.38
M o n d a y −0.49 * −0.22−0.100.100.18 *0.32 *0.56 *0.72 * 0.81 *
Note: * indicates significance at the 5% level.
Table 13. Quantile regression estimates for returns using the 21-day MA-MSD method.
Variables.0.10.20.30.40.50.60.70.80.9
Intercept−1.84 *−1.02 *−0.55 *−0.23 *0.12 *0.40 * 0.75 *1.22 *2.02 *
a p H −0.03−0.07−0.07−0.07−0.11−0.11 −0.18 *−0.15−0.25
a p L −0.11−0.09−0.060.01−0.040.01 −0.02−0.10−0.06
t m H −0.63 *−0.28−0.28 *−0.11−0.13−0.10 −0.10−0.07−0.00
t m L −0.29−0.040.020.020.000.02 −0.070.030.16
s n H 0.200.110.070.020.000.00 0.07−0.06−0.16
s n L 0.210.02−0.09−0.10−0.09−0.12 −0.08−0.120.02
h m H 0.230.030.070.00−0.03−0.01 0.03−0.11−0.45 *
h m L 0.060.070.040.04−0.030.00 −0.010.060.18
J a n u a r y 0.00−0.07−0.07−0.03−0.080.01 0.060.090.35
M o n d a y −0.41 *−0.24−0.060.120.16 *0.32 * 0.56 *0.77 *0.86 *
Note: * indicates significance at the 5% level.
Table 14. Quantile regression estimates for returns using the 31-day MA-MSD method.
Variables0.10.20.30.40.50.60.70.80.9
Intercept−1.91 *−1.03 *−0.59 *−0.24 *0.09 *0.39 *0.76 *1.21 *2.06 *
a p H 0.11−0.03−0.03−0.06−0.09−0.11−0.21 *−0.32 *−0.44 *
a p L −0.09−0.05−0.11−0.03−0.03−0.06−0.03−0.12−0.03
t m H −0.27−0.18−0.06−0.08−0.11−0.03−0.070.01−0.13
t m L −0.37−0.040.090.080.020.05−0.09−0.04−0.12
s n H 0.110.080.100.060.140.090.110.090.01
s n L 0.19−0.01−0.11−0.11−0.12−0.06−0.060.02−0.13
h m H 0.180.030.05−0.010.00−0.09−0.05−0.14−0.16
h m L 0.050.030.040.05−0.010.010.030.020.06
J a n u a r y 0.04−0.13−0.11−0.07−0.060.040.100.140.27
M o n d a y −0.36 *−0.23−0.040.110.150.32 *0.53 *0.80 *0.83 *
Note: * indicates significance at the 5% level.
Publisher’s Note: MDPI stays neutral with regard to jurisdictional claims in published maps and institutional affiliations.

