Article

How Promotion Incentives and Environmental Regulations Affect China’s Environmental Pollution?

1
College of Environmental Science and Engineering, Nankai University, Tianjin 300000, China
2
Tianjin Huanke Environment Consulting Co., Ltd., Tianjin 300000, China
3
School of Spatial Informatics and Geomatics Engineering, Anhui University of Science and Technology, Huainan 232001, China
*
Author to whom correspondence should be addressed.
Sustainability 2021, 13(5), 2907; https://doi.org/10.3390/su13052907
Submission received: 1 February 2021 / Revised: 22 February 2021 / Accepted: 3 March 2021 / Published: 8 March 2021
(This article belongs to the Section Environmental Sustainability and Applications)

Abstract

:
As for the academics and policymakers, more attention has been given to the issue on how to reduce environmental pollution through the cooperation of environmental regulation and local officials’ promotion incentives. With the use of a city-level panel data of 266 Chinese cities from 2005 to 2016, this study preliminary explores the impacts of environmental regulations, local officials’ promotion incentives, and their interaction terms on urban environmental pollution at national and regional levels by using the spatial Durbin model. The results indicate that the impacts of environmental regulations and local officials’ promotion incentives on urban environmental pollution have achieved the desired goal with the other’s cooperation, and their interaction term’s coefficients on urban environmental pollution are significantly negative. Moreover, spatial heterogeneity is established, and the uneven development of urban environmental pollution among different regions deserves more attention. In order to effectively reduce the level of urban environmental pollution in China, the government should focus on such solutions as enhancing the implementation and supervision efficiency of environmental regulation, optimizing the performance appraisal system of local officials, improving the synergistic effects of environmental regulations and local officials’ promotion incentives, and establishing a multi-scale spatial cooperation mechanism based on both geographical and economic correlations.

1. Introduction

With the acceleration of urbanization and industrialization, economic development has made great achievements in China. In 2019, China achieved a gross national product of 990,865 billion yuan, accounting for 16% of global gross domestic product (GDP). China’s contribution to world economic growth has reached about 30%. Although China has made great achievements in the economic field, it has also brought corresponding pressures on energy, resources and the environment [1,2,3]. Environmental issues have severely affected people’s ability to pursue a better life and have attracted widespread attention of those from all walks of life [4,5,6]. The concept of promoting green development, circular development and low-carbon development was first put forward in the report of the 18th National Congress of China. The Party’s 19th National Congress’s report clearly pointed out that speeding up the reform of the ecological civilization system and building a beautiful China. With this in mind, reducing the intensity of pollution emissions and improving environmental quality has become a development trend in China [7,8], bringing China one step closer to achieving a truly beautiful China. Therefore, China needs to enrich research on environmental pollution to ensure economic development, while enjoying the clear water and lush mountains [9].
The current environmental pollution problem is closely related to the promotion incentive mechanism of local officials [10,11]. The central government provided local officials with strong incentives to reduce environmental pollution. Specifically, incorporating environmental governance into the official promotion and evaluation system has motivated local officials to take costly actions to mitigate environmental pollution. Local officials who have been promoted, in order to cater to the preference of the higher-level government and implement the orders of the higher-level government, have greater motivation to improve the quality of the city’s environment and achieve new environmental governance targets [12]. In addition, in the process of building a socialist ecological civilization, the central government has paid more attention to pollution control and ecological construction, and has formulated and implemented many environmental protection policies. The strengthening of environmental supervision by the Chinese government has improved the quality of the urban environment.
The purpose of this paper is to explore the effects of local officials’ promotion incentives and environmental regulations on environmental pollution in a more comprehensive way, as well as conduct a discussion on the following issues. Are local officials’ promotion incentives and environmental regulations beneficial for reducing China’s environmental pollution? How can the environmental pollution change under the combined effects of local officials’ promotion incentives and environmental regulations? What are the differences in the impacts of local officials’ promotion incentives and environmental regulations on China’s environmental pollution due to regional and city scales heterogeneity? Further study of the above issues is helpful in verifying the availability of local officials’ promotion incentives and environmental regulations in improving environmental quality, and has profound implications for environmental governance and the formulation of environmental regulation policies in China.
This paper is structured as follows: Section 2 provides the literature review, Section 3 explains the methodology, Section 4 describes the data and variables, Section 5 provides the results and discussion, and Section 6 outlines the conclusions and policy implications.

2. Literature Review

The literature on the relationship between officials’ promotion incentives, environmental regulation and environmental pollution can be summarized the following two aspects.
The first is the relationship between officials’ promotion incentives and urban environmental pollution. China’s serious environmental problems to a large extent stem from the incentive mechanism for local officials. In recent years, the central government has stressed the importance of energy conservation and environmental protection in the process of economic development, in the context of a scientific outlook on development-oriented cadre evaluation system [13]. The central government clearly proposed the assessment of officials’ environmental performance as one of the criteria for their appointment and promotion in 2005 [14,15]. The Ministry of Environmental Protection of China proposed an accountability system for environmental assessment of local officials, which further strengthened the assessment of local officials’ environmental governance in 2007. The central government has incorporated environmental governance into the performance evaluation system of local officials for local officials, prompting local officials to have more motivation to pay attention to environmental protection. Local officials who have been promoted, in order to cater to the preference of the higher-level government and implement the orders of the higher-level government, have greater motivation to improve the quality of the city’s environment and then achieve new environmental governance goals. Zheng and Kahn [14] found that the energy consumption of urban unit GDP and ambient air pollution have been related to the chance of officials’ promotion. In addition to the top-down pressure from central environmental protection, local governments also face bottom-up pressure from citizens and communities. With the increase of Internet users, people find it easier to obtain accurate pollutant information in a timely manner. Concerns about environmental degradation can easily spread online and cause people’s dissatisfaction, and local governments must respond to people’s voices to ensure social stability. Kahn, Li and Zhao [12] found that officials’ green performance appraisal system, including environmental governance indicators, incentivize local governors to increase their effort to reduce water. Meng et al. [16] used the multiple linear regression model to determine the relationship between local officials’ characteristics and total carbon emissions and carbon emissions from different sectors. The results showed that the promotion incentives, tenure and age of local officials have a significant impact on total carbon emissions. Chen et al. [17] found that China’s promotion incentive is the motivation behind local officials’ decisions regarding the expansion of urban construction land, and a mayor or municipal party secretary transferred from another city will prefer larger-scale expansion of urban construction land than a locally promoted official during an early term in office.
The second aspect is the relationship between environmental regulation and urban environmental pollution. Due to the negative externalities of production activities and the non-renewability of traditional energy, it is particularly important for the government to take environmental regulation measures. The government enforces strict environmental regulation, such as limiting the amount of pollution discharged by companies during production, levying pollution charges and environmental taxes [18,19]. The government can effectively reduce the company’s dependence on fossil fuels and reduce environmental pressure by including the strengthening of the use of renewable energy and the improvement of energy efficiency in urban planning [20,21]. Cheng et al. [22] and Xie et al. [23] both pointed to China that strengthening environmental regulation intensity can effectively improve environmental quality. Zhang, Li, Uddin and Guo [7] found that environmental regulation can increase carbon emissions in the short term, but with the improvement of environmental supervision, environmental regulations have reduced carbon emissions and improved environmental quality in the long term. By comparing the impact of formal and informal environmental regulations on environmental pollution, Fu [24] found that formal environmental regulation plays an important role in reducing environmental pollution. Du and Li [25] proved the effectiveness of environmental policies from a micro perspective, that is, environmental regulation can limit the pollution emissions of Chinese industrial enterprises. Zhao et al. [26] took carbon-intensive industries as the survey object and found that environmental supervision can reduce environmental pollution by increasing production costs or applying environmental technologies. Governments can increase the production costs and pollution control costs of enterprises through market-incentive environmental regulation, such as levying environmental taxes and emission trading systems to reduce pollution emissions [19,27,28]. Moreover, some scholars have studied the impact of environmental regulation on environmental pollution through industrial structure [29], foreign direct investment [7] and technological innovation [27,30,31]. However, Sinn [32] has questioned the effectiveness of environmental supervision policies. He believed that imperfect environmental regulations will accelerate the consumption of fossil energy in the short term, leading to a further increase in environmental pollution.
Extensive researches have been carried out to test how environmental regulations or officials’ promotion incentives affect environmental pollution, which provide abundant research perspectives and methods for this paper. Nevertheless, some research gaps exist. First, the few studies have discussed the synergistic effects of officials’ promotion incentives and environmental regulations on urban environmental pollution until now. Local officials promoted in China’s political promotion system have greater motivation to reduce environmental pollution by strengthening environmental regulations to achieve compliance with these new environmental goals. The interaction of environmental regulations and promotion incentives for local officials may be more conducive to improving the efficiency of enterprise resource utilization and reducing environmental pollution. Second, the existing literature often ignores spatial spillover effects, which may lead to errors or biasness in the estimation and analysis process [33,34]. Third, the reality of economic development level, environmental regulation intensity, and environmental pollution among different regions and city sizes are in large differences. Based on these considerations, this study extends the present research by adopting city-level data to analyze the direct and spatial spillover effects of environmental regulations, officials’ promotion incentives and their intervention terms on urban environmental pollution at national, regional and city scales.
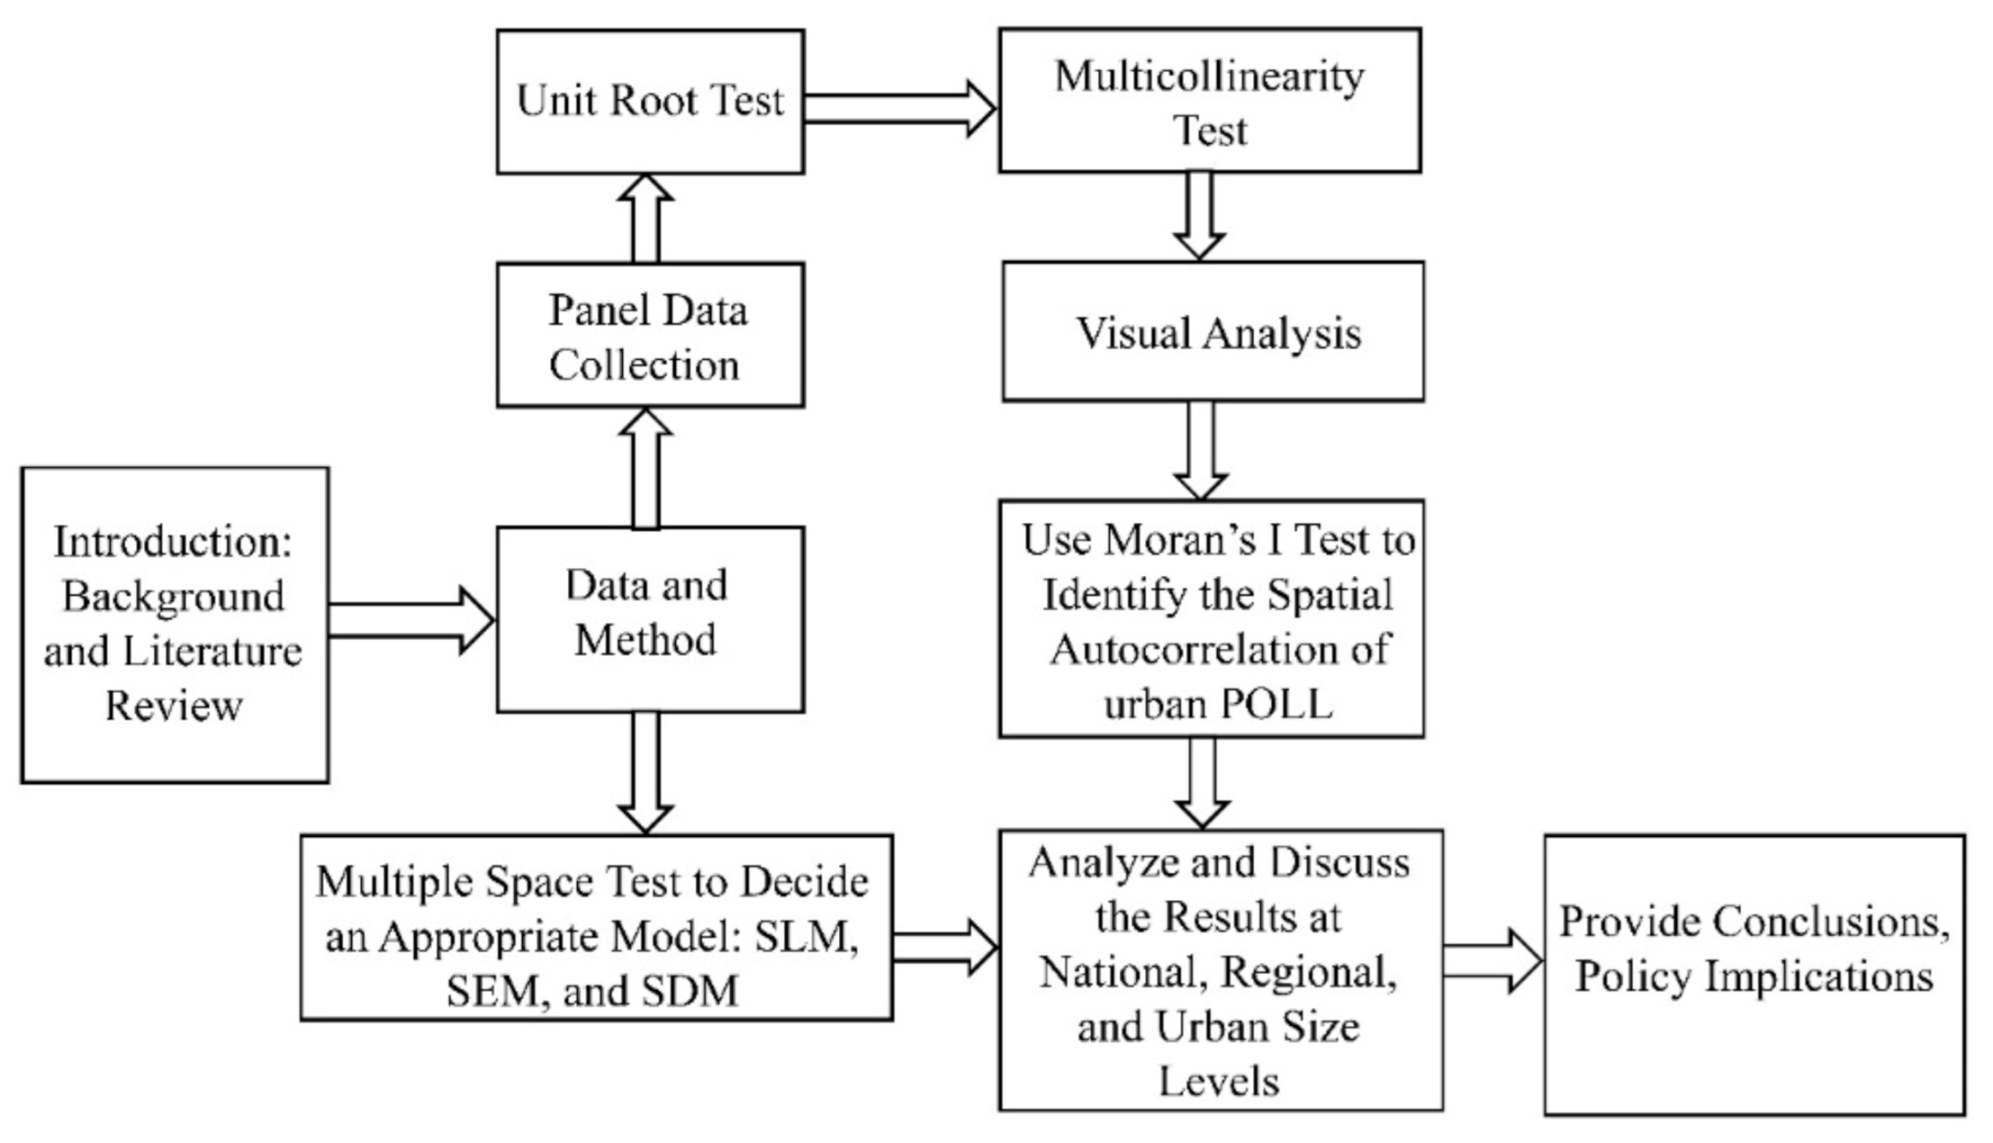
As a result, this paper has fourfold advantages over the existing literature. First, the new index of urban environmental pollution proposed by the entropy weight method can comprehensively compare the level of urban environmental pollution during the research period. Second, this paper explores the synergistic effects of officials’ promotion incentives and environmental regulations on urban environmental pollution, which bridges the gap between theory and practice by providing a profound vision of spatial econometrics. Our study is one of the first that integrates some major influencing factors in a model to discuss their mutual relationships and analyzes how these factors affect the implementation of urban environmental pollution. Third, this study utilized a panel data compositing of 266 Chinese cities for the period of 2005–2016, which makes it more accurate to capture spatial spillover effect than most of previous studies using provincial panel data. Last but not least, given the consideration of spatial heterogeneity across different regions and urban sizes, the sample cities are divided into three groups, and corresponding estimations have been conducted. The graphical flow chart can visually show the research steps of this paper (Figure 1).

3. Methodology

3.1. Spatial Autocorrelation Test

The spatial autocorrelation for environmental pollution has been identified by used the global Moran’s I index [35]. The calculation formula of the global Moran’s I index is as follows:
I = n i = 1 n j = 1 n W ij ( x i x ¯ ) ( x j   x ¯ ) i = 1 n j = 1 n W ij i = 1 n ( x i x ¯ ) 2 ,
where n is the number of cities, x i and x j represent the observed environmental pollution of city i and city j , and x ¯ refers to the average environmental pollution value of all the cities. W ij indicates the spatial weight matrix. The range of global Moran’s I is between −1 and 1. When the value is greater than 0, the spatial autocorrelation is positive, and the higher value implies that stronger spatial autocorrelation exists; conversely, when the value is less than 0, the spatial autocorrelation is negative, and the closer the value is to −1, the greater the negative autocorrelation. When the value is close to 0, there is no spatial autocorrelation between cities.
Local spatial autocorrelation can be usually measured by the Moran scatterplot and Local Indicators of Spatial Association (LISA). The Moran scatterplot consists of four quadrants. The first and third quadrants show positive spatial autocorrelation, and the second and fourth quadrants show negative spatial autocorrelation. The first quadrant is high—high agglomeration quality, which is highly-polluted cities surrounded by other cities with severe pollution, whereas the third quadrant is low—low agglomeration quality, which is low-pollution cities surrounded by other cities with low pollution. The second and fourth quadrants are low—high and high—low agglomeration quality, respectively, reflecting that the cities and their adjacent regions have opposite pollution attributes. LISA is often measured by local Moran’s I [36], which is defined as below:
I = x i x ¯ S 2 j i W ij x j x ¯ ,
where S 2 = i x i x ¯ 2 / n ; n , x i , x j , x ¯ , W ij have the same meanings as Formula (1).

3.2. Spatial Economic Models

The spatial panel regression models were constructed to investigate the spatial effect for urban environmental pollution. The spatial error model (SEM), the spatial lag model (SLM) and the spatial Durbin model (SDM) are commonly utilized spatial economic models to investigate the spatial dependence for urban environmental pollution, which were constructed as follows:
SLM:
l n P O L L i t = β 1 l n E R i t + β 2 l n P R O i t + β 3 l n E R i t l n P R O i t + β 4 P G D P i t + β 5 P O P i t + β 6 I S i t + β 7 F D I i t + ρ W l n P O L L i t + u i + λ t + ε i t
SEM:
l n P O L L i t = β 1 l n E R i t + β 2 l n P R O i t + β 3 l n E R i t l n P R O i t + β 4 P G D P i t + β 5 P O P i t + β 6 I S i t + β 7 F D I i t + u i + λ t + ϕ i t ;   ϕ i t = η W ϕ i t + ε i t
SDM:
l n P O L L i t = β 1 l n E R i t + β 2 l n P R O i t + β 3 l n E R i t l n P R O i t + β 4 P G D P i t + β 5 P O P i t + β 6 I S i t + β 7 F D I i t + θ 1 W l n E R i t + θ 2 W l n P R O i t + θ 3 W l n E R i t l n P R O i t + θ 4 W P G D P i t + θ 5 W P O P i t + θ 6 W I S i t + θ 7 W F D I i t + ρ W l n P O L L i t + u i + λ t + ε i t
where, W denotes the spatial weight matrix; β represents the direct effect coefficient for the independent variable. θ represents the indirect effect coefficient of the independent variable. ρ represents the coefficient of spatial correlation. λ t refers to the time fixed effect, u i stands for the space fixed effect. ε i t measures a random error vector, satisfying ε i t ~ N 0 , δ i t 2 .   η denotes the effect of error vector for dependent variable on adjacent cities.
SLM measures the effect of environmental pollution in adjacent cities on environmental pollution in local cities. SEM reflects the effect of other factors besides independent variables of adjacent cities on environmental pollution of local cities. Spatial dependence of urban environmental pollution and spatial spillover effects of independent variables simultaneously are explored via SDM [37]. Lesage and Pace [38] verified the average spillover effect of regional independent variables in adjacent cities from the perspective of partial differential decomposition. The direct and indirect effects of officials’ promotion incentives, environmental regulations, and their interaction terms on urban environmental pollution are investigated in this paper. Specifically, the direct effect is the effect of the independent variable in local cities on environmental pollution in local cities, and the indirect effect is the effect of the independent variable in adjacent cities on environmental pollution in local cities.

3.3. Spatial Weight Matrix

Generally, the spatial weight matrix is constructed based on the geographical correlation [22,35]. Therefore, the inverse distance spatial weight matrix is constructed as follows:
W = 1 d i j ,   i f   i j 0 ,   i f   i = j
where d i j   i j denotes the centroid distance among cities.

3.4. Model Test

First, this research utilizes two Lagrange multiplier (LM) tests, which are LM lag test and LM error test, to determine whether to choose SLM or SEM [25,39]. According to the LM test results, a significant spatial economic model is selected. If the LM test results are all significant, SDM should be selected. The Wald or likelihood ratio (LR) test is performed to determine whether SDM can be reduced to SLM or SEM.

4. Data

The research object of this paper is 266 cities of China, spanning from 2005 to 2016.

4.1. Dependent Variable

Environmental pollution (POLL): in China, the most prominent pollution problems are water pollution and air pollution, which are closely related to industrial production activities. The existing researches on environmental economics generally consider a specific pollutant as the indicator of environmental pollution; however, most of them lack a comprehensive evaluation of various pollutants [40]. In order to measure urban POLL comprehensively, a more comprehensive environmental pollution index that combines air pollution and water pollution is needed [41]. At the prefecture-level city level, due to data availability, we can only obtain the total amount of industrial waste water discharge, and industrial sulfur dioxide and industrial soot (dust) emission [42]. Therefore, the entropy weight method is used to integrate these three indices into the comprehensive environmental pollution index to conveniently compare the environmental pollution level of different cities. The greater the index value, the greater the intensity of urban POLL.

4.2. Core Independent Variable

Environmental regulation (ER): ER is generally regarded as an important means for the government to develop economic and environmental benefits and promote technological progress [43]. However, different ER tools have different economic and environmental benefits. Most of the existing literature uses a single indicator to measure ER, such as number of environmental policies [44], the discharge load of a certain pollutant [36,45], the emission density for a certain pollutant [46], or per capita income level [47]. However, a single indicator cannot measure the intensity of ER comprehensively and accurately. Following previous relevant studies, like Song et al. [48], the following five indicators are selected, and the entropy method is used to calculate a comprehensive indicator of ER for prefecture-level cities in China.
Referring to Song, Zhao, Shang and Chen [48], we chose the following five indicators to calculate a comprehensive index of ER by using the entropy method for 266 prefecture-level cities in China from 2005 to 2016: (1) removal rate of industrial fumes, calculated by dividing the removal amount of industrial fumes by the production amount of industrial fumes; (2) removal rate of industrial sulfur dioxide, calculated by dividing the removal amount of industrial sulfur dioxide by the amount of produced industrial sulfur dioxide; (3) domestic sewage treatment rate; (4) comprehensive utilization rate of industrial solid waste; and (5) harmless disposal rate of domestic waste.
Local officials’ promotion incentives (PRO): In China’s local political system, local officials include the mayor, who is in charge of administration, and the municipal party secretary, who manages party affairs. According to relevant research by He and Sun [49], their different responsibilities mean that the mayor has more specific responsibility than the municipal party secretary on decisions regarding economic development and management. Therefore, to some extent, the mayor may have more impact on urban POLL if he/she chooses to become involved.
The PRO variable of our research is the promotion result of each mayor with position change, which is defined as a dummy variable with a value of 1 or 0. If the mayor of prefecture-level city is promoted, PRO is 1; otherwise, it is 0. Another key question is when a position change is regarded as a promotion. According to the Law of the People’s Republic of China on civil servants and previous literatures (e.g., [10], we define promotion incentives for local officials as follows: (1) Mayor of prefecture-level city promoted to Municipal Party Committee Secretary of this city/other prefecture-level city; (2) Mayor of prefecture-level city promoted to Mayor or Municipal Party Committee Secretary of deputy provincial city; (3) Mayor of prefecture-level city promoted to full posts in departments under ministries and commission under the state council; (4) Mayor of prefecture-level city promoted to a position at or above provincial or ministerial level in this province or another province (Governor, Vice Governor, Standing Committee Member of Provincial Party Committee, Assistant Governor); (5) Mayor of prefecture-level city promoted to other central provincial and ministerial level deputy post or above. It should be noted that if the appointment date is before the end of June, the term of office is counted from the beginning of the year the officer is appointed [17]. After that date, the term is calculated starting the following year.

4.3. Control Variables

In order to eliminate changes in empirical results caused by ignoring other variables, some research-related control variables were introduced into this paper, including:
Economic growth (PGDP): The possible effect of PGDP on POLL is reflected in two aspects. On the one hand, rapid economic growth requires a large amount of energy consumption to support. The higher the level of economic development means more energy consumption and more pollutant emissions [50]. On the other hand, with the continuous development of the economy, the formation of scale economy and the enhancement of people’s awareness of environmental protection contribute to energy conservation and emission reduction [51]. We use per capita GDP as the measurement of the economic growth level in this paper. To eliminate the effect of inflation, we take 2005 as the base year and convert the nominal GDP to real GDP to ensure data comparability.
Population (POP): urban population is the main terminal consumer, and the growth of its size directly drives the growth of urban energy demand and therefore aggravate POLL. As the urban population increases, a large number of energy intensive products such as steel and cement were consumed for infrastructure construction, and housing, leading to a large number of pollutant emissions. In this paper, year-end total population in the municipal district of prefecture-level cities is used to represent urban population size.
Foreign direct investment (FDI): FDI can reflect the opening degree. However, FDI may have two different effects on the environment. On the one hand, FDI may reduce the POLL by bringing in advanced technology [40]. On the other hand, FDI may lead to the deterioration in environmental quality by transferring pollution industries from foreign to domestic in the light of the pollution haven hypothesis [52]. Referring to Chen, Sun, Lan and Jiang [42], we choose the proportion of FDI to GDP as a proxy indicator of FDI, using the average exchange rate of RMB against the US dollar in current year for conversion.
Industrial structure (IS): With the development of the economy, the decline of the proportion of the secondary industry in the national economy and the rise of the proportion of the tertiary industry, the industrial structure will be gradually optimized and upgraded, and the constraints and pressure on the resources and environment will be alleviated [53]. The proportion of the added value of the tertiary industry to the added value of the secondary industry is used as an indicator of industrial structure in this paper.

4.4. Data Source

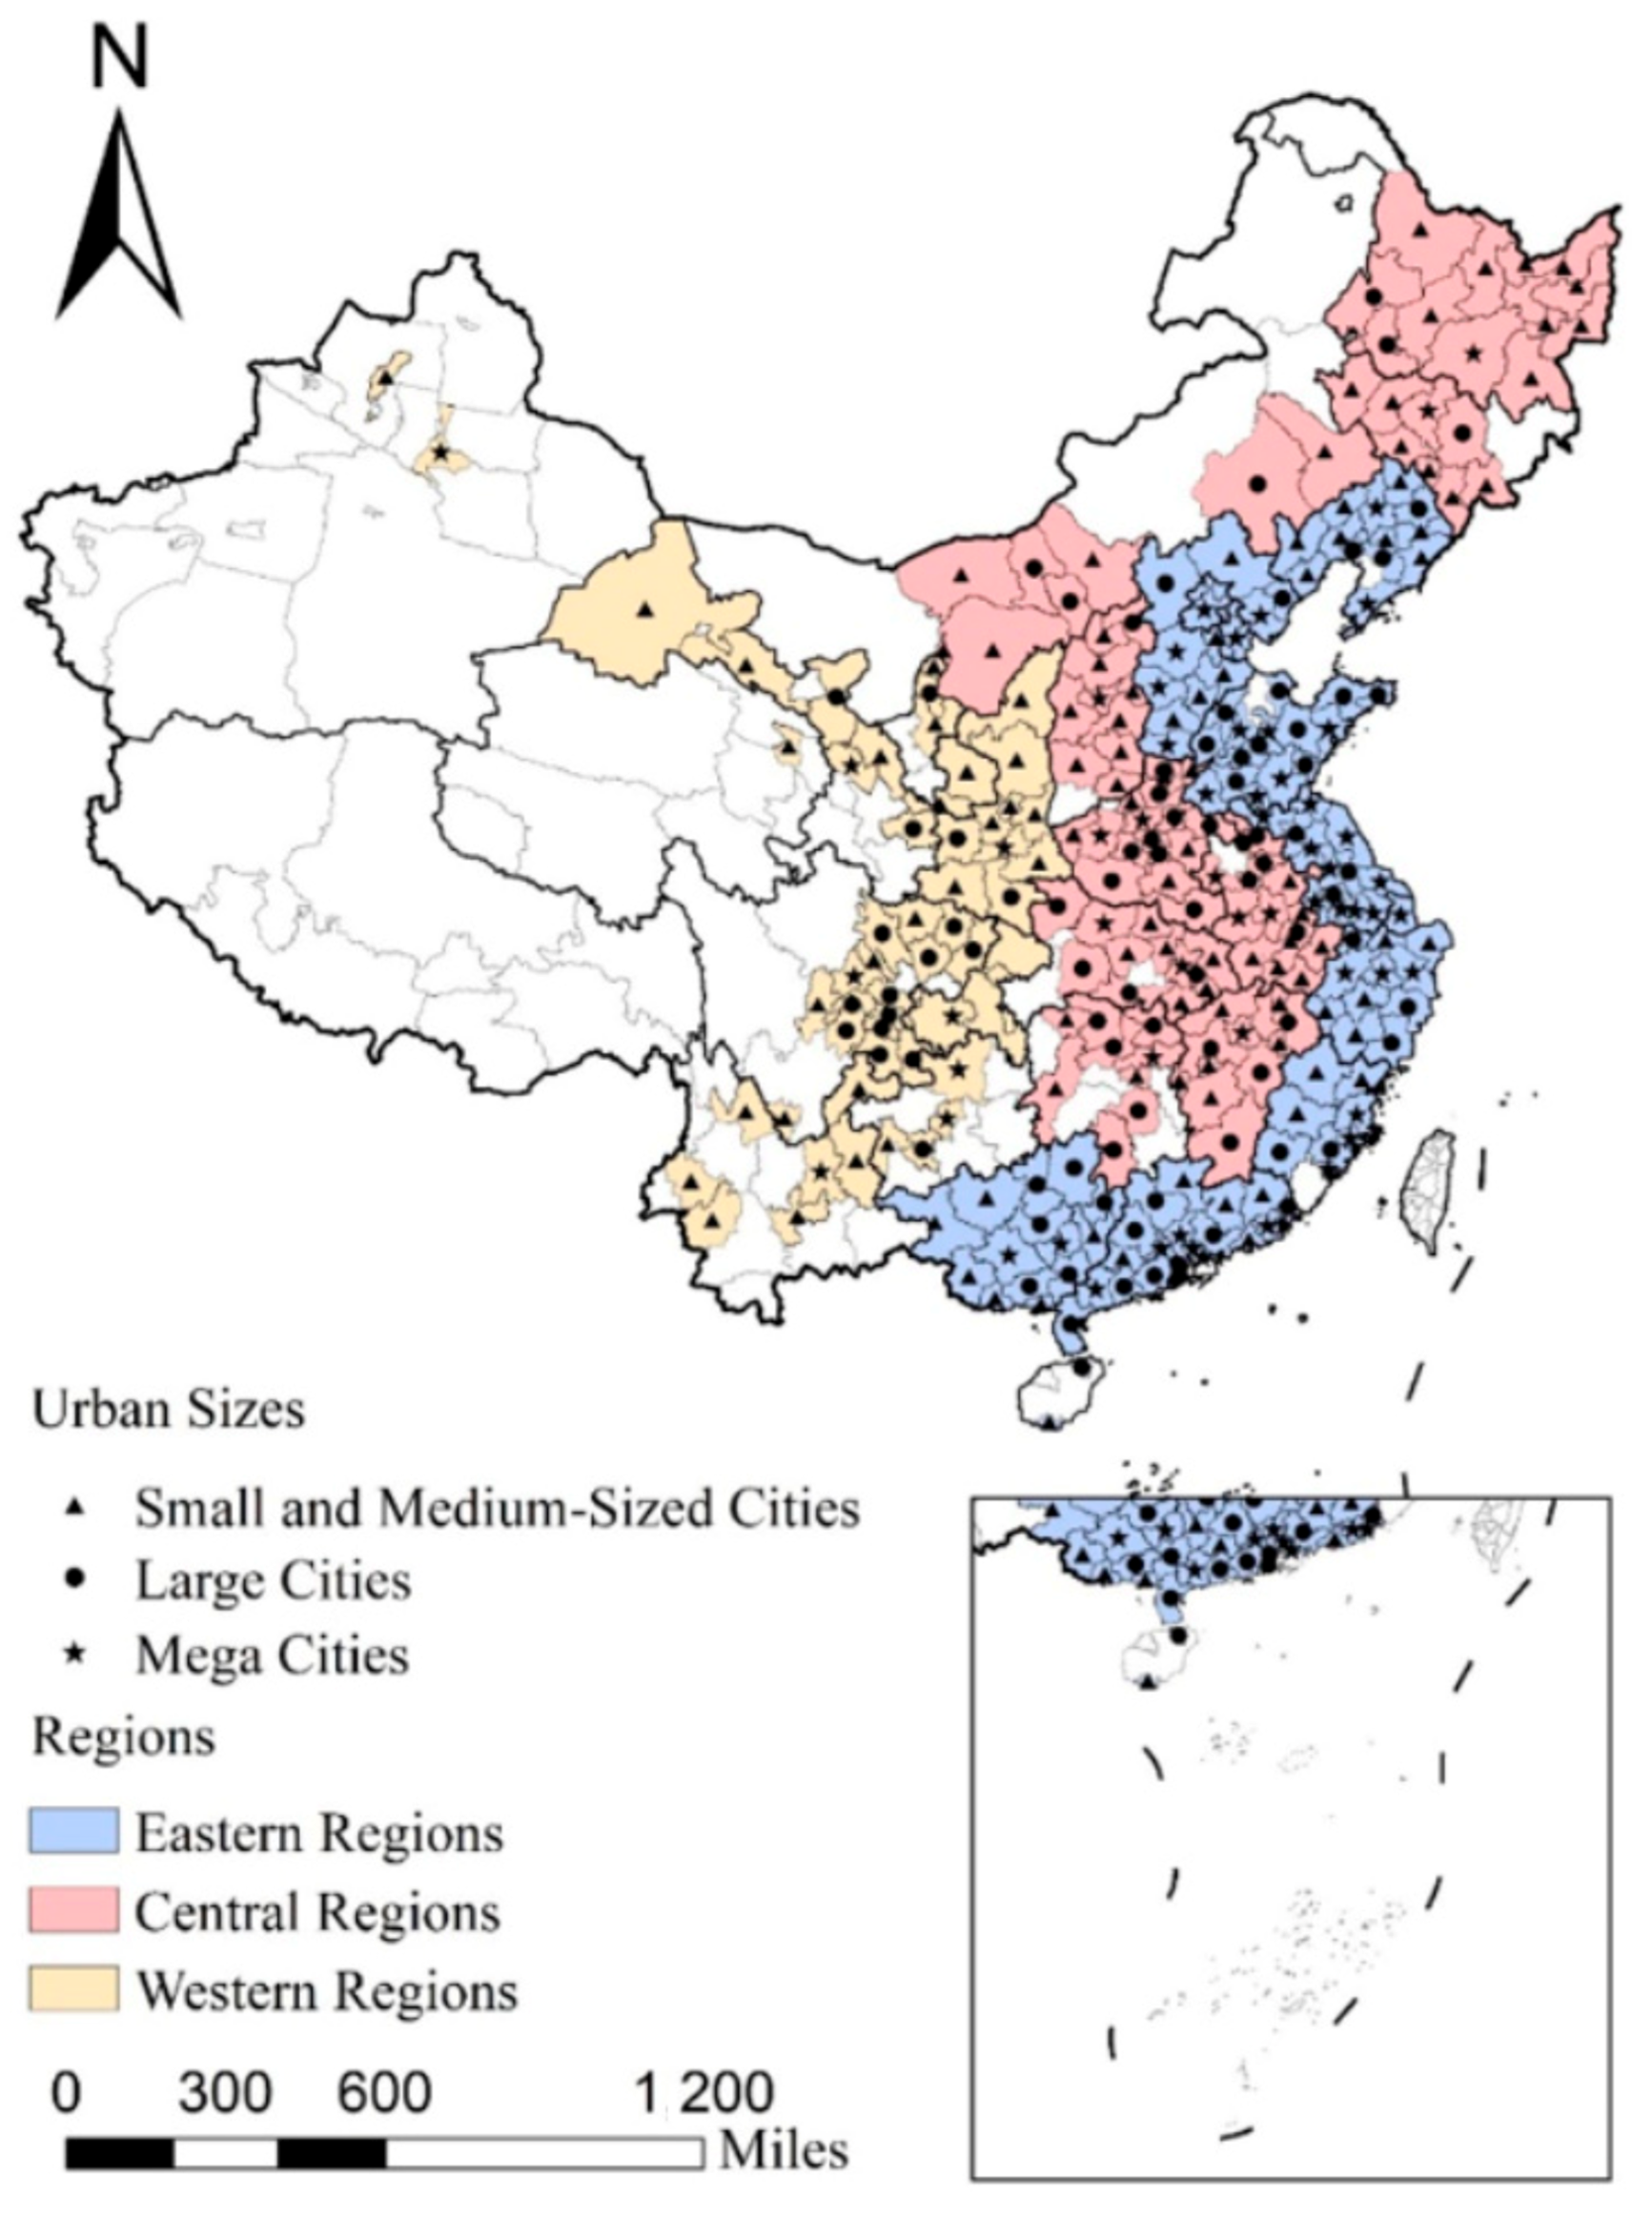
The data of ER and POLL, as well as the indicators of prefecture-level cities (e.g., GDP per capita, total population, FDI, and industrial structure) were collected from China City Statistical Yearbook (2006–2017). The data of exchange rate were obtained from China Statistical Yearbook (2006–2017). The data on the officials’ promotion incentives comes from the annual resume of each official (www.baidu.com (accessed on 1 February 2021)). We used the data in the period of 2005–2016 for the following three reasons (Figure 2). First, the central government clearly proposed the assessment of officials’ environmental performance as one of the criteria for their appointment and promotion in 2005 [14]. Second, as is shown in Figure 3, obvious increases have appeared in the intensity of environmental regulation since 2005, which indicates that the work of environmental supervision has made substantial progress in China. Third, 2005 is the last year of the 10th Five-Year Plan and 2016 is the first year of the 13th Five-Year Plan, which is the key period when the Chinese government paid increasing attention to energy conservation and environmental protection [54]. It should be noted that the research period of this paper covers the implementation phases for China’s 11th and 12th Five-Year Plan. In addition, we excluded Tibet and some other cities because of data missing. After screening, we obtained 3192 observations from 266 cities in these 12 years. Table 1 shows the descriptive statistics of all variables. In this paper, the Stata 15.1 software was utilized to carry out the multi-collinearity test, units root test and global Moran’s I index test. The Matlab R2018b was utilized to carry out the regression estimations in the empirical study.
In order to verify multicollinearity, this research investigated the correlation between selected variables. It can be seen from Table 2 that the correlation between variables is low. In addition, this paper also calculates the variance inflation factor (VIF) of all variables. Table 2 show that the VIF values of all variables are less than 2. Hence, there is no multicollinearity between the selected variables.
Moreover, in order to reduce pseudo-regression, it is necessary to identify the stationarity of the panel data set by using units root test. Specifically, the four most commonly used tests were performed (i.e., LLC test, IPS test, ADF-Fisher test, and PP-Fisher test), whose results are provided in Table 3. Overall, the panel unit root test results show that there is no evidence for the existence of a unit root for any selected variables, as the statistics for all variables in level are statistically significant (at least at the 5% significance level, and most are at the 1% level). Because the null hypothesis for all of these four panel unit root tests is that the unit root exists, the test results suggest no unit root for all variables in the statistical sense. In this regard, the regression estimations conducted later are meaningful and would not suffer from spurious regressions.
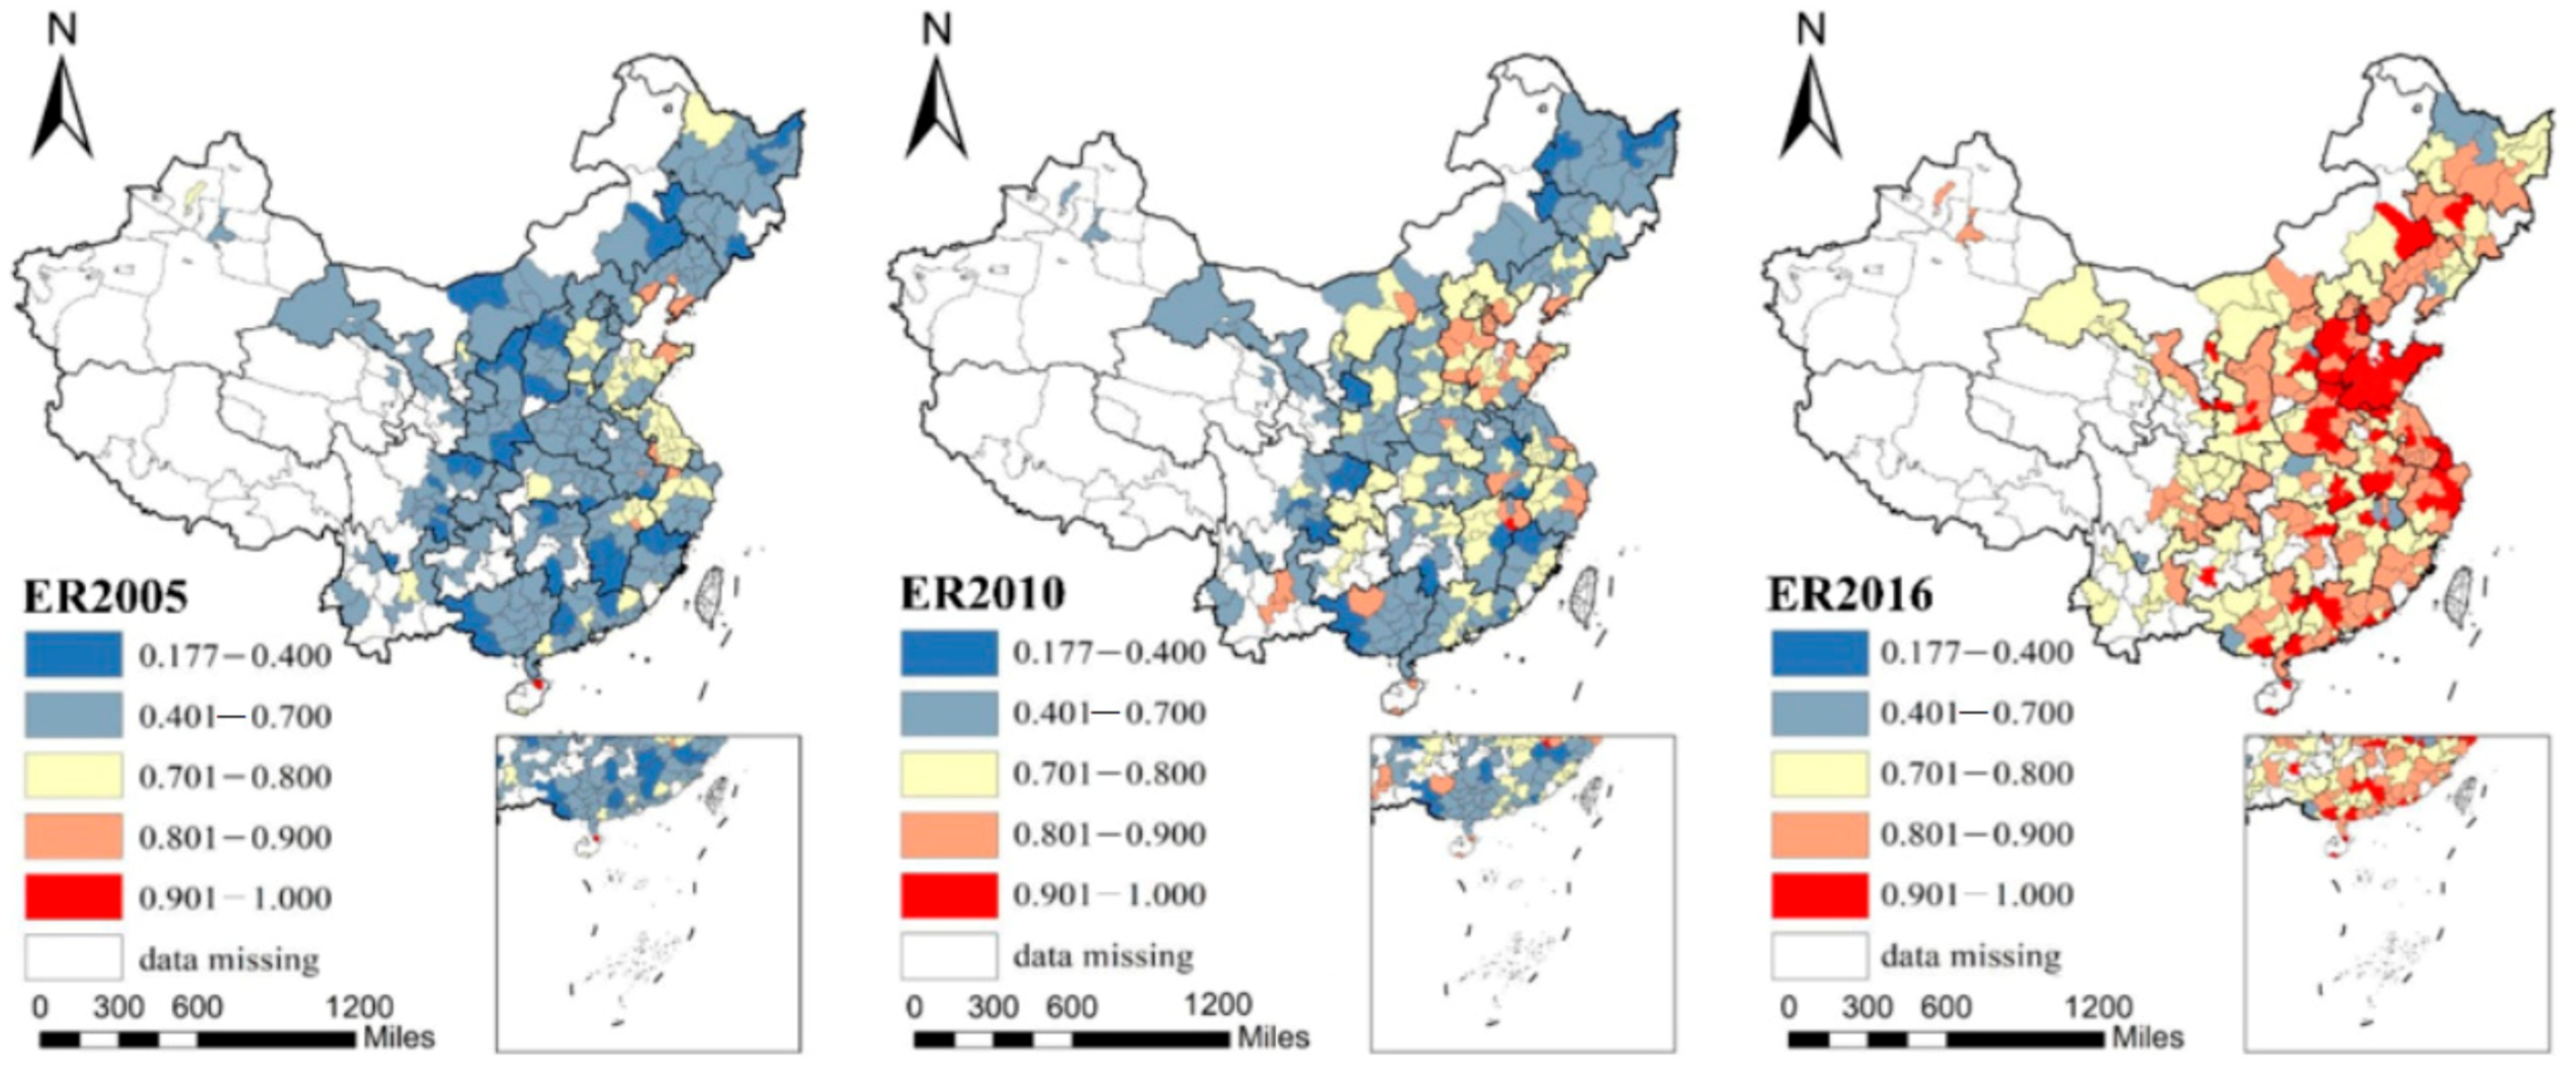
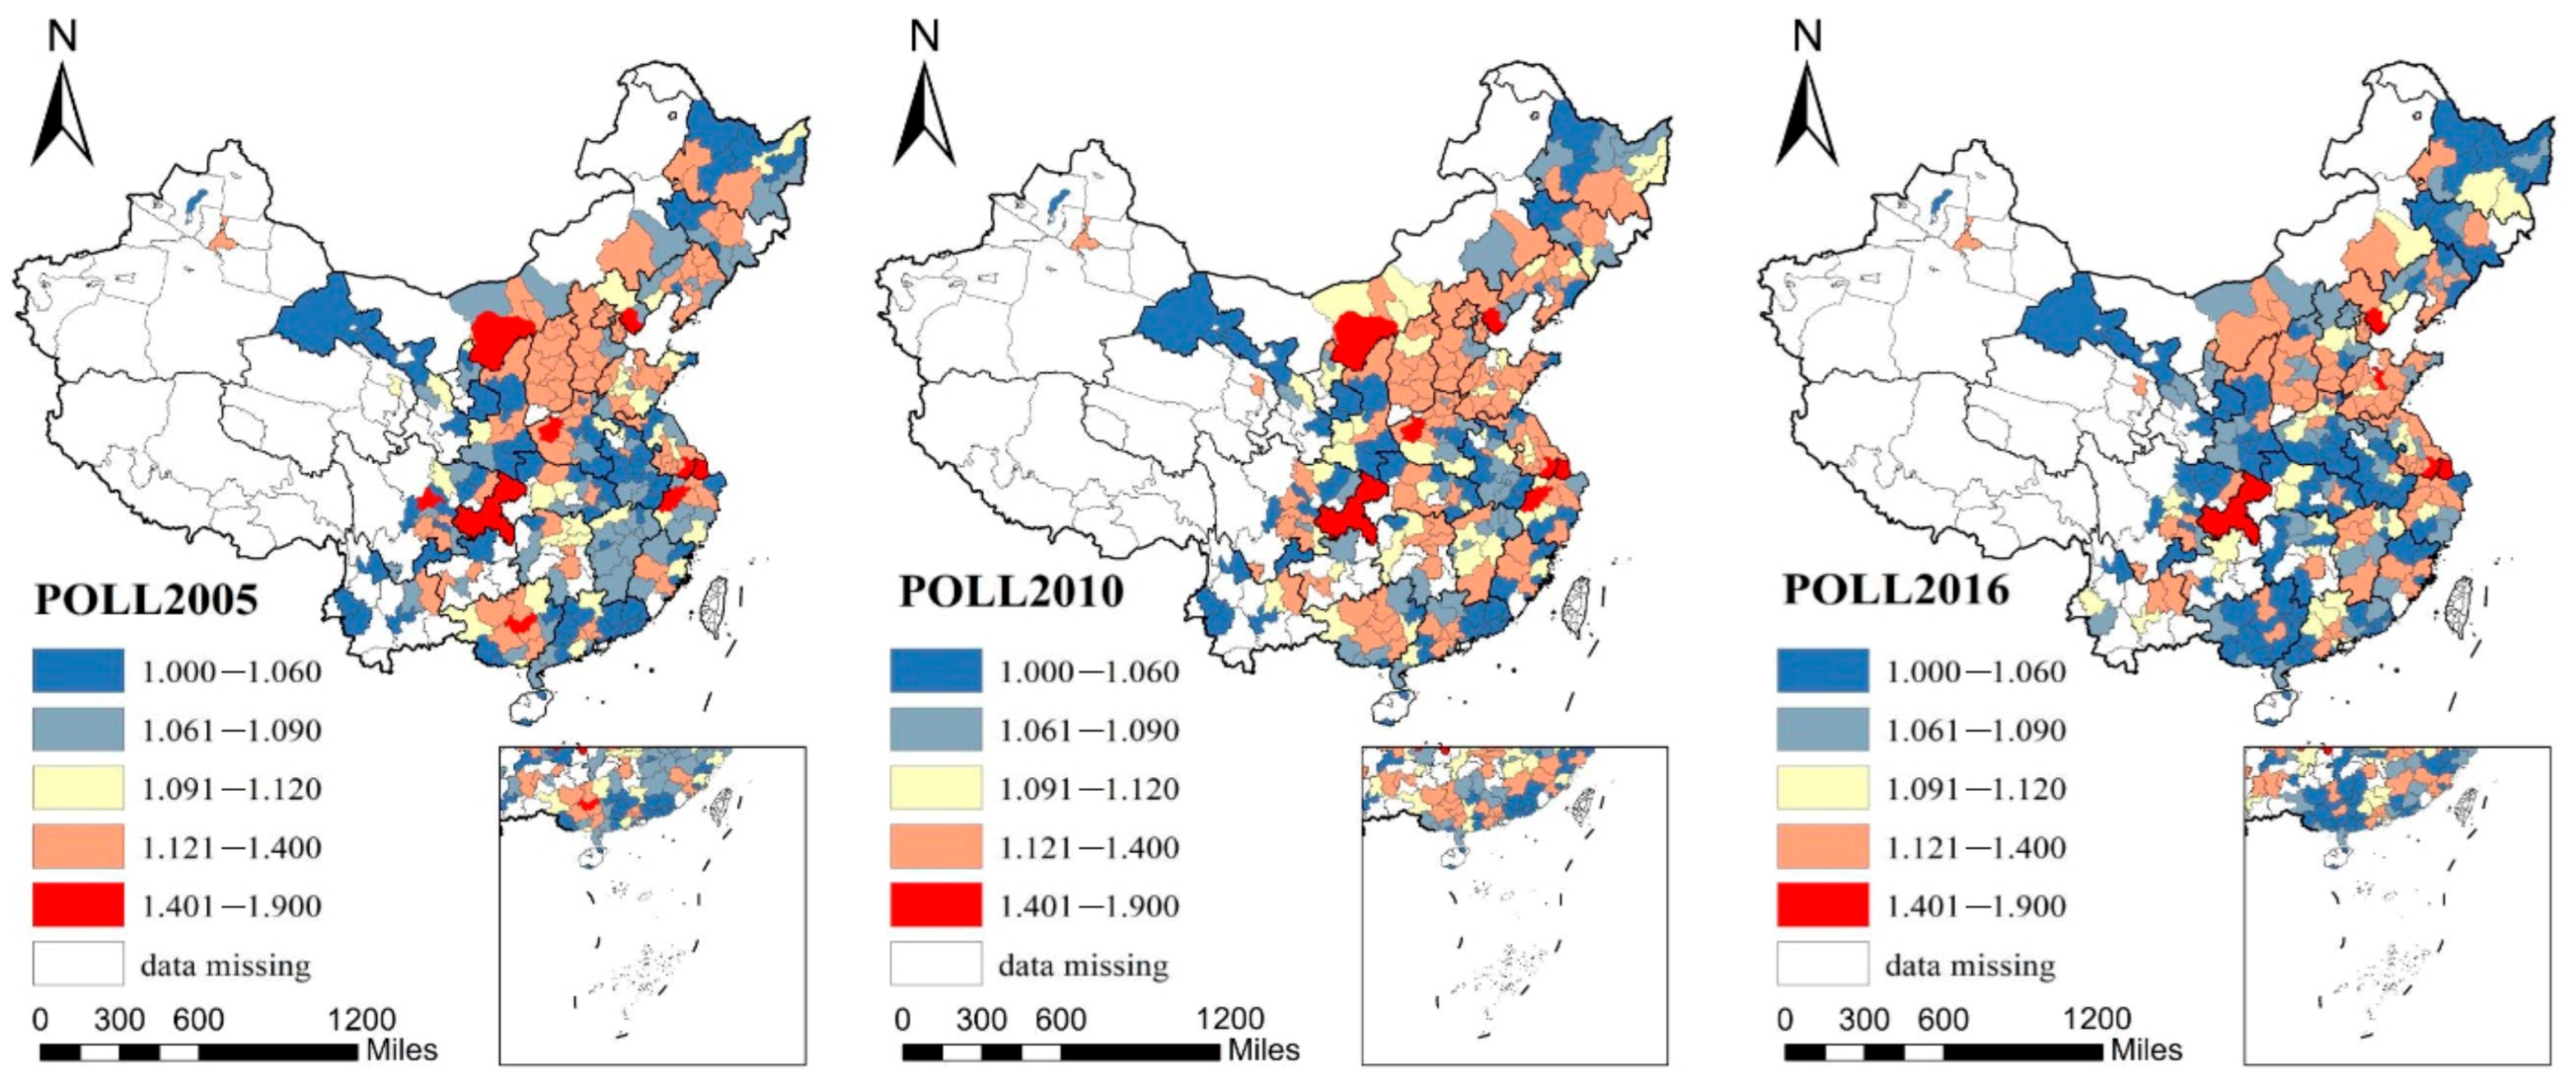
Figure 3 and Figure 4 reflect the spatial distribution of ER and urban POLL from 2005 to 2016 in China. Figure 3 indicates the overall level of ER in China presented a significant upward trend, and the level of ER in the southeastern coastal cities was higher than that in the central and western cities. The economic development of the eastern coastal areas is dominated by industry. In 2007, the State Council issued the “11th Five-Year Plan for National Environmental Protection.” One of the goals of this policy is to reduce sulfur dioxide emissions. For industrial sectors with serious pollution, local governments adopted a series of strict environmental supervision measures. By 2016, the level of urban ER had been greatly enhanced. Figure 4 shows the overall urban POLL in China, having presented a significant and stable downward trend, and the areas with the most serious urban POLL have been decreasing. This means that the “11th Five-Year Plan for National Environmental Protection” and the “12th Five-Year Plan for National Environmental Protection” formulated by the Chinese government have achieved remarkable results. During the observation period, the urban POLL in western China was lower than that in the North China Plain and the eastern coastal areas. The reason is the relatively low level of urbanization and industrialization in western China. These results indicate that there is spatial inequality in ER and urban POLL in China.

5. Results and Discussion

5.1. Global Spatial Autocorrelation

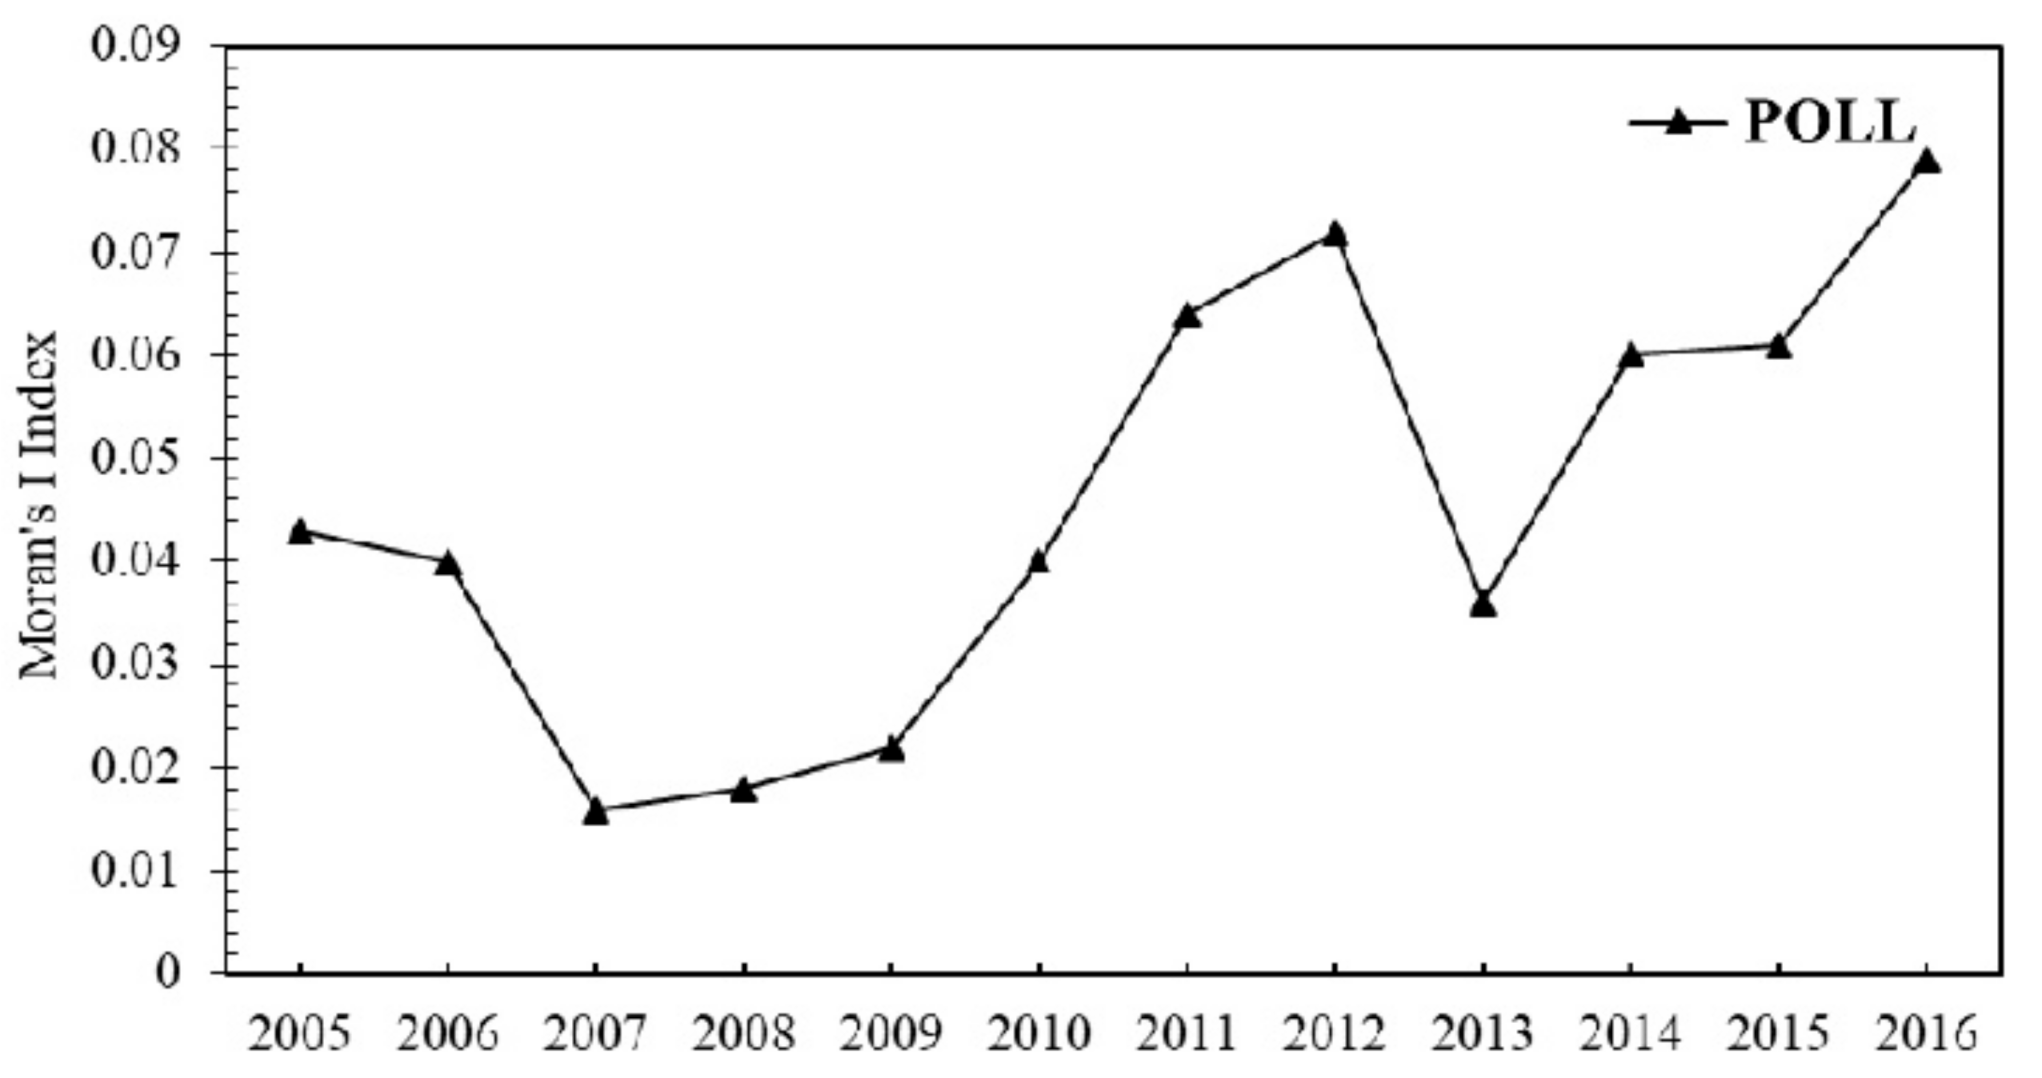
The positive spatial autocorrelation of urban POLL variable has been exhibited in Figure 5. The global Moran’s I index of urban POLL variable was positive at the 1% significance level, which indicates that urban POLL has spatial correlation characteristics. That is, increasing the urban POLL in adjacent cities can bring along urban POLL in local cities. The reason is that urban POLL can be transferred or spread to adjacent cities through industrial transfer, atmospheric flow, industrial wastewater flow, and investment competition among local governments. Under the inverse distance spatial weight matrix, the global Moran’s I index for urban POLL variable presented a wave-like upward trend, spanning from 2005 to 2016. This indicates that the spatial autocorrelation of urban POLL variable has experienced an enhancement process.

5.2. Local Spatial Autocorrelation

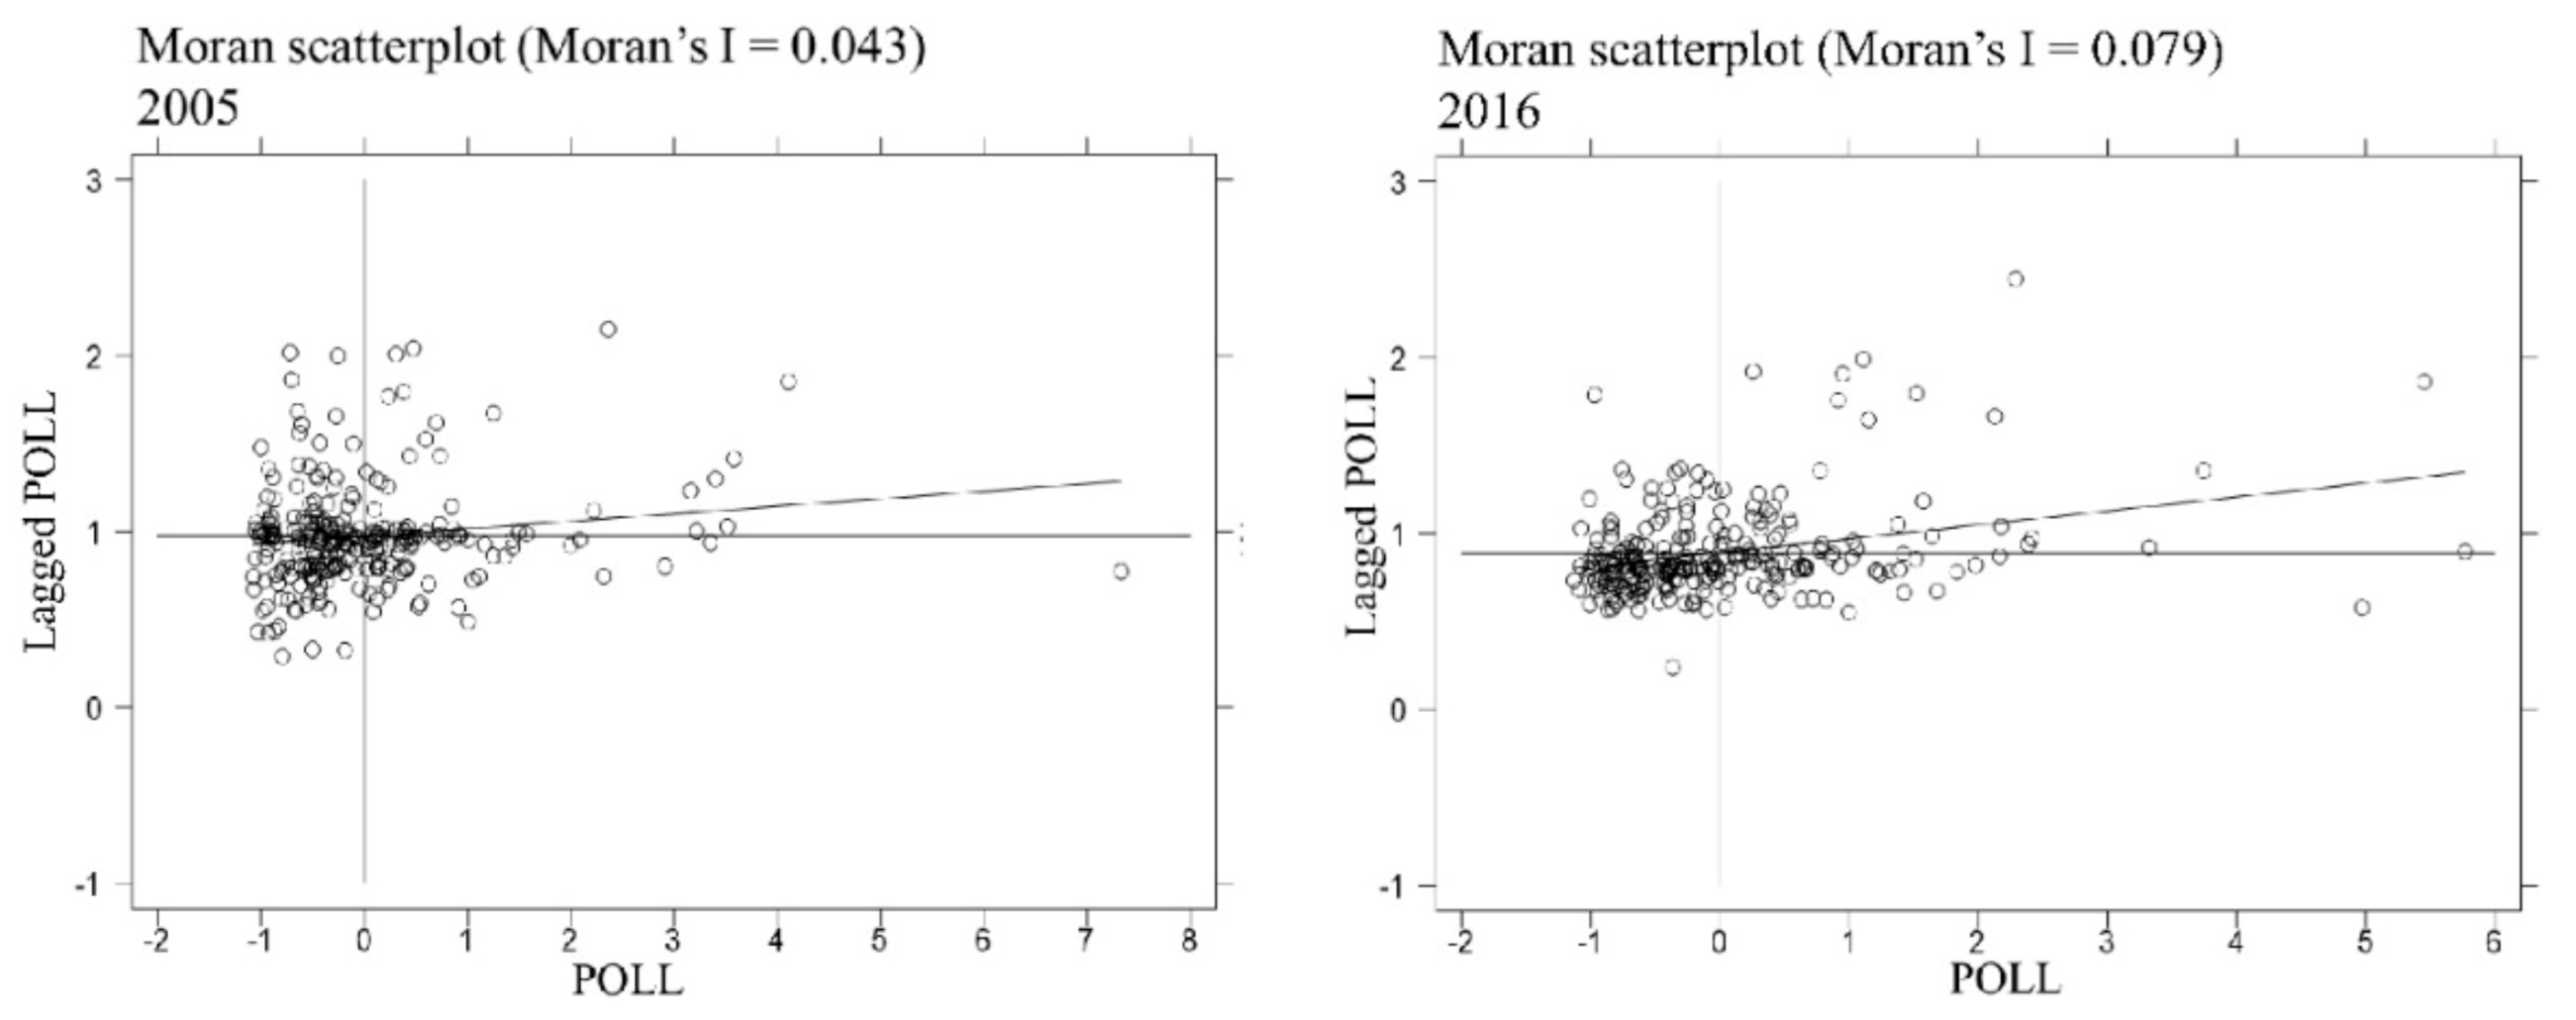
Figure 6 presents the Moran Scatterplot of urban POLL in China in 2005 and 2016. The horizontal axis of the diagram is the POLL value of the city, and the vertical axis is the spatial lagged term of the POLL value. As shown, most of the cities are distributed in the first and third quadrants, and, from 2005 to 2016, the cities in the second and fourth quadrants decreased obviously.
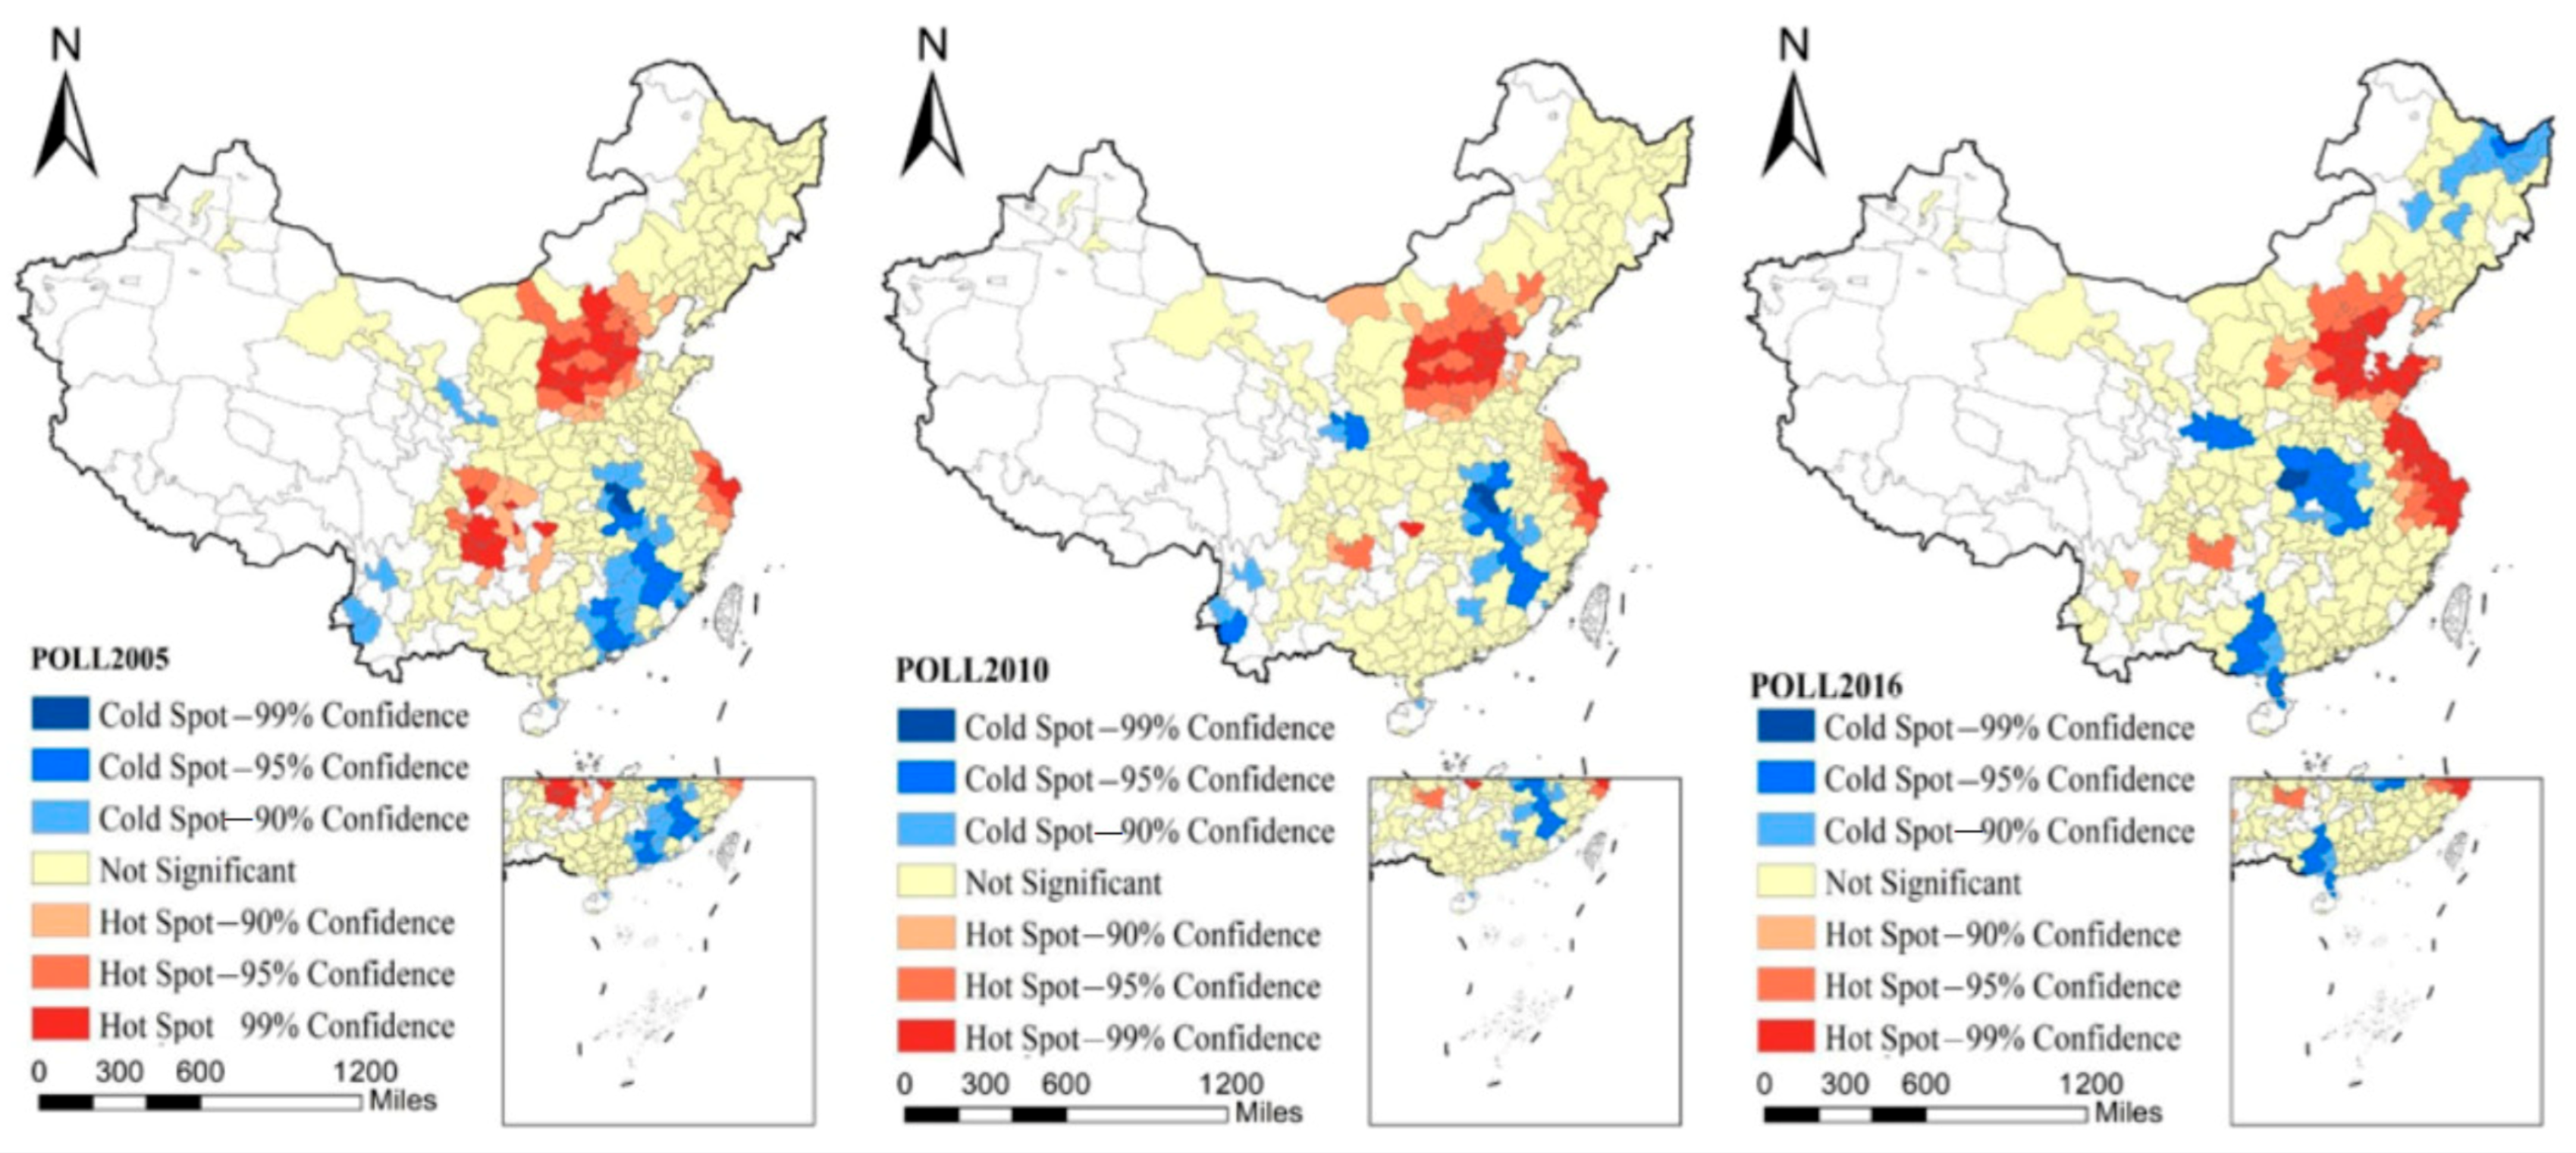
The local Moran’s I scatter plot can examine the spatial agglomeration characteristics of 266 cities in China, but it cannot reflect the heterogeneity of spatial agglomeration. Therefore, this study uses the Getis-Ord index proposed by Getis and Ord [55] to explore the heterogeneity of urban POLL spatial agglomeration. Figure 7 shows the “hot spot” and “cold spot” cities of POLL from 2005 to 2016, which refer to regions with high-high (H-H) clustering of POLL and low-low (L-L) clustering of POLL, respectively. The results show that the L-L clusters in southern China have gradually shifted from south to north. Many cities in Fujian and Guangdong provinces have almost completely withdrawn from the L-L clusters. However, during the observation period, the number of cities in the L-L clusters in the central regions increased, such as Hubei and Jiangxi provinces. H-H clusters in coastal cities in southeast China have gradually spread. The cities in the Beijing-Tianjin-Hebei regions and surrounding areas always belonged to the H-H clusters from 2005 to 2016, because these cities have higher political and economic status. This result shows that urban POLL is spatially dependent in China, and it implies that it is necessary to take spatial econometric models into consideration.

5.3. Analysis of Regression Results for National Sample

The model applicability test is conducted to find a suitable spatial econometric model (i.e., SDM, SLM, and SEM). The test results in Table 4 reflect that both LM and Robust LM are positive at the 1% significance level, indicating that there is a spatial effect in urban POLL. Meanwhile, the results of LR and Wald test are also significant at the level of 1%, denoting that SDM should be selected. Moreover, the results of Hausman test represent that the fixed effect should also be chosen for regression estimation. Therefore, this research finally used the SDM under the fixed effects of time and space to empirically investigate the effects of ER, PRO and their interaction terms on urban POLL. The estimation results of SDM under the inverse distance spatial weight matrix at the national level are reported in Table 5.
First, the direct effects of core variables are as follows. (1) The direct effect of ER on urban POLL is negative, representing that the implementation of ER has reduced the urban POLL during the research period. In order to achieve the coordinated development goal of urban economic growth and environmental protection, the Chinese government has formulated and implemented a series of environmental policies. The State Council issued the “11th Five-Year Plan for National Environmental Protection” and the “12th Five-Year Plan for National Environmental Protection” in 2007 and 2011, respectively, requiring the reduction of urban POLL. Therefore, local governments have adopted a series of strict environmental supervision measures for industrial areas with serious pollution. With the gradual strengthening of urban ER, the proportion of pollution control costs in the total cost of enterprises has gradually increased, which has severely weakened corporate profits. This has forced companies to improve production technology, eliminate high-pollution and high-energy-consuming industries, and develop low-pollution, low-energy-consuming industries, thereby effectively improving the quality of the urban environment. (2) The direct effect of PRO on POLL is negative, which shows that the PRO in the local cities can promote the improvement of local urban environmental quality. In recent years, the central government has stressed the importance of energy conservation and environmental protection in the process of economic development, in the context of a scientific outlook on development-oriented cadre evaluation system. The central government clearly proposed the assessment of officials’ environmental performance as one of the criteria for their appointment and promotion in 2005. The Ministry of Environmental Protection of China proposed the environmental governance accountability system and implemented “one vote no customization” for local officials in 2007. The “one vote no customization” means that the assessment results of environmental governance will be directly linked to the officials’ performance. Those officials who fail to complete the tasks of energy conservation and emission reduction will be held accountable. The central government has incorporated environmental governance into the performance evaluation system of local officials for local officials, prompting local officials to have more motivation to pay attention to environmental protection. For example, Huzhou City, Hangzhou City, and Lishui City have replaced the original GDP assessment with ecological protection and improvement of people’s livelihood. In order to achieve the performance evaluation goals of environmental protection, local officials who are promoted have more motivation to improve the quality of the urban environment and achieve new environmental governance goals. (3) The direct effect of the interaction between ER and PRO on POLL is negative in the national sample, which reflects that the PRO in the local cities has promoted the improvement of local environmental quality by strengthening ER in the local cities. On the one hand, the promotion of officials has encouraged local governments to increase the intensity of environmental regulations and accelerate the elimination of backward production capacity. Companies that fail to meet environmental technical standards will face the risk of closure or bankruptcy, which forces companies to improve green production levels and reduce urban environmental pollution. On the other hand, the promotion of officials has increased the environmental protection and technical skills of local investment promotion, and has triggered competition for talents among local governments. By vigorously developing strategic emerging industries and high-tech industries, the optimization and upgrading of the industrial structure will be promoted, and the improvement of urban environmental quality will be promoted.
Second, the indirect effects of core independent variables are as follows. (1) The indirect effect of ER on POLL is positive. Free riding does not exist in environmental regulation in the national sample. The spatial dependence of environmental regulation reduces the effectiveness of local environmental regulation. The industrial transfer caused by the difference level of environmental regulation can only reduce the pollution level of the moving-out area. By contrast, stricter environmental regulations in surrounding areas will aggravate air pollution in local area. It will have very limited impacts on improving the environmental quality. Therefore, local governments in urban agglomerations should propose more stringent environmental regulation and strengthen the joint prevention and control of air pollution at the regional level. (2) The indirect effect of PRO on POLL is negative, that is, increasing the official promotion in adjacent cities can reduce POLL in local cities. (3) The indirect effect of the interaction between ER and PRO on POLL is negative. The PRO in the adjacent cities has promoted the improvement of local environmental quality by strengthening ER in the adjacent cities.
Third, the direct effects of control variables are as follows. (1) The direct effect of PGDP on POLL is positive. The reason is that rapid development of China’s economy is at the cost of a large amount of fossil energy consumption and urban POLL. Therefore, it is necessary to promote the transformation of economic growth mode from extensive and resource-based to efficient and innovative. (2) The direct effect of IS on POLL is negative, indicating that with the development of tertiary industry and clean technology, the optimization and upgrading of the industrial structure has positive effects on pollution control. Therefore, strengthening the technological progress of the industrial sector, encouraging the development of the tertiary industry and promoting the upgrading of the industrial structure are of great significance to reducing urban POLL in China. (3) The direct effect of POP on POLL is positive, which indicates that the increase of urban population size has hindered the improvement of urban environmental quality in China. The increase in urban population size has led to urban POLL through production channels and energy consumption. (4) The direct effect of FDI on POLL is positive. Due to loose regulation, developed countries with a high degree of environmental regulation tend to transfer pollution-intensive industries to countries with a low degree of environmental regulation, thus aggravating environmental pollution. Hence, when introducing FDI, local government should not only pay attention to the economic benefits, but also set a stringent threshold of environmental impacts.
Last but not least, the indirect effects of control variables are as follows. (1) The indirect effect of PGDP on POLL is positive. The reason is that the economic growth in adjacent cities has reduced the POLL in local cities. In other words, economic growth has positive spatial spillover effects in China. The reason is that the economic competition of the governments in adjacent cities has promoted the expansion of the production scale of local cities, which has caused POLL in local cities. (2) The indirect effect of IS on POLL is positive, implying that the improvement of industrial structure in surrounding cities has increased the POLL of local cities, which shows that the transfer of high-polluting industries from adjacent cities to local cities has increased POLL of local cities.

5.4. Analysis of Region-Scale Regression Results

China has a vast territory, and there are regional differences in economic growth and natural environment. This paper divides 266 prefecture-level cities into three geographic regions to investigate the spatial imbalance at the regional level: eastern China, central China and western China. Specifically, there are 112 cities in the eastern China, 102 cities in the central China and 52 cities in the western China. Based on the regression analysis of POLL in different regional levels, the results are shown in Table 6.
The effects of ER, PRO, and their interaction terms on urban POLL are different at the different region levels. For the core variables, the direct and indirect effects of the interaction between ER and PRO on POLL are negative in the western region. Furthermore, the direct effect of ER on POLL is negative in the eastern and central regions. The ER in neighboring cities promotes POLL of local cities in the western region. The direct and indirect effects of PRO on POLL are negative in the western region.
For the control variables, the direct and indirect effects of PGDP on POLL in the eastern regions are positive, implying that economic growth can promote urban POLL. The indirect effect of PGDP is positive on POLL in the central region, which indicates that greater per capita GDP of adjacent cities can bring along POLL of local cities in the central region. From the perspective of direct effect, POP among different regions can promote POLL. From the perspective of indirect effects, population size of adjacent cities has a positive impact on POLL of local cities in the eastern region. The direct effect of IS indicates that the more developed tertiary industry of local cities can reduce POLL. The direct effect of FDI on POLL in the eastern and western regions is positive. From the perspective of indirect effects, FDI of adjacent cities can reduce POLL of local cities in the eastern region, whereas the effect is opposite in the western region.

5.5. Analysis of City-Scale Regression Results

The population at the end of the year was selected to represent the urban sizes to investigate the effects of ER, PRO, and their interaction terms on urban POLL. According to the urban population at the end of 2016 in China, the urban sizes can be divided into three categories: mega cities with more than two million urban population, large cities with one million to two million urban population, and small and medium-sized cities with less than one million urban population. Specifically, there are 60 mega cities, 90 large cities and 116 small and medium-sized cities. Based on the regression analysis of POLL in different urban sizes, the results are shown in Table 7.
The impacts of ER, PRO, and their interaction terms on urban POLL are different among different urban sizes. For the core variables, the direct effect of the interaction between ER and PRO on POLL in small and medium-sized cities is negative. From the perspective of indirect effects, the interaction between ER and PRO of adjacent cities in small and medium-sized cities and mega cities has no impact on POLL of local cities, whereas it is conducive to reducing POLL of local cities in large cities. In addition, the direct impact of ER on POLL is negative in mega cities. The indirect effect of ER on POLL is positive in large cities, and the indirect effect of ER on POLL in megacities is negative in megacities. The direct and indirect effects of PRO on POLL are negative in small and medium-sized cities and large cities.
For the control variables, the direct effect of PGDP on POLL is positive in small and medium-sized cities and mega cities, while it is negative in large cities. The direct effect of POP on POLL is positive among different urban sizes, which indicates that the local urban population plays an important role in the increase of urban POLL. The direct effect of IS indicates that the adjustment and improvement of industrial structure in local cities can reduce POLL. Regarding the indirect effect, the IS of adjacent cities can reduce POLL of local cities in the large and mega cities. The POP of adjacent cities can promote POLL of local cities in large and mega cities. The direct effect of FDI can promote POLL in small and medium-sized cities, while the opposite effect is observed in mega cities.
6. Conclusions and Policy Implications

This paper draws the final conclusion and proposes the policy implications based on the above analysis in this section.

6.1. Conclusions

The direct and indirect effects of ER, PRO and their interaction terms on urban POLL in China are investigated in this paper. Utilizing the inverse distance spatial weight matrix, the balanced panel data of 266 Chinese cities from 2005 to 2016 is constructed. Based on the national, regional and city scales, the spatial Durbin model under fixed effects of time and space is estimated. The following conclusions are drawn.
First, the Moran’s I index value of urban POLL during 2005–2016 is significantly positive when the spatial weight matrix considers the geographical correlation, implying that urban POLL has a positive spatial spillover effect under the inverse distance spatial weight matrix. Therefore, it is urgent to put forward more stringent joint mechanism to control air pollution across cities within urban agglomerations, following the principle of differentiation and unification. Since urban POLL is spatially dependent, encouraging more stringent co-ordination mechanisms would help control urban POLL. It should be taken into consideration in future regulations for the air quality improvement.
Second, the direct effect of ER has reduced urban POLL in the national sample, eastern and central regions, and megacities. The indirect effect of ER has promoted urban POLL in the national sample, western region, and large cities, but has hindered urban POLL in megacities. The industrial transfer caused by the difference level of ER can only reduce the pollution level of the moving-out area. It will have very limited impacts on improving the urban POLL. Both the direct and indirect effects of PRO have hindered urban POLL in the national sample, western region, small and medium-sized cities, and large cities. Local officials promoted in these regions have greater motivation to improve the quality of the urban environment in order to achieve the new environmental governance goals. The direct effect of the interaction between ER and PRO has hindered POLL in the national sample, western region, and small and medium-sized cities. The indirect effect of the interaction between ER and PRO has hindered POLL in the national sample, western region, and large cities. This reflects that the PRO has promoted the improvement of environmental quality by strengthening ER in these cities.
Third, the effects of control variables on urban POLL are not always consistent among different regions and urban sizes, which provides strong support for the establishment of spatial heterogeneity in China. For instance, the optimization and upgrading of the industrial structure has positive effects on air pollution control. Correspondingly, the direct effects of FDI in the eastern and western regions and the small and medium-sized cities, as well as the indirect effects of FDI in the western region have had a positive impact on POLL. Due to loose regulation, the increase of FDI has made these regions become pollution heaven. Hence, when introducing FDI, local government should not only pay attention to the economic benefits, but also set a stringent threshold of environmental impacts. These factors should be taken into consideration in future regulations for the air quality improvement.

6.2. Policy Implications

Based on the above conclusions, the following policy implications are proposed:
First, policy makers should increase the intensity of environmental supervision, gradually eliminate heavy polluting enterprises and promote the optimization and upgrading of the industrial structure. Increasing the production and operating costs of heavily polluting enterprises will help improve the quality of the local urban environment. Meanwhile, it is necessary to enhance the intensity of ER in adjacent cities when formulating local environmental supervision policies. If the intensity of local environmental regulations is lower than that of adjacent cities, a large number of heavily polluting companies in adjacent cities will move to the local city, leading to the deterioration of the local environment.
Second, the Chinese government should improve the performance appraisal system for local officials. Chinese government should continuously increase the proportion of environmental management indicators in the evaluation of official performance, emphasize the importance of protecting the urban environment, and weaken the traditional GDP evaluation. Through the establishment of a multi-objective evaluation system including economic development and environmental protection, promoted officials can better handle the relationship between economic development and environmental protection.
Third, the Chinese government should involve the implementation effect of ER in the performance appraisal of local officials. The ultimate effect of ER depends on the implementation and supervision of local officials. Therefore, the implementation results of ER should be regarded as the key content of the performance evaluation for local officials. Guide the behavior of local officials through environmental performance assessment to improve the environmental quality of the city.
Last but not least, considering the spatial dependence of urban environmental pollution, joint efforts and cooperation among different cities play an important role in improving urban environmental quality.

Author Contributions

Conceptualization, S.L. and H.L.; methodology, S.L.; software, S.L.; validation, S.L., G.X., Z.Z. (Zhong Zhang) and Z.Z. (Zhen Zhang); formal analysis, S.L.; investigation, S.L.; resources, S.L.; data curation, S.L.; writing—original draft preparation, S.L.; writing—review and editing, S.L.; visualization, Z.Z. (Zhong Zhang); supervision, H.L.; project administration, H.L.; funding acquisition, H.L. All authors have read and agreed to the published version of the manuscript.

Funding

This study was funded by Project of Tianjin Science and Technology Planning of China (grant No. 18ZXSZSF00200) and National Natural Science Foundation of China (Grant No. 42071085).

Institutional Review Board Statement

Not applicable.

Informed Consent Statement

Not applicable.

Data Availability Statement

Not applicable.

Conflicts of Interest

The authors declare no conflict of interest.

References

  1. Yu, Y.; Yang, X.; Li, K. Effects of the terms and characteristics of cadres on environmental pollution: Evidence from 230 cities in China. J. Environ. Manag. 2019, 232, 179–187. [Google Scholar] [CrossRef]
  2. Shuai, S.; Fan, Z. Modeling the role of environmental regulations in regional green economy efficiency of China: Empirical evidence from super efficiency DEA-Tobit model. J. Environ. Manag. 2020, 261, 110227. [Google Scholar] [CrossRef] [PubMed]
  3. Zhu, B.Z.; Jiang, M.X.; Zhang, S.F.; Jin, L. Resource and Environment Economic Complex System: Models and Applications; Science Press: Beijing, China, 2019. [Google Scholar]
  4. Song, Y.; Zhao, C.; Zhang, M. Does haze pollution promote the consumption of energy-saving appliances in China? An empirical study based on norm activation model. Resour. Conserv. Recycl. 2019, 145, 220–229. [Google Scholar] [CrossRef]
  5. Zameer, H.; Wang, Y.; Yasmeen, H. Reinforcing green competitive advantage through green production, creativity and green brand image: Implications for cleaner production in China. J. Clean. Prod. 2020, 247, 119119. [Google Scholar] [CrossRef]
  6. Zhang, M.; Liu, X.; Ding, Y.; Wang, W. How does environmental regulation affect haze pollution governance?—An empirical test based on Chinese provincial panel data. Sci. Total Environ. 2019, 695, 133905. [Google Scholar] [CrossRef] [PubMed]
  7. Zhang, W.; Li, G.; Uddin, M.K.; Guo, S. Environmental regulation, Foreign investment behavior, and carbon emissions for 30 provinces in China. J. Clean. Prod. 2020, 248, 119208. [Google Scholar] [CrossRef]
  8. Song, Y.; Li, Z.; Yang, T.; Xia, Q. Does the expansion of the joint prevention and control area improve the air quality?—Evidence from China’s Jing-Jin-Ji region and surrounding areas. Sci. Total Environ. 2020, 706, 136034. [Google Scholar] [CrossRef]
  9. Yu, B.; Shen, C. Environmental regulation and industrial capacity utilization: An empirical study of China. J. Clean. Prod. 2020, 246, 118986. [Google Scholar] [CrossRef]
  10. Li, H.; Zhou, L.-A. Political turnover and economic performance: The incentive role of personnel control in China. J. Public Econ. 2005, 89, 1743–1762. [Google Scholar] [CrossRef]
  11. Jia, R. Pollution for Promotion. SSRN Electron. J. 2017, 10. [Google Scholar] [CrossRef]
  12. Kahn, M.E.; Li, P.; Zhao, D. Water Pollution Progress at Borders: The Role of Changes in China’s Political Promotion Incentives. Am. Econ. J. Econ. Policy 2015, 7, 223–242. [Google Scholar] [CrossRef] [Green Version]
  13. Chow, G. China’s Environmental Policy: A Critical Survey; World Scientific: Singapore, 2011; pp. 167–180. [Google Scholar] [CrossRef] [Green Version]
  14. Zheng, S.; Kahn, M.E. Understanding China’s Urban Pollution Dynamics. J. Econ. Lit. 2013, 51, 731–772. [Google Scholar] [CrossRef] [Green Version]
  15. Zheng, S.; Kahn, M.E.; Sun, W.; Luo, D. Incentives for China’s urban mayors to mitigate pollution externalities: The role of the central government and public environmentalism. Reg. Sci. Urban Econ. 2014, 47, 61–71. [Google Scholar] [CrossRef]
  16. Meng, H.; Huang, X.; Yang, H.; Chen, Z.; Yang, J.; Zhou, Y.; Li, J. The influence of local officials’ promotion incentives on carbon emission in Yangtze River Delta, China. J. Clean. Prod. 2019, 213, 1337–1345. [Google Scholar] [CrossRef]
  17. Chen, Z.; Tang, J.; Wan, J.; Chen, Y. Promotion incentives for local officials and the expansion of urban construction land in China: Using the Yangtze River Delta as a case study. Land Use Policy 2017, 63, 214–225. [Google Scholar] [CrossRef]
  18. Gao, J.; Woodward, A.; Vardoulakis, S.; Kovats, S.; Wilkinson, P.; Li, L.; Xu, L.; Li, J.; Yang, J.; Cao, L.; et al. Haze, public health and mitigation measures in China: A review of the current evidence for further policy response. Sci. Total Environ. 2017, 578, 148–157. [Google Scholar] [CrossRef] [PubMed]
  19. Wang, Y.; Zuo, Y.; Li, W.; Kang, Y.; Chen, W.; Zhao, M.; Chen, H. Does environmental regulation affect CO2 emissions? Analysis based on threshold effect model. Clean Technol. Environ. Policy 2018, 21, 565–577. [Google Scholar] [CrossRef]
  20. Leitão, N.C.; Lorente, D.B. The Linkage between Economic Growth, Renewable Energy, Tourism, CO2 Emissions, and International Trade: The Evidence for the European Union. Energies 2020, 13, 4838. [Google Scholar] [CrossRef]
  21. Balsalobre-Lorente, D.; Leitão, N.C.; Bekun, F.V. Fresh Validation of the Low Carbon Development Hypothesis under the EKC Scheme in Portugal, Italy, Greece and Spain. Energies 2021, 14, 250. [Google Scholar] [CrossRef]
  22. Cheng, Z.; Li, L.; Liu, J. The emissions reduction effect and technical progress effect of environmental regulation policy tools. J. Clean. Prod. 2017, 149, 191–205. [Google Scholar] [CrossRef]
  23. Xie, R.-h.; Yuan, Y.-j.; Huang, J.-j. Different Types of Environmental Regulations and Heterogeneous Influence on “Green” Productivity: Evidence from China. Ecol. Econ. 2017, 132, 104–112. [Google Scholar] [CrossRef]
  24. Fu, J.Y. An empirical analysis on industrial characteristics, environmental regulation and air pollution: Guangdong’s manufacturing industry. Zhongguo Renkou Ziyuan Yu Huan Jing/China Popul. Resour. Environ. 2009, 19, 73–77. [Google Scholar]
  25. Du, W.; Li, M. Assessing the impact of environmental regulation on pollution abatement and collaborative emissions reduction: Micro-evidence from Chinese industrial enterprises. Environ. Impact Assess. Rev. 2020, 82, 106382. [Google Scholar] [CrossRef]
  26. Zhao, X.; Liu, C.; Sun, C.; Yang, M. Does stringent environmental regulation lead to a carbon haven effect? Evidence from carbon-intensive industries in China. Energy Econ. 2020, 86, 104631. [Google Scholar] [CrossRef]
  27. Pei, Y.; Zhu, Y.; Liu, S.; Wang, X.; Cao, J. Environmental regulation and carbon emission: The mediation effect of technical efficiency. J. Clean. Prod. 2019, 236, 117599. [Google Scholar] [CrossRef]
  28. Wu, H.; Xu, L.; Ren, S.; Hao, Y.; Yan, G. How do energy consumption and environmental regulation affect carbon emissions in China? New evidence from a dynamic threshold panel model. Resour. Policy 2020, 67, 101678. [Google Scholar] [CrossRef]
  29. Zhang, L.; Adom, P.K.; An, Y. Regulation-induced structural break and the long-run drivers of industrial pollution intensity in China. J. Clean. Prod. 2018, 198, 121–132. [Google Scholar] [CrossRef]
  30. Zhou, Q.; Zhang, X.; Shao, Q.; Wang, X. The non-linear effect of environmental regulation on haze pollution: Empirical evidence for 277 Chinese cities during 2002–2010. J. Environ. Manag. 2019, 248, 109274. [Google Scholar] [CrossRef] [PubMed]
  31. Yang, G.; Zha, D.; Wang, X.; Chen, Q. Exploring the nonlinear association between environmental regulation and carbon intensity in China: The mediating effect of green technology. Ecol. Indic. 2020, 114, 106309. [Google Scholar] [CrossRef]
  32. Sinn, H.-W. Public policies against global warming: A supply side approach. Int. Tax Public Financ. 2008, 15, 360–394. [Google Scholar] [CrossRef]
  33. Zhao, L.; Sun, C.; Liu, F. Interprovincial two-stage water resource utilization efficiency under environmental constraint and spatial spillover effects in China. J. Clean. Prod. 2017, 164, 715–725. [Google Scholar] [CrossRef]
  34. Cheng, Z.; Li, L.; Liu, J. The spatial correlation and interaction between environmental regulation and foreign direct investment. J. Regul. Econ. 2018, 54, 124–146. [Google Scholar] [CrossRef]
  35. Liu, Q.; Wang, S.; Zhang, W.; Zhan, D.; Li, J. Does foreign direct investment affect environmental pollution in China’s cities? A spatial econometric perspective. Sci. Total Environ. 2018, 613–614, 521–529. [Google Scholar] [CrossRef]
  36. Anselin, L. Local Indicators of Spatial Association—LISA. Geogr. Anal. 2010, 27, 93–115. [Google Scholar] [CrossRef]
  37. Elhorst, J.P. Applied Spatial Econometrics: Raising the Bar. Spat. Econ. Anal. 2010, 5, 9–28. [Google Scholar] [CrossRef]
  38. Lesage, J.; Pace, R. Introduction to Spatial Econometrics. Introd. Spat. Econom. 2009, 1. [Google Scholar] [CrossRef] [Green Version]
  39. Griffith, R.B.D.A. Spatial Econometrics: Methods and Models. Econ. Geogr. 1988, 65, 160–162. [Google Scholar] [CrossRef]
  40. Liu, K.; Lin, B. Research on influencing factors of environmental pollution in China: A spatial econometric analysis. J. Clean. Prod. 2019, 206, 356–364. [Google Scholar] [CrossRef]
  41. Ma, J.; Guo, J.; Liu, X. Water quality evaluation model based on principal component analysis and information entropy: Application in Jinshui River. J. Resour. Ecol. 2010, 1, 249e252. [Google Scholar] [CrossRef]
  42. Chen, C.; Sun, Y.; Lan, Q.; Jiang, F. Impacts of industrial agglomeration on pollution and ecological efficiency-A spatial econometric analysis based on a big panel dataset of China’s 259 cities. J. Clean. Prod. 2020, 258, 120721. [Google Scholar] [CrossRef]
  43. Porter, M. America’s Green Strategy. Sci. Am. 1991, 264. [Google Scholar] [CrossRef]
  44. Magat, W.A.; Viscusi, W.K. Effectiveness of the EPA’s Regulatory Enforcement: The Case of Industrial Effluent Standards. J. Law Econ. 1990, 33, 331–360. [Google Scholar] [CrossRef]
  45. Levinsohn, J.; Petrin, A. Estimating Production Functions Using Inputs to Control for Unobservables. Rev. Econ. Stud. 2003, 70, 317–341. [Google Scholar] [CrossRef]
  46. Cole, M.A.; Elliott, R.J.R. Determining the trade–environment composition effect: The role of capital, labor and environmental regulations. J. Environ. Econ. Manag. 2003, 46, 363–383. [Google Scholar] [CrossRef]
  47. Mani, M.; Wheeler, D. In Search of Pollution Havens? Dirty Industry in the World Economy, 1960 to 1995. J. Environ. Dev. 2016, 7, 215–247. [Google Scholar] [CrossRef]
  48. Song, M.; Zhao, X.; Shang, Y.; Chen, B. Realization of green transition based on the anti-driving mechanism: An analysis of environmental regulation from the perspective of resource dependence in China. Sci. Total Environ. 2020, 698, 134317. [Google Scholar] [CrossRef]
  49. He, C.Y.; Sun, Z.T. Logic of political turnover: Evidence from prefectural mayors in China. Econ. Issues China 2012, 6, 13–24. [Google Scholar]
  50. Jiang, L.; Folmer, H.; Ji, M.; Zhou, P. Revisiting cross-province energy intensity convergence in China: A spatial panel analysis. Energy Policy 2018, 121, 252–263. [Google Scholar] [CrossRef]
  51. Wang, Z.; Fang, C. Spatial-temporal characteristics and determinants of PM2.5 in the Bohai Rim Urban Agglomeration. Chemosphere 2016, 148, 148–162. [Google Scholar] [CrossRef]
  52. He, J. Pollution haven hypothesis and environmental impacts of foreign direct investment: The case of industrial emission of sulfur dioxide (SO2) in Chinese provinces. Ecol. Econ. 2006, 60, 228–245. [Google Scholar] [CrossRef] [Green Version]
  53. Zheng, W.; Haifeng, J.; Te, X.; Changqing, X. Manufacturing industrial structure and pollutant emission: An empirical study of China. J. Clean Prod. 2018, 197, 462–471. [Google Scholar]
  54. Zhao, X.; Li, H.; Wu, L.; Qi, Y. Implementation of energy-saving policies in China: How local governments assisted industrial enterprises in achieving energy-saving targets. Energy Policy 2014, 66, 170–184. [Google Scholar] [CrossRef]
  55. Getis, A.; Ord, J.K. The Analysis of Spatial Association by Use of Distance Statistics. Geogr. Anal. 2010, 24, 189–206. [Google Scholar] [CrossRef]
Figure 1. Flow chart of the research steps.
Sustainability 13 02907 g001
Figure 2. Spatial distribution of the study area.
Sustainability 13 02907 g002
Figure 3. Spatial distribution of environmental regulation (ER).
Sustainability 13 02907 g003
Figure 4. Spatial distribution of urban environmental pollution (POLL).
Sustainability 13 02907 g004
Figure 5. Moran’s I index values for urban environmental pollution from 2005–2016.
Sustainability 13 02907 g005
Figure 6. Moran’s I scatter plot for 266 cities of China in 2005 and 2016.
Sustainability 13 02907 g006
Figure 7. The cold and hot spot of urban environmental pollution.
Sustainability 13 02907 g007
Table 1. Descriptive statistics of the selected variables.
DefinitionVariablesObs.MeanMedianStd. Dev.MinMaxUnit
Environmental pollutionPOLL31921.111.080.0911.933/
Environmental regulationER31920.670.690.150.180.98/
Local officials’ promotion incentivesPRO31920.24/0.4301/
Economic growthPGDP319226,897.320,537.6621,572.9476.85356,785.2Yuan
PopulationPOP3192448.05367.72380.6529.749591Million
Foreign direct investmentFDI31920.020.010.0200.14%
Industrial structureIS31920.830.750.440.099.48%
Table 2. Correlation analysis for the selected variables.
VariablesVIF1/VIFlnPOLLlnERlnPROlnPGDPlnPOPlnFDIlnIS
lnPOLL 1.000
lnER1.4400.6930.1111.000
lnPRO1.0000.997−0.042−0.0381.000
lnPGDP1.5800.6330.2500.520−0.0441.000
lnPOP1.1100.9020.3720.146−0.012−0.0781.000
lnFDI1.1800.8490.2150.196−0.0240.3380.1401.000
lnIS1.0400.961−0.03010.038−0.012−0.0470.1610.1021.000
Table 3. Panel Unit Root Test.
VariablesLLCIPSADF-Fisher Chi-SquarePP–Fisher Chi-Square
lnPOLL−8.619 ***−13.6056 ***7.6062 ***10.5929 ***
lnER−11.689 ***−16.0186 ***9.6340 ***22.2285 ***
PRO−24.937 ***−26.6088 ***16.4907 ***149.1259 ***
lnPGDP−24.823 ***−7.8799 ***9.1714 ***8.7544 ***
lnPOP−7.133 ***−18.0589 ***6.4227 ***19.8246 ***
lnFDI−17.446 ***−3.2523 ***7.6045 ***15.5563 ***
lnIS−7.586 ***−1.8700 **12.2409 ***4.9147 ***
Note: ** p < 0.05, *** p < 0.01.
Table 4. Spatial models specification results.
TestStatisticsTestStatistics
LM (lag) test1430.6313 ***Wald test spatial lag104.0201 ***
Robust LM (lag) test12.1056 ***LR test spatial lag115.6905 ***
LM (error) test3523.3598 ***Wald test spatial error133.2443 ***
Robust LM (error) test2104.8342 ***LR test spatial error146.5387 ***
Hausman test165.5254 ***
Note: *** p < 0.01.
Table 5. Estimation results for SDM in the national samples.
VariablesDirect EffectIndirect EffectOverall Effect
Coefficientt StatisticsCoefficientt StatisticsCoefficientt Statistics
lnER−0.02046 **−2.6633.11146 **2.2443.09100 **2.221
lnPRO−0.03306 ***−3.621−4.74675 ***−2.692−4.77982 ***−2.699
lnER*lnPRO−0.05535 ***−3.028−8.96701 **−2.502−9.02236 **−2.507
lnPGDP0.02392 ***8.7022.17126 ***3.8662.19518 ***3.897
lnPOP0.04565 ***21.7310.235291.0960.280941.309
lnIS−0.01426 ***−4.7150.84315 **2.1560.82889 **2.117
lnFDI0.00777 ***6.885−0.02121−0.145−0.01344−0.092
Note: ** p < 0.05, *** p < 0.01.
Table 6. Estimation results for SDM at the regional levels.
Eastern ChinaCentral ChinaWestern China
Coefficientt StatisticsCoefficientt StatisticsCoefficientt Statistics
Direct effectlnER−0.03123 ***−2.675−0.04866 ***−5.774−0.00194−0.133
lnPRO−0.01581−1.368−0.00004−0.005−0.04248 **−2.501
lnER*lnPRO−0.01299−0.4790.005750.409−0.06829 **−2.337
lnPGDP0.04060 ***10.4540.004381.251−0.00268−0.534
lnPOP0.04433 ***11.6650.02376 ***8.3830.06060 ***11.434
lnIS−0.03199 ***−5.650−0.02014 ***−4.658−0.01340 **−2.093
lnFDI0.00817 ***3.9740.002631.4760.00604 ***2.801
Indirect effectlnER0.298900.4670.218560.9421.02016 **2.437
lnPRO−0.26656−0.352−0.16726−0.616−0.90371 *−1.814
lnER*lnPRO−0.08768−0.0480.006250.013−1.64007 *−1.924
lnPGDP0.51603 ***2.7890.30074 ***3.222−0.03745−0.327
lnPOP0.37473 ***2.6500.065911.4530.154271.415
lnIS−0.00734−00340.020780.324−0.15307−0.903
lnFDI−0.20928 *−1.975−0.04423−1.0300.11787 **2.221
Overall effectlnER0.267670.4140.169900.7241.01823 **2.386
lnPRO−0.28237−0.368−0.16730−0.606−0.94619 *−1.853
lnER*lnPRO−0.10068−0.0550.012000.025−1.70836 *−1.955
lnPGDP0.55664 ***2.9900.30512 ***3.257−0.04013−0.346
lnPOP0.41905 ***2.9590.08967 **2.0000.21487 *1.972
lnIS−0.03932−0.1840.000640.010−0.16647−0.971
lnFDI−0.20111 *−1.880−0.04161−0.9680.12391 **2.300
Note: * p < 0.1, ** p < 0.05, *** p < 0.01.
Table 7. Estimation results for SDM at the urban sizes.
Small and Medium-Sized CitiesLarge CitiesMega Cities
Coefficientt StatisticsCoefficientt StatisticsCoefficientt Statistics
Direct effectlnER−0.00910−1.3830.000180.015−0.10118 ***−3.761
lnPRO−0.01442 *−1.733−0.03148 **−2.334−0.00619−0.329
lnER*lnPRO−0.02637 *−1.832−0.03890−1.519−0.00422−0.079
lnPGDP0.00543 *1.901−0.00670 *−1.8310.12268 ***15.045
lnPOP0.02220 ***8.9780.01313 ***3.2290.07327 ***10.141
lnIS−0.02252 ***−7.181−0.02645 ***−5.465−0.08981 ***−8.621
lnFDI0.00294 **2.618−0.00102−0.622−0.01007 **−2.522
Indirect effectlnER0.333681.0531.44890 **2.116−1.13206 *−1.736
lnPRO−0.94292 *−1.769−2.09429 **−2.4480.026840.061
lnER*lnPRO−1.38930−1.561−3.19509 **−2.0090.125100.092
lnPGDP0.185221.5030.166300.8630.166271.159
lnPOP0.133971.2000.32576 *1.7360.27832 *1.788
lnIS−0.00487−0.034−0.43802 *−1.768−0.44471 **−2.195
lnFDI0.032140.606−0.04274−0.478−0.08417−1.145
Overall effectlnER0.324581.0171.44908 **2.094−1.23324 *−1.867
lnPRO−0.95735 *−1.776−2.12577 **−2.4510.020650.045
lnER*lnPRO−1.41567−1.573−3.23398 **−2.0050.120880.087
lnPGDP0.190651.5410.159600.8240.28895 **2.026
lnPOP0.156171.3940.33889 *1.7990.35159 ***2.243
lnIS−0.02738−0.188−0.46447 *−1.862−0.53452 **−2.641
lnFDI0.035080.659−0.04377−0.486−0.09424−1.279
Note: * p < 0.1, ** p < 0.05, *** p < 0.01.
Publisher’s Note: MDPI stays neutral with regard to jurisdictional claims in published maps and institutional affiliations.