Article

Research on Residents’ Willingness to Pay for Promoting the Green Development of Resource-Based Cities: A Case Study in Chifeng

1
State Key Laboratory of Urban and Regional Ecology, Research Center for Eco-Environmental Sciences, Chinese Academy of Sciences, Beijing 100085, China
2
College of Resources and Environment, University of Chinese Academy of Sciences, Beijing 100049, China
*
Author to whom correspondence should be addressed.
Sustainability 2021, 13(5), 2833; https://doi.org/10.3390/su13052833
Submission received: 6 February 2021 / Revised: 27 February 2021 / Accepted: 1 March 2021 / Published: 5 March 2021

Abstract

:
Resource-based cities have made significant contributions to the development of human beings but have also accumulated various unsustainable ills. For this reason, China put forward the strategy of green development. This study used questionnaires to explore the extent of residents’ understanding of regional green development in Chifeng City and their willingness to support local green development, and further analyzed the differences in the residents’ attitudes and willingness to pay (WTP) with different socioeconomic characteristics. The results showed that most of the respondents supported the green development strategy and demonstrated a strong willingness to participate in regional green development investment. According to calculations, the per capita WTP for green development in Chifeng is 45.05 yuan/a (about 7 dollars/a, 5.7 euros/a). Urban residents, government employees, and well-educated respondents were more inclined to support regional green development and showed a greater WTP. Elderly and female respondents agreed more with the government’s green development promotion, while the young and middle-aged populations and men tended to have higher green development expenditures. The respondents’ annual income difference was reflected in the amounts of residents’ WTP. This study also offered scientific support and policy assistance to promote the environmental protection work from government-led to public participation.

1. Introduction

Resource-based cities are cities with good resource endowments, and the main share of industry and economic aggregates comes from resource and energy mining and processing [1]. Historically, resource-based cities have made significant contributions to human development, but in the long run, the unsustainable development model of resource-based cities has not only failed to efficiently develop local natural resources but has also led to accelerated deterioration of the ecological environment in the region, economic recession, and other problems, which greatly threatened the health of the residents [2,3,4,5,6]. The problems faced in the development of resource-based cities are closely related to policy guidance. As the main force in guiding the development and transformation of resource-based cities, government agencies of various countries carried out long-term explorations of the development model of resource-based cities and successively proposed various solutions [7,8,9]. In 1987, the book “Our Common Future” provided a set of new theories and strategies for the coordinated development of nature, technology, economy, and society: the concept of sustainable development. This concept provided a new choice for the development of resource-based cities and humankind as a whole, and a new model of sustainable development of resource-based cities had emerged [10].
China’s resource-based cities have undergone severe tests in their development models. Since 1949, due to the country’s strategy of giving priority to heavy industry, resource-based cities have played an important role in the distribution of national productivity. Similar to other countries, some resource-based cities have long relied on the mining and primary processing of a single resource, which has led to problems such as a single industrial structure, an imbalance in the employment structure, and serious environmental issues, and regional sustainable development has been under tremendous pressure [1,11]. In order to solve the aforementioned problems, in 1994, the Chinese government compiled the “White Paper on China’s Population, Environment and Development in the 21st Century”, incorporating sustainable development strategies into China’s long-term economic and social development plan for the first time. In 1997, the 15th National Congress of the Communist Party of China identified the sustainable development strategy as a scheme to be implemented in China’s drive for modernization, and clearly pointed out that its connotations include sustainable social development, viable ecological development, and sustainable economic development. In 2015, on the basis of sustainable development, the Fifth Plenary Session of the 18th Central Committee of the Communist Party of China proposed a set of new scientific concepts and methods to guide China’s long-term development—green development—and defined it as “economic growth and social development methods aimed at efficiency, harmony and sustainability” [12]. In December 2020, the national ministries and commissions represented by the Ministry of Ecology and Environment further clarified the overall policy of “promoting green development with high-level protection” in the future. In essence, green development is in line with the model of sustainable development in an ideological context. It is not only the heritage of sustainable development, but also the Chinese innovation of sustainable development, as well as the Chinese practice of sustainable development.
Since the green development strategy was proposed, China has successively drawn up and implemented a number of green development research plans from the perspective of resource-based urban development. In 2007, the China International Mining Conference launched the initiative for the development of green mining for the first time, underlining the fundamental transformation of development and economic growth. In 2010, the “2010 China Green Development Index Annual Report” was published, reflecting the first set of the domestic green development monitoring index system and index measurement system, reflecting the production efficiency and resource utilization efficiency in economic growth at the national level, ecological protection and pollution discharge, government investment, green development management and governance, etc. The “China’s Regional Green Development Index Report” published in 2012 carried out a survey of public satisfaction with green development in 38 cities from the government’s perspective. A comparative analysis was carried out through a comprehensive assessment of the urban environment, infrastructure, and actions of the government on green development. The Fifth Plenary Session of the 18th Central Committee of the Communist Party of China presented five development concepts of green development, innovation, coordination, openness, and sharing. Experts and scholars have also conducted a great deal of research on green development from a variety of perspectives. Hu et al. combed the function definition, mechanism analysis, and development strategy of green development [13]. Wu et al. studied the formation of the concept of green development and its future trend, and believed that green development would become the guiding principles for China’s economic and social development [14]. Tu et al. evaluated the level of green development in the Chinese industry and studied the driving force of green development [15]. Wang et al. assessed the transformational capabilities of China’s resource-based cities for green development [16]. The previous research studies focused mainly on the connotation, concept, evaluation, and motivation of green development, which provided theoretical support for the green development of resource-based cities.
However, most of the existing studies are based on a top-down government perspective, advocating the government to make scientific, human, and material investments in the regional green development process [17]. Although the government-led top-down approach may support the initial green development of resource-based cities, the success of the regional green development model and the sustainability of benefits depend on the main concerns of the various stakeholders (especially the public), involving many aspects such as funding, public awareness, and degree of recognition [18,19]. The Contingent Valuation Method (CVM) was originally proposed by Ciriacy-Wantrup and is often used to evaluate the economic value of non-competitive public goods such as environmental goods and services [20]. In the form of a questionnaire, CVM asks the respondents about the maximum willingness to pay (WTP) for using or protecting a given environmental item or service or the minimum willingness to accept (WTA) for the loss of a given environmental item or service. Large deviations of WTA from WTP can arise without perfect complementarity between the public good and the market goods [21], and WTP is closer to market value than WTA [22]. Therefore, understanding the public’s attitude and willingness to pay (WTP) can provide important information to advance the green development of resource-based cities, which is conducive to the transition from a government-led model to a public participation model. However, relevant research is relatively scarce at present.
In summary, based on the green development goals of resource-based cities and residents’ response to green development, this study used a questionnaire survey to explore the local residents’ understanding of the green development of resource-based cities from the perspective of public perception, and employed the WTP survey as a starting point to explore the residents’ response to the local green development path and the corresponding influencing factors. This study aimed to analyze the driving factors and behavioral characteristics of the public in resource-based cities in promoting local green development. Meanwhile this study put forward feasible suggestions to city managers from the perspective of public participation, so as to guide resource-based cities to coordinate the relationship between economic development and ecological environment and realize people-oriented regional green and coordinated development.

2. Data Collection and Methodology

2.1. Questionnaire Design

The composition of the questionnaire is shown in Figure 1. It consists of four parts and a total of 50 questions, including the interviewee’s personal information, feelings about the local ecological environment, understanding of green development, support for the green development of resource-based cities, and WTP and payment methods for green development of resource-based cities.

2.2. Study Area

At the end of 2013, the State Council of China issued the National Sustainable Development Plan for Resource-Based Cities (2013–2020), which, according to different types and evaluation criteria, divided resource-based cities into four types: growth, maturity, decline, and regeneration. This research identified Chifeng City, the only mature resource-based city among the four types of Inner Mongolia and the most populous city in Inner Mongolia, as the research area. Chifeng is an important energy raw material base in China: 83 types of mineral resources and more than 1600 mineral deposits have been discovered in the city. Chifeng has a special geographical location and is a crucial part of China’s important ecological security barrier [23]. However, it should not be overlooked that Chifeng also has a common problem with many resource-based cities. The gradual reduction of natural resources has led to imbalances in the urban industrial structure, increased poverty and unemployment in resource-depleted areas, lack of alternative industries, and serious environmental pollution [24,25,26]. Consequently, taking Chifeng as the research area has a certain representativeness for the research into the green development of resource-based cities in China.

2.3. Methods

2.3.1. Determination of Sample Size

The total population of Chifeng City was 4.518 million in 2018. Due to the large total number, the statistical confidence method was used to estimate the sample size. In the case where the overall sample size has reached millions, the relationship between the minimum sample size and the overall sample size has no significant correlation, but it is affected by the error and confidence level. According to the data given by American market research expert Alan Dutka, when sampling with a 3% error and 95% confidence level, the minimum sample size is 1068. In this study, samples were taken with an error of 2% and a confidence level of 95%, and the minimum sample size calculated was 2401 [27]. A face-to-face questionnaire survey of 2500 local residents of Chifeng City over the age of 17 was conducted to meet the survey requirements with high reliability. The selection of interviewees followed the principle of randomness. Random questionnaire surveys were conducted on residents of Chifeng in the urban districts, communities, and villages. The number of questionnaires returned by each district and county is represented in Figure 2.
From July to December 2019, random sampling was conducted in Chifeng City to investigate the residents’ WTP for green development strategies, and respondents were asked to complete the questionnaire voluntarily. The answer time of the questionnaire was about 20 min. Specifically, a total of 3498 questionnaires was distributed. The questionnaire survey was conducted through face-to-face interviews. The questionnaires were distributed on-site, with a recovery rate of 100%. Among them, there are 2609 valid questionnaires and 889 invalid questionnaires (abandonment criteria: more than 10% of the questions are not answered, the handwriting is scribbled and unrecognizable, and the same answer is selected continuously, etc.). The overall effective rate of the questionnaire is 74.59%.

2.3.2. Reliability Test

Reliability analysis is often expressed by correlation coefficients, including test–retest reliability, alternative-form reliability, and Cronbach’s alpha. Test–retest reliability refers to the testing of the same group of participants with the same questionnaire at different times and the calculation of the correlation coefficient of the two points. Alternative-form reliability refers to the testing of the same group of participants with a similar copy of the questionnaire and the calculation of the two copies of the correlation coefficient of the scores. The Cronbach’s alpha indicates the degree of reliability of internal consistency. The formula for the calculation is as follows:
α = [ k ( k 1 ) ] × [ 1 ( S i 2 ) ( S x 2 ) ]
where S i 2 is the internal variance of the question i, S x 2 is the variance of the total score of all questions, and k is the number of options in the questionnaire. Cronbach’s α is used to measure the consistency of the scores among the various questions within the questionnaire, and it is suitable for the reliability analysis of attitude and opinion questionnaires [28], as shown in Table 1.
In this study, the questionnaire does not involve retesting, nor does it allow one participant to fill in two copies of the questionnaire. Therefore, the Cronbach’s alpha was used to measure the reliability. The sociological statistical software SPSS was used to analyze the reliability of the eight questions about the residents’ ecological environment perception in the questionnaire, and the Cronbach’s alpha coefficient calculated was 0.90, which proved that the results of the questionnaire for the green development strategy of Chifeng City have good consistency and stability.

2.3.3. Estimation Model of WTP

WTP’s elicitation techniques had developed from the early open ended (OE) to payment card (PC) and dichotomous choice (DC) [29]. Studies have shown that there is a substantial hypothetical bias (the difference between hypothetical and actual values) of 21% on average in WTP measures, and direct methods result in more accurate estimates of WTP than indirect methods do [30]. In this paper, the PC approach was used to reveal respondents’ WTP for green development because the respondents’ WTP can be directly determined from the original data. The Minimal Legal WTP Model ( W T P M L ) was occupied to calculate the WTP. The advantage of the W T P M L model is its transparency and it rests on a contractual notion of WTP [31]. W T P M L can be considered a lower bound for the WTP [32]. The calculation formula of W T P M L is:
W T P M L = i = 0 H A i P i
where A i is the different values from the payment card and P i is the respective frequencies.

2.3.4. Residents’ Attitude towards Green Development and Analysis of Factors Affecting the Payment Amount

The PC approach was used in this study and the responses were interval-censored, so we used interval regression [33] to analyze the WTP for green development of residents with different socioeconomic characteristics. The willingness to pay interval is 0, (0,50], (50,100], (100,200], and (200, + ).
Further, the method of one-way analysis of variance (ANOVA) was selected in this study to explore the attitudes of residents with different characteristics to green development and their WTP for regional green development. The explanatory variables are the socioeconomic characteristics of residents, covering the gender, age, household registration, occupation, education level, and annual income of the participants. The statistical descriptions related to the variables are presented in Table 2.
The ANOVA decomposes the total sum of squares into the sum of squares between groups and the sum of squares within groups, as depicted in Formulas (3) and (4). By dividing the different square sums by the degrees of freedom, the mean square error (Formula (5)) is obtained, and the F test is performed based on the mean square error (Formula (6)). The purpose of the F test is to infer whether there is a significant difference between various levels under a certain population characteristic. The null hypothesis, H0, represents that there is no significant difference among levels. If F < F_0.05 (p > 0.05), accept H0; otherwise, reject H0. In addition, based on the sample average, this study compared residents’ approval for green development and their WTP for regional green development under different population characteristics. The higher the average, the higher the degree of approval or the stronger the WTP.
SST =   SSR + SSE
{   SST =   i = 1 k j = 1 n ( x ij   x ¯ ) 2 SSR = n i = 1 k ( x ij ¯   x ¯ ) 2       S S E = i = 1 k j = 1 n ( x ij x i ¯ ) 2
{   M S T = SST df T =   SST nk 1 M S R = SSR df R =   SSR k 1     M S E = SSE df E =   SST k ( n 1 )
F = MSR MSE   ~ F ( k 1 , n ( k 1 ) )
where SST , SSR , and SSE are the sum of squares total, sum of squares regression, and sum of squares error, respectively.   x ¯ is the overall sample average under the resident characteristic A, x ij ¯ is the sample average at a certain level under the public characteristic A, n is the number of samples, k is the number of groups, MST , MSR , and MSE represent mean squared total, mean squared regression, mean squared error respectively, and df T , df R , and df E are their degrees of freedom, correspondingly.

3. Results and Discussion

3.1. Basic Situation of the Questionnaire Survey

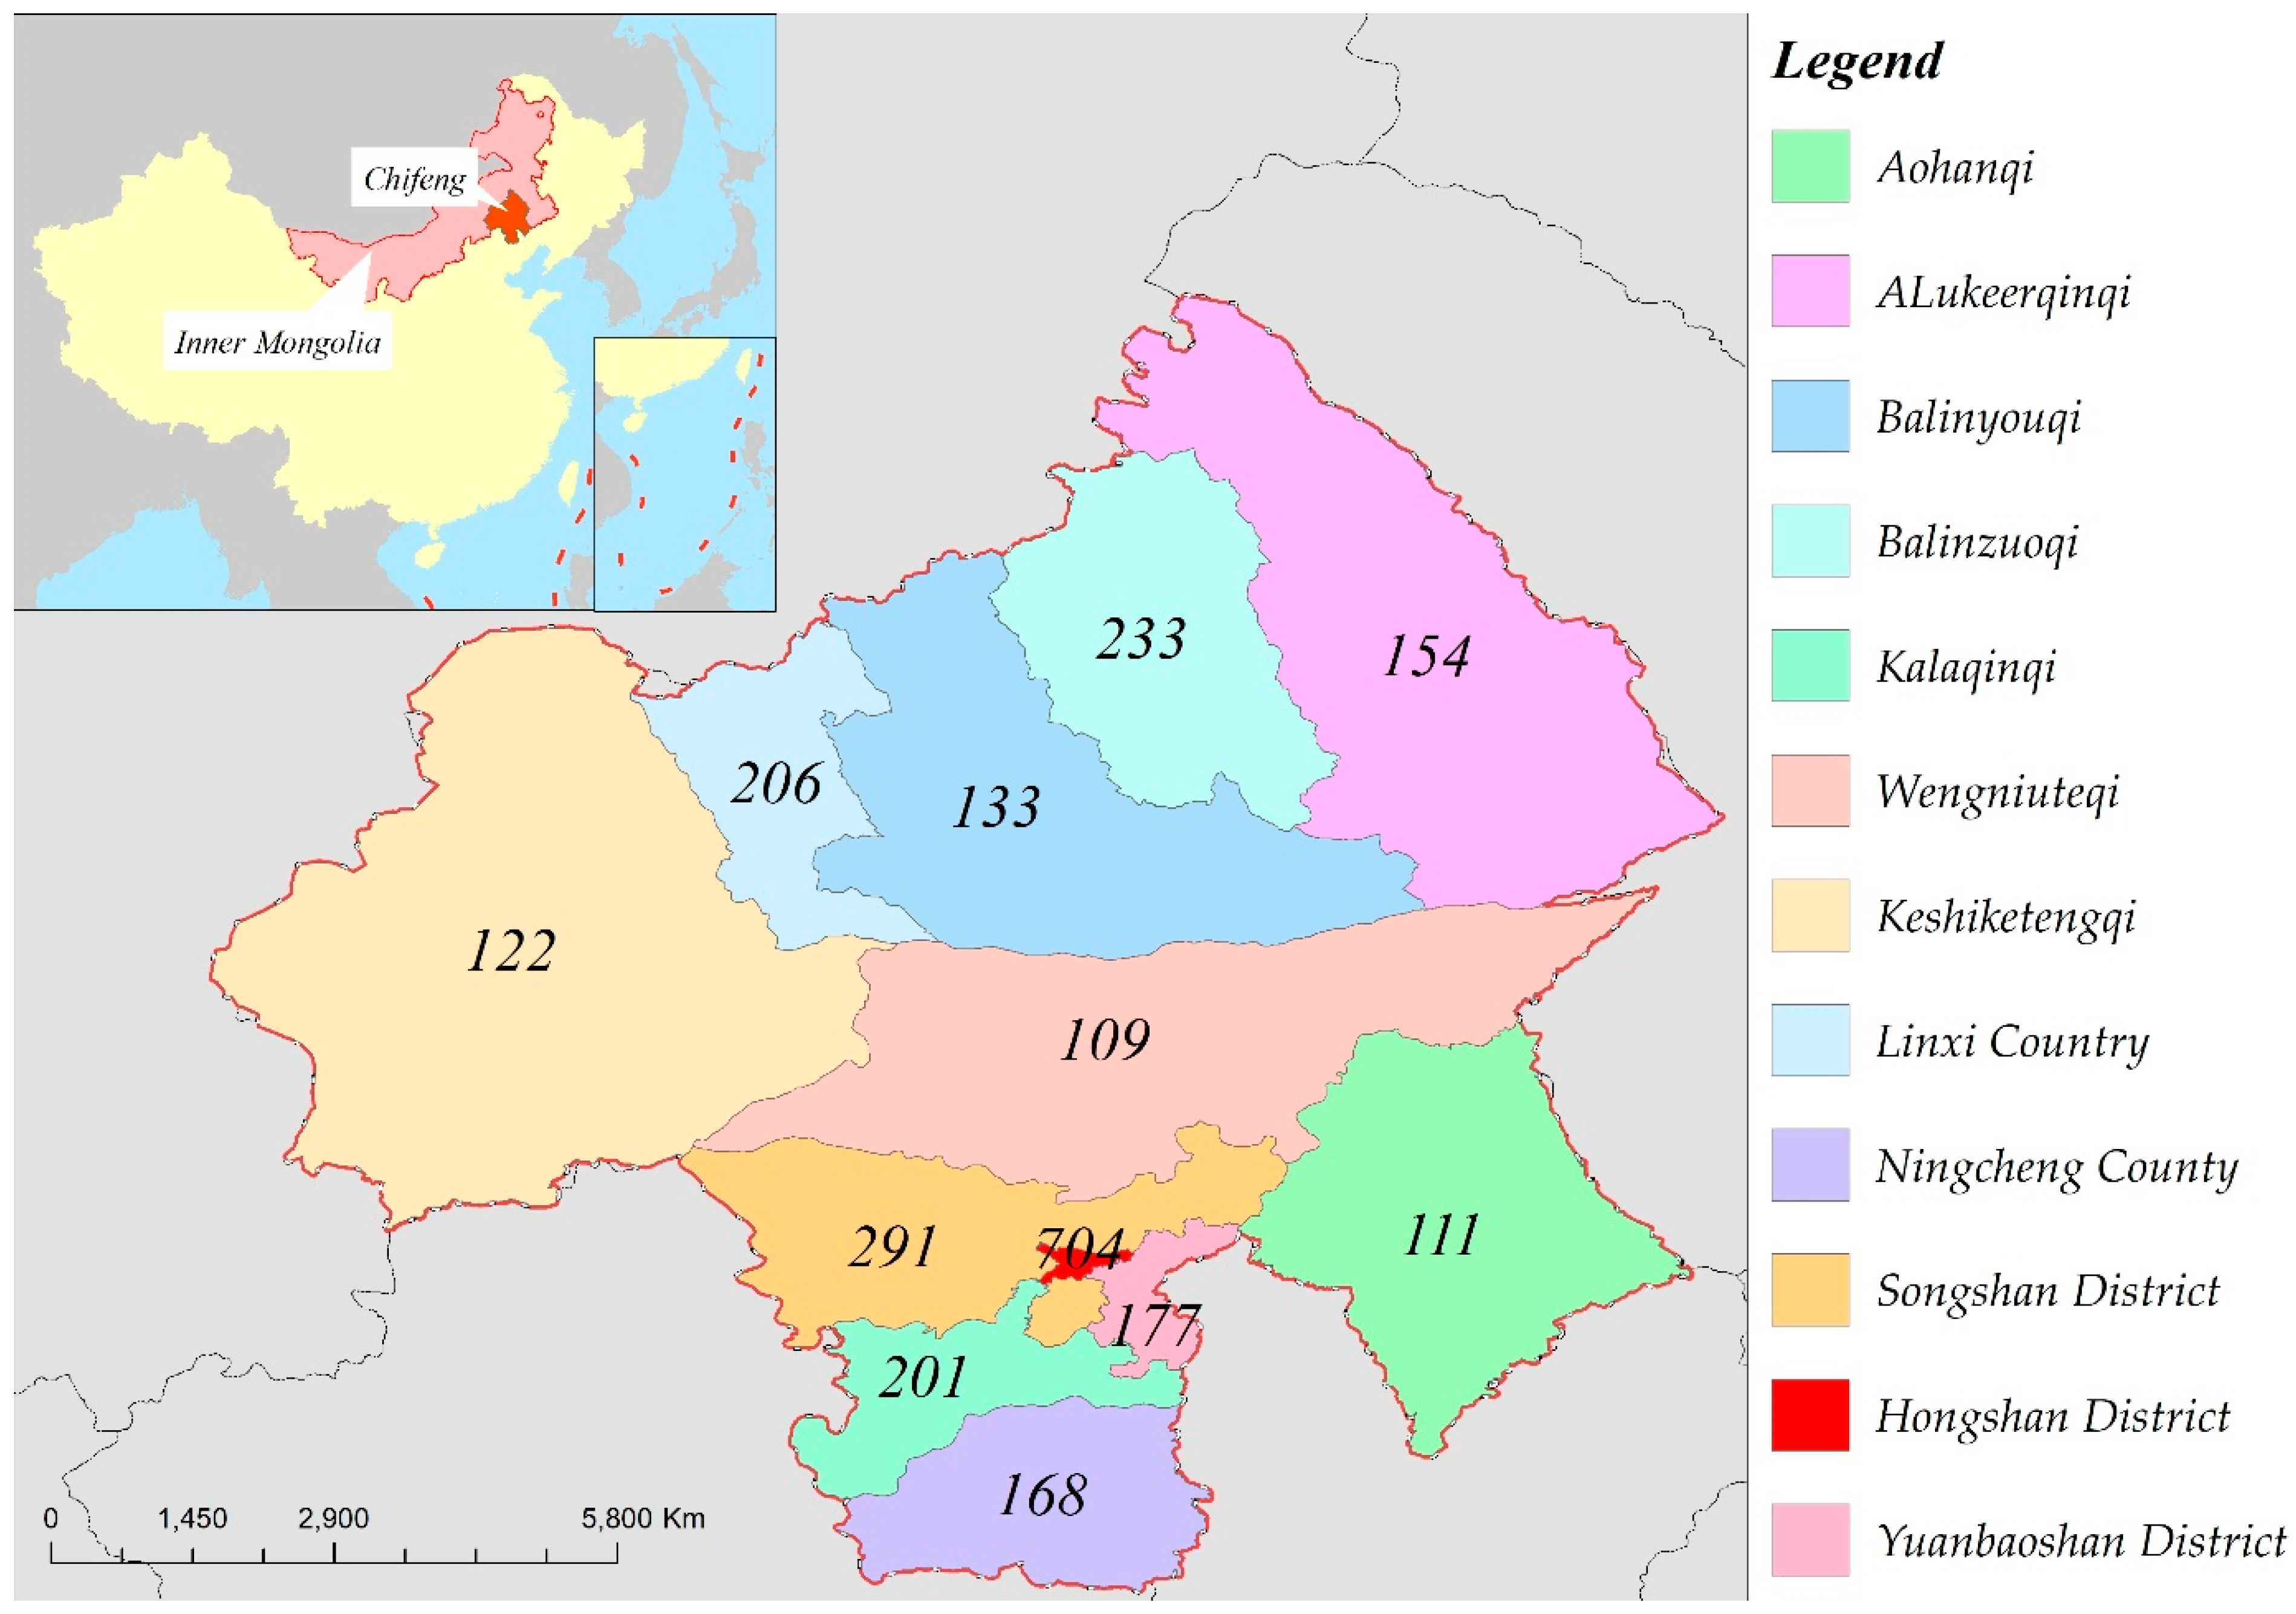
This survey covered the whole area of Chifeng City, involving Hongshan district, Songshan district, Yuanbaoshan district, Linxi county, Ningcheng county, Aluhorqin banner, Balin left banner, Balin right banner, Keshiketeng banner, Wengniute banner, Kalaqin banner, and Aohan banner. From the basic situation of the respondents (Table 3), the majority of respondents are female with their age distribution mostly concentrated between 17 and 49 years old (accounting for 75.1%). Only 12.3% of the respondents are over 61 years old. The respondents are in good health, and their education level is mostly technical secondary school and college, followed by undergraduate. Respondents with an annual income of less than 50 thousand yuan accounted for 54.7%, followed by those with an income of between 50 and 100 thousand yuan accounting for 35.6%, and those with an income of more than 100 thousand yuan accounted for only 9%. Among the occupation types, 51.4% of the respondents had fixed income (government officer, technical worker, business staff, and private business owner), and 48.6% of respondents were employed in the second and third industries.

3.2. Respondents’ Perceptions of Regional Ecological Environment Protection and Green Development

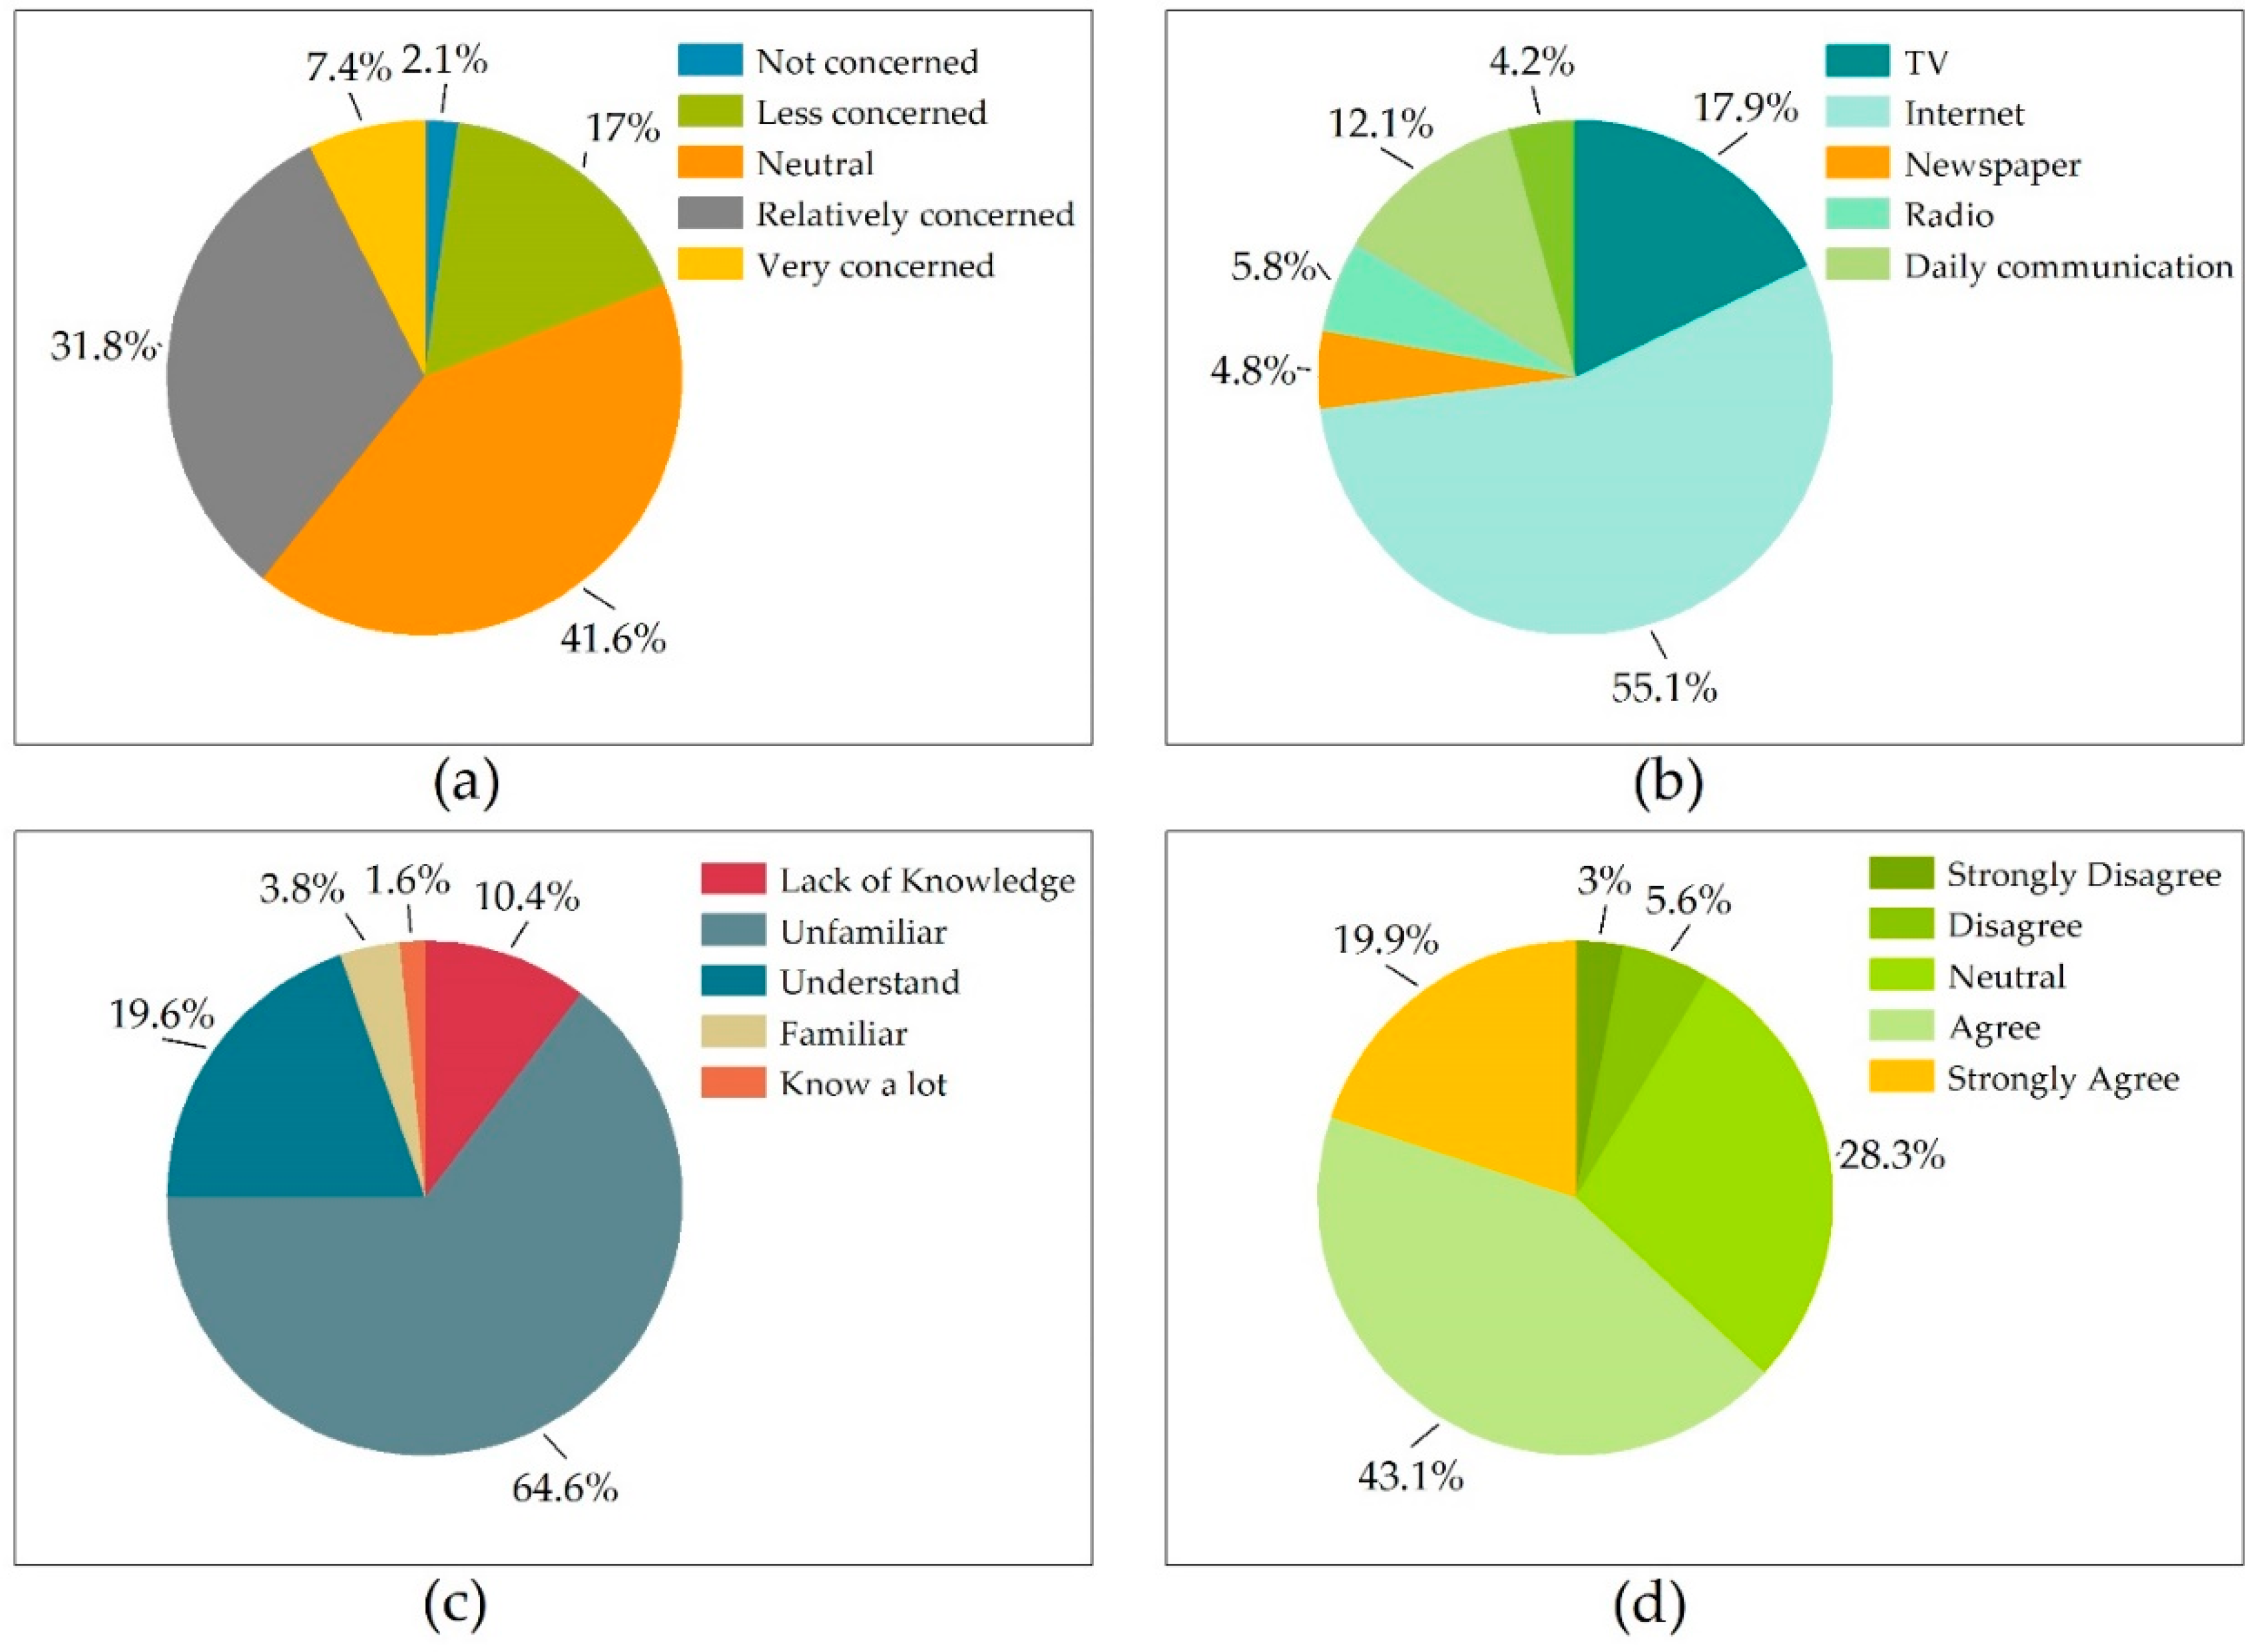
The results revealed that 81% of the respondents are concerned about the information related to the ecological environment of Chifeng (Figure 3a) and expressed concern about the current status of the local ecological environment (Figure 4). Based on the responses of the public about their perceptions of changes in the air quality, water environment, soil environment, noise environment, and garbage disposal in Chifeng in the past five years, it was found that the vast majority of respondents expressed deep concerns about the deterioration of the air, water, and noise environments. Almost 44% of the respondents considered that the soil environment in the region has exhibited a worsening trend in the past five years. Due to the comprehensive improvement of the urban and rural environment over the years, nearly 30% of the respondents thought that the garbage disposal had improved, but 43% of the respondents asserted that the overall garbage environment in the region had deteriorated. In general, virtually half of the respondents believed that the recent changes in trend of the ecological environment in Chifeng in the past five years was not ideal, and effective measures were urgently needed to improve the basic status of the ecological environment in the region. The public’s attention to the ecological environment is related to the channels through which they obtain relevant information. As illustrated in Figure 3b, more than half of the respondents believed that online news was the main channel to learn about ecological and environmental protection. The internet (55%) and television (TV) news (25.3%) are the main ways for residents to obtain information about the ecological environment, followed by daily communication (17.1%), newspaper, and radio. It can be vividly observed that new media represented by the Internet and TV are the main channels for residents to obtain information on ecological and environmental protection and are also the major means for information dissemination and sensitization about green development compared with traditional media.
Furthermore, the degree of concern for the ecological environment and the urgency to change the current reality have greatly promoted the respondents’ demands for the transformation of regional development models. Green development, as a new path of resource-based city transformation advocated by the country, is gradually entering the public’s field of vision. Through the questionnaire survey, approximately 30% of the respondents expressed concern and understanding of the concept of green development. However, more than 70% of those surveyed believe that they have an iota of knowledge of green development-related theories (as shown in Figure 3c), reflecting that the concept of green development is relatively new to the people in the region and there is still a need to strengthen publicity and dissemination. After the investigators explained in detail the connotation of green development, greater than 80% of the respondents agreed with the green development of resource-based cities, some of the respondents held a neutral attitude, and only 2.2% of the respondents opposed (
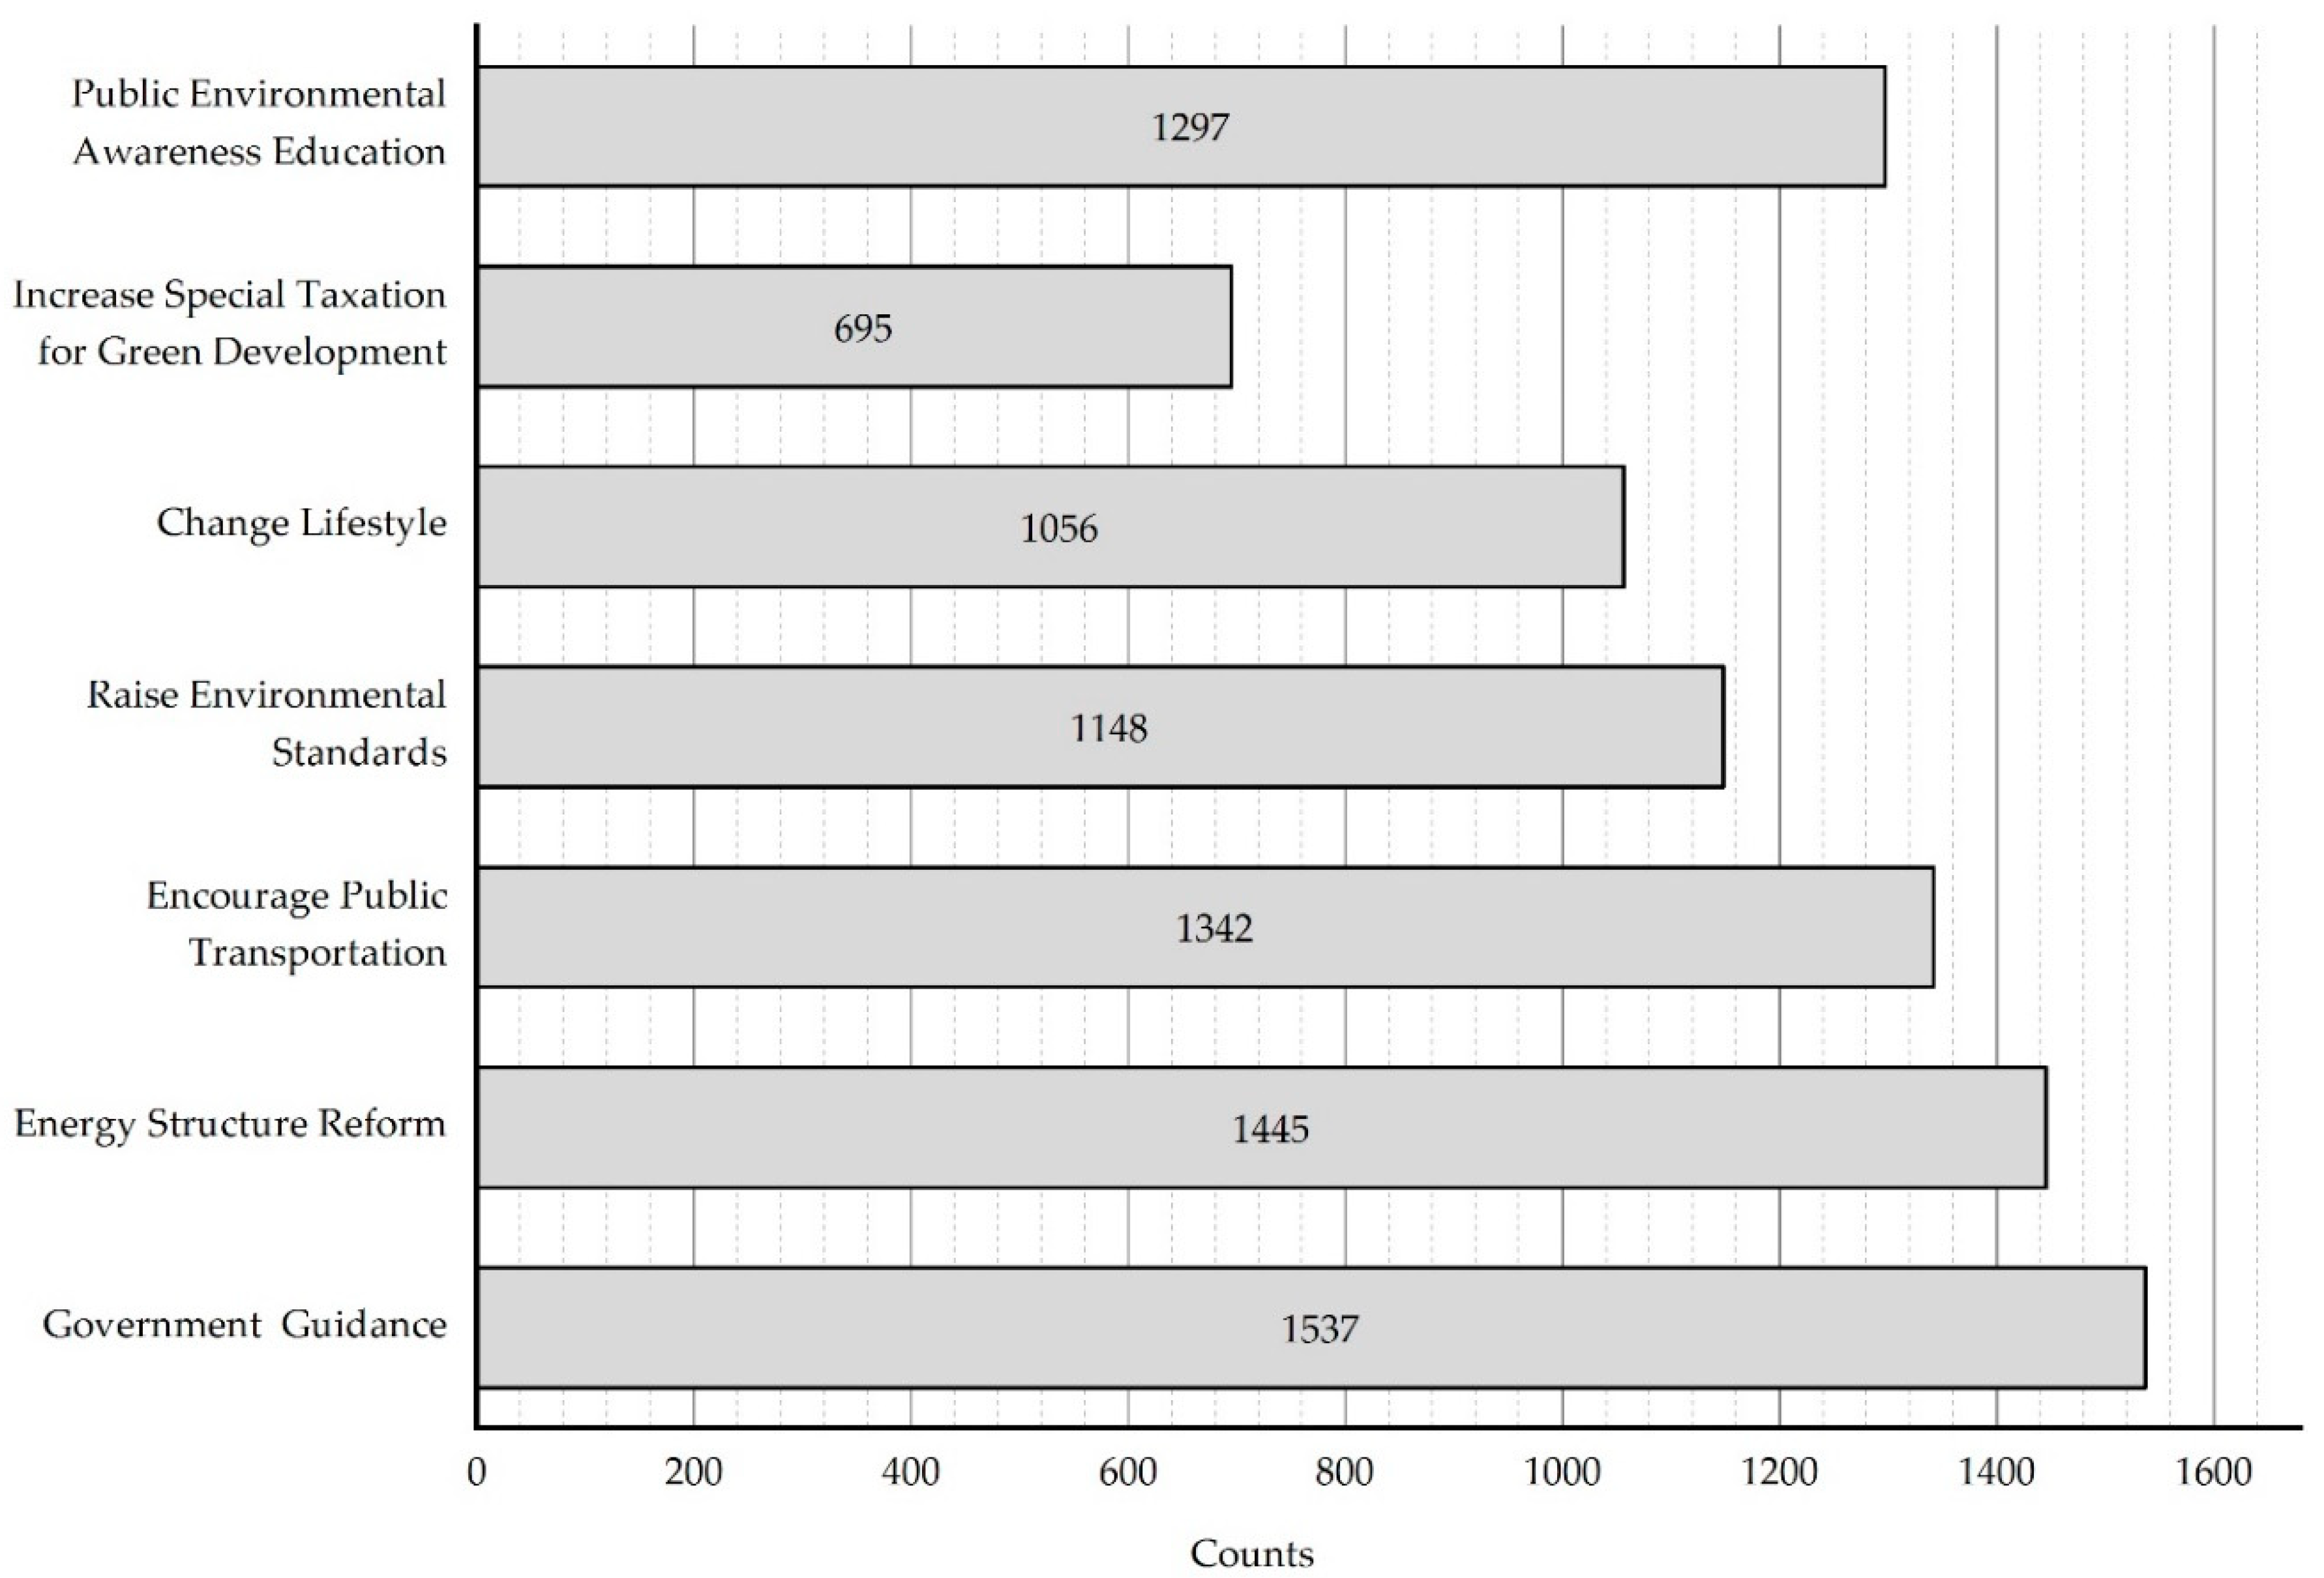
Figure 3d). With regards to effective ways of promoting green development, nearly 60% of the interviewees believed that the government’s policies and regulations were the most important way forward, followed by advocating green consumption patterns and encouraging the development of public transportation. Moreover, raising public awareness of the environment and increasing publicity and education are also powerful means of promoting the transformation of regional green development (
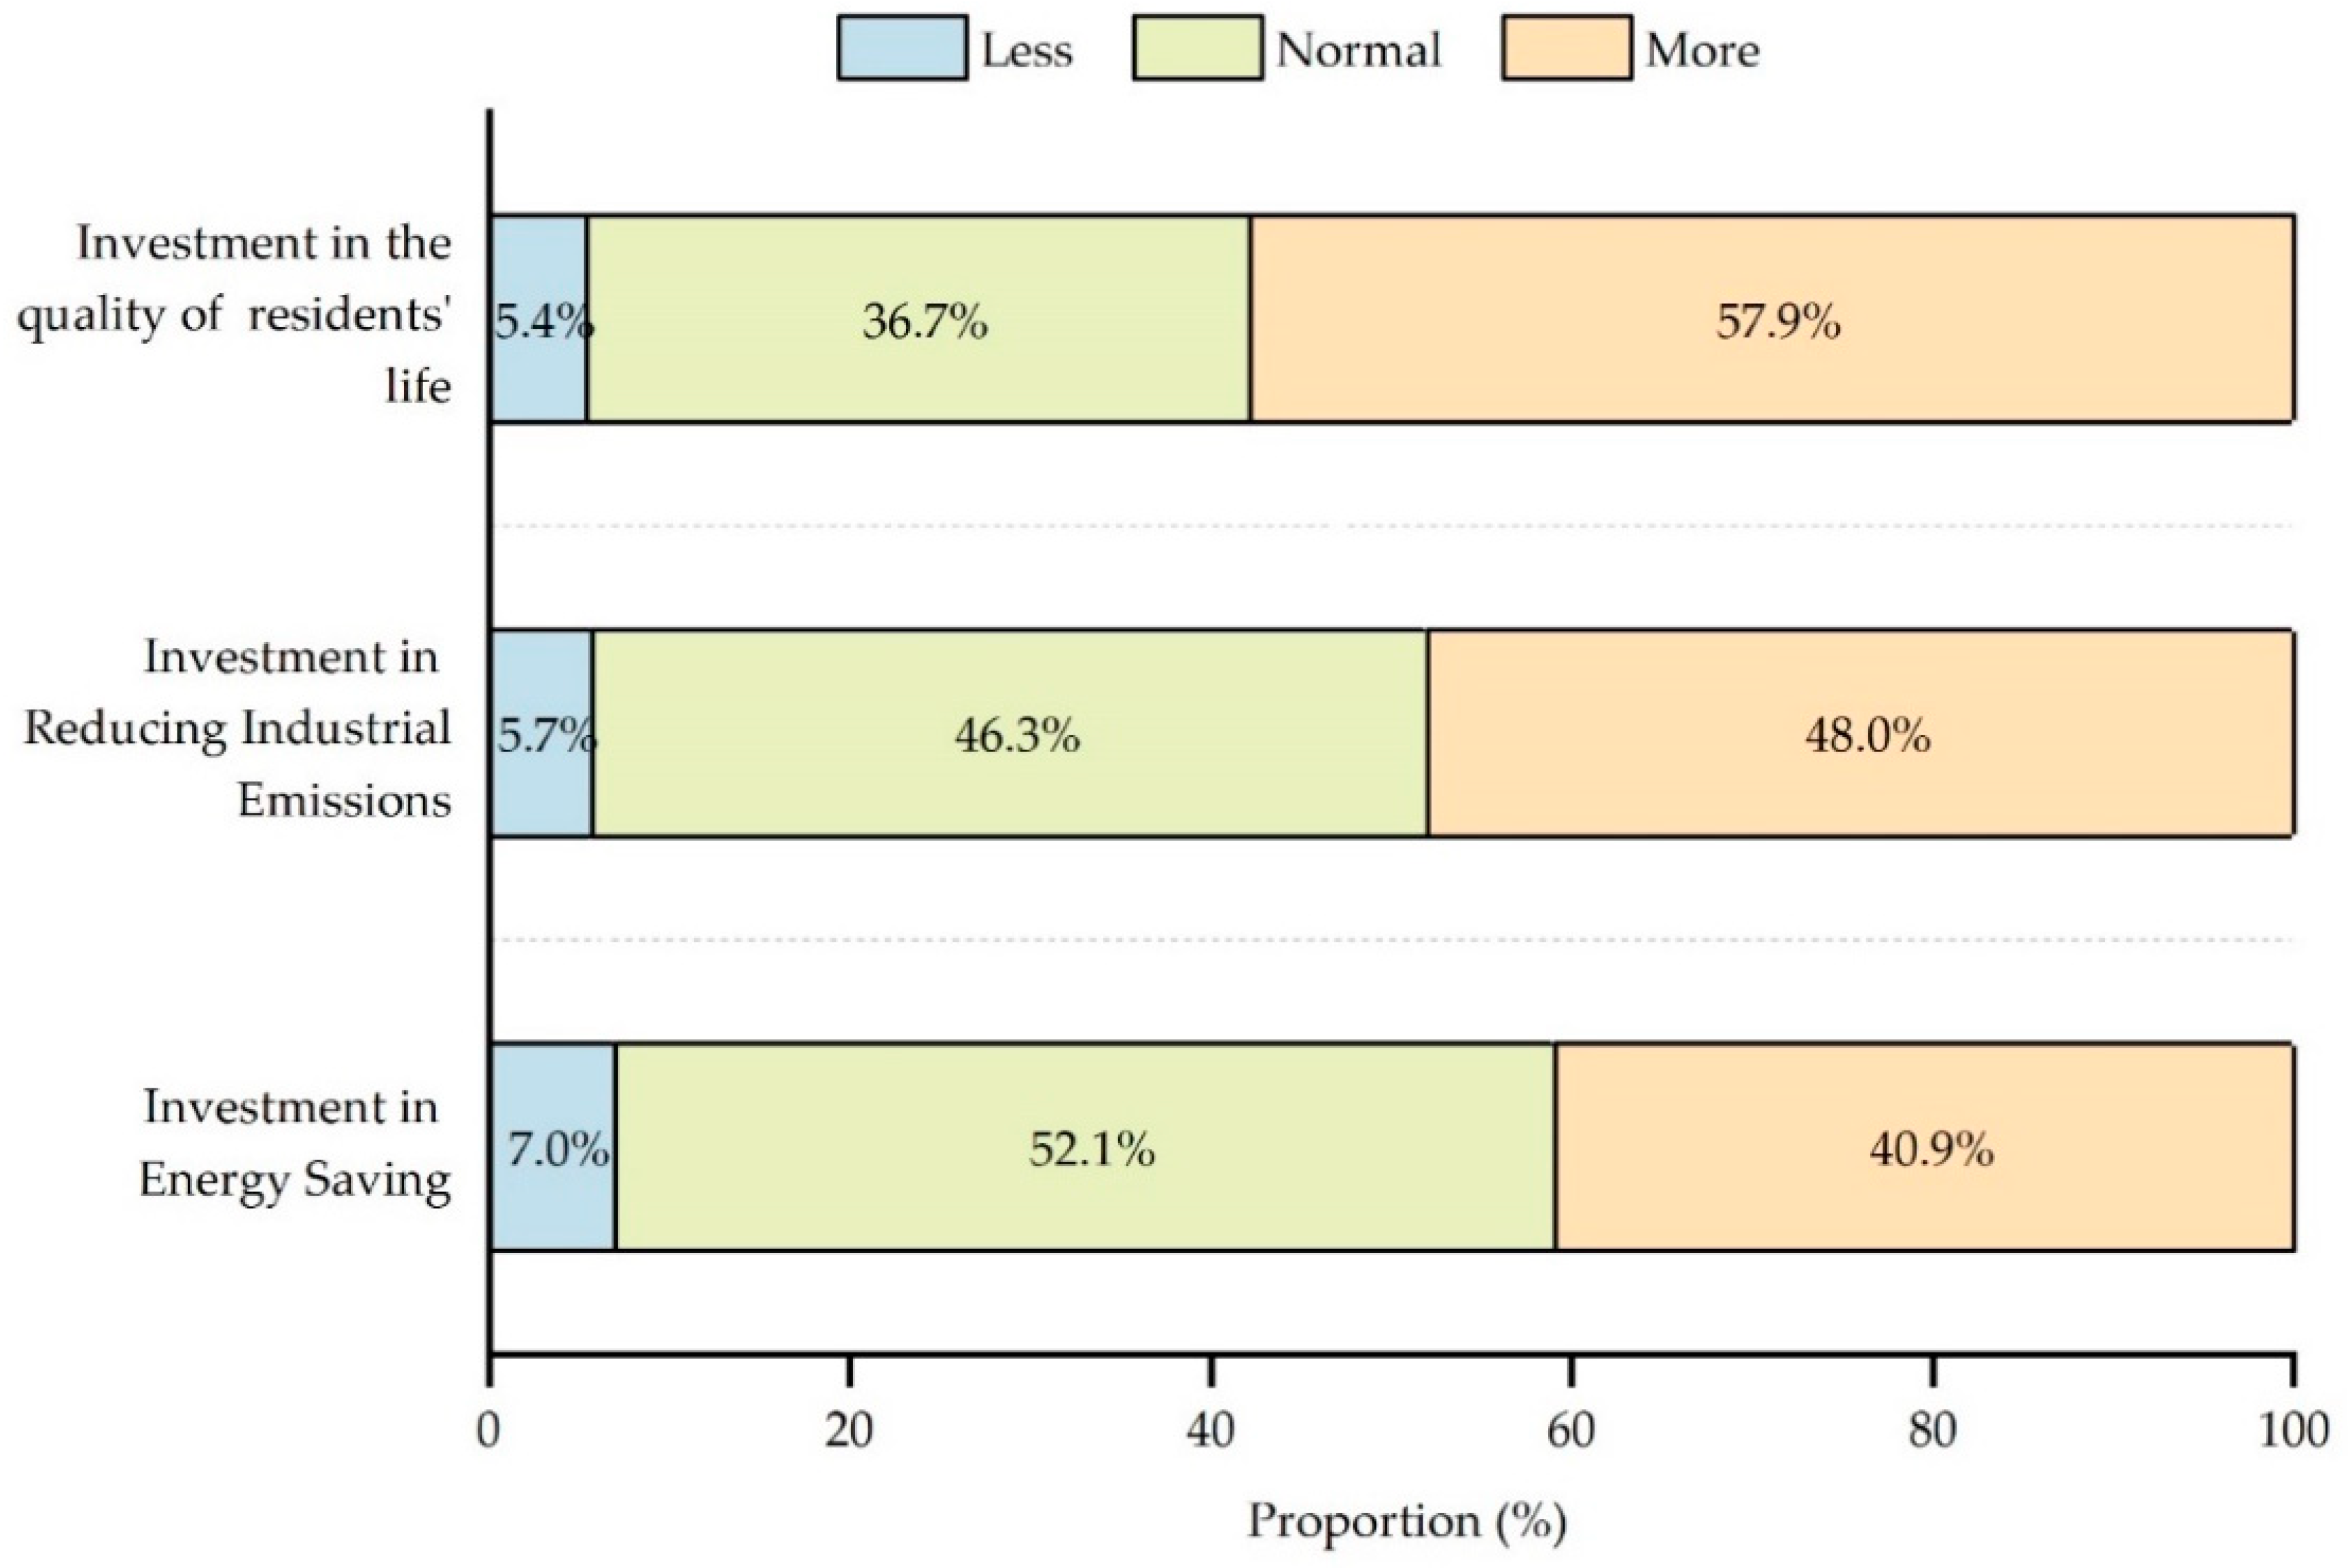
Figure 5). In terms of funding for green development, more respondents were likely to invest in urban human settlements compared to energy structure transformation and industrial pollutant control, accounting for 57.8% of the total (Figure 6). The above results show that the public’s intention to support the regional green development process is to effectively improve their own quality of life. Whether the quality of life and happiness of residents has been improved is also the key to assessing the success of green development [34].

3.3. Analysis of Respondents’ WTP for Green Development

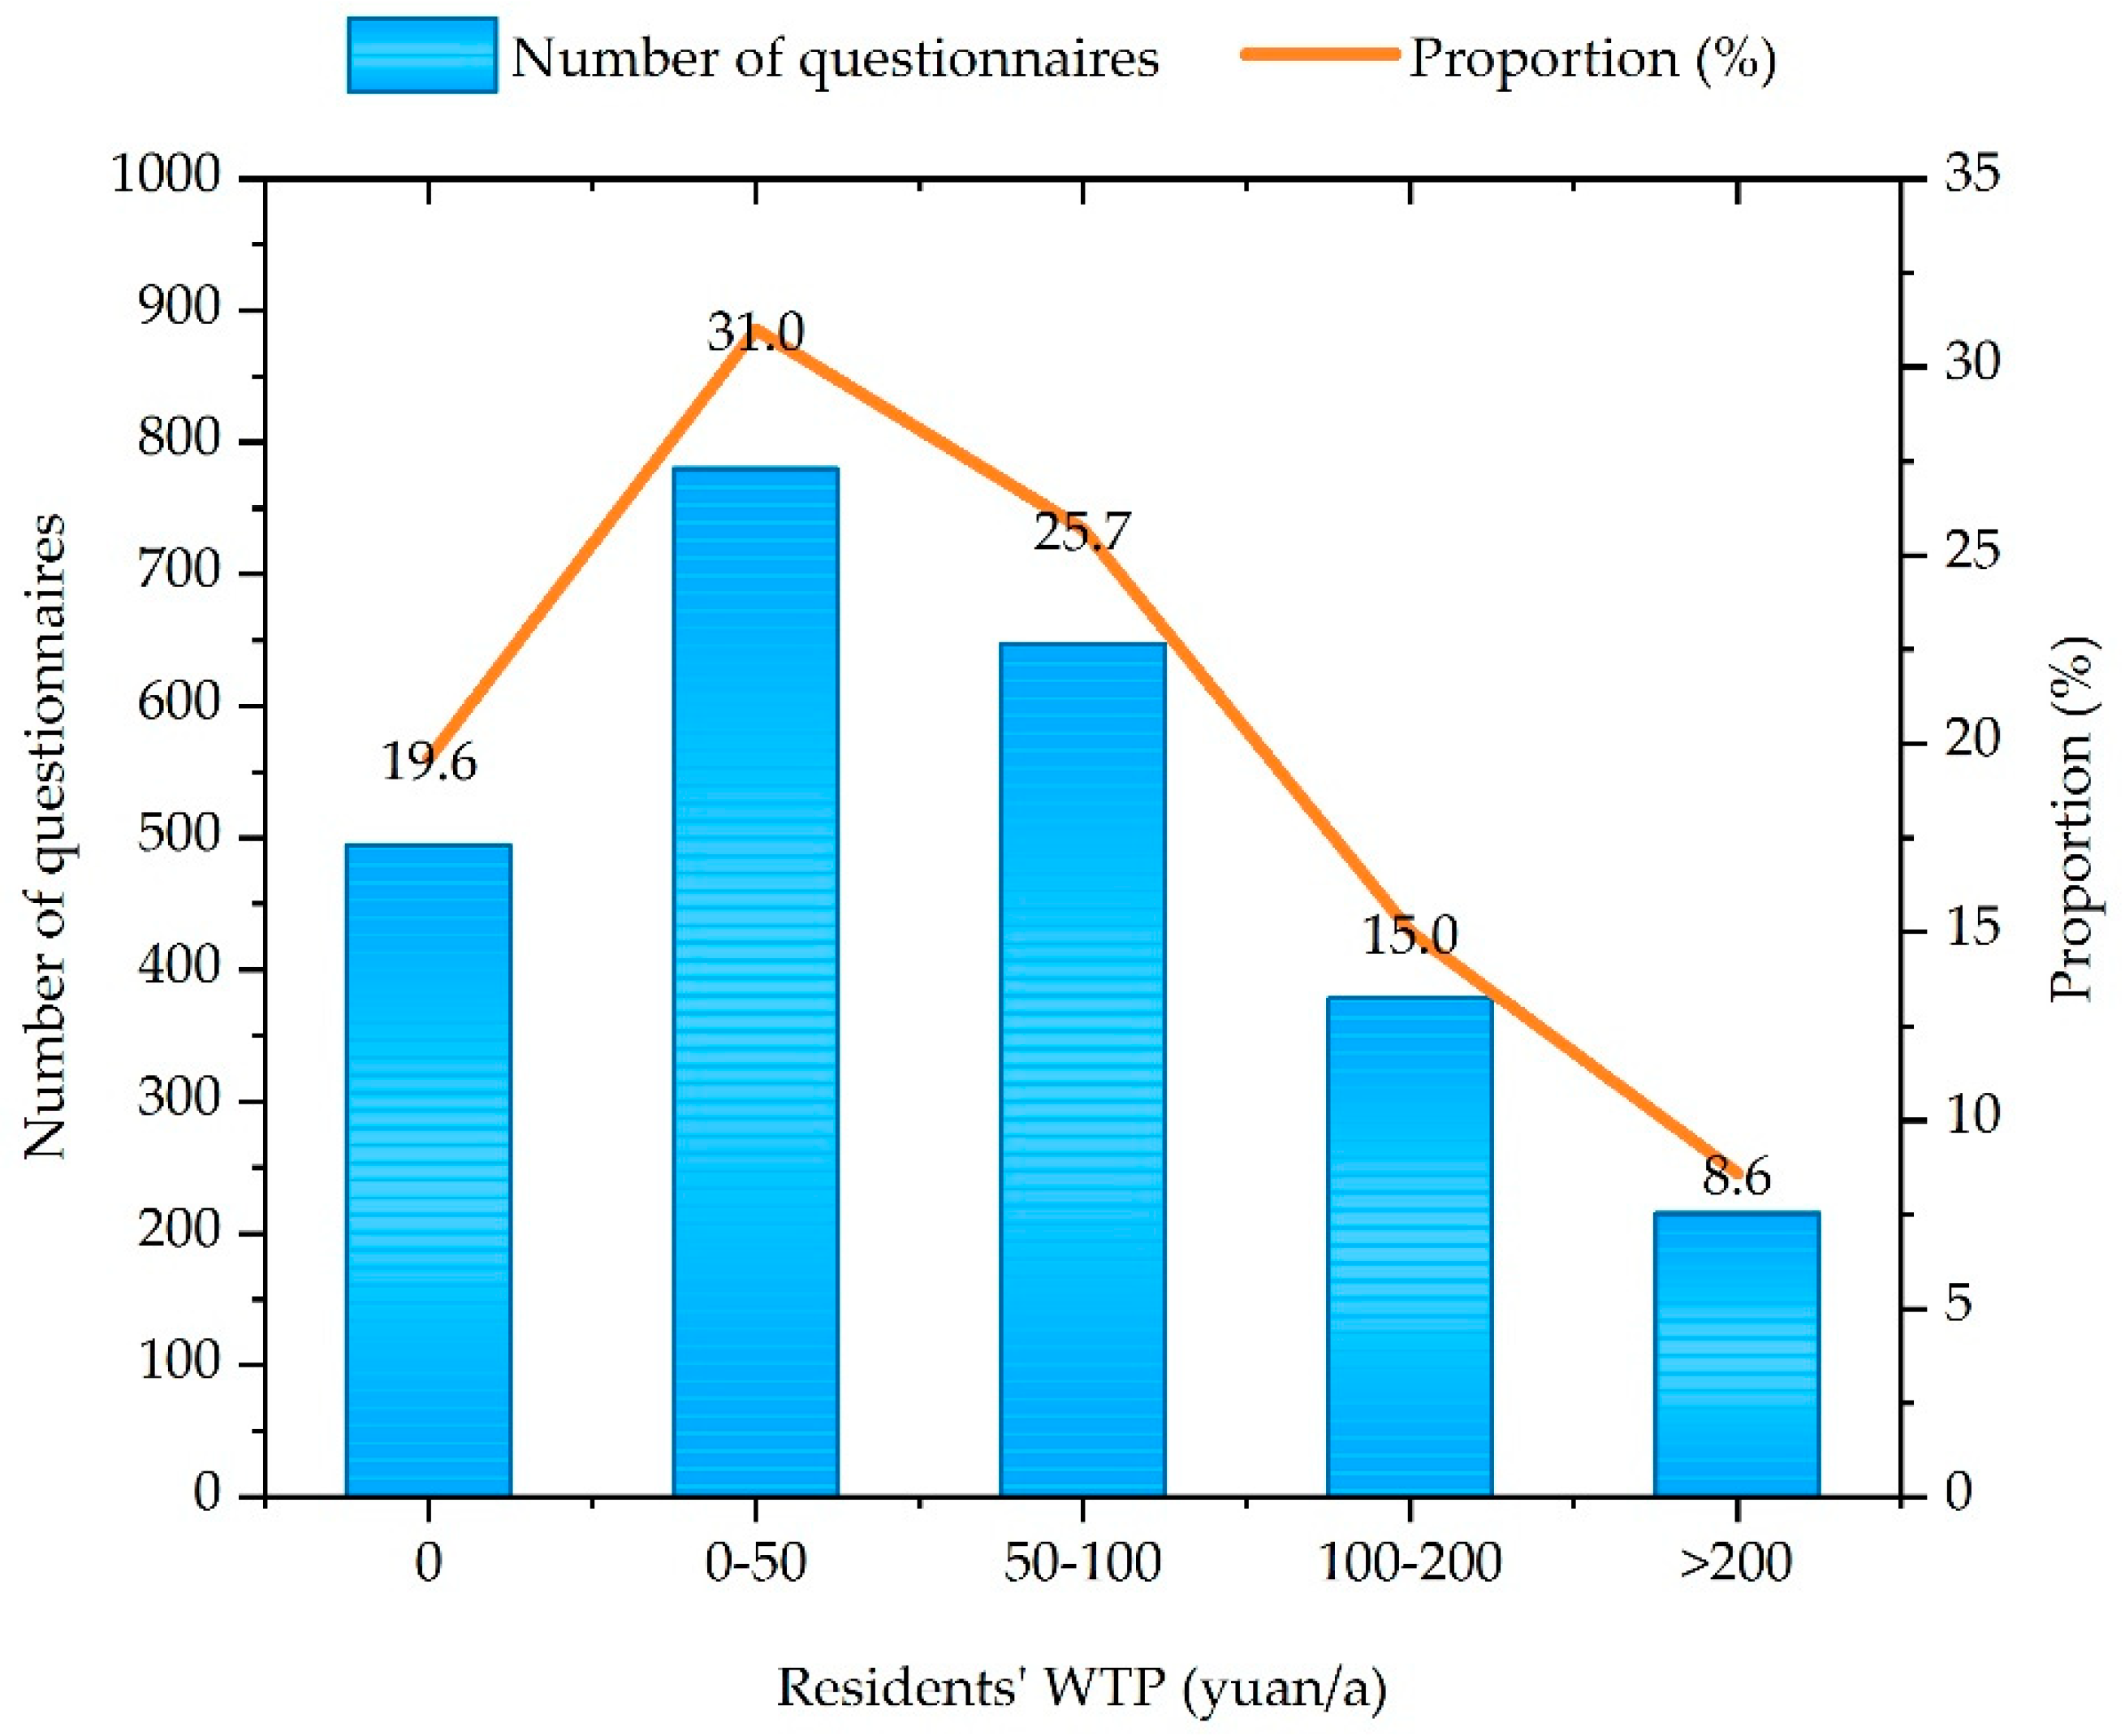
The cost that residents are willing to pay for their resource-based city to promote green development is the main focus of this research. According to statistics (Figure 7), among the 80.4% of the residents who agreed to pay, 38.56%, 31.97%, 18.66%, and 10.70% of the residents were willing to pay 0–50 yuan, 50–100 yuan, 100–200 yuan, and over 200 yuan respectively, to promote regional green development. Using the lower limit of the interval as the payment value, the calculated minimal public’s per capita WTP for green development is 45.05 yuan/a (about 7 dollars/a, 5.7 euros/a). A study on the WTP by Zhengzhou residents in the water-receiving area of the Middle Route of the South-to-North Water Transfer Project found that the highest per capita WTP was 99.48 yuan/year [35]. Xu et al. calculated and analyzed the WTP of the residents of the Liaohe River Basin and discovered that the per capita WTP was 160.72 yuan/year [36]. Compared with other research outcomes, the WTP obtained in this study is at a relatively low level.
On the one hand, this is related to factors such as the relatively new concept of green development in the region, the lack of acceptance by residents, and the relatively low-income level in underdeveloped areas. On the other hand, the possibility of an increase in residents’ WTP can be observed. With the smooth development of related work, after the public receives the dividends of green development, the bottom-up investment in ecological and environmental protection of the residents will inevitably become one of the strong driving forces for regional green development. Estimating with the population of Chifeng City in 2018, the total willingness of residents to pay exceeds 200 million yuan per year, representing 16% of the total investment in ecological environment protection of the Chifeng government that year. Although the actual total amount of WTP may be lower than this ratio because the hypothetical bias exists and the questionnaire survey strategy may affect WTP, the WTP is still considerable [30,37]. Therefore, relevant departments urgently need to explore the potential of residents to respond to green development in order to accelerate the process of the regional green development. Besides, as is depicted in Table 4, only 19.6% of residents indicated that they were unwilling to pay for the green development in their cities. The reasons for their refusal to pay were similar to the results obtained from previous studies [38]. Except for the main reason that people’s personal financial ability to pay is insufficient, some residents subscribed to the fact that paying for environmental services is not their own obligation and should be solely handled by the government.
Table 5 shows the coefficient results of interval regression of the respondents’ WTP for green development, and the values in parentheses are the standard errors. The first column of Table 5 shows the regression results of the full sample. Given the 19.6% of zero WTP responses, we ran a hurdle model specification [33]. Firstly, we estimated the probability that a respondent reports WTP greater than zero using probit regression (the second column) and then estimated WTP conditional level on such participation using interval regression (the third column). The results showed that the gender, household registration, education level, and annual income of residents significantly impact the WTP for green development. Annual income has the greatest impact on WTP, followed by gender, education level, and household registration. A more detailed analysis of these determinants is presented in Section 3.5.

3.4. The Impact of Respondents’ Socioeconomic Characteristics on Their Attitudes towards Green Development in Resource-Based Cities

This survey investigated the attitudes of residents of resource-based cities with different characteristics to the government’s promotion of the regional green development. Based on a one-way ANOVA, the study found that respondents of different gender, age, household registration, occupation, education level, and annual income had different attitudes. Mathematical proofs of the results are added as appendices (Table A1, Table A2, Table A3 and Table A4).
In terms of gender, women are more supportive of regional green development than men. In terms of age, based on multiple comparative analysis, it was found that the older the respondents are, the more they agree with the government’s promotion of green development, except for the age group of 50–60 and above 60. There are significant differences in the public’s attitudes towards the green development in different household registration areas. In comparison with suburban and rural residents, urban residents are more inclined to support regional green development transformation. Women and the elderly are more concerned about or more likely to have a relatively superior personal living environment. In addition, urban residents have more obvious advantages than suburban and rural residents. It is this kind of concern for their own living environment and quality that makes the above-mentioned people more equipped with the subjective and objective conditions to take care of the environment in which they live.
Respondents of different occupations have significant differences in attitudes towards the government’s promotion of green development. Government officials and private business owners have a strong tendency towards green development. As the main pioneer of regional green development, government officials are more proactive in regional green development because they are more in tune with relevant policy theories. According to the average scores of groups with different levels of education, we believe that the higher the level of education, the higher the degree of approval of the government to promote of green development. Based on prior research findings, education plays a vital role in shaping values, thereby affecting people’s cognition and acceptance. Generally, educated people have more understanding of green development and are very inclined to make more environmentally conscious choices.
There are no significant differences in the ANOVA for groups of people with different annual income. The difference in annual income does not affect their common understanding of promoting green regional development and transformation. This is inseparable from the widespread dissemination of ecological civilization thoughts in China in recent years as well as the urgent need for all residents to improve the quality of the ecological environment in the region.

3.5. The Impact of Respondents’ Socioeconomic Characteristics on Residents’ WTP

Respondents of different genders, ages, household registrations, occupations, education levels, and annual income levels had different WTP for green development. In contrast with women, men have higher WTP, which may be closely related to men’s possession of more social resources. Different age groups exhibited different WTP for regional green development. The young and middle-aged groups (17–49 years old) are more inclined to invest in the regional green development, while the elderly groups with higher paying ability (above 50 years old) showed a weak WTP. This may be attributed to the respondents’ growth background and education. Respondents aged 17–49 are mostly open-minded, easy to accept new things, and have a certain income base, so they tend to show a relatively high level of payment. This is more evident in the age group of 28–38. Respondents over 50 years of age are relatively conservative in their thinking, with declining income expectations, so their payment amount is relatively low [39]. The public’s readiness to pay for green development in different household registration locations differs significantly. Compared with suburban and rural residents, urban residents have a more significant intention to pay higher amounts, which is strongly connected to their higher income and their more convenient access to information. Furthermore, the enthusiasm to pay by different occupational groups also revealed substantial differences. Besides, government officers and business staff with stable jobs and ample income have relatively higher WTP, while farmers, service personnel, and retired groups also indicated concern for regional green development, and their WTP is relatively low due to unstable income sources. The mathematical proofs of the above results are added as appendices (Table A5, Table A6, Table A7 and Table A8).
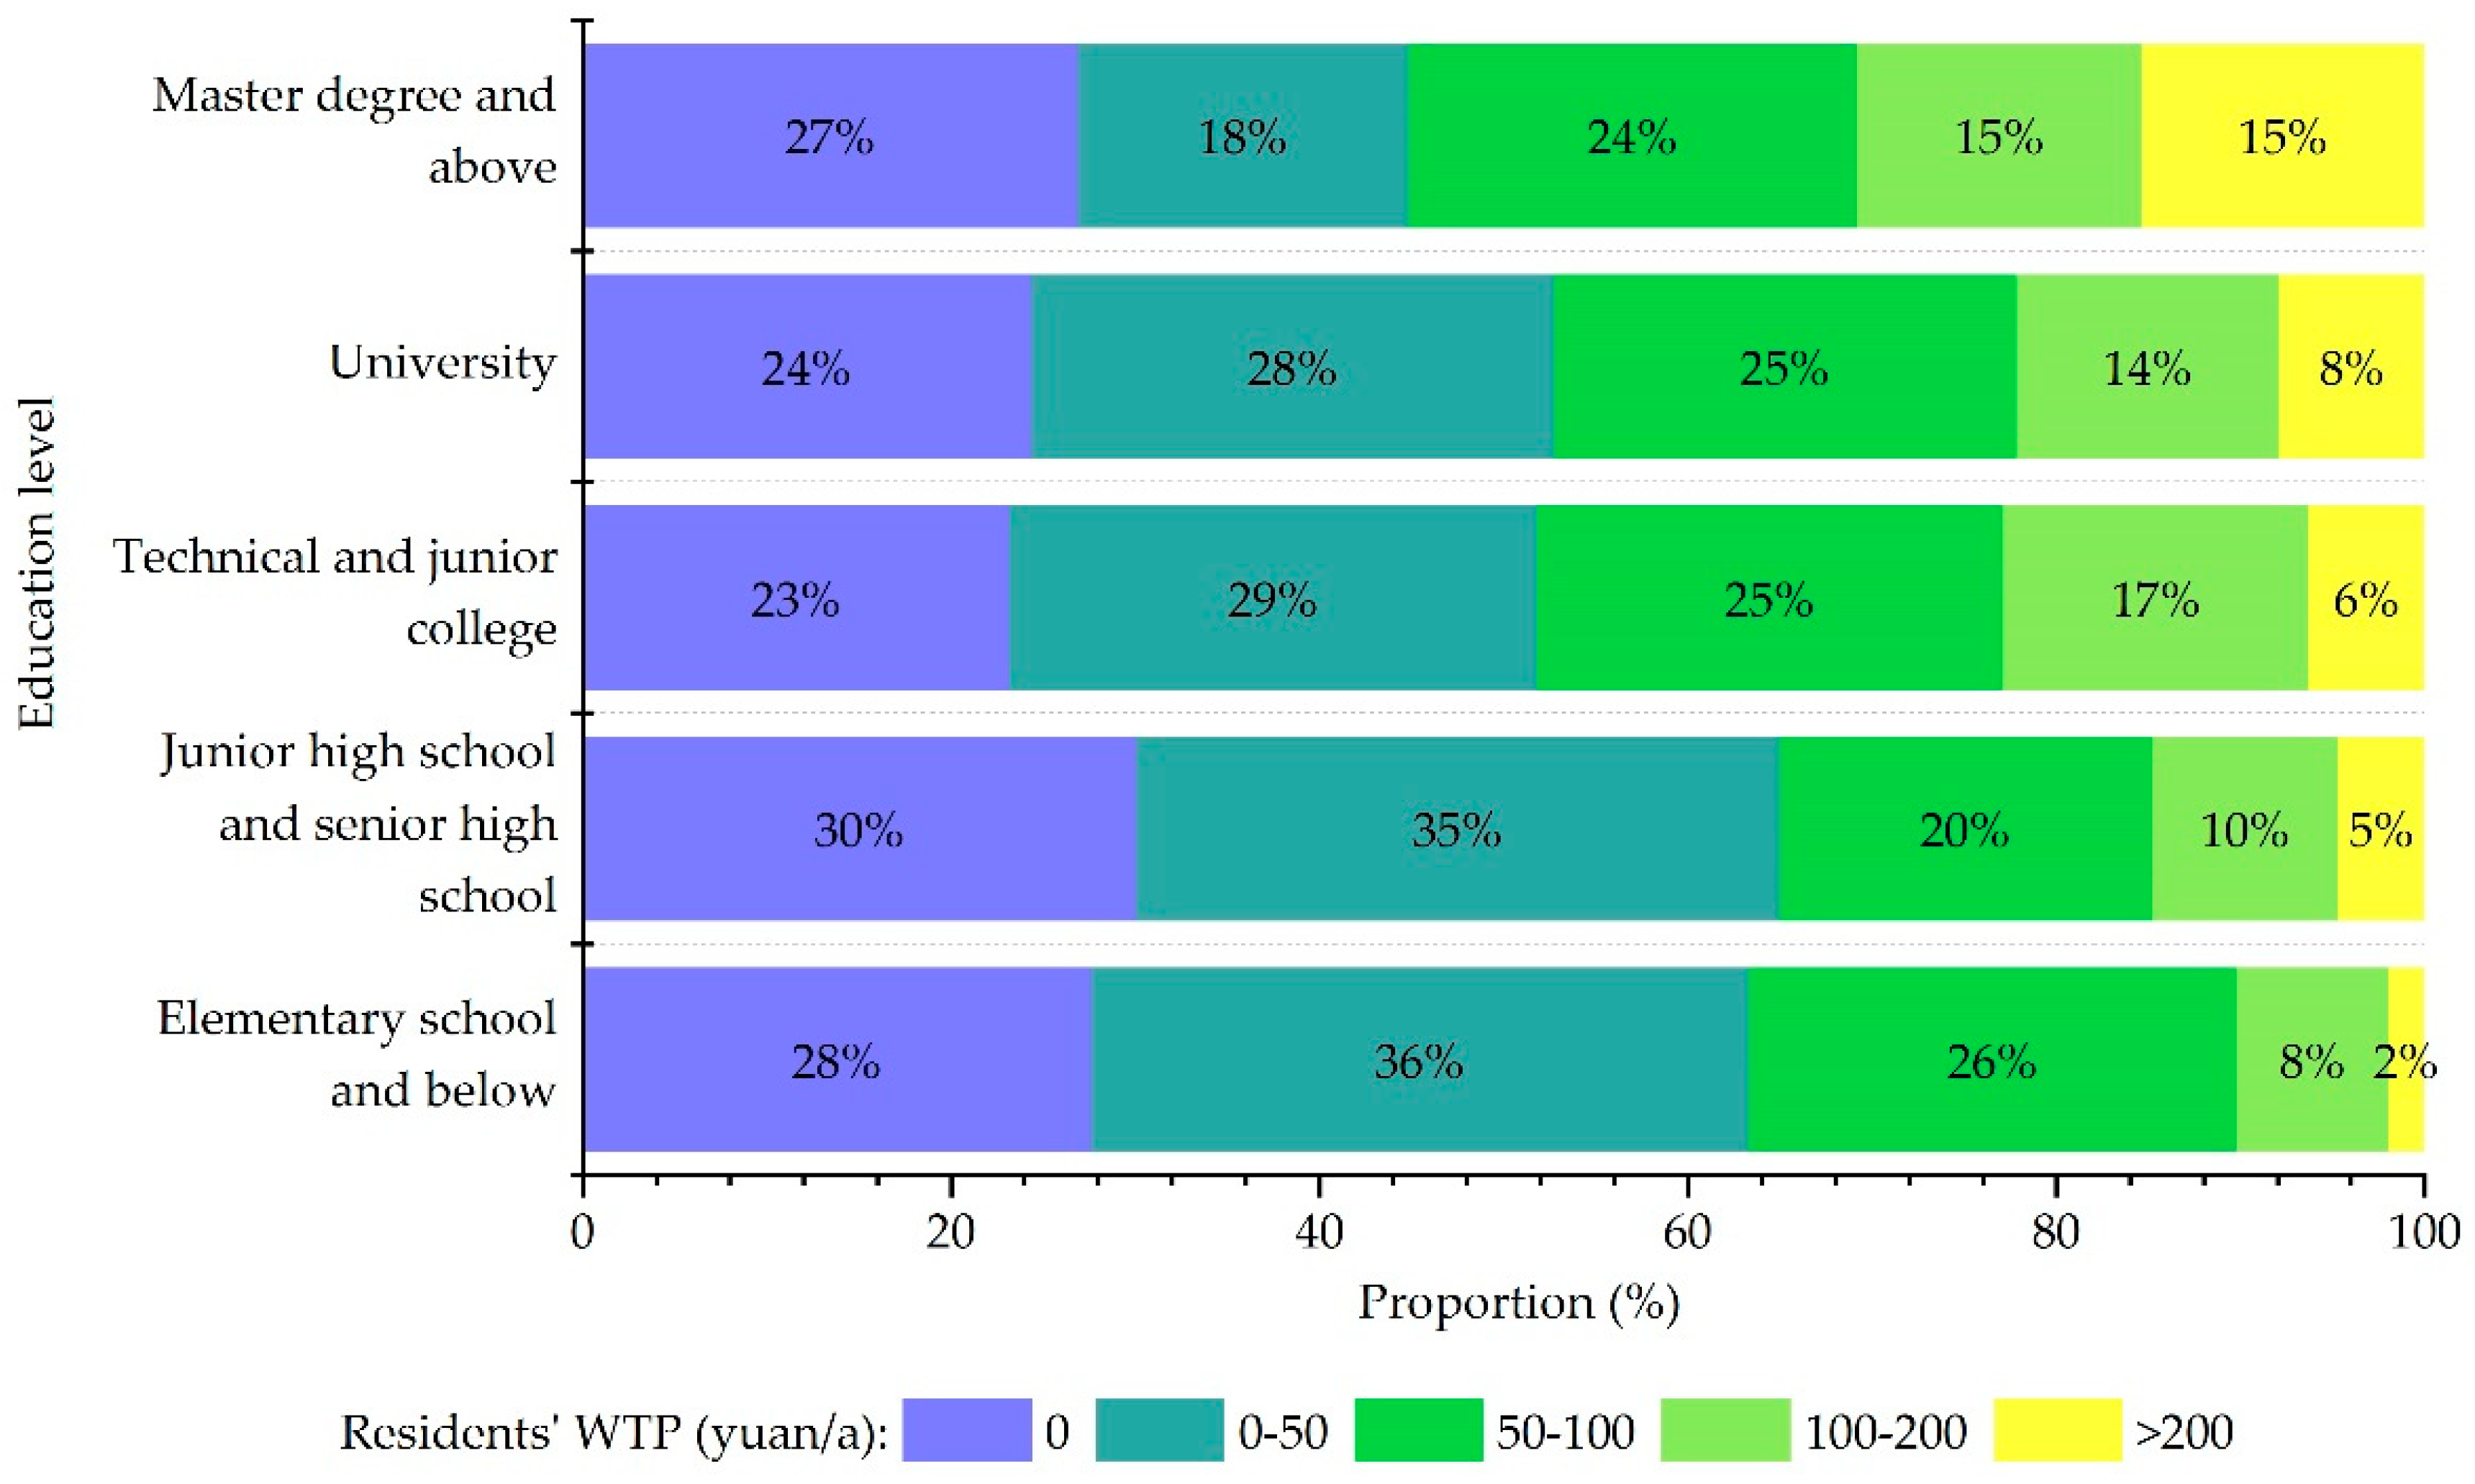
Education level is also an important factor affecting the tendency to pay. As exemplified in Figure 8, respondents with an education level of elementary school and below are eager to pay much less for urban green development than other groups. With the increase in the education level, the inclination to pay has increased significantly. Education has been proven to be a principal factor influencing people’s behaviors and opinions [40]. A well-educated person may have a comprehensive understanding of the importance of environmental issues [41].
There is a positive correlation between annual income level and WTP. Respondents with higher annual income are more willing to contribute greater portion of their income for regional green development. As illustrated in Figure 9, respondents with the annual income of more than 150 thousand yuan have the highest tendency to pay, which is three times higher than those with an annual income of less than 50 thousand yuan. Previous research has also reported that people with higher incomes are enthusiastic to pay for environmental-related issues, which is as a result of their high level of information literacy [42,43].
The results of the ANOVA and multiple comparisons showed that urban residents, government officers, and well-educated respondents were keen to support regional green development and showed a strong WTP. The elderly and female respondents highly support the promotion of regional green development process, while men, middle-aged, and young people demonstrated higher WTP for green development. The difference in the annual income of the respondents is not reflected in their common perception of promoting green development in the region, but rather in the amount of their WTP. By analyzing the residents’ “attitude towards government’s promotion of regional green development” and “WTP for green development”, it was discovered that there are two different processes, which need to be analyzed and treated separately. Residents’ attitude towards the government’s promotion of regional green development depends more on residents’ demands for maintaining and obtaining a higher quality of life. The better the living environment, the more secure the job is, the better the living environment for individuals, the more subjective and objective conditions for caring about the environment in which they live, which are more prominent in both elderly and female respondents [44]. The public’s recognition and acceptance of green development (related to education level) are the key prerequisites for residents to support regional green development and be ready to invest in it. On this basis, the respondents’ own income expectations and capability to pay are the key factors affecting the amount of payment.

3.6. Respondents’ Preference for Green Development Payment Forms

The study of residents who are willing to pay found out that these residents mostly prefer the form of payment by public fundraising (764 respondents), followed by uniform distribution after paying taxes to the country (616 respondents), and then cash or transfer to the local government environmental protection department (511 respondents). Some residents chose more than one option. Education level has a direct impact on the choice of payment methods. Respondents with higher education are more inclined to choose two methods: paying taxes and submitting them to government environmental protection departments. Respondents with middle school education and below had a preference to pay property fees to the community. Age is also one of the important factors that affect the choice of payment methods. In contrast with other groups, the elderly group (above 61 years old) does not want to pay by taxation. In addition, this study also conducted a survey on the compensation methods that residents hope to receive after participating in the regional green development process. It turned out that in terms of compensation strategies, residents prefer eco-tourism discounts, followed by personal work performance, and then personal credit systems.

4. Conclusions and Recommendations

4.1. Conclusions

Resource-based cities have made great contributions to human development, but the various unsustainable ills that have accumulated in the process of historical development have caused great harm to human survival and development. China is therefore proposing a green development strategy to improve the green sustainable development capabilities of regions including resource-based cities. However, most of the current research on green development is based on a top-down perspective, and few studies have focused on the public’s response to the regional green development. From the public perspective, this study conducted a questionnaire survey in Chifeng, a typical resource-based city in Inner Mongolia, China, with the aim of exploring the local residents’ understanding of the green development of resource-based cities and evaluating the potential investment of residents on the local green development. The main findings of this study are as follows:
(1)
Although the majority of interviewees in the region were concerned with ecological and environmental protection, their understanding of green development needs to be strengthened. Most interviewees supported the implementation of green development strategies in the region, but still believed that top-down government investment should be the main source of funding. However, the general public has also expressed their strong willingness to participate in regional green development investments.
(2)
According to calculations, the per capita WTP for “green development” in Chifeng City is 45.05 Chinese yuan (about 7 USD, 5.7 EUR) per year. Based on this estimate, the total bottom-up WTP of Chifeng residents will exceed 200 million yuan per year, accounting for 16% of the total investment in environmental protection in Chifeng throughout the year. It can be glaringly clear that residents have great potential to respond to the regional green development strategy.
(3)
Urban residents, government employees, and well-educated respondents were more likely to support regional green development and showed a greater WTP, which suggests that enhancing public environmental education and providing accessible environmental knowledge is essential for green development. Elderly and female respondents were more in agreement with the government’s promotion of regional green development, while the young and middle-aged populations and men tended to have higher personal green development expenditures. The difference in annual income of the interviewees was not directly reflected in the residents’ common perception of promoting regional green development, but rather in the amounts of residents’ WTP.
(4)
Residents’ attitude to the government’s promotion of regional green development depends more on residents’ demands for maintaining and achieving a higher quality of life, and the public’s recognition and acceptance of green development are key prerequisites for residents to support and invest in regional green development. On this basis, the income expectations and ability of residents to pay are the main factors affecting the amount of the payment.
(5)
Public fundraising is a more preferred form of green development payment for Chifeng residents, while education level and age are key factors influencing the choice of payment methods for green development by residents.

4.2. Policy Recommendations

(1)
Improve policy legislation and increase the residents’ enthusiasm for participation. The successful transformation of the green development of resource-based cities is inseparable from sound policies and incentive reward mechanisms. In the context of a systematic green development project, the government should play an active role in improving relevant policies and legislation and set up an incentive reward mechanism to increase public participation and broaden the source of regional green development funds. At the same time, a combination of decentralization, management, and service should be provided to the relevant management agencies not only to ensure a healthy and orderly transformation of regional green development, but also to attract the masses to participate in related construction. In this way, the sense of ownership of the public is improved, and the government management is transformed from a regulatory government to a service-oriented government [45].
(2)
Introduce market mechanisms to stimulate the enthusiasm for the participation of residents. Results have shown that the majority of respondents exhibited a positive WTP for regional green development, and the amount of payment is higher compared with similar research findings. As a result, changing the traditional mode of top-down government investment in green development has practical feasibility and a broad public opinion foundation. The introduction of a market-oriented operation mode is an effective way of promoting regional green development in the new stage. Private capital participation and a market-oriented operating model will not only reduce the local government capital investment in regional green development but will also ensure a stable source of funding. Moreover, it generates income for the general public and promotes the potential of their eagerness to pay, which will lay a solid foundation for the orderly transformation of regional green development.
(3)
Strengthen education and dissemination of information on green development. Green development has become a national strategy for the transformation of China’s resource-based cities. Public participation and fundraising are very important in the implementation of green development. Green development education should be strengthened in order to promote public participation. In addition to vigorously enhancing the information dissemination capacity of new media such as the internet, TV, and radio, diverse advertising activities should also be utilized to broaden the channels of information dissemination. The content of the promotion should not only be the definition and connotation of green development but should also emphasize the economic and environmental benefits of green development for residents. The dissemination of information should be carried out not only by government agencies and decision makers, but also by other stakeholders (such as non-governmental organizations, universities, and enterprises) in order to call on more social groups and residents to participate in the regional green development process, creating a new situation in which multiple actors work together to promote the construction of regional ecological civilization.

Author Contributions

G.W., Y.Z., M.Z., and X.Z. conceived the general idea of the paper. M.Z., C.W., and X.Z. designed the questionnaire. All authors analyzed and discussed the results. M.Z., X.Z., and C.W. wrote this paper. All authors have read and agreed to the published version of the manuscript.

Funding

This study was funded by The National Key Research and Development Program of China (No. 2016YFC0503603).

Institutional Review Board Statement

Not applicable.

Informed Consent Statement

Informed consent was obtained from all subjects in-volved in the study.

Data Availability Statement

The data presented in this study are available on suitable demand.

Conflicts of Interest

The authors declare no conflict of interest.

Appendix A

Table A1. The mean and variance of the respondents’ perception of green development.
Independent VariableRespondents’ Attitude towards the Government’s Promotion of Green Development
MeanStandard Deviation
Gender
Male4.150.813
Female4.210.760
Age
17–274.150.870
28–384.160.763
39–494.170.803
50–604.200.677
>614.270.757
Household registration
Urban4.250.745
Suburban3.950.855
Rural3.780.909
Occupation
Government officer4.360.687
Technical worker4.240.782
Business staff4.260.736
Private business owner4.330.700
Farmer3.870.893
Industrial worker4.060.864
Waiter4.030.810
Retired employees4.190.744
Housewife4.110.667
Student4.170.772
Unemployed3.900.878
Others4.080.848
Education level
Below elementary school3.770.963
Junior high and high school4.050.778
Technical secondary school and college4.170.779
Undergraduate4.340.700
Above Master’s degree 4.380.938
Annual income (yuan)
<50,000
50,000–100,000
100,000–150,000
>150,000
The higher the average score, the stronger the willingness to promote green development. There is no difference in the attitude towards the government’s promotion of green development among respondents with different annual incomes, so the average value is empty.
Table A2. Impact of gender on respondents’ attitude towards the government’s promotion of green development (Chi-square test).
ValueDegree of Freedom (df)Significance (2-Tailed)
Pearson Chi-square12.557 a40.014
Likelihood ratio12.41340.015
Linear and linear combination Chi-square5.61910.018
N-chi square in effective cases2566
a 0 cells (0%) have expected count less than 5. The minimum expectated count is 5.69.
Table A3. Impact of the respondents’ characteristics on the attitude towards the government’s promotion of green development (single-factor analysis of variance).
Independent Variable Sum of SquaredfMean SquareFp-Value
AgeWithin-group variability591.0084147.752385.8280.000
Between-group variability981.11225620.383
Total1572.1202566
Household
registration
Within-group variability49.590224.79542.0100.000
Between-group variability1510.35325590.590
Total1559.9432561
OccupationWithin-group variability42.069113.8246.4690.000
Between-group variability1511.19625560.591
Total1553.2652566
Annual incomeWithin-group variability7.63432.5454.1700.006
Between-group variability1564.10125630.610
Total1571.7352566
Education levelWithin-group variability56.120414.03023.9510.000
Between-group variability1501.93925620.586
Total1558.0592566
Table A4. Impact of the respondents’ characteristics on the attitude towards the government’s promotion of green development (Dunnett’s t test).
Independent VariableIJDifference of Mean (I − J)Standard ErrorSignificance95% Confidence Interval
Upper BoundLower Bound
Age17–27>61−1.731 *0.0650.000−1.89−1.57
28–38>61−1.601 *0.0540.000−1.73−1.47
39–49>61−0.256 *0.0330.000−0.34−0.17
50–60>61−0.0330.0300.693−0.110.04
Household
registration
UrbanRural0.300 *0.0490.0000.190.41
SuburbanRural−0.171 *0.0770.049−0.340.00
OccupationGovernment officerOthers0.280 *0.0620.0000.110.45
Technical workerOthers0.1550.0600.081−0.010.32
Business staffOthers0.1750.0680.084−0.010.36
Private business ownerOthers0.252 *0.0810.0170.030.48
FarmerOthers−0.2100.0880.142−0.460.04
Industrial workerOthers−0.0240.0901.000−0.270.22
WaiterOthers−0.0510.0740.997−0.250.15
Retired employeesOthers0.1100.0680.575−0.080.30
HousewifeOthers0.0240.0901.000−0.220.27
StudentOthers0.0880.0760.893−0.120.30
UnemployedOthers−0.1770.1280.764−0.530.18
Annual income<50,000>150,0000.0980.0910.435−0.100.30
50,000–100,000>150,0000.1340.0920.240−0.070.34
100,000–150,000>150,000−0.0840.1070.628−0.320.15
Education levelBelow elementary schoolAbove Master’s degree−0.761 *0.1160.000−1.03−0.50
Junior high and high schoolAbove Master’s degree−0.449 *0.0920.0000.66−0.24
Technical secondary school and collegeAbove Master’s degree−0.344 *0.0900.000−0.55−0.14
UndergraduateAbove Master’s degree−0.1730.0900.117−0.380.03
The significance level of the mean is 0.05 * Dunnett’s t test treats one group as a control group and compares it with all other groups.
Table A5. Respondents’ WTP for green development.
Independent VariableAverage Minimum WTP (yuan)AverageStandard Deviation
Overall45.05————
Gender
Male53.42.751.291
Female39.352.531.125
Age
17–2745.12.621.196
28–3848.152.691.199
39–4944.82.621.182
50–6044.752.581.245
>6135.752.401.174
Household registration
Urban 2.671.206
Suburban 2.421.074
Rural 2.291.129
Occupation
Government officer56.252.841.247
Technical worker49.12.741.172
Business staff58.32.871.263
Private business owner52.52.761.257
Farmer26.52.161.070
Industrial worker39.52.591.055
Waiter31.952.411.042
Retired employees332.341.149
Housewife34.952.301.215
Student38.652.471.156
Unemployed41.252.531.261
Others42.82.561.194
Education Level
Below elementary school20.652.021.016
Junior high and high school34.052.361.142
Technical secondary school and college442.611.177
Undergraduate53.752.821.217
Above Master’s degree73.453.131.257
Annual Income (yuan)
<50,00032.32.341.128
50,000–100,00054.42.831.186
100,000–150,00072.953.251.102
>150,000100.653.611.259
Table A6. Impact of gender on the WTP for green development (Chi-square test).
ValueDegree of FreedomSignificance (2-Tailed)
Pearson Chi-square45.852 a40.000
Likelihood ratio45.47640.000
Linear and linear combination Chi-square18.07010.000
N-chi square in effective cases2506
a 0 cells (0%) have expected count less than 5. The minimum expectatied count is 87.68.
Table A7. Impact of the respondents’ characteristics on the WTP for green development (single-factor analysis of variance).
Independent Variable Sum of SquaredfMean SquareFp-Value
AgeWithin-group variability21.26145.3153.6950.005
Between-group variability3590.83824961.439
Total3612.0992500
Household
registration
Within-group variability41.038220.51914.4640.000
Between-group variability3539.33024951.419
Total3580.3672497
OccupationWithin-group variability109.826119.9847.1100.000
Between-group variability3497.84824911.404
Total3607.6732502
Annual incomeWithin-group variability296.763398.92174.5040.000
Between-group variability3316.65824981.328
Total3613.4222501
Education levelWithin-group variability124.460431.11522.2710.00
Between-group variability3489.93024981.397
Total3614.3902502
Table A8. Impact of the characteristics of the respondents on the WTP for green development (Dunnett’s t test).
Independent VariableIJDifference of Mean (I − J)Standard ErrorSignificance95% Confidence Interval
Upper BoundLower Bound
Age17–27>610.237 *0.0880.0240.020.45
28–38>610.305 *0.0810.0010.110.50
39–49>610.237 *0.0890.0250.020.45
50–60>610.1860.0980.160−0.050.42
Household
registration
UrbanRural0.382 *0.0770.0000.210.55
SuburbanRural0.1250.1230.482−0.150.40
OccupationGovernment officerOthers0.278 *0.0980.0410.010.55
Technical workerOthers0.1780.0940.373−0.080.44
Business staffOthers0.325 *0.1060.0370.010.60
Private business ownerOthers0.1890.1260.665−0.160.54
FarmerOthers−0.387 *0.1390.048−0.770.00
Industrial workerOthers0.0240.1411.000−0.370.42
WaiterOthers−0.1520.1150.801−0.470.17
Retired employeesOthers−0.2300.1060.225−0.530.06
HousewifeOthers−0.2430.1440.520−0.640.15
StudentOthers−0.0940.1180.991−0.420.23
UnemployedOthers−0.0410.2031.000−0.600.52
Annual income<50,000>150,000−1.299 *0.1380.000−1.60−0.99
50,000–100,000>150,000−0.793 *0.1390.000−1.10−0.48
100,000–150,000>150,000−0.381 *0.1610.035−0.74−0.02
Education levelBelow elementary schoolAbove Master’s degree−1.124 *0.1810.000−1.54−0.71
Junior high and high schoolAbove Master’s degree−0.787 *0.1440.000−1.12−0.46
Technical secondary school and collegeAbove Master’s degree−0.550 *0.1400.000−0.87−0.23
UndergraduateAbove Master’s degree−0.338 *0.1410.039−0.66−0.01
The significance level of the mean is 0.05. * Dunnett’s t test treats one group as a control group and compares it with all other groups.

References

  1. Li, H.J.; Long, R.Y.; Chen, H. Economic transition policies in chinese resource-based cities: An overview of government efforts. Energy Policy 2013, 55, 251–260. [Google Scholar] [CrossRef]
  2. Littlewood, D. ‘Cursed’ communities? Corporate social responsibility (csr), company towns and the mining industry in namibia. J. Bus. Ethics 2014, 120, 39–63. [Google Scholar] [CrossRef]
  3. Suocheng, D.; Zehong, L.I.; Bin, L.I.; Mei, X.U.E. The problems and strategies on economic transformation of resource-based cities in china. China Popul.·Resour. Environ. 2007, 17, 12–17. [Google Scholar] [CrossRef]
  4. Wan, L.; Ye, X.; Lee, J.; Lu, X.; Zheng, L.; Wu, K. Effects of urbanization on ecosystem service values in a mineral resource-based city. Habitat Int. 2015, 46, 54–63. [Google Scholar] [CrossRef]
  5. Duruibe, J.O.; Ogwuegbu, M.O.C.; Egwurugwu, J.N. Heavy metal pollution and human biotoxic effects. Int. J. Phys. Sci. 2007, 2, 112–118. [Google Scholar]
  6. Tang, Z.W.; Chai, M.; Cheng, J.L.; Jin, J.; Yang, Y.F.; Nie, Z.Q.; Huang, Q.F.; Li, Y.H. Contamination and health risks of heavy metals in street dust from a coal mining city in eastern china. Ecotox. Environ. Safe. 2017, 138, 83–91. [Google Scholar] [CrossRef]
  7. Li, L.; Lei, Y.; Wu, S.; He, C.; Yan, D. Study on the coordinated development of economy, environment and resource in coal-based areas in shanxi province in china: Based on the multi-objective optimization model. Resour. Policy 2018, 55, 80–86. [Google Scholar] [CrossRef]
  8. Cobbinah, P.B.; Amoako, C. From gold coast to ghana: Changing political economy of mining towns. Cities 2018, 83, 83–91. [Google Scholar] [CrossRef]
  9. Sachs, J.D.; Warner, A.M. The curse of natural resources. Eur. Econ. Rev. 2001, 45, 827–838. [Google Scholar] [CrossRef]
  10. Zeng, L.; Guo, J.; Wang, B.; Lv, J.; Wang, Q. Analyzing sustainability of chinese coal cities using a decision tree modeling approach. Resour. Policy 2019, 64, 1501. [Google Scholar] [CrossRef]
  11. Chapman, R.; Plummer, P.; Tonts, M. The resource boom and socio-economic well-being in australian resource towns: A temporal and spatial analysis. Urban Geogr. 2015, 36, 629–653. [Google Scholar] [CrossRef]
  12. Li, X.W.; Du, J.G.; Long, H.Y. A comparative study of chinese and foreign green development from the perspective of mapping knowledge domains. Sustainability 2018, 10, 30. [Google Scholar] [CrossRef] [Green Version]
  13. Hu, A.; Zhou, S.J. Green development: Functional definition, mechanism analysis and development strategy. China Popul. Resour. Environ. 2014, 24, 14–20. [Google Scholar]
  14. Wu, X.X.; Zhang, S.Y. The formation of the concept of green development and future trend. Econ. Probl. 2017, 2, 30–34. [Google Scholar]
  15. Tu, Z.H.; Wang, Q.H. Research for the evaluation and dynamic of china’s industrial green development—Based on the threshold regression for the data of prefecture-level cities. J. China Univ. Geosci. 2018, 18, 47–56. [Google Scholar]
  16. Wang, Y.Q.; Hu, N.L.; Su, Y.Q. Evaluation on green transformation capability of resource-based city. Technol. Econ. 2012, 31, 72–76. [Google Scholar]
  17. Fu, J.Y.; Geng, Y.Y. Public participation, regulatory compliance and green development in china based on provincial panel data. J. Clean Prod. 2019, 230, 1344–1353. [Google Scholar] [CrossRef]
  18. Azapagic, A. Developing a framework for sustainable development indicators for the mining and minerals industry. J. Clean Prod. 2004, 12, 639–662. [Google Scholar] [CrossRef]
  19. Li, L.; Xia, X.H.; Chen, B.; Sun, L.X. Public participation in achieving sustainable development goals in china: Evidence from the practice of air pollution control. J. Clean Prod. 2018, 201, 499–506. [Google Scholar] [CrossRef]
  20. Ciriacy-Wantrup, S.V. Capital returns from soil-conservation practices. J. Farm Econ. 1947, 29, 1181–1202. [Google Scholar] [CrossRef]
  21. Amiran, E.Y.; Hagen, D.A. Willingness to pay and willingness to accept: How much can they differ? Comment. Am. Econ. Rev. 2003, 93, 458–463. [Google Scholar] [CrossRef]
  22. Coursey, D.L.; Hovis, J.L.; Schulze, W.D.J.T.Q.J.o.E. The disparity between willingness to accept and willingness to pay measures of value. Q. J. Econ. 1987, 102, 679–690. [Google Scholar] [CrossRef]
  23. Li, X.B.; Tian, M.R.; Wang, H.; Wang, H.; Yu, J.J. Development of an ecological security evaluation method based on the ecological footprint and application to a typical steppe region in china. Ecol. Indic. 2014, 39, 153–159. [Google Scholar] [CrossRef]
  24. Hao, Y.F.; Meng, X.P.; Yu, X.P.; Lei, M.L.; Li, W.J.; Shi, F.T.; Yang, W.W.; Zhang, S.J.; Xie, S.D. Characteristics of trace elements in pm2.5 and pm10 of chifeng, northeast china: Insights into spatiotemporal variations and sources. Atmos. Res. 2018, 213, 550–561. [Google Scholar] [CrossRef]
  25. Hu, Z.G.; Wang, C.S.; Li, K.Q.; Zhu, X.Y. Distribution characteristics and pollution assessment of soil heavy metals over a typical nonferrous metal mine area in chifeng, inner mongolia, china. Environ. Earth Sci. 2018, 77, 10. [Google Scholar] [CrossRef]
  26. Zhang, Q.; Bai, Y.; Zhao, M. The temporal and spatial variation of the county economy in inner mongolia. J. Arid Land Resour. Environ. 2012, 26, 150–155. [Google Scholar]
  27. Dutka, A.F.; Hanson, H.H. Fundamentals of Data Normalization; Addison-Wesley: Boston, MA, USA, 1989; Volume 196. [Google Scholar]
  28. Moret, L.; Mesbah, M.; Chwalow, J.; Lellouch, J. Internal validation of a scale—Relationship between principal component analysis—Cronbach alpha and reliability. Rev. D Epidemiol. Et De Sante Publique 1993, 41, 179–186. [Google Scholar]
  29. Frew, E.J.; Whynes, D.K.; Wolstenholme, J.L. Eliciting willingness to pay: Comparing closed-ended with open-ended and payment scale formats. Med. Decis. Mak. 2003, 23, 150–159. [Google Scholar] [CrossRef]
  30. Schmidt, J.; Bijmolt, T.H.A. Accurately measuring willingness to pay for consumer goods: A meta-analysis of the hypothetical bias. J. Acad. Mark. Sci. 2020, 48, 499–518. [Google Scholar] [CrossRef] [Green Version]
  31. Bostedt, G.; Ericsson, G.; Kindberg, J. Contingent values as implicit contracts: Estimating minimum legal willingness to pay for conservation of large carnivores in sweden. Environ. Resour. Econ. 2008, 39, 189–198. [Google Scholar] [CrossRef]
  32. Tian, X.; Yu, X.; Holst, R. Applying the Payment Card Approach to Estimate the Wtp for Green Food in China; IAMO: Halle, Germany, 2011. [Google Scholar]
  33. Waterfield, G.; Kaplan, S.; Zilberman, D. Willingness to pay versus willingness to vote: Consumer and voter avoidance of genetically modified foods. Am. J. Agric. Econ. 2020, 102, 505–524. [Google Scholar] [CrossRef] [Green Version]
  34. Zidansek, A. Sustainable development and happiness in nations. Energy 2007, 32, 891–897. [Google Scholar] [CrossRef]
  35. Zhou, C.; Li, G.P. The influencing factors for willingness to pay of payment for watershed services: A case of the water receiving area of zhengzhou city of the middle route project of the south-north water transfer project. Econ. Geogr. 2015, 35, 38–46. [Google Scholar]
  36. Xu, D.W.; Chang, L.; Hou, T.S.; Zhao, Y.F. Measure of watershed ecological compensation standard based on wtp and wta: A case study in liaohe river basin. Resour. Sci. 2012, 34, 1354–1361. [Google Scholar]
  37. Oezdemir, S.; Johnson, F.R.; Hauber, A.B. Hypothetical bias, cheap talk, and stated willingness to pay for health care. J. Health Econ. 2009, 28, 894–901. [Google Scholar] [CrossRef] [PubMed]
  38. Dai, Q.W. Research on the eco-compensation standards and modes: Taking maoershan national nature reserve of guangxi province as an example. Acta Ecol. Sin. 2014, 34, 5114–5123. [Google Scholar]
  39. Hu, H.; Zhang, J.H.; Liu, Z.H.; Yu, P.; Chen, M. Tourist’s willingness to pay for tourism ecological compensation and the influeecing factors in national parks:Take a case of huangshan scenic area. Resour. Environ. Yangtze Basin 2017, 26, 2012–2022. [Google Scholar]
  40. Ajzen, I. The theory of planned behavior. Organ. Behav. Hum. Decis. Process. 1991, 50, 179–211. [Google Scholar] [CrossRef]
  41. Dietz, T.; Stern, P.C.; Guagnano, G.A. Social structural and social psychological bases of environmental concern. Environ. Behav. 1998, 30, 450–471. [Google Scholar] [CrossRef] [Green Version]
  42. Taira, D.A.; Safran, D.G.; Seto, T.B.; Rogers, W.H.; Tarlov, A.R. The relationship between patient income and physician discussion of health risk behaviors. Jama-J. Am. Med Assoc. 1997, 278, 1412–1417. [Google Scholar] [CrossRef]
  43. Laaksonen, M.; Prattala, R.; Helasoja, V.; Uutela, A.; Lahelma, E. Income and health behaviours. Evidence from monitoring surveys among finnish adults. J. Epidemiol. Community Health 2003, 57, 711–717. [Google Scholar] [CrossRef] [PubMed] [Green Version]
  44. Zhao, S.Q.; Sun, X.; Dong, Z.F.; Hou, D.L.; Liu, X. The benefited resident’s willingness to pay for improved water quality within the framework of ecological compensation and its influencing factors in downstream area of jiuzhou river. Ecol. Econ. 2020, 36, 154–159. [Google Scholar]
  45. Mzavanadze, N. Sustainable development in lithuania: Between the government agenda and the undiscovered civil society. J. Balt. Stud. 2009, 40, 397–414. [Google Scholar] [CrossRef]
Figure 1. Components of the questionnaire.
Sustainability 13 02833 g001
Figure 2. The number of questionnaires collected in various districts and counties in Chifeng City.
Sustainability 13 02833 g002
Figure 3. Respondents’ perceptions of regional ecological environment protection and green development: (a) Respondents’ attention to the ecological environment information, (b) the main channel for respondents to obtain ecological environment information, (c) respondents’ understanding of green development in the region, and (d) respondents’ support for green development in the region.
Sustainability 13 02833 g003
Figure 4. The public’s perception of the changes in the regional ecological environment in the past 5 years.
Sustainability 13 02833 g004
Figure 5. Respondents’ perceptions of effective ways to promote green development.
Sustainability 13 02833 g005
Figure 6. Respondents’ preference for the main direction of green development investment.
Sustainability 13 02833 g006
Figure 7. Respondents’ WTP for the green development of resource-based cities.
Sustainability 13 02833 g007
Figure 8. Educational level affects WTP for green development.
Sustainability 13 02833 g008
Figure 9. Annual income affects WTP for green development.
Sustainability 13 02833 g009
Table 1. Correspondence between reliability level and Cronbach’s alpha coefficient.
ReliabilityCronbach’s Alpha Coefficient
Untrustworthyα < 0.3
Barely credible0.3 ≤ α < 0.4
Credible0.4 ≤ α < 0.5
Believable (the most common)0.5 ≤ α < 0.7
Very believable (frequently seen)0.7 ≤ α < 0.9
Very credible0.9 ≤ α
Table 2. Variables assignment and descriptive statistics.
VariableAssignmentAverageStandard Deviation
Residents’ attitude towards green development (Y1)1 = Strongly disagree; 2 = Disagree; 3 = Neutral; 4 = Agree; 5 = Strongly agree4.190.78
Residents’ WTP (Y2)1 = 0 yuan; 2 = 0–50 yuan; 3 = 50–100 yuan; 4 = 100–200 yuan; 5 = Above 200 yuan2.621.20
Gender (X1)1 = Male; 2 = Female1.590.49
Age (X2)1 = 17–27; 2 = 28–38; 3 39–49; 4 = 50–60; 5 = Above 612.581.26
Household registration (X3)1 = City or town; 2 = Suburban; 3 = Rural1.290.67
Occupation (X4)1 = Government officer; 2 = Technical worker; 3 = Business staff; 4 = Private business owner; 5 = Farmer; 6 = Industrial worker; 7 = Waiter; 8 = Retired employees; 9 = Housewife; 10 = Student; 11 = Unemployed; 12 = Others5.283.68
Education level (X5)1 = Elementary school and below; 2 = Junior high and high school; 3 = Technical secondary school and college; 4 = Undergraduate; 5 = Master’s degree and above3.100.91
Annual income (X6)1 = Less than 50 thousand yuan; 2 = 50–100 thousand yuan; 3 = 100–150 thousand yuan; 4 = More than 150 thousand yuan1.590.76
Table 3. Characteristics of respondents.
VariableCategoryNumber of RespondentsPercentage
GenderMale105640.6
Female154559.4
Age17–2750019.3
28–3895036.6
39–4949919.2
50–6032812.6
Above 6131812.3
Household registrationCity or town215383.1
Suburban1566.0
Rural28210.9
OccupationGovernment officer40715.7
Technical worker51119.7
Business staff27210.5
Private business owner1445.5
Farmer1104.2
Industrial worker1064.1
Waiter2007.7
Retired employees27810.7
Housewife1044.0
Student1776.8
Unemployed421.6
Others2469.5
Education levelElementary school and below1003.8
Junior high and high school60523.3
Technical secondary school and college94636.4
Undergraduate86833.4
Master’s degree and above793.0
Annual incomeLess than 50 thousand yuan142054.7
50–100 thousand yuan92535.6
100–150 thousand yuan1726.6
More than 150 thousand yuan783.0
Table 4. The public’s WTP for regional green development.
ItemOptionsNumber of RespondentsProportion
The Proportion in the Overall InterviewsThe Proportion in the People Unwilling to Pay
Willing to payStrongly Disagree773.00%——
Disagree1455.65%——
Neutral73328.57%——
Agree111643.49%——
Strongly Agree49519.29%——
The Reason for not willing to pay (Multiple choice)Low Annual Income33113.90%67.41%
Not Interested361.51%7.33%
No Personal Benefit522.18%21.84%
Government funding2209.24%44.81%
“——” means that the data had no need for calculation. ”Government funding” means that the work should be funded by the government and not by individuals.
Table 5. Determinants of respondents’ WTP for green development.
VariableWTPp (WTP > 0)WTP|WTP > 0
Gender−8.23 ***0.1−12.75 ***
(2.66)(0.06)(2.86)
Age−0.86−0.04−0.21
(1.09)(0.03)(1.2)
Household registration−4.93 **−0.08 *−4.32 *
(2.12)(0.05)(2.39)
Occupation−0.18−0.010.12
(0.37)(0.01)(0.4)
Education level6.54 ***0.1 **5.71 ***
(1.74)(0.04)(1.87)
Annual income20.92 ***0.32 ***17.1 ***
(1.79)(0.05)(1.86)
*, **, and *** denote statistical significance at the 10%, 5%, and 1% levels.
Publisher’s Note: MDPI stays neutral with regard to jurisdictional claims in published maps and institutional affiliations.

