Article

ASEAN’s Energy Transition towards Cleaner Energy System: Energy Modelling Scenarios and Policy Implications

1
Economic Research Institute for ASEAN and East Asia (ERIA), Think Tank, Jakarta 10270, Indonesia
2
Faculty of Economics, Keio University, Tokyo 108-8345, Japan
3
Graduate School of Public Policy, Tokyo University, Tokyo 113-0033, Japan
*
Author to whom correspondence should be addressed.
Sustainability 2021, 13(5), 2819; https://doi.org/10.3390/su13052819
Submission received: 28 January 2021 / Revised: 21 February 2021 / Accepted: 1 March 2021 / Published: 5 March 2021
(This article belongs to the Collection Secure and Sustainable Energy System)

Abstract

:
The Association of Southeast Asian Nations (ASEAN) faces tremendous challenges regarding the future energy landscape and how the energy transition will embrace a new architecture—including sound policies and technologies to ensure energy access together with affordability, energy security, and energy sustainability. Given the high share of fossil fuels in ASEAN’s current energy mix (oil, coal, and natural gas comprise almost 80%), the clean use of fossil fuels through the deployment of clean technologies is indispensable for decarbonizing ASEAN’s emissions. The future energy landscape of ASEAN will rely on today’s actions, policies, and investments to change the fossil fuel-based energy system towards a cleaner energy system, but any decisions and energy policy measures to be rolled out during the energy transition need to be weighed against potentially higher energy costs, affordability issues, and energy security risks. This paper employs energy modelling scenarios to seek plausible policy options for ASEAN to achieve more emissions reductions as well as energy savings, and to assess the extent to which the composition of the energy mix will be changed under various energy policy scenarios. The results imply policy recommendations for accelerating the share of renewables, adopting clean technologies and the clean use of fossil fuels, and investing in climate-resilient energy quality infrastructure.

1. Introduction

The world has been struggling with the coronavirus disease (COVID-19) pandemic since March 2020, which has damaged the world economy—including the Association of Southeast Asian Nations (ASEAN). The global economy is being pushed into a recession by the COVID-19 pandemic due to preventive and containment measures such as country lockdowns, travel restrictions, and slow or even negative growth in many sectors such as tourism, retail, and industry. The magnitude of the economic impacts is hard to predict as it depends on the success of the pandemic containment efforts around the world. The International Monetary Fund (IMF) projected the world economy and the ASEAN 5 (Indonesia, Malaysia, the Philippines, Singapore, and Thailand) to contract sharply by −4.9% and −2.5% respectively in 2020, much worse than during the 2008–2009 financial crisis (IMF, 2020) [1]. Such an economic downturn is contracting energy demand and energy-related carbon dioxide (CO2) emissions around the globe, but this crisis is seen as temporary and both energy demand and CO2 emissions will bounce back once the economy starts to recover. Global energy demand increased 10 times from 1999 to 2019, and keeps increasing (IEA, 2017) [2]. The gravity of energy demand has shifted to Asia, and emerging economies account for half of global growth in gas demand. Many of the Organisation for Economic Co-operation and Development (OECD) countries will see energy demand peak, while some countries will experience negative growth due to energy efficiency and other factors such as population growth and industrial structures. However, ASEAN will be the opposite, as it will need more energy to steer its economic growth [3].
To reconfirm the present situation of ASEAN’s high reliance on fossil fuel, this study also estimates the energy demand and supply in ASEAN. It found that ASEAN will see strong growth in fossil fuel demand to steer economic growth from 2017 (The energy modelling uses 2017 for the baseline information as it is the most up-to-date baseline data in the ASEAN Member States (AMS)) to 2050 in which fossil fuels (oil, coal, and gas) had the dominant share in the primary energy mix in 2017, at 78.0%, while their combined share is projected to increase to 81.7% in 2050 (Table A1, Table A2, Table A3, Table A4, Table A5, Table A6, Table A7 and Table A8). Oil will be the largest energy source in the primary energy mix in 2050, at 39.6%, down from 36.9% in 2017. Coal was the second largest energy source after oil in 2017, at 21.6%, and is projected to have a 22.4% share in 2050. Natural gas is projected to have the second largest share of the primary energy mix in 2050, at 24.7%, overtaking coal. Thus, this is a real concern as to whether ASEAN’s energy transition will be achieved or not within the context of Climate Change timeframe in which the net zero emission should start from the mid of this century?
Elsewhere, especially the OECD, moves away from fossil fuel dependence to a system based on cleaner energy through a higher share of renewables, but ASEAN will continue to rely on the fossil fuel, and it tries to find ways on how to use fossil fuels more cleanly in an energy transition. For instance, coal use has been drastically reduced in the OECD and more developed countries due to the role of gas, renewables, and advanced technologies. However, as the most abundant and reliable energy resource in ASEAN, coal use will continue to be the second largest energy source in power generation after gas in the foreseeable future, to meet fast-growing electricity demand [4]. The increase in coal use for power generation in ASEAN countries will lead to the widespread construction of coal-fired power plants, which will result in increased greenhouse gas (GHG) and CO2 emissions if the best available clean coal technology (CCT) is not employed (Phoumin, 2015) [5].
Meanwhile, the climate narrative which has prevailed since the Conference of the Parties (COP) 21 in 2015 and is likely to continue at the upcoming COP 26, promotes the banning of public coal financing throughout the world, through financial instruments and influence over multilateral development banks and OECD member countries. Based on the Greenhouse Gas Emissions Data (United States Environmental Protection Agency, 2020) [6], emissions from fossil fuel combustion and industrial processes contributed about 78% of the increase in GHG emissions from 1970 to 2011. China, the United States (US), Europe, and India are the largest emitters, contributing 30%, 15%, 9%, and 6% of global GHG emissions, respectively [6]. With substantial new generation capacity required to generate power, unabated coal-fired power generation plants are increasingly being constructed in developing Asia. Therefore, these trends reflect the urgent need to address the environmental sustainability of powering emerging Asia’s economic development.
The Economic Research Institute for ASEAN and East Asia (ERIA) held a round discussion on “ASEAN’s Future Energy Landscape” on 10 September 2020 [7], whose leaders in ASEAN expressed that managing the energy transition in ASEAN will need to consider the presence of fossil fuels (coal, oil, and natural gas) in the short- and medium-term energy system. At that round table discussion [7], ASEAN’s leaders and experts expressed that it will be crucial to explore ways in which to use fossil fuels in an environmentally sustainable manner to act as a bridge to a carbon-free energy future, rather than simply ruling out them completely. For successful implementation of the energy transition and climate change policy objectives, policymakers also indicated the need to balance the other equally important policy objectives of energy security, energy access, and affordability.
For climate friendly, ASEAN’s position to shift towards a cleaner energy system will have fundamental impacts on environmental sustainability and emission reduction. The evidence has been shown elsewhere in New York’s power generation mix in which the drastic reduction of emissions came from the shift of fossil fuel dependence to increasing share of onshore and offshore wind power (Isik, M.; Kaplan, P.O., 2021) [8]. Here at ASEAN, the pace at which ASEAN Member States (AMS) have adopted national power development plans and policies has created a drastic change in the energy system, as more renewables have penetrated the electrical grid. For instance, the recent development of accelerating pace of share of solar in power mix in Cambodia and Vietnam is achievably remarkable surprises for ASEAN [9]. However, one of the greatest challenges in all countries in ASEAN of increasing the share of variable renewable energy (e.g., wind and solar) in the power mix is the high cost of upgrading and integrating the systems that need more investment in grids, the internet of things, technological know-how, and quality energy infrastructure [10]. In a recent virtual conference on Asia—Carbon Capture, Utilization, and Storage (CCUS)—organised by ERIA on 18 February 2021 [11], experts in Asia generally expressed that ASEAN would need to create an energy bridging from the current fossil based energy system to a cleaner energy system that will need to consider the role of cleaner use of fossil fuels through innovative technologies such as clean coal technologies and CCUS, the technology that can remove carbon dioxide from flue gas and atmosphere, followed by recycling carbon dioxide for utilization and further determining safe and permanent storage options. In this way, the CCUS can reduce CO2 and GHG emissions. Therefore, urgent steps need to be taken to decarbonise the energy sector through pathways to a low-carbon economy which require the rapid deployment of the clean use of fossil fuel technologies, renewable energy development, and a doubling of energy efficiency, given that the energy sector accounts for two-thirds of global GHG emissions.
As ASEAN as well as developing countries around the world are embarking on energy transition, it is very crucial to ensure everyone is not left behind or become victims of the energy transition as they may be denied access to energy. In this regard, McCauley, D., and Heffron, R. (2018) [12], called on researchers to explore the multiple implications of the transition to a post-carbon society through the application of their proposed new triumvirate of tenets (distributional, procedural, and restorative), as this just transition framework enables researchers to more explicitly reflect upon the intersectionality of environment, climate, and energy, assess justice issues from a truly interdisciplinary perspective and ultimately contribute to meaningful long-term solutions. Details of Energy Justice Metric has been developed to facilitate the decision-makings to formulate energy policy with respect to the difficulties faced in balancing between the competing aims of economics, politics and the environment which form the trilemma of energy policy (Heffron, R, et.al., 2015) [13].
Thus, the paramount of climate change awareness and policy towards energy security and affordability will need to be flexible in the context of ASEAN, considering the role of fossil fuels in an energy transition. In the minds of ASEAN’s leaders as expressed through various conferences as mentioned above, meeting the growing energy demand would need appropriate energy policies and cooperation that can help facilitating energy-related infrastructure investments. These common energy challenges need to be addressed through concerted efforts—including collective measures and actions—to rapidly deploy energy efficiency and energy savings, highly efficient and low-emissions coal-fired power plant technology, and nuclear safety; and to double the share of renewable energy in the overall energy mix for inclusive and sustainable development.
This study aims to analyses the potential impacts of proposed additional energy-saving goals, action plans, and policies in ASEAN on energy consumption, by fuel, sector, and greenhouse gas (GHG) emissions as to whether under various policy commitment and targets will ASEAN be able to achieve climate neutrality by 2050? In addition, the study results will support ASEAN’s energy policy directions to achieve the followings:
  • Improve the efficiency and environmental performance of fossil fuel use.
  • Reduce dependence on conventional fuels through intensified EEC programs; increased share of hydropower; and expansion of renewable energy systems, biofuel production and/or utilization, and, for interested parties, civilian nuclear power.
  • Mitigate GHG emissions through effective policies and measures to help abate global climate change.
Therefore, this study will explore the best energy mix under various Alternative Policy Scenarios (APSs) and the associated emissions. Under the APSs, key considerations are realistic assumptions in terms of technologies, resource endowment, energy efficiency, and system integration challenges, when the power generation mix has a higher share of intermittent renewables such as wind and solar energy. The study employs the energy outlook by each country and ASEAN under the ERIA’s Energy Outlook and Energy Potentials in ASEAN and East Asia. However, for the purpose of ASEAN’s scope of study, only aggregated ASEAN’ data is shown. The paper is organized as follows. Section 2 reviews the literature, Section 3 discusses the research methodology, Section 4 describes the results and discussion, and Section 5 is the conclusion and policy implications.

2. Literature Review

2.1. Global Commitment to Emissions Reduction (COP 21)

The Paris Agreement, negotiated at the Paris Climate Conference (COP 21), is the first universal legally binding global climate change agreement, adopted by the majority of leaders on 22 April 2016. It aims to limit the average temperature rise to well below 2 °C above pre-industrial levels (baseline: 1850–1900) and to pursue efforts to limit the temperature increase to 1.5 °C above pre-industrial levels, recognizing that this would significantly reduce the risks and impacts of climate change (EU, 2020) [14].
Bridging the gap from current policies and actions to climate neutrality by the end of this century is very challenging. The world will need to reduce emissions by 7.6% per year from 2020 to 2030 to limit global warming to 1.5 °C. If we do nothing, temperatures are expected to rise 3.2 °C above pre-industrial levels by the end of century—posing a serious threat to our living environment (UNEP, 2019) [15]. If emissions cuts are delayed, it will become very difficult to meet the limit of a global temperature rise of well below 1.5 °C by 2100. UNEP (2019) [15], stated that delaying emissions cuts until 2025 would steepen the need to cut emissions to 15.5% per year, which would be extremely difficult to achieve, especially for the developing world. As parties to the Paris Agreement, countries have submitted comprehensive national climate action plans known as Nationally Determined Contributions (NDCs). Some countries have not yet finalized their NDCs, but have carried out preparatory work known as Intended Nationally Determined Contributions (INDCs).
About 78% of all global emissions come from G20 nations, requiring their strong commitment to long-term zero emissions targets by 2100. Amongst the G20 nations, China, the US, the European Union (EU) 28, (The EU 28 refers to the 28 countries which were members of the EU until 31 January 2020 when the United Kingdom left the group (Austria, Belgium, Bulgaria, Croatia, Cyprus, Czech Republic, Denmark, Estonia, Finland, France, Germany, Greece, Hungary, Ireland, Italy, Latvia, Lithuania, Luxembourg, Malta, Netherlands, Poland, Portugal, Romania, Slovenia, Slovakia, Spain, Sweden, and United Kingdom).) and India contributed more than 55% of the total emissions over the last decade (UNEP, 2019) [15]. Thus, the speed of emissions reduction is very concerning, and full decarbonization of the energy sector may go beyond renewables and energy efficiency. The carbon sinks will rely on the clean use of fossil fuels with carbon capture, utilization, and storage (CCUS). Developing countries may face difficulties in achieving emissions reduction targets without international support, such as technologies for the clean use of fossil fuels and the other climate abatement initiatives. However, their emissions contribution remains small compared with that of the G20 nations. Developing nations can contribute more in terms of the conservation of natural resources such as forestry and the management of improved agricultural practices.
The fifth session of the UN Environment Assembly (UNEA-5), provides leadership, catalyzes, intergovernmental actions on the environment, and contributes to the implementation of the UN 2030 Agenda for Sustainable Development and its Sustainable Development Goals (SDGs) (UNEP, 2021) [16]. UNEA-5 will also provide an opportunity for Member States and Stakeholders to take ambitious steps towards building back better and greener by ensuring that investments in economic recovery after the COVID-19 pandemic contribute to sustainable development.
Amongst other policy measures to reduce the GHE, energy efficiency is very crucial as it is also known as the hidden fuel—fuel that can be translated to be an energy resource to a nation as it will become energy available for economic activities and supply to the greater population. Energy efficiency can offer relatively cheaper and quicker solutions to help ASEAN embark on the road to economic recovery through the provision of available and sustainable energy for economic activities and reduce emissions ASHRAE (2020) [17]. Energy efficiency can be applied to all sectors including power generation, commercial and residential building, and transportation. In this regard, guidance offered by the ISO standards (ISO 50001 for energy management, ISO for 14065 for greenhouse gas validation, and verification or ISO 14001 for environmental management and others) will help countries in the process of implementing changes within the ASEAN energy system transition.

2.2. ASEAN and EU Energy Policy Directions

The ASEAN Plan of Action for Energy Cooperation (APAEC) is the high-level energy cooperation framework within ASEAN where leaders in ASEAN adopted the first APAEC at the 17th ASEAN Ministers on Energy Meeting (AMEM) held on 3 July 1999 in Bangkok, Thailand, in which ASEAN’s leaders had agreed to implement a framework for cooperation in energy to enable ASEAN countries to obtain security of supply, whereby ASEAN Member States (AMS) work towards lessening dependence on imported oil and towards accelerating the development of indigenous energy sources and energy conservation (ACE, 2015) [18]. APAEC is implemented in two phases: Phase I covers the period 2016–2020 and consists of short to medium-term measures to enhance energy security cooperation and to take further steps towards connectivity and integration. Phase II covers the period 2021–2025 which is developed based on the progress of Phase I implementation.
Phase 2 of the ASEAN Plan of Action for Energy Cooperation (APAEC), which is under preparation for endorsement by the ASEAN Ministers on Energy Meeting in 2020, will set key energy policy targets and will have energy policy implications for energy infrastructure related investment in the region (ASEAN Centre for Energy, 2020) [19]. Key targets include the revision of the new energy efficiency and conservation target from a 30% reduction in energy intensity by 2025 (based on 2005 levels) to more ambitious levels—a new target of 35–40% reduction is likely—and will involve the expansion of energy efficiency and conservation measures to transport and industries. It will also establish a new sub-target for the share of renewables in installed power capacity, which will complement the existing target of a 23% share of renewables in the total primary energy supply (TPES) by 2025. APAEC Phase 2 will also include policy measures to pursue smart grids and renewable energy grid integration; and measures to address emerging and alternative technologies such as hydrogen, energy storage, bioenergy, nuclear energy, and CCUS. APAEC Phase 2 will maintain the focus on energy connectivity and market integration, but will add a sub-theme on the energy transition and energy resilience on how the region will need to have a strategy to deal with fossil fuels and new technologies.
The ASEAN region has wide economic development gaps in terms of gross domestic product (GDP), population growth, energy use, and technologies. However, each country is committed to addressing the common climate change issue. Countries share their commitments through various policies such as energy intensity targets or through targets for the share of renewables in the energy mix. Nevertheless, emerging countries face energy access and affordability issues, while promoting renewables and other clean energy technologies remains expensive. Although solar and wind module costs have dropped drastically, the system cost remains expensive when applied in developing countries. Making these clean and green technologies available to developing countries in ASEAN will require policy attention, including regulations and financing mechanisms, with support from developed countries.
The EU aims to be climate neutral by 2050 (EU, 2020) [14]. Amongst other targets, the 2030 climate and energy framework includes EU-wide targets and policy objectives for 2021–2030. The key targets for 2030 include (i) at least 40.0% cuts in GHG emissions from 1990 levels, (ii) at least a 32.0% share for renewable energy, and (iii) at least a 32.5% improvement in energy efficiency. For GHG emissions, a cut of at least 40.0% below 1990 levels is targeted by 2030. This will enable the EU to move towards a climate-neutral economy and implement its commitments under the Paris Agreement. For renewables, the binding renewable energy target for the EU for 2030 is at least 32.0% of final energy consumption, including a review clause by 2023 for an upward revision of the target. For energy efficiency, a headline target of at least 32.5% is to be achieved collectively by the EU in 2030, with an upward revision clause by 2023. To help achieve these targets, a transparent and dynamic governance process will help deliver on the 2030 climate and energy targets in an efficient and coherent manner. The EU has adopted integrated monitoring and reporting rules to ensure progress towards its 2030 climate and energy targets and its international commitments under the Paris Agreement.

2.3. INDCs’ Commitments and Targets submitted by ASEAN Member States to the United Nations Framework Convention on Climate Change (UNFCCC)

COP 21 was a very successful conference, at which leaders around the globe showed their solidarity in fighting global climate change. Countries laid out targets or programs aimed at reducing CO2 emissions. Some countries have clear policies and targets, while others have no targets—especially developing countries. In the AMS, the key commitments are varied, reflecting each country’s socio-economic and environmental situation. The following paragraphs summarize the key commitments of AMS for mitigating climate change (Kimura and Phoumin, 2018) [20].
Cambodia proposes a GHG mitigation contribution for 2020–2030 (UNFCCC, 2015) [21], conditional on the availability of support from the international community. Cambodia is expected to contribute a maximum reduction of 3100 gigagrams of carbon dioxide equivalent (GgCO2eq) by 2030 compared with 2010 baseline emissions of 11,600 GgCO2eq. The Lao People’s Democratic Republic (Lao PDR) is a highly climate-vulnerable country whose GHG emissions were only 51,000 GgCO2eq in 2000—negligible compared with total global emissions. The Lao PDR has ambitious plans to reduce its GHG emissions through increased carbon stock by expanding forest cover to 70% of the country’s land area by 2020. The Lao PDR electricity grid draws on renewable resources for almost 100% of output, and the government has laid the foundations for implementing a renewable energy strategy that aims to increase the share of small-scale renewable energy to 30% of total energy consumption by 2030.
Viet Nam’s intended unconditional contribution (Developing countries announced two sets of mitigation targets to be reached under the Paris Agreement. The low target or unconditional target can be reached without outside support. However, the conditional target can be reached only with outside support.) to GHG emissions reduction efforts during 2021–2030 is to reduce its GHG emissions by 8% in 2030 compared with the BAU scenario, in which the emissions intensity per unit of GDP will decline by 20% from 2010 levels and forest coverage will increase by 45%. Under its conditional contribution, Viet Nam intends to cut emissions by 25% from 2010 levels if international support is received through bilateral and multilateral cooperation (UNFCCC, 2015) [21]. Further, the emissions intensity target per unit of GDP will be reduced by 30% from 2010 levels. Thailand expects its GHG emissions to reach 555 million tones of carbon equivalent (MtCO2e) by 2030 in the BAU case, with 76.8% mainly from the energy and transport sectors. According to Thailand’s INDC, the country intends to reduce GHG emissions by 20% of the BAU emissions in 2030. This means that Thailand’s amount of GHG emissions reduction should be 111 MtCO2e in 2020.
From 2016 to 2030, Myanmar aims to increase the share of renewables in rural electrification to 30%, increase hydropower capacity to 9.4 gigawatts, and distribute about 260,000 energy-efficient cooking stoves to rural areas (UNFCCC, 2015) [21]. For energy efficiency, Myanmar aims to achieve 20% electricity-saving potential of the forecast electricity consumption by 2030. Under the INDC framework, Brunei Darussalam targets reducing its energy consumption by 63% by 2035 against the BAU scenario. Furthermore, the country aims to achieve a 10% share of renewable energy in power generation by 2035. With regards to the transport sector, the target is to reduce CO2 emissions by 40% from morning peak-hour vehicle use by 2035 compared with the BAU scenario. Another target in its INDC is to enhance the stocks of carbon sinks by increasing the current 41–55% of the country’s total forest area in 2016.
Indonesia’s INDC specifies conditional and unconditional mitigation targets. It intends to reduce 29% of its emissions against the BAU scenario by 2030 in the unconditional scenario. If there is additional international support, Indonesia intends to reduce an additional 12% of the emissions. The intended contributions cover five sectors: Energy (including transport); industrial processes and product use; agriculture; land use, land use change, and forestry; and waste. The amount of emissions under the 29% and 41% reduction targets would be 0.848 GtCO2eq and 1.119 GtCO2eq, respectively. Malaysia intends to reduce its GHG emissions intensity of GDP by 45% by 2030 relative to the emissions intensity of GDP in 2005 (UNFCCC, 2015) [21]. This consists of 35% on an unconditional basis and a further 10% conditional upon receipt of climate finance, technology transfer, and capacity building from developed countries.
The Philippines targets a GHG emissions reduction of 70% by 2030 relative to its BAU scenario of 2000–2030. The mitigation contribution is conditioned on the extent of financial resources—including technology development and transfer—and capacity building that will be made available to the Philippines (Kimura and Phoumin, 2018) [20]. Singapore pledged in 2009 to reduce carbon emissions unconditionally from 7–11% lower than its BAU level by 2020. It committed to a further 16% reduction by 2020 after the COP 21 in Paris on 12 December 2015.

3. Methodology and Scenario Assumptions

This study aims to address the research questions on what are the projected impacts on greenhouse gas emissions of different potential energy mixes for ASEAN countries, and which energy mix should the region pursue? Thus, this study employs energy models of ASEAN countries using the Long-range Energy Alternatives Planning (LEAP) system software, an accounting system used to develop projections of energy balance tables based on final energy consumption and energy input/output in the transformation sector. LEAP is an energy modelling software that can conduct a variety of analyses of energy systems including Demand Analysis, Transformation Analysis, Resource Analysis, and Environmental Analysis. The data structures in a LEAP are organized using a hierarchical tree. The types of data entered at each branch depend on the type of branch, its position in the tree (for example whether it is a Demand or Transformation branch). At the heart of LEAP is the concept of scenario analysis. Scenarios are self-consistent story-lines of how a future energy system might evolve over time in a particular demographic and socio-economic setting and under a particular set of policy conditions. Using LEAP, scenarios can be built and then compared to assess their energy requirements, social costs and benefits and environmental impacts. All scenarios start from a common base year. We can use scenarios to ask an unlimited number of “what if” questions, such as: What if more efficient appliances are introduced, what if different electric generation capacity expansion plans are pursued, what if indigenous reserves of oil and gas are discovered, what if renewable energy technologies are introduced, etc.
In LEAP, the energy consumption is calculated as the product of an activity level and an annual energy intensity (energy use per unit of activity). Overall activities are defined as the products of the individual activities entered along a complete branch of the Demand tree. Total energy consumption is thus calculated by the equation:
E n e r g y   C o n s u m p t i o n = ( A c t i v i t y   l e v e l )   × ( E n e r g y   i n t e n s i t y ) .
In general, Equation (1) can apply only when energy intensity data is available. However, in most case, energy intensity by activity is not available. Thus, regressions are used to predict the future energy consumption by activity and sector.
In this study, data availability varies in the 10 ASEAN Member States (AMS). It is very challenging to collect long-term historical data in countries such as Cambodia, the Lao PDR, and Myanmar. Further, there are many missing data points in the historical data that need to be estimated. The LEAP application is very useful in dealing with such minimal data, and it allows expert judgement on how the future growth of demand in each fuel should be estimated. If good historical data are available, linear forecasting is used to forecast future values based on a time series of historical data. The new values are predicted using linear regression, assuming a linear trend (y = mx + c) where the Y term corresponds to the variable to be forecast and the X term is years. Multiple regressions are used to predict the future growth of energy demand by sector, such as transport, industry, and the commercial and residential sectors. Whenever the energy intensity data is not available, energy demand equations are applied and could be summarized in the equations below:
i = 1 10 T F E C i j k t = T F E C 1 j k t + T F E C 1 j k t + + T F E C 10 j k t
where index (i) represents the country in ASEAN; index (j) is the energy consumption by sector; index (k) is the energy type; and index (t) is time. Thus, the Total Final Energy Consumption in ASEAN is the aggregated summation of all energy consumption in 10 countries of ASEAN. The TFEC of each country is derived from regression estimates of energy consumption by sector (j) and by energy type (k) at time (t) as follows:
T F E C i j k t = 0 + β 1 X i j k t + β 2 T F E C i j k ( t 1 ) + ε i j k t
where:
T F E C i j k t is the Total Final Energy Consumption of country (i), by sector (j), by energy type (k), at time (t). T F E C i j k ( t 1 ) is the lag variable. The variables β 1 X i j t are the independent variables including per capita gross domestic product, energy relative price, population growth, car ownership, and floor area. The summation of all energy demand by sector forms the Total Final Energy Consumption (TFEC). From here, the LEAP will further generate the Total Primary Energy Supply (TPES) by certain assumption of the losses in the transformation sector. Due to many equations run by each country in ASEAN, this study omits the results of the equation, and it shows only the results of the demand generated by LEAP.
In this modelling work using the LEAP application, the baseline for the 10 AMS was 2017—the latest available baseline data. For future energy demand, the projected demand growth is based on government policies, population and economic growth, and other key variable such as energy prices, using the International Energy Agency (IEA) world energy model (IEA, 2019) [22]. The BAU case is future predicted energy demand based on the government’s current energy policies. However, the APSs are somewhat different to the BAU case in terms of policy changes and targets, as they have a greater share of renewables, including possible nuclear uptake if the government’s alternative policies include nuclear as an energy option and more efficient power generation and energy efficiency in the final energy consumption.
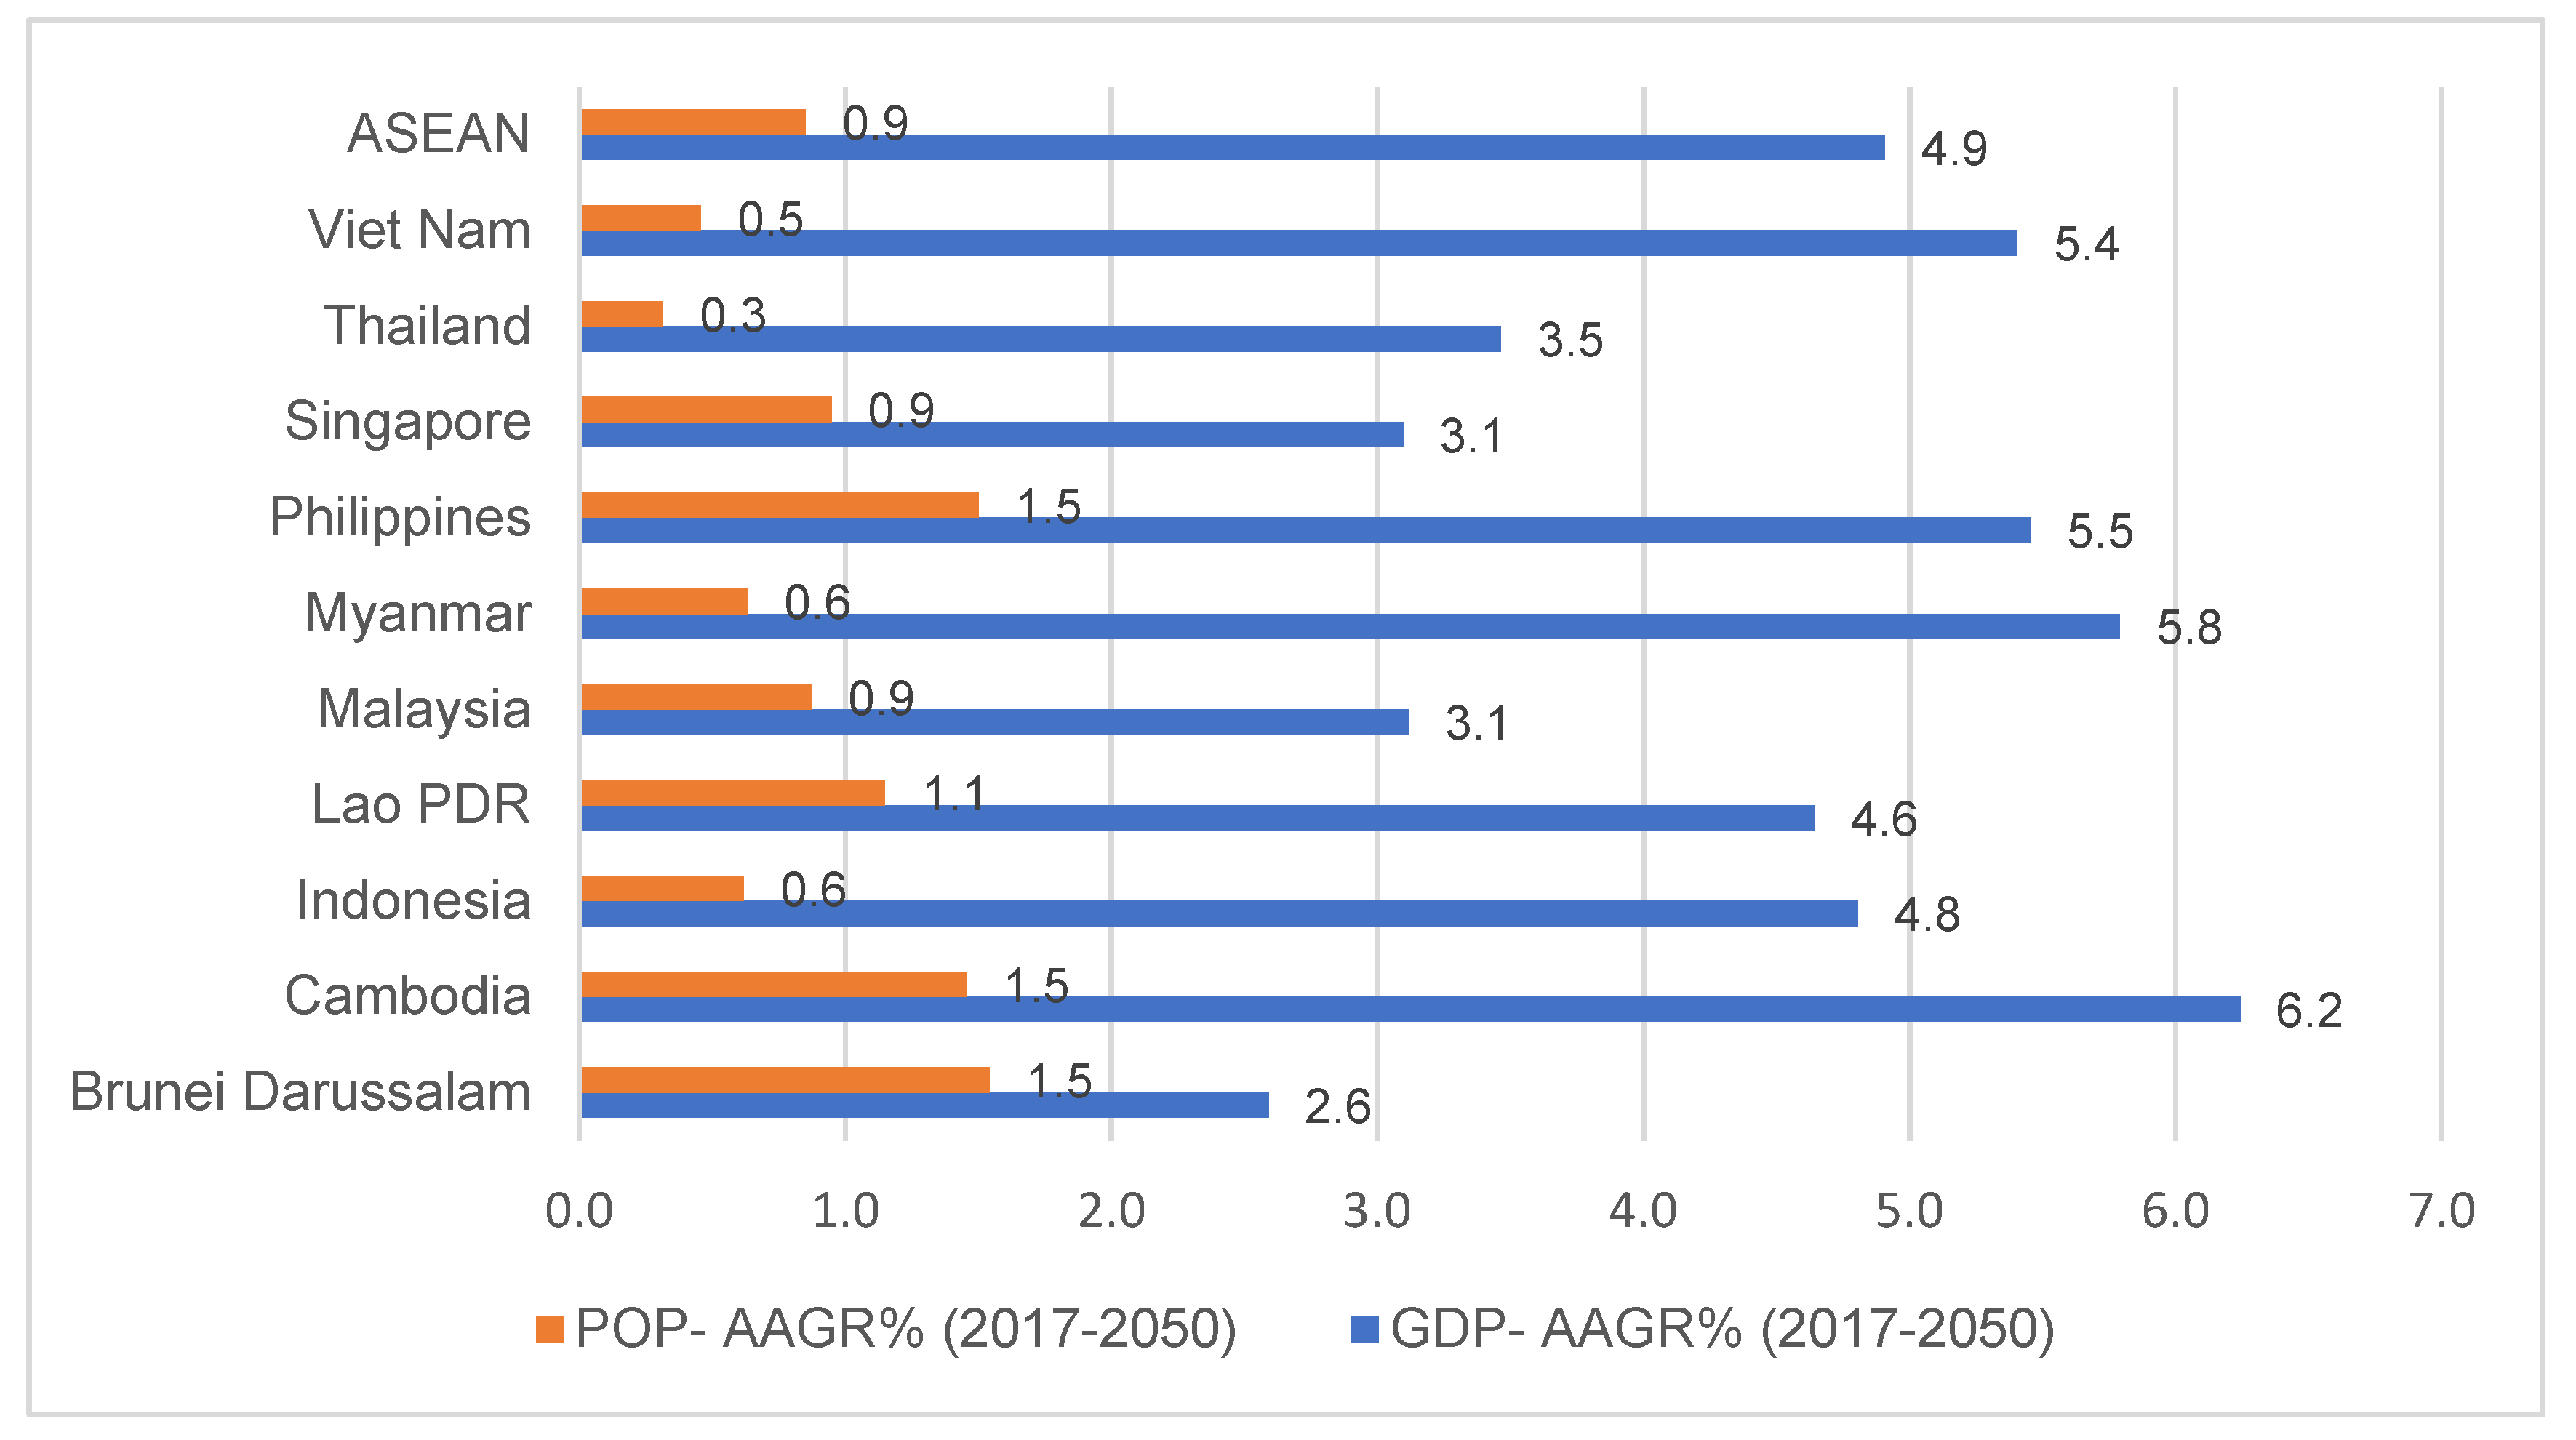
Key variables and assumptions used in the model include the average annual growth rate of the population and the GDP, and energy efficiency and renewable targets (Figure 1 and Table 1).
This study generates and compares four possible energy mixes and their effects on greenhouse gas emissions over time. We break these pathways into four types, each with their own assumptions, including the APS, APS_RE, APS_EI, and APS_EmT. The APS refers to Alternative Policy Scenario and assumes that states will increase more efficient final energy consumption, more efficient power generation, a higher share of renewables, and the introduction of nuclear power plants, based on each AMS government policy. The assumptions used in the APS are described in the table below. The APS_RE is the APS with a higher share of renewable targets at the ASEAN level. In the APS_RE, the targets are increases of 23%, 30%, and 50% in the share of renewables in the primary energy supply by 2025, 2030, and 2050, respectively, from 2005 levels. The increase in the renewable share is expected from solar, wind, geothermal, and hydro. As hydro and geothermal energy are limited by resources, the maximum share is set based on the resource endowment. The APS_EI is the APS using energy intensity reduction targets of 30%, 40%, and 50% from 2005 levels by 2025, 2030, and 2050, respectively. A greater reduction in energy intensity means that the energy consumption per unit of GDP becomes more efficient as a result of the application of energy efficiency, technological development, or any economic structural transformation of the economies shifting from energy-intensive sectors such as industry to less energy-intensive sectors such as services. The APS_EmT is the APS using emission reduction targets of 40% and 80% from the BAU scenario by 2030 and 2050, respectively. This is the top-down policy target in which the energy mix composition needs to be changed towards cleaner energy to meet such targets. This will have many policy implications if the AMS wish to reduce emissions by as much as half from the BAU scenario by 2050.

4. Results and Analyses

The results of various energy supply and demand scenarios in ASEAN are in Table A1, Table A2, Table A3, Table A4, Table A5, Table A6, Table A7 and Table A8. ASEAN’s energy system is predicted to be more efficient because energy intensity is expected to drop from the baseline in the future scenarios. However, the energy system will largely depend on fossil fuel consumption. The results from the energy model predicted that all ASEAN’s emissions in the future scenarios will remain high because fossil fuel remains the dominant share in the future energy mix. Fossil fuel consumption—coal, oil, or natural gas—is associated with emissions, although natural gas has less emissions than coal and oil. It is also important to note that the trend of natural gas use in the energy transition is very promising, as its share has grown quickly in the primary energy mix as well as in power generation. Thus, ASEAN’s energy transition will need to consider cleaner use of fossil fuels through clean technologies and a gradually increasing share of renewables and clean energy. Any policy changes to meet the emissions reduction in ASEAN need to be cautioned about high energy costs, energy access, affordability, and energy security risks. Below are the key results from the study.
More efficient use of energy. ASEAN’s primary energy supply grows at an annual average rate of 3.1% from 2017 to 2050 under the BAU scenario, reaching 1823 million tones of oil equivalent (Mtoe) in 2050 from 639 Mtoe in 2017 (Figure 2). However, under the APS of ambitious emissions reduction targets (APS_EmT), the primary energy supply is predicted to reduce by 21% and 44% from the BAU in 2030 and 2050, respectively (Table A1 and Table A2). ASEAN as a group achieves a significant reduction in energy intensity of 30.3% in the BAU case (a drop of energy intensity from 228 in 2017 to 154 in 2050). However, the scenario of emissions reduction targets (APS_EmT) could achieve a reduction of 60% in energy intensity in 2050 from the BAU scenario (a drop of energy intensity from 228 in 2017 to 86 in 2050) (Figure 3).
Reliance on fossil fuel consumption. The results from the energy demand and supply modelling under various policy scenarios draw attention to the high reliance on fossil fuel use in ASEAN’s energy system. The total combined share of fossil fuels (oil, gas, and coal) in the primary energy supply was 78% in 2017; and they are predicted to have an 87%, 82%, and 80% share in 2050 under the BAU, APS, and APS with emission reduction targets (APS_EmT) scenarios, respectively (Figure 4 and Figure 5).
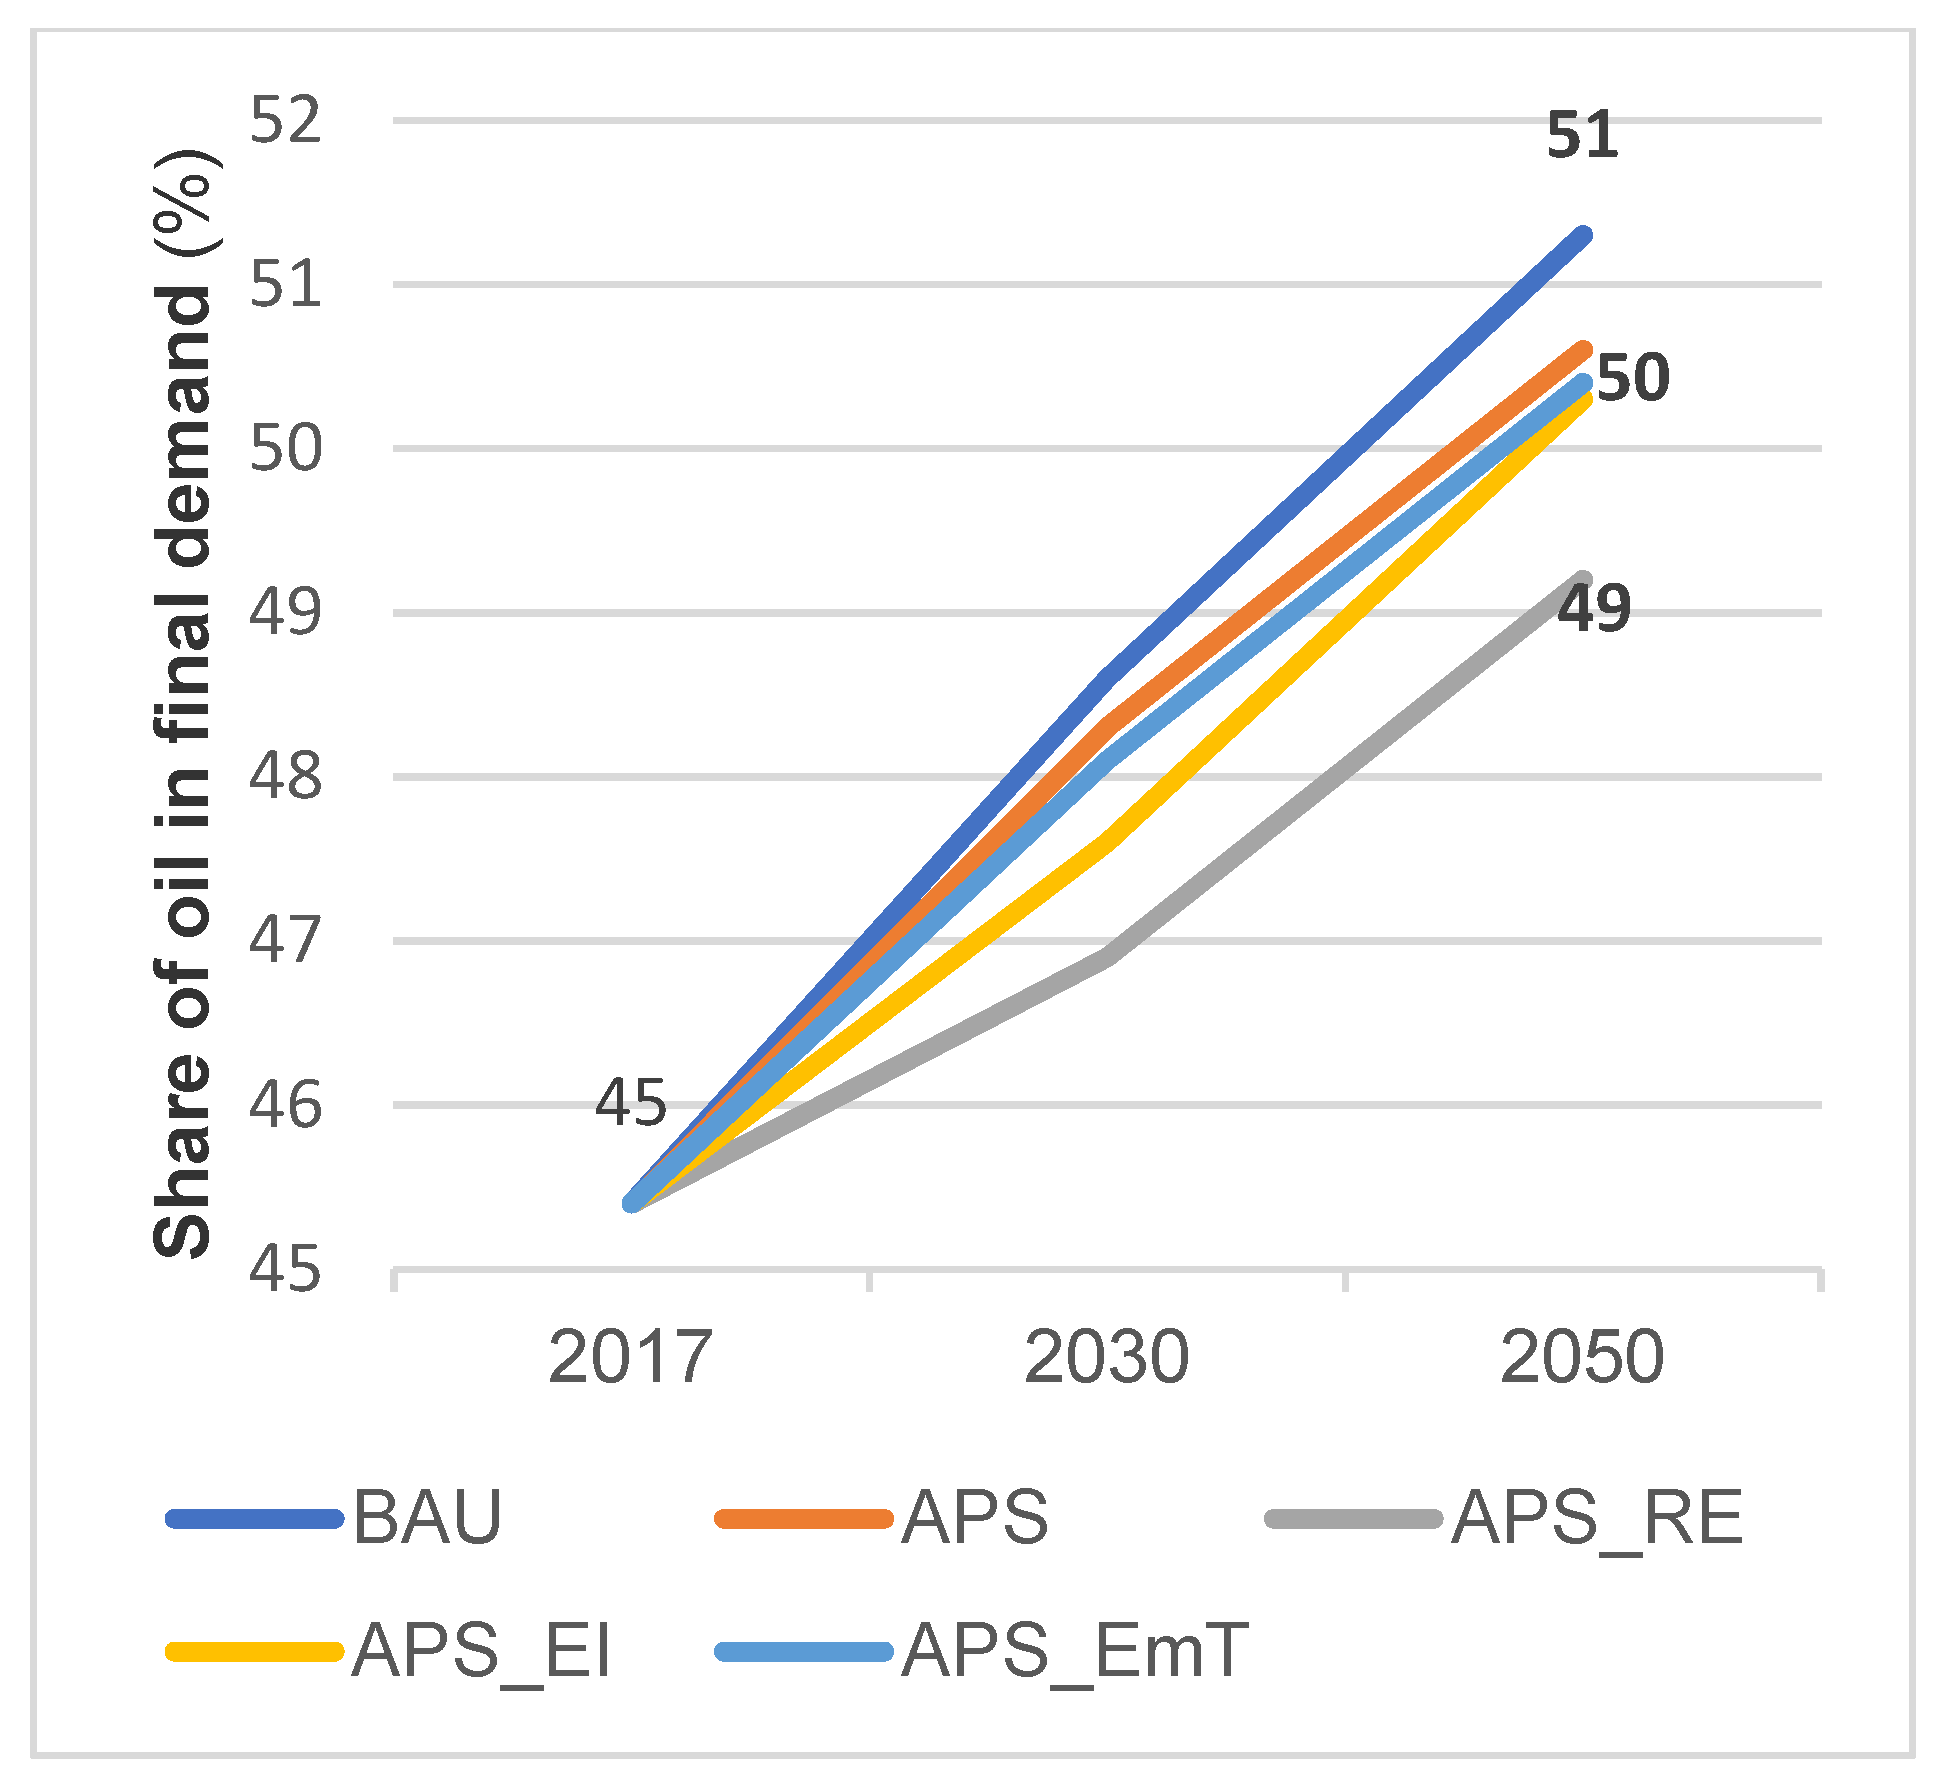
Oil remains the dominant fuel in the primary energy supply, with a share of 37% in 2017. The share of oil is projected to be 42%, 41%, and 38% in the BAU scenario, APS, and APS_EmT in 2050, respectively (Figure 6 and Figure 7). Oil is mainly used in the transport and industrial sectors in the final energy demand. The share of oil in the final energy demand was 45% in 2017, and its share grows to 51%, 50%, and 49% in 2050 for the BAU scenario, APS, and APS_EmT, respectively. This indicates that ASEAN as a group will rely heavily on oil consumption for the foreseeable future. For most countries in ASEAN, the growing oil import dependency will need to be safeguarded by resilient infrastructure and mechanisms such as oil stockpiling (either government stock or inventory stock by the oil importing companies). Most countries in ASEAN have a stock requirement of 15–50 days, varying from country to country. However, the stock requirement for OECD members will need to be at least 90 days of net oil imports to meet the emergency oil stock holding requirement in case of supply disruption (IEA, 2020) [24].
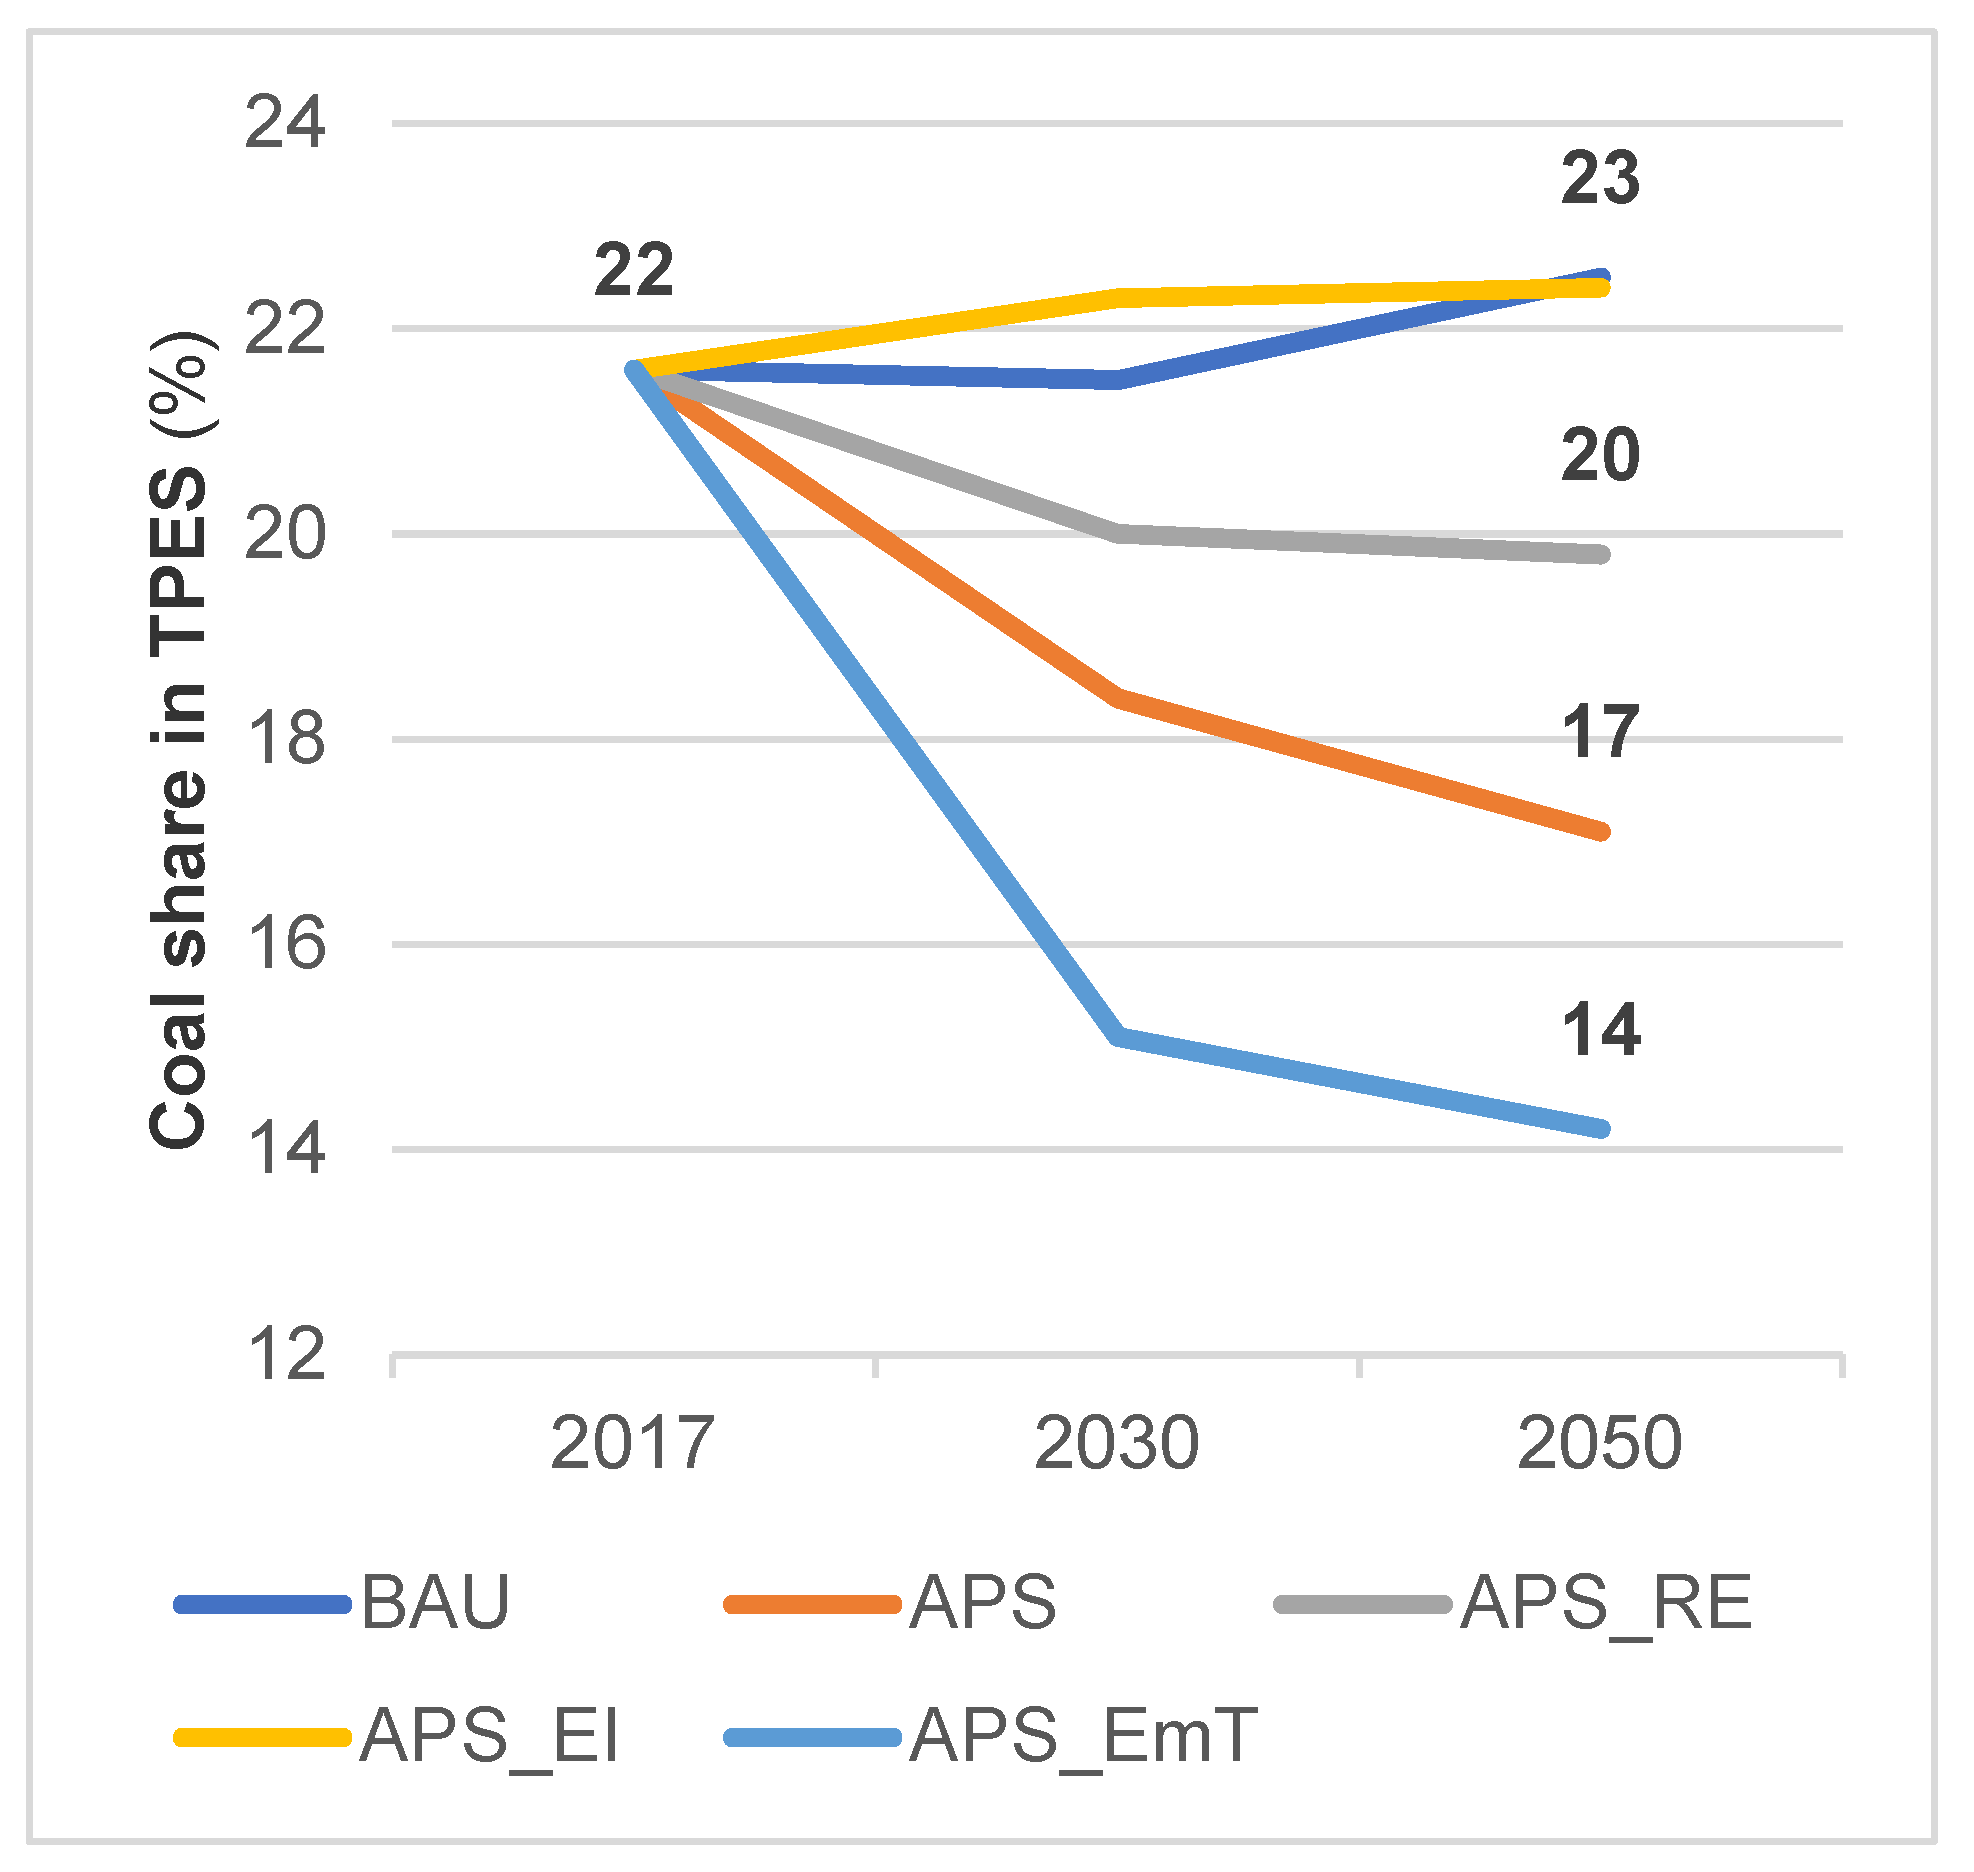
The share of coal in the primary energy supply was 22% in 2017; and it is predicted to be 23%, 17%, and 14% in the BAU scenario, APS, and APS_EmT in 2050, respectively. Coal has the second largest share in power generation, at 37% in 2017; and it is predicted to be 36%, 27%, and 19% in the BAU scenario, APS, and APS_EmT in 2050, respectively. Under the APS of emission reduction targets (APS_EmT), the share of coal is projected to drop significantly for both the primary energy supply as well as the share in the power generation mix (Figure 8 and Figure 9).
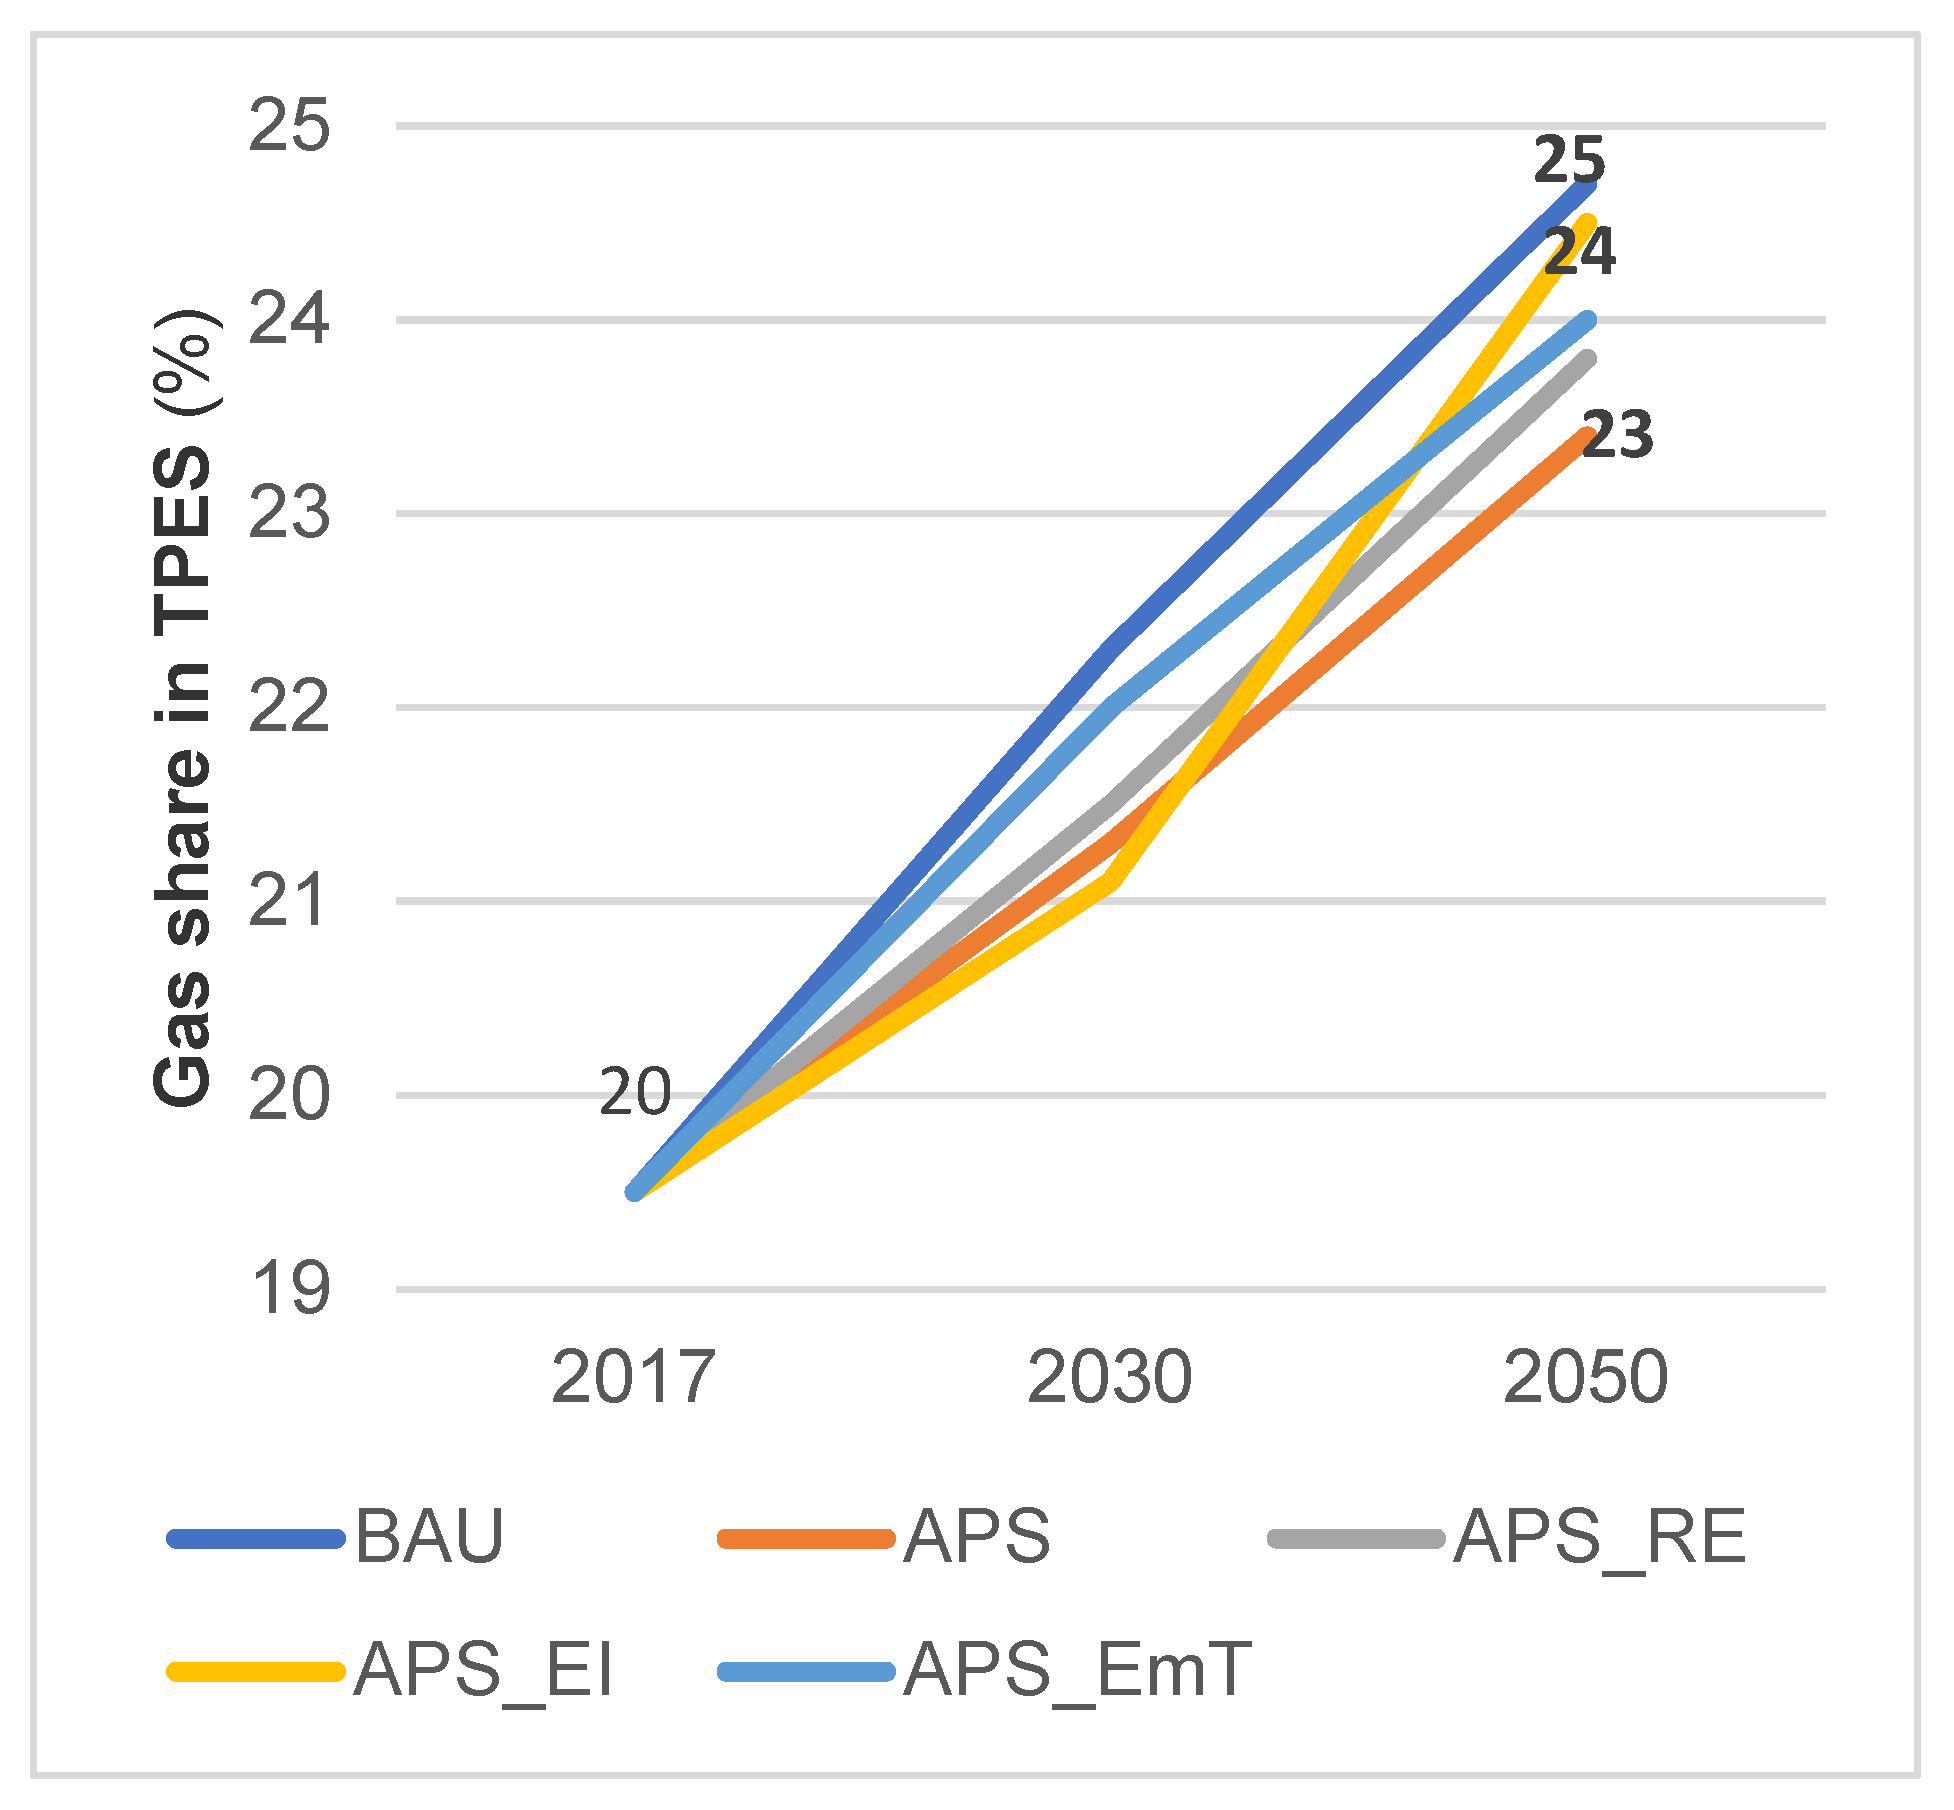
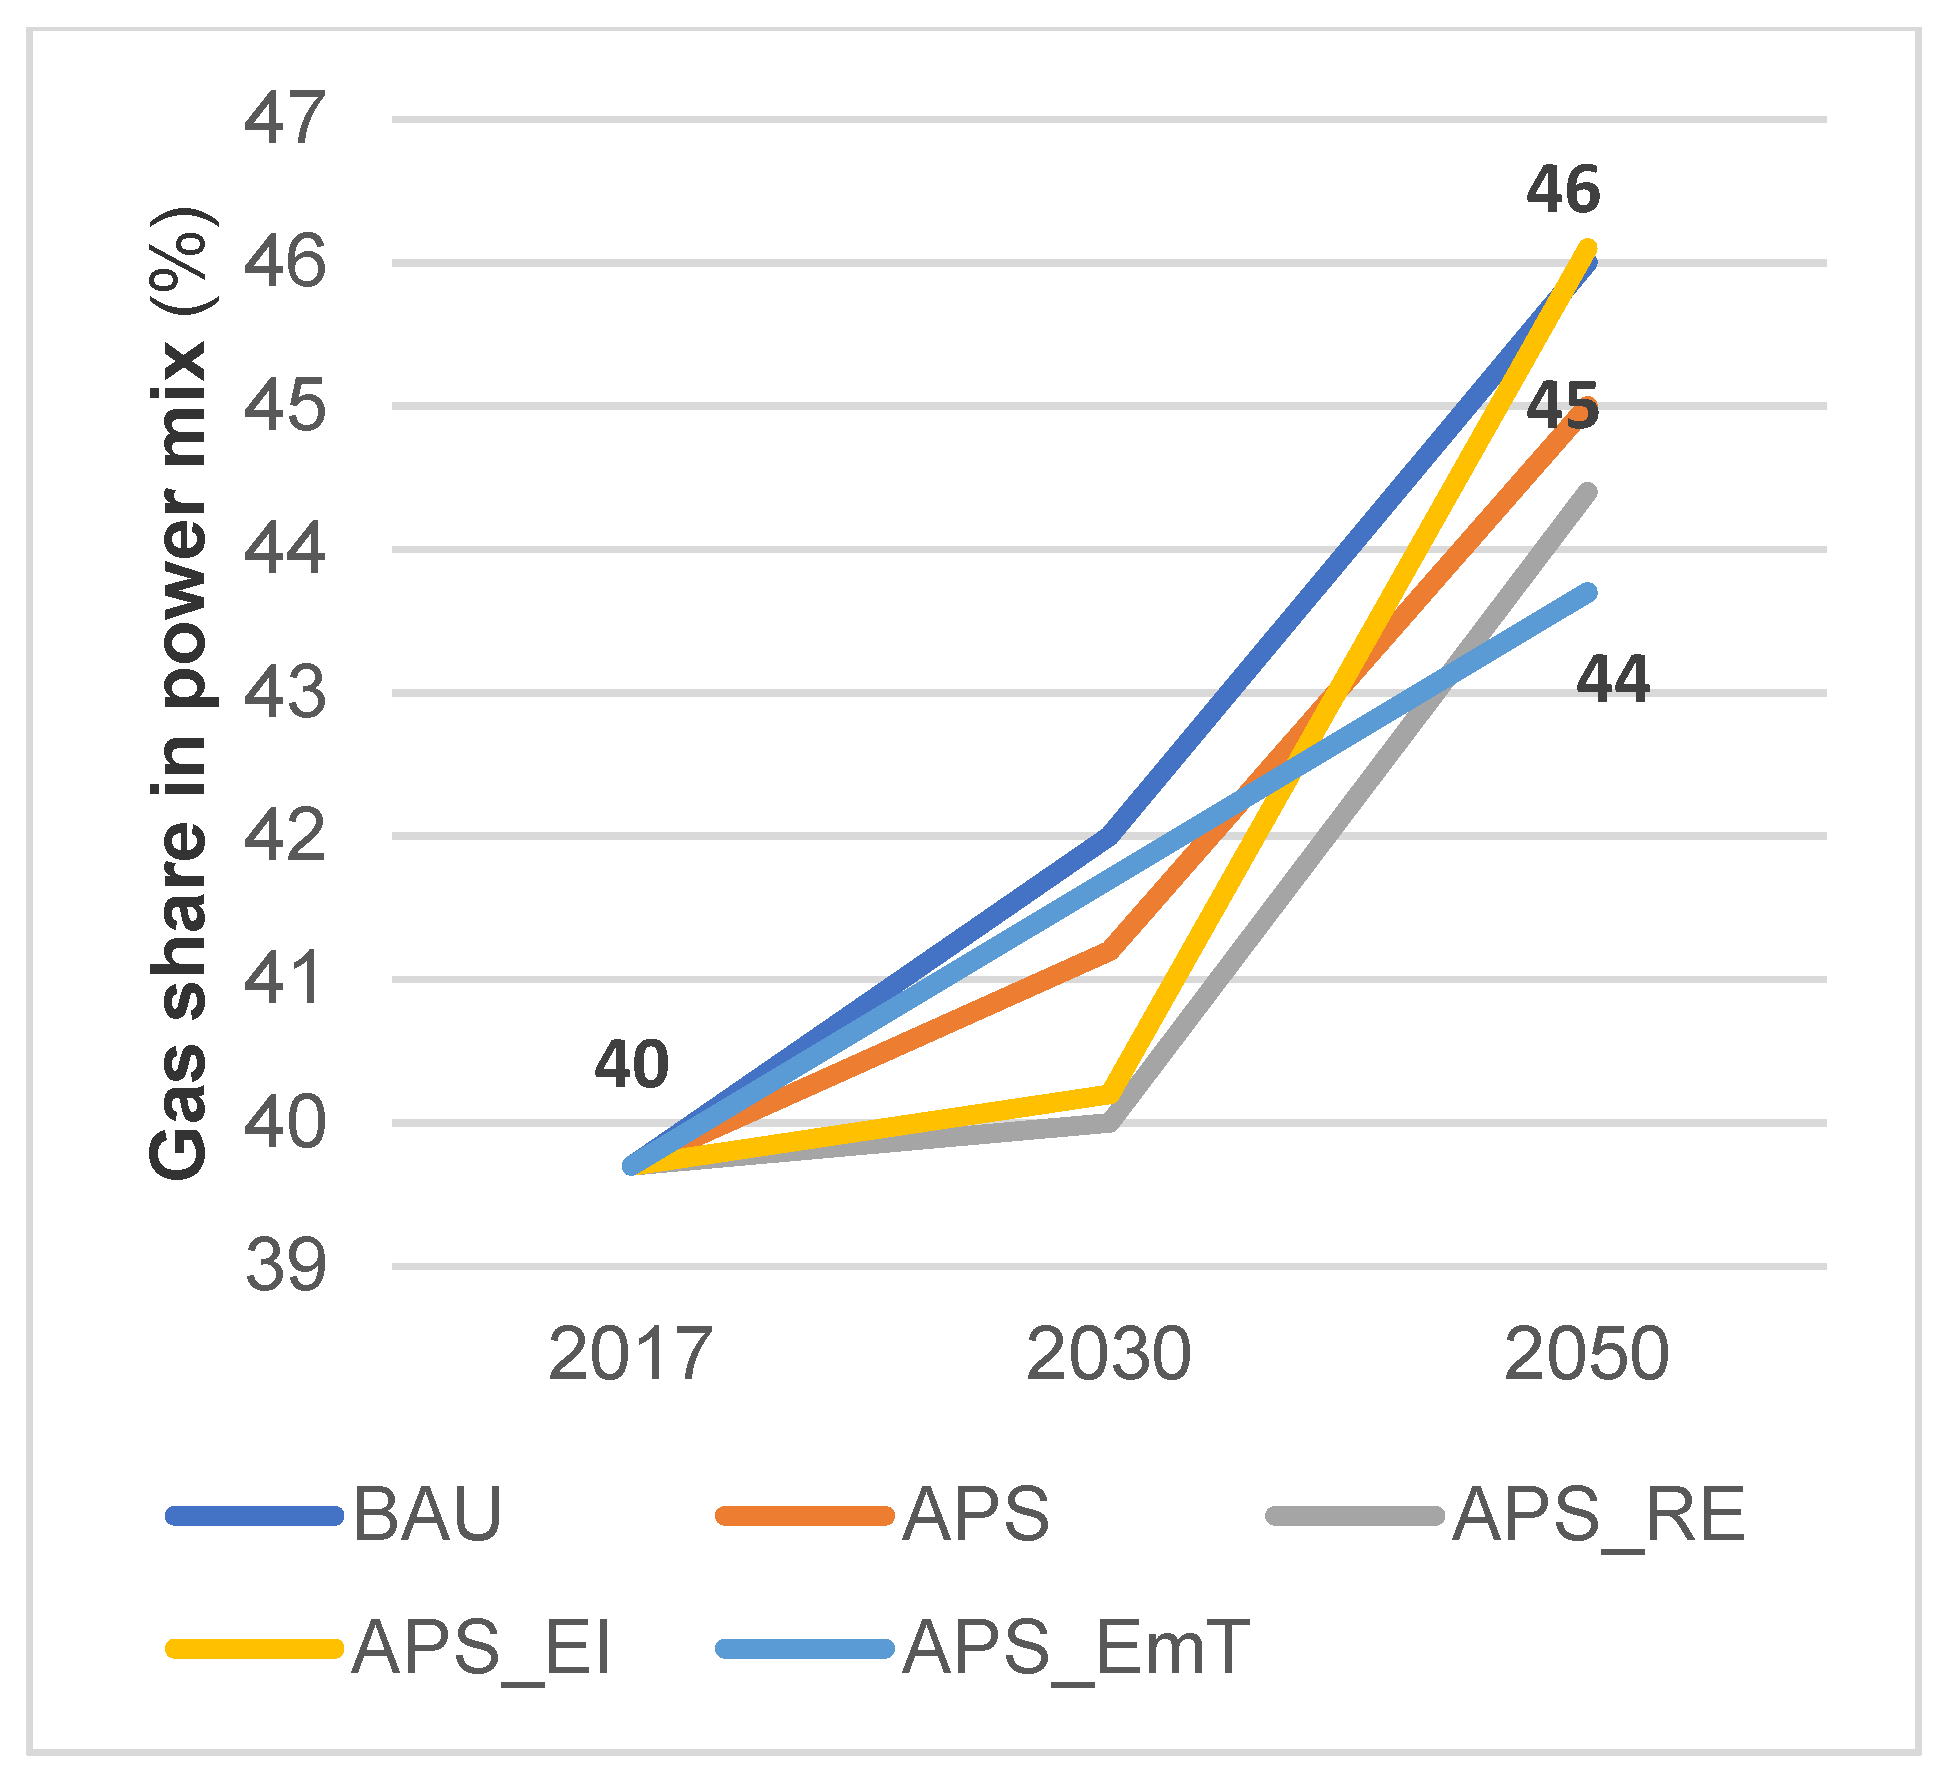
Although ASEAN relies heavily on fossil fuels (oil, coal, and gas), some AMS have shifted drastically to use more gas in power generation and other final uses, such as the industrial and transportation sectors. ASEAN as a group had a 20% share of gas in the primary supply in 2017, but its share in the primary energy supply is projected to increase to 25% and 23% in 2050 for the BAU case and APS, respectively. Remarkably, the share of gas, at 40% in 2017, was a dominant fuel in the power generation mix; and it is projected to increase to 46%, 45%, and 44% in 2050 for the BAU case, APS, and APS_EmT, respectively (Figure 10 and Figure 11).
Increasing but not sufficient share of renewables. The share of renewables (hydropower, geothermal, biomass, wind, and solar) in the power mix was 21% in 2017. Its share is projected to increase to 36%, 28%, and 27% in the APS_EmT, APS_RE, and APS in 2050 (Figure 12). The share of renewables is projected to be higher in 2030 than 2050 because hydropower and geothermal resources are limited. However, the share of wind and solar is projected to increase from 2% in 2017 to 18%, 12%, and 11% in 2050 under the APS_EmT, APS_RE, and APS, respectively (Figure 13).
Although renewables are key to achieving emissions reductions, their share in the energy mix is not high enough to decarbonize emissions to meet the climate target of reducing emissions to net zero from 2050 until the turn of this century (Figure 14 and Figure 15).
Achieving the APS_EmT is very unlikely because this scenario assumes the most efficient technologies and the highest share of renewables to achieve emissions reduction targets. Although the emissions reduction target was set at 80% from the BAU scenario to the APS_EmT, given the plausible challenges of integrating wind and solar in ASEAN’s system, only 55% could be achieved for all combined types of renewables. Thus, the remaining emissions coming from fossil fuels will need to be decarbonized through CCUS technologies or the growth of natural carbon stock.
ASEAN’s emissions keep increasing in the foreseeable scenarios. ASEAN as a group will see emissions doubling or tripling from 2017 to 2050, varying from the BAU case to the APSs. In the BAU scenario, emissions could reach 1217 million tonnes of carbon (Mt-C), almost triple the baseline level of 376 Mt-C in 2017. However, emissions could also be lower, at 876 Mt-C for the APS and 563 Mt-C for the APS_EmT (Figure 14). To limit the global temperature rise to 1.5 °C by 2100, emissions will need to be slashed by 45% from 2010 levels by 2030, then reach net zero emissions by 2050 (The Climate Reality Project, 2018) [25]. Thus, ASEAN as a group will miss this target and it will make it more difficult to cut emissions by 2050.
Required investment in power generation.Figure 16 is the estimated required investment for solar and wind energy. For the Small Modular Reactors (SMR) is not included in this estimation because ASEAN does not have plan to introduce nuclear power plant soon, although they keep this option open for the future. Thus, only solar and wind are estimated.
Accelerating the share of variable renewables, such as solar and wind, in ASEAN’s power mix will require $56 billion–$118 billion from the BAU scenario to the APSs in the case of solar photovoltaic and $12 billion–$50 billion in the case of wind, in 2050 (Figure 16). The total investment in the power generation of additional capacity will be $540 billion in the BAU scenario and $511 billion in the APSs—reflecting the reduced investment in fossil fuels and the increase in renewables, which will have less capital costs, driven by technological development, expected in 2050.

5. Implications of the Scenario Results

In 2020, fossil fuels (oil, coal, and natural gas) have the largest share of ASEAN’s primary energy mix, at 78%. They are expected to continue to have a dominant share in the BAU scenario in 2050, at 86%, but could drop slightly to an 82% and 80% share under the APS and APS emission reduction target (APS_EmT) respectively in 2050, when considering more efficient power generation, an increasing share of renewables, and energy efficiency measures (Table A1, Table A2, Table A3, Table A4, Table A5, Table A6, Table A7 and Table A8). Although oil has the largest share in the primary energy mix, natural gas and coal are the dominant energy sources in the power generation mix, at 37% and 44% respectively in 2017; and their share is projected to be 46% and 36% respectively in 2050.
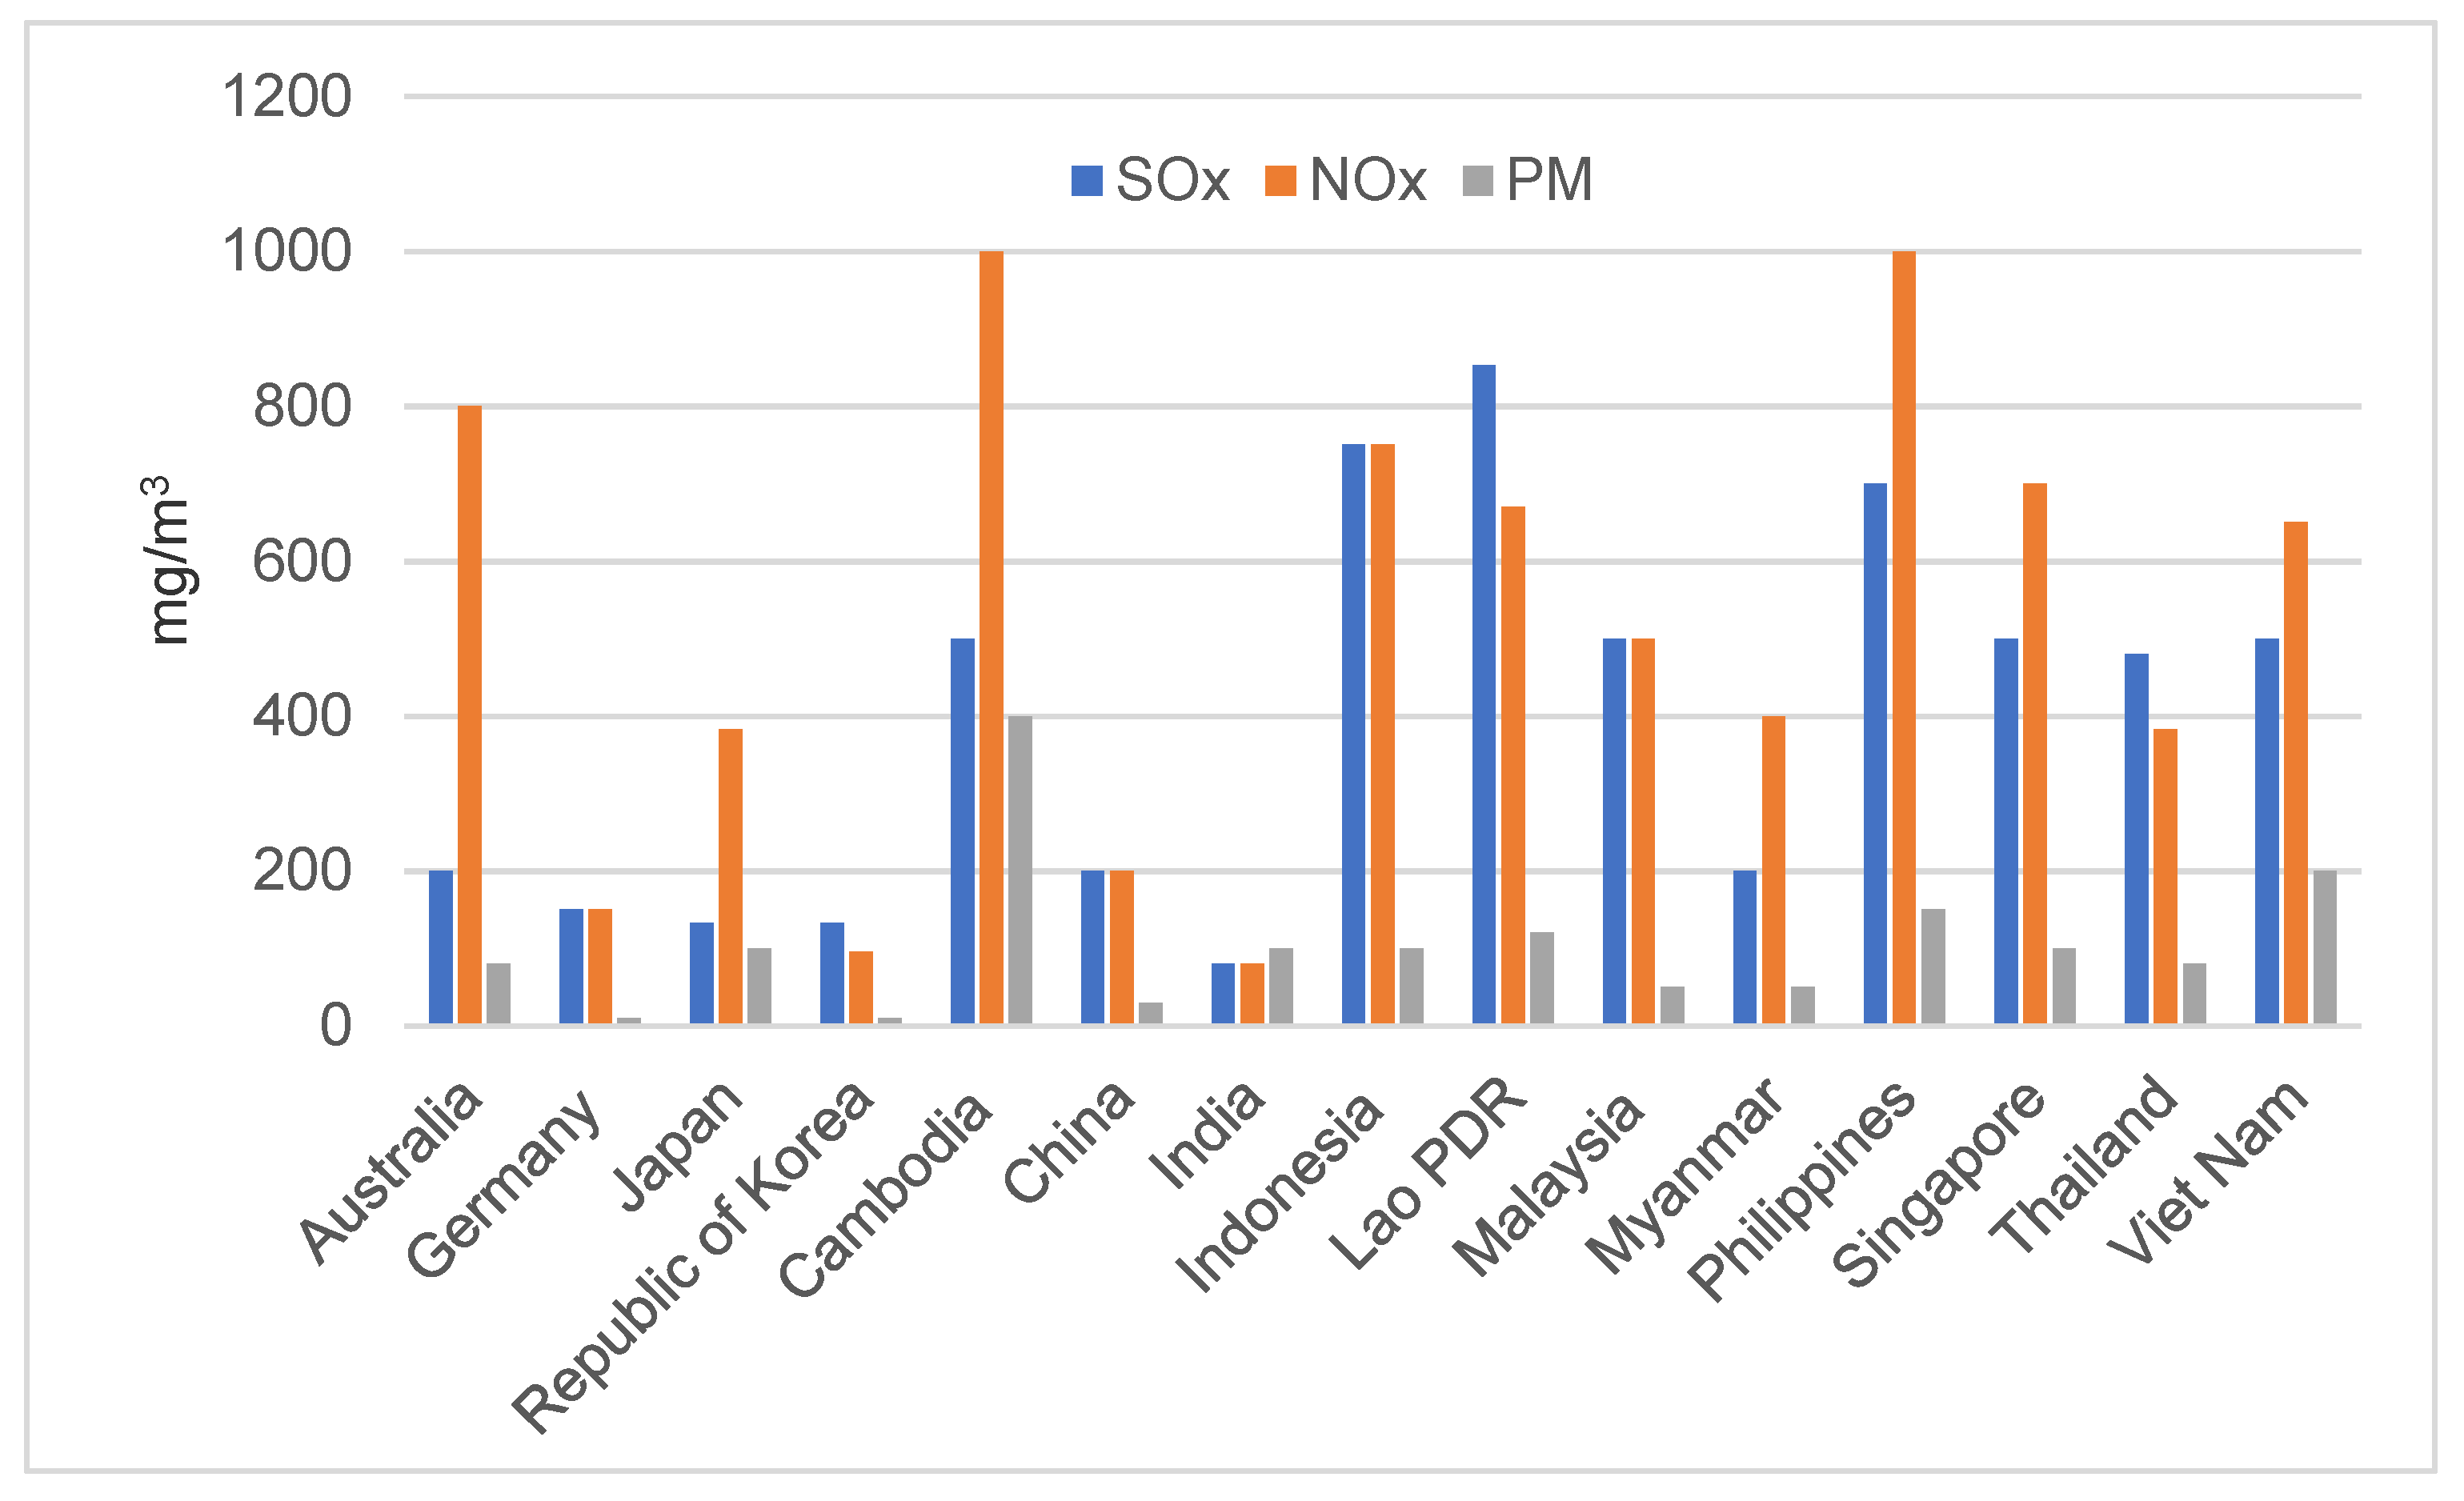
Need for cleaner use of fossil fuels and clean technologies. The composition of the future energy system depends on the current actions, policies, and future policy changes. However, all decisions need to be weighed against potentially higher energy costs, affordability, and energy security risks. Coal consumption has dropped globally in recent years, but Southeast Asia has seen the opposite trend—coal consumption has been concentrated in power generation although its share of the primary energy supply remains the same from the BAU scenario to the APS, while the actual quantity of coal consumption is predicted to increase significantly from 143 Mtoe in 2017 to 251 Mtoe in 2050. The relatively high level of coal consumption in ASEAN could be attributable to affordability and energy security issues. As coal will be the second most dominant source of energy for power generation, there is a real concern that many ASEAN countries cannot afford clean technologies such as CCT (advanced ultra-supercritical (A-USC) or ultra-supercritical (USC) technology) due to the higher up-front cost of these technologies compared with conventional high-emissions coal power plants (subcritical technology). At the same time, ASEAN as a bloc has lower emissions standards for coal-fired power plants than advanced countries such as Germany, Japan, and the Republic of Korea, where CCT is mandatory (Figure 17) [26]. This means that ASEAN countries have relatively high allowable emissions in terms of sulphur oxides (SOx), nitrogen oxides (NOx), and particulate matter (PM).
For ASEAN, the reliance on fossil fuel will be expected in the foreseeable future by 2050, even though ASEAN member states will invest in new infrastructure for cleaner-burning fossil fuels such as Clean Coal Technologies or Carbon Capture, Utilization and Storage (CCUS). However, the introduction of cleaner burning fossil fuels will help mitigate the pollutants nitrogen oxides, particulate matter, and sulfur oxides which are the major source contributing to direct human health such as respiratory system and cancer. Further, it also can help to cut down the carbon dioxide emissions if compared with traditional and inefficient coal-fired power generation.
Promoting natural gas uses in ASEAN’s energy transition. Natural gas has a significant role to play in ASEAN’s transition to a cleaner energy system. ASEAN as a group is forecast to continue to be a net natural gas exporter until 2030, but the situation will change due to declining domestic natural gas production and increasing domestic energy demand in ASEAN (Kobayashi and Phoumin, 2018) [27]. Demand for liquefied natural gas (LNG) in ASEAN is driven by increasing demand from the power generation and industrial sectors. Most AMS will see rising LNG imports in the foreseeable future because of sustained growth in electricity demand, the public preference for a cleaner fuel, and depleting domestic production. Prospects for the use of natural gas in ASEAN are optimistic, and demand is likely to increase 3.5 times in the BAU case (from 129 Mtoe in 2027 to 450 Mtoe in 2050)—depending on the future stability of gas and LNG market prices, and whether ASEAN and East Asia can create a competitive gas/LNG market in the future, with potential supply of gas/LNG from Australia, US, and other sources. Thus, ASEAN is expected to be a key market for future gas demand, so investment in gas infrastructure (such as gas pipelines and LNG receiving terminals) is crucial to support the increasing demand for gas in ASEAN.
ASEAN’s scaling up renewable share and adoption of smart grid. Energy sustainability in ASEAN and around the globe requires an increased share of renewables in the energy mix to decarbonize emissions. Currently, ASEAN’s power generation mix is dominated by coal, gas, and hydropower (Table A1, Table A2, Table A3, Table A4, Table A5, Table A6, Table A7 and Table A8). Intermittent renewables (solar and wind) comprise the most abundant energy resources in ASEAN, but have contributed negligible amounts (1.4% in 2017, 2.4% in 2020, and 10% and 12% in 2050 for the APS) to the power mix. Many ASEAN grid operators hold misperceptions about intermittent renewable energy. Although the production cost of renewable energy has dropped dramatically in recent years, its share in the power generation mix remains small. The misperceptions about renewable energy stem from its variable and intermittent nature, which adds costs to grid systems as it requires back-up capacity from conventional gas power plants. Technically, wind and solar power output varies depending on the strength of the wind or the amount of sunshine. However, this risk of variable energy output can be minimized if power systems are integrated within countries and within the ASEAN region. The aggregation of output from solar and wind from different geographical locations has a balancing effect on the variability (NREL, 2020) [28]. However, the ASEAN Power Grid is making slow progress and the integrated ASEAN power market may remain unrealized due to several reasons, such as regulatory and technical harmonization issues between the ASEAN Power Grid and utilities.
Challenges of power system integration in ASEAN. In the recent development of the power mix in ASEAN, some countries have accelerated the increase in the share of solar in the power mix without properly considering the poor gird infrastructure and power system integration challenges. As a result, electricity from solar has been curtailed. It is important to note that the shift from fossil fuels towards renewables in the energy transition will involve costs and investments for all energy-related infrastructure, which will hugely affect energy affordability. For AMS that can afford significant investments in renewable energies, an important concern is the need for electricity storage and smart grids to support higher renewable energy penetration levels in the electricity sector. Smart grid technologies are already making significant contributions to electricity grids in some developed countries of the OECD. However, these technologies are undergoing continual refinement and hence are vulnerable to potential technical and non-technical risks. Renewable energy growth will thus be constrained by infrastructure development as well as by the evolution of technology, including the capacity to assess and predict the availability of renewable energy sources (Kimura, Pacudan, and Phoumin, 2017) [29]. These capacities of smart grids offer additional benefits, notably the promise of higher reliability and overall electricity system efficiency.
Long-term emissions reduction and COVID-19. Due to the drastic decline in energy consumption, daily global emissions dropped by 17% in the first quarter of 2020 compared with 2019 levels (Le Quéré et al., 2020) [30]. However, an economic recovery could see the levels of CO2 emissions bouncing back very quickly. Indeed, global data from late May 2020 show an all-time high for CO2 levels, as countries started to reopen their economies. The sudden drop in current emissions has nothing to do with low-carbon energy policy measures—it is just the impact of the pandemic slowing down all economic activities. It is also understandable that the energy structure cannot be changed overnight, given its large dependence on fossil fuels. The results have shown that ASEAN emissions will be 1217 Mt-C in the BAU and 565 Mt-C to 876 Mt-C in the APSs, in which they are supposed to fall to zero emissions if the rise in temperature is to keep within 1.5 °C by the end of this century. This means that ASEAN will not be able to achieve the emissions reduction targets. This necessitates a serious review of the commitment in the NDCs or INDCs to limit the emissions to half by 2030 and reach net zero emissions by 2050. It also points to the urgent need for carbon sink technologies such as CCUS.
ASEAN’s energy transition from a system based on fossil fuels to a system based on cleaner energy use will rely on investment in quality infrastructure—including renewable and cleaner use of fossil fuels, and CCUS—to reduce global GHG emissions and avoid the most serious impacts of climate change. Clean technologies and CCUS are the obvious choice to reduce fossil fuel emissions in ASEAN, while accelerating the use of renewables and the application of energy efficiency in all sectors.
Need for quality energy infrastructure and investment. To satisfy the growing energy demand in ASEAN, huge energy-related infrastructure investment is necessary between now and 2050. This study estimates that about $500 billion–$550 billion will be necessary in the power generation sector, of which combined variable renewables (wind and solar) will require $68 billion–$168 billion from the BAU scenario to the APSs, respectively. More broadly, the IEA (2017) [2], projected that $2.1 trillion will be required for oil, gas, coal, and power supply infrastructure in ASEAN. More than 60% of investment goes to the power sector, with transmission and distribution accounting for more than half of the total necessary investment. Globally, the Ministry of Finance of Japan (2019) estimated that the infrastructure investment gap is estimated to be $15 trillion from now until 2040. Asia alone will have a $4.6 trillion investment gap from now until 2040 (Ministry of Finance, Japan, 2019) [31]. the huge potential for energy infrastructure related investment will need to be guided by appropriate policies to promote quality infrastructure and resilience in ASEAN for growth and sustainability. Thus, ASEAN will need to prepare an array of policies suited to specific conditions to facilitate investment opportunities.

6. Conclusions and Policy Implications

The results of various scenarios have shown that ASEAN’s current and future energy mix relies greatly on fossil fuels. The current share of fossil fuels is almost 80% in the primary energy supply and its future share is projected to be 87% under the BAU scenario and 78% under the APS. ASEAN’s emissions will remain very high in all APS scenarios. To limit the temperature rise to 2° Celsius, emissions will need to fall to half by 2030 and reach net zero emissions by 2050 from 2010 levels. Thus, the clean use of fossil fuels through clean technologies and CCUS will be the only technological options to decarbonize emissions from fossil fuel use. In the energy transition, natural gas should be promoted as a transitional fuel in ASEAN, given the abundant supply from Australia. Renewables, energy efficiency, and green hydrogen (Green hydrogen refers to the hydrogen production from renewable electricity.) should be accelerated—along with the adoption of clean ecotechnologies—in the medium to long term in ASEAN’s future energy system. Policies to manage ASEAN’s energy transition need to be weighed against potentially higher energy costs, affordability, and energy security risks. Oil is the dominant energy source in the transport sector, while natural gas and coal are the dominant energy sources for power generation in ASEAN. The higher share of natural gas in ASEAN’s power mix is a step in the right direction in promoting natural gas use in the energy transition towards a cleaner energy system.
In many ASEAN countries, coal use in power generation has been locked into the foreseeable future energy mix, as current and future coal-fired power generation generally involves 20- to 35-year power purchasing agreements with state-owned utilities to provide electricity. Thus, ignoring coal use in ASEAN means ignoring the reality and emissions of coal use. Considering the clean use of coal as part of ASEAN’s energy transition is crucial to address the priorities of energy affordability and climate change. The deployment of CCT is urgent in the ASEAN region. Although ASEAN’s energy targets have been set to include more renewables, ASEAN faces challenges in implementing such targets because renewables remain expensive in terms of the system integration cost to achieve high penetration in the grid system. Smart grids using the internet of things will provide a new green investment infrastructure which allows more penetration of renewables, but significant investment is required such as hard grids, internet of things technologies and applications, data management, and human resources.
A cleaner energy system in ASEAN relies on today’s actions, policies, and investments to accelerate a higher share of renewables, the adoption of clean technologies and clean use of fossil fuels, and investment in climate-resilient energy quality infrastructure. The need for variable renewable investment in the power mix is estimated to be $118 billion in the APSs. Finally, willingness to pay is crucial if ASEAN is to leapfrog from its current energy system towards more efficient and clean technologies and a higher share of renewables in the energy mix.
Below are the key policy implications from the study:
  • AMS will require assistance from developed countries to support the deployment of clean coal technologies, so that some developing countries in ASEAN will be able to afford clean coal technologies (e.g., USC or A-USC) to remove pollutants and increase the efficiency of power plants.
  • The current climate narrative and policy approach of banning coal use should be reviewed to assist emerging Asia to afford CCTs, if alternative energy options are not available or feasible for emerging Asia in the medium term to meet energy demand. Treating CCTs as technology solutions in the energy transition will be a win–win solution for the world in terms of mitigating emissions and for Asia in sustaining energy accessibility and affordability.
  • Emerging Asia will rely on whatever CCTs are available in the market at an affordable price. The up-front cost of such USC or A-USC technology is higher than that of supercritical (SC) and sub-critical (C) technology. Thus, it is necessary to lower such costs through policies such as attractive financing loan schemes for USC technologies, or a strong political institution to deliver public financing for CCTs to emerging Asia.
  • A policy framework should clearly state the corporate social responsibilities of developed and developing nations, respectively, by highlighting the near- and long-term policy measures towards the coal industry and coal-fired power generation. As emissions in ASEAN are expected to rise until 2050, carbon recycling technologies will be necessary. In this regard, the world needs to accelerate the research, development, and deployment of CCUS for commercialization in the near future.
  • There is a need to accelerate smart grid infrastructure development and investment, and energy cooperation from developed countries to share the experience of energy system integration, to achieve a higher share of renewables in the power system.
  • ASEAN should promote natural gas use in the energy transition, as it creates only half the emissions that coal produces. Thus, investment in natural gas infrastructure will be crucial to increase natural gas use in ASEAN.
  • ASEAN should accelerate the penetration of renewables, while increasing the adoption of clean technologies and the deployment of CCUS in the foreseeable future.
  • ASEAN’s leaders should consider the gradual removal of blanket fossil fuel subsidies, but should replace them with subsidies targeted at vulnerable groups to help meet their basic energy needs and support their well-being.
  • Other energy policy measures should consider the potential higher energy costs, energy affordability and accessibility, and energy security risks. Regular surveys to assess people’s willingness to pay for energy costs will be key in planning policy measures/reforms.

Author Contributions

Conceptualization, H.P., F.K. and J.A.; Data curation, H.P.; Formal analysis, H.P.; Investigation, H.P.; Methodology, H.P.; Software, H.P.; Supervision, F.K. and J.A.; Writing—original draft, H.P. All authors have read and agreed to the published version of the manuscript.

Funding

This research received no external funding.

Institutional Review Board Statement

Not applicable.

Informed Consent Statement

Not applicable.

Data Availability Statement

Not applicable.

Conflicts of Interest

The authors declare no conflict of interest.

Appendix A

Table A1. Estimates of Primary Energy Supply and Percentage Changes from BAU to APSs, 2030 (Mtoe).
Item20172030
BaselineBAUAPS% Change (BAU vs. APS)APS_RE% Change (BAU vs. APS_RE)APS_EI% Change (BAU vs. APS_EI)APS_EmT% Change (BAU vs. APS_EmT)
Coal143220164−25195−12199−10118−46
Oil228374357−5366−2340−9314−16
Natural gas119214190−11209−2188−12172−20
Nuclear0000000000
Hydro162424025723−4240
Geothermal203232134630−5322
Biomass10510210211131197−597−5
Solar, wind, ocean16129012816−71062
Biofuels71211−7184810−17135
Electricity−120−1082190−1040−106
Total639986893−9974−1893−9780−21
APS = alternative policy scenario, APS_EI = alternative policy scenario with energy intensity targets, APS_EmT = alternative policy scenario with emission reduction targets, APS_RE = alternative policy scenario with renewable targets, BAU = business as usual, Mtoe = million tonnes of oil equivalent. Source: Authors’ calculations.
Table A2. Estimates of Primary Energy Supply and Percentage Changes from BAU to APSs, 2050 (Mtoe).
Item20172050
BaselineBAUAPS% Change (BAU vs. APS)APS_RE% Change (BAU vs. APS_RE)APS_EI% Change (BAU vs. APS_EI)APS_EmT% Change (BAU vs. APS_EmT)
Coal143409251−39360−12335−18145−65
Oil228721602−17681−6586−19423−41
Natural gas119450342−24432−4366−19245−46
Nuclear00655700007718
Hydro163130−3351630−328−8
Geothermal206374171016151−1941−35
Biomass1059910441272887−1391−8
Solar, wind, ocean1142580247112−162472
Biofuels72823−20507621−2613−56
Electricity−176−126−106−73−59
Total63918231461−20181701493−181018−44
APS = alternative policy scenario, APS_EI = alternative policy scenario with energy intensity targets, APS_EmT = alternative policy scenario with emission reduction targets, APS_RE = alternative policy scenario with renewable targets, BAU = business as usual, Mtoe = million tonnes of oil equivalent. Source: Author’s calculations.
Table A3. Estimates of Final Energy Consumption and Percentage Changes from BAU to APSs, 2030 (Mtoe).
20172030
ItemBaselineBAUAPS% Change (BAU vs. APS)APS_RE% Change (BAU vs. APS_RE)APS_EI% Change (BAU vs. APS_EI)APS_EmT% Change (BAU vs. APS_EmT)
Industry148248227−8241−3220−11199−20
Transportation129231201−132310201−13184−20
Others141190177−7189−1176−8158−17
Non-energy628080066−1866−1866−18
Total480750686−9727−3663−12607−19
APS = alternative policy scenario, APS_EI = alternative policy scenario with energy intensity targets, APS_EmT = alternative policy scenario with emission reduction targets, APS_RE = alternative policy scenario with renewable targets, BAU = business as usual, Mtoe = million tonnes of oil equivalent. Source: Authors’ calculations.
Table A4. Estimates of Final Energy Consumption and Percentage Changes from BAU to APSs, 2050 (Mtoe).
20172050
ItemBaselineBAUAPS% Change (BAU vs. APS)APS_RE% Change (BAU vs. APS_RE)APS_EI% Change (BAU vs. APS_EI)APS_EmT% Change (BAU vs. APS_EmT)
Industry148453386−15448−1381−16250−45
Transportation129483374−234861376−22246−49
Others141294253−142940253−14190−36
Non-energy621261260109−13109−13109−13
Total48013561139−161337−11119−17794−41
APS = alternative policy scenario, APS_EI = alternative policy scenario with energy intensity targets, APS_EmT = alternative policy scenario with emission reduction targets, APS_RE = alternative policy scenario with renewable targets, BAU = business as usual, Mtoe = million tonnes of oil equivalent. Source: Authors’ calculations.
Table A5. Estimates of Power Generation Mix and Percentage Changes from BAU to APSs, 2030 (TWh).
Item20172030
BaselineBAUAPS% Change (BAU vs. APS)APS_RE% Change (BAU vs. APS_RE)APS_EI% Change (BAU vs. APS_EI)APS_EmT% Change (BAU vs. APS_EmT)
Coal381608449−26582−4552−9298−51
Oil262321−921−822−510−57
Natural gas414743669−10660−11645−13591−20
Nuclear0000000000
Hydro18326727643974926702784
Geothermal233737139735−5382
Others14911698619311386−5201122
Total104117681622−8189271607−91416−20
APS = alternative policy scenario, APS_EI = alternative policy scenario with energy intensity targets, APS_EmT = alternative policy scenario with emission reduction targets, APS_RE = alternative policy scenario with renewable targets, BAU = business as usual, TWh= terawatt-hour. Source: Authors’ calculations.
Table A6. Estimates of Power Generation Mix and Percentage Changes from BAU to APSs, 2050 (TWh).
Item20172050
BaselineBAUAPS% Change (BAU vs. APS)APS_RE% Change (BAU vs. APS_RE)APS_EI% Change (BAU vs. APS_EI)APS_EmT% Change (BAU vs. APS_EmT)
Coal3811232772−371054−141005−18398−68
Oil261212112011−3120
Natural gas41415821303−18170071359−14919−42
Nuclear002121370000282757
Hydro183356344−353751346−3326−8
Geothermal237386171186159−1947−35
Others1418535693406120167−10376104
Total104134392895−163827112948−142105−39
APS = alternative policy scenario, APS_EI = alternative policy scenario with energy intensity targets, APS_EmT = alternative policy scenario with emission reduction targets, APS_RE = alternative policy scenario with renewable targets, BAU = business as usual, TWh = terawatt-hour. Source: Authors’ calculations.
Table A7. Estimates of CO2 Emissions and Percentage Changes from BAU to APSs, 2030 (Mt-C).
20172030
ItemBaselineBAUAPS% Change (BAU vs. APS)APS_RE% Change (BAU vs. APS_RE)APS_EI% Change (BAU vs. APS_EI)APS_EmT% Change (BAU vs. APS_EmT
Coal147227144−37197−13197−13122−46
Oil138249147−412583238−5202−19
Natural gas91152100−34148−3139−9105−31
Total376628391−38603−4574−9429−32
APS = alternative policy scenario, APS_EI = alternative policy scenario with energy intensity targets, APS_EmT = alternative policy scenario with emission reduction targets, APS_RE = alternative policy scenario with renewable targets, BAU = business as usual, Mt-C = million tonnes of carbon equivalent. Source: Authors’ calculations.
Table A8. Estimates of CO2 Emissions and Percentage Changes from BAU to APSs, 2050 (Mt-C).
Item20172050
BaselineBAUAPS% Change (BAU vs. APS)APS_RE% Change (BAU vs. APS_RE)APS_EI% Change (BAU vs. APS_EI)APS_EmT% Change (BAU vs. APS_EmT
Coal147432264−39360−17317−27151−65
Oil138503395−215071437−13280−44
Natural gas91281216−23275−2244−13132−53
Total3761217876−281141−6998−18563−54
APS = alternative policy scenario, APS_EI = alternative policy scenario with energy intensity targets, APS_EmT = alternative policy scenario with emission reduction targets, APS_RE = alternative policy scenario with renewable targets, BAU = business as usual, Mt-C = million tonnes of carbon equivalent. Source: Authors’ calculations.

References

  1. IMF. World Economic Outlook Reports. Available online: https://www.imf.org/en/publications/weo (accessed on 30 June 2020).
  2. IEA. World Energy Outlook 2017; International Energy Agency: Paris, France, 2017; Available online: https://www.iea.org/reports/world-energy-outlook-2017 (accessed on 20 September 2020).
  3. Phoumin, H.; Kimura, F.; Arima, J. Potential Renewable Hydrogen from Curtailed Electricity to Decarbonize ASEAN’s Emissions: Policy Implications. Sustainability 2020, 12, 10560. [Google Scholar] [CrossRef]
  4. Ali, H.; Phoumin, H.; Weller, S.R.; Suryadi, B. Cost–Benefit Analysis of HELE and Subcritical Coal-Fired Electricity Generation Technologies in Southeast Asia. Sustainability 2021, 13, 1591. [Google Scholar] [CrossRef]
  5. Phoumin, H. Enabling Clean-Coal Technologies in Emerging Asia, Working Paper for the National Bureau of Asian Research 2015 Pacific Energy Summit, Beijing, 27–29 May 2015. Available online: https://www.nbr.org/publication/enabling-clean-coal-technologies-in-emerging-asia/ (accessed on 20 July 2020).
  6. United States Environmental Protection Agency. Global Greenhouse Gas Emissions Data. 2020. Available online: http://www.epa.gov/climatechange/ghgemissions/global.html (accessed on 15 February 2020).
  7. Economic Research Institute for ASEAN and East Asia (ERIA). Round Table Discussion on ASEAN’s Future Energy Landscape; ERIA: Jakarta, Indonesia, 2020. [Google Scholar]
  8. Isik, M.; Kaplan, P.O. Understanding Technology, Fuel, Market and Policy Drivers for New York State’s Power Sector Transformation. Sustainability 2021, 13, 265. [Google Scholar] [CrossRef] [PubMed]
  9. Phoumin, H.; Mikkal, E.H.; Nikos, T.; Courtney, W. Powering Southeast Asia: Meeting the Region’s Electricity Needs. NBR Special Report #89. Available online: https://www.nbr.org/publication/powering-southeast-asia-meeting-the-regions-electricity-needs/ (accessed on 18 December 2020).
  10. Nepal, R.; Phoumin, H.; Khatri, A. Green Technological Development and Deployment in the Association of Southeast Asian Economies (ASEAN)—At Crossroads or Roundabout? Sustainability 2021, 13, 758. [Google Scholar] [CrossRef]
  11. Economic Research Institute for ASEAN and East Asia (ERIA). Asia-CCUS Network Conference. In Proceedings of the Virtual Conference on Asia-CCUS, Jakarta, Indonesia, 10 February 2020. [Google Scholar]
  12. McCauley, D.; Heffron, R. Just Transition: Integrating climate, energy and environmental justice. Energy Policy 2018, 119, 1–7. [Google Scholar] [CrossRef] [Green Version]
  13. Raphael, J.H.; McCauley, D.; Benjamin, K.S. Resolving society’s energy trilemma through the Energy Justice Metric. Energy Policy 2015, 87, 168–176. [Google Scholar]
  14. EU. EU Action: 2050 Long-Term Strategy. 2020. Available online: https://ec.europa.eu/clima/policies/strategies/2050 (accessed on 27 April 2020).
  15. UNEP. Emissions Gap Report 2019; United Nations Environment Programme: Nairobi, Kenya, 2019; Available online: https://www.unenvironment.org/resources/emissions-gap-report-2019 (accessed on 26 September 2020).
  16. UN Environment Assembly (UNEP). The Fifth Session of the UN Environment Assembly (UNEA-5). 2021. Available online: https://www.unep.org/environmentassembly/unea5 (accessed on 21 February 2021).
  17. ASHRAE. The ASHRAE Digital: Lighthouse and Industry 4.0. 2020. Available online: https://online.flipbuilder.com/Mashrae.bog/ynzh/ (accessed on 21 February 2021).
  18. ASEAN Centre for Energy (ACE). ASEAN Plan of Action for Energy Cooperation 2016–2025: Phase I: 2016–2020; ACE: Jakarta, Indonesia, 2015. [Google Scholar]
  19. ASEAN Centre for Energy. The ASEAN Member States Are on Their Way to Implement APAEC Phase II, News Release. 2020. Available online: https://aseanenergy.org/the-asean-member-states-are-on-their-way-to-implement-apaec-phase-ii/ (accessed on 25 September 2020).
  20. Kimura, S.; Phoumin, H. (Eds.) Technical Improvement Report on Energy Outlook and Energy Saving Potential in East Asia; ERIA Research Project Report 2016, No. 8; Economic Research Institute for ASEAN and East Asia: Jakarta, Indonesia, 2018; Available online: https://www.eria.org/research/technical-improvement-report-on-energy-outlook-and-energy-saving-potential-in-east-asia/ (accessed on 30 June 2020).
  21. UNFCCC. Intended Nationally Determined Contributions: Submissions; United Nations Framework Convention on Climate Change: New York, NY, USA, 2015; Available online: https://www4.unfccc.int/sites/submissions/indc/Submission%20Pages/submissions.aspx (accessed on 14 April 2020).
  22. IEA. World Energy Model; International Energy Agency: Paris, France, 2019; Available online: https://www.iea.org/reports/world-energy-model/macro-drivers (accessed on 17 September 2020).
  23. Kimura, S.; Phoumin, H. (Eds.) Energy Outlook and Energy Saving Potential in East Asia 2019; Economic Research Institute for ASEAN and East Asia: Jakarta, Indonesia, 2019. [Google Scholar]
  24. IEA. Oil Stocks of IEA Countries. 15 September 2020. Available online: https://www.iea.org/articles/oil-stocks-of-iea-countries (accessed on 21 September 2020).
  25. The Climate Reality Project. 2030 or Bust: 5 Key Takeaways from the IPCC Report, Blog. 18 October 2018. Available online: https://www.climaterealityproject.org/blog/2030-or-bust-5-key-takeaways-ipcc-report (accessed on 30 September 2020).
  26. Motokura, M.; Lee, J.; Kutani, I.; Phoumin, H. (Eds.) Improving Emission Regulation for Coal-fired Power Plants in ASEAN; ERIA Research Project Report 2016, No. 2; ERIA: Jakarta, Indonesia, 2017; Available online: https://www.eria.org/RPR_FY2016_02.pdf (accessed on 10 June 2020).
  27. Kobayashi, Y.; Phoumin, H. (Eds.) Natural Gas Master Plan for Myanmar; ERIA Research Project Report 2017, No. 17; Economic Research Institute for ASEAN and East Asia: Jakarta, Indonesia, 2018; Available online: https://www.eria.org/publications/natural-gas-master-plan-for-myanmar/ (accessed on 27 July 2020).
  28. NREL. Wind and Solar on the Power Grid: Myths and Misperceptions; National Renewable Energy Laboratory: Golden, CO, USA, 2020. Available online: https://www.nrel.gov/docs/fy15osti/63045.pdf (accessed on 1 July 2020).
  29. Kimura, S.; Pacudan, R.; Phoumin, H. (Eds.) Development of the Eco Town Model in the ASEAN Region through Adoption of Energy-Efficient Building Technologies, Sustainable Transport, and Smart Grids; ERIA Research Project Report 2015, No. 20; Economic Research Institute for ASEAN and East Asia: Jakarta, Indonesia, 2017; Available online: https://www.eria.org/RPR_FY2015_No.20.pdf (accessed on 29 September 2020).
  30. Le Quéré, C.; Jackson, R.B.; Jones, M.W.; Smith, A.J.P.; Abernethy, S.; Andrew, R.M.; De-Gol, A.J.; Willis, D.R.; Shan, Y.; Canadell, J.G.; et al. Temporary reduction in daily global CO2 emissions during the COVID-19 forced confinement. Nat. Clim. Chang. 2020, 10, 647–653. [Google Scholar] [CrossRef]
  31. Ministry of Finance, Japan. Quality Infrastructure Investment G20 Deliverables under Japanese Presidency, Presentation, The Fifth Tokyo Fiscal Forum, Tokyo, 20–21 November 2019. Available online: https://www.mof.go.jp/pri/research/seminar/fy2019/tff2019_s1_01.pdf (accessed on 29 September 2020).
Figure 1. Average Annual Growth Rate of GDP (%) and Population in AMS, 2017–2050. AMS = ASEAN Member States, ASEAN = Association of Southeast Asian Nations, GDP-AAGR = average annual growth rate of GDP, POP-AAGR = average annual growth rate of the population. Source: Authors’ calculations.
Sustainability 13 02819 g001
Figure 2. Primary Energy Supply (TPES) in ASEAN. APS = alternative policy scenario, APS_EI = alternative policy scenario with energy intensity targets, APS_EmT = alternative policy scenario with emission reduction targets, APS_RE = alternative policy scenario with renewable targets, ASEAN = Association of Southeast Asian Nations, BAU = business as usual, Mtoe = million tones of oil equivalent, TPES = total primary energy supply. Source: Authors’ calculations.
Sustainability 13 02819 g002
Figure 3. Energy Intensity in ASEAN. APS = alternative policy scenario, APS_EI = alternative policy scenario with energy intensity targets, APS_EmT = alternative policy scenario with emission reduction targets, APS_RE = alternative policy scenario with renewable targets, ASEAN = Association of Southeast Asian Nations, BAU = business as usual, GDP = gross domestic product. Source: Authors’ calculations.
Sustainability 13 02819 g003
Figure 4. Share of Fossil Fuels (Coal, Oil, Gas) in the TPES. APS = alternative policy scenario, APS_EI = alternative policy scenario with energy intensity targets, APS_EmT = alternative policy scenario with emission reduction targets, APS_RE = alternative policy scenario with renewable targets, BAU = business as usual, TPES = total primary energy supply. Source: Authors’ calculations.
Sustainability 13 02819 g004
Figure 5. Share of Fossil Fuels in the Power Mix. APS = alternative policy scenario, APS_EI = alternative policy scenario with energy intensity targets, APS_EmT = alternative policy scenario with emission reduction targets, APS_RE = alternative policy scenario with renewable targets, BAU = business as usual. Source: Authors’ calculations.
Sustainability 13 02819 g005
Figure 6. Oil Share in TPES in ASEAN. APS = alternative policy scenario, APS_EI = alternative policy scenario with energy intensity targets, APS_EmT = alternative policy scenario with emission reduction targets, APS_RE = alternative policy scenario with renewable targets, ASEAN = Association of Southeast Asian Nations, BAU = business as usual, TPES = total primary energy supply. Source: Authors’ calculations.
Sustainability 13 02819 g006
Figure 7. Oil Share in Final Demand in ASEAN. APS = alternative policy scenario, APS_EI = alternative policy scenario with energy intensity targets, APS_EmT = alternative policy scenario with emission reduction targets, APS_RE = alternative policy scenario with renewable targets, ASEAN = Association of Southeast Asian Nations, BAU = business as usual. Source: Authors’ calculations.
Sustainability 13 02819 g007
Figure 8. Coal Share in TPES in ASEAN. APS = alternative policy scenario, APS_EI = alternative policy scenario with energy intensity targets, APS_EmT = alternative policy scenario with emission reduction targets, APS_RE = alternative policy scenario with renewable targets, ASEAN = Association of Southeast Asian Nations, BAU = business as usual, TPES = total primary energy supply. Source: Authors’ calculations.
Sustainability 13 02819 g008
Figure 9. Coal Share in Generation Mix in ASEAN. APS = alternative policy scenario, APS_EI = alternative policy scenario with energy intensity targets, APS_EmT = alternative policy scenario with emission reduction targets, APS_RE = alternative policy scenario with renewable targets, ASEAN = Association of Southeast Asian Nations, BAU = business as usual. Source: Authors’ calculations.
Sustainability 13 02819 g009
Figure 10. Gas Share in TPES in ASEAN. APS = alternative policy scenario, APS_EI = alternative policy scenario with energy intensity targets, APS_EmT = alternative policy scenario with emission reduction targets, APS_RE = alternative policy scenario with renewable targets, ASEAN = Association of Southeast Asian Nations, BAU = business as usual, TPES = total primary energy supply. Source: Authors’ calculations.
Sustainability 13 02819 g010
Figure 11. Gas Share in Generation Mix. APS = alternative policy scenario, APS_EI = alternative policy scenario with energy intensity targets, APS_EmT = alternative policy scenario with emission reduction targets, APS_RE = alternative policy scenario with renewable targets, ASEAN = Association of Southeast Asian Nations, BAU = business as usual. Source: Authors’ calculations.
Sustainability 13 02819 g011
Figure 12. Renewables Share in Power Mix. APS = alternative policy scenario, APS_EI = alternative policy scenario with energy intensity targets, APS_EmT = alternative policy scenario with emission reduction targets, APS_RE = alternative policy scenario with renewable targets, ASEAN = Association of Southeast Asian Nations, BAU = business as usual. Source: Authors’ calculations.
Sustainability 13 02819 g012
Figure 13. Share of Wind and Solar in Power Mix. APS = alternative policy scenario, APS_EI = alternative policy scenario with energy intensity targets, APS_EmT = alternative policy scenario with emission reduction targets, APS_RE = alternative policy scenario with renewable targets, ASEAN = Association of Southeast Asian Nations, BAU = business as usual. Source: Authors’ calculations.
Sustainability 13 02819 g013
Figure 14. Emission Reduction in Various Scenarios. APS = alternative policy scenario, APS_EI = alternative policy scenario with energy intensity targets, APS_EmT = alternative policy scenario with emission reduction targets, APS_RE = alternative policy scenario with renewable targets, ASEAN = Association of Southeast Asian Nations, BAU = business as usual. Mt-C = million tonnes of carbon. Source: Authors’ calculations.
Sustainability 13 02819 g014
Figure 15. Emission Reduction in the Power Mix. APS = alternative policy scenario, APS_EI = alternative policy scenario with energy intensity targets, APS_EmT = alternative policy scenario with emission reduction targets, APS_RE = alternative policy scenario with renewable targets, ASEAN = Association of Southeast Asian Nations, BAU = business as usual. Source: Authors’ calculations.
Sustainability 13 02819 g015
Figure 16. Required Investment for Variable Renewable Energy (Solar and Wind) by 2050. APS = alternative policy scenario, APS_EI = alternative policy scenario with energy intensity targets, APS_EmT = alternative policy scenario with emission reduction targets, APS_RE = alternative policy scenario with renewable targets, ASEAN = Association of Southeast Asian Nations, BAU = business as usual. Source: Authors’ calculations.
Sustainability 13 02819 g016
Figure 17. Emissions Standards for Newly Constructed Coal-Fired Power Plants in Selected Countries. Lao PDR = Lao People Democratic Republic, mg/m3 = milligram per cubic metre, NOx—nitrogen oxides, PM = particulate matter, SOx—sulphur oxides. Source: Motokura et al. (2017) [26].
Sustainability 13 02819 g017
Table 1. Other Assumptions of Energy Saving Targets under the APS by AMS.
CountryAssumptions
Brunei Darussalam Electricity: 35% reduction target by 2050
Cambodia Specific fuel efficiency target by 2050 included (coal, oil, gas, biomass industry, 10%; electricity efficiency target, 20%)
Indonesia Sectoral target by 2050 (commercial and residential, 10%; transport, 20%; bioethanol blending increase to 15% from 3–7% in 2010)
Lao PDR Biodiesel: 20% blend from 1–5% in 2010; utilization of biofuels equivalent to 10% of road transport fuels
Malaysia 16% electricity saving by 2050 in industry, commercial, and residential sectors; 16% oil saving in final consumption by 2050; replacement of 5% of diesel in road transport with biodiesel
Myanmar Target saving by 2050 included (transport and residential by 20%; industry, commercial, and others by 10%); replacement of 8% of transport diesel with biodiesel
Philippines 20% saving of oil and electricity by 2050; displacement of 20% of diesel and gasoline with biofuels by 2025
Thailand Energy efficiency targets by 2050 included (transport, 70%; residential, 10%; commercial, 40%; and industry, 20% reduction of final energy demand); biofuels to displace 12.2% of transport energy demand
Viet Nam 20% reduction for all sectors; 10% ethanol blend in gasoline for road transport
AMS = ASEAN Member State, APS = alternative policy scenario, ASEAN = Association of Southeast Asian Nations, Lao PDR = Lao People’s Democratic Republic. Source: Kimura and Phoumin (2019) [23].
Publisher’s Note: MDPI stays neutral with regard to jurisdictional claims in published maps and institutional affiliations.