
Match Experience at the Danish Women’s Soccer National A-Team Matches: An Explorative Study

 and
and
Abstract
1. Introduction
2. Theoretical Framework and Development of Hypotheses
2.1. Consumer Preferences
2.2. Economic Variables
2.3. Quality of Viewing
2.4. Characteristics of the Sporting Contest
3. Data and Analysis
4. Results
5. Discussion
6. Conclusions, Limitations, and Future Research
6.1. Implications
6.2. Limitations and Future Research
Author Contributions
Funding
Institutional Review Board Statement
Informed Consent Statement
Data Availability Statement
Conflicts of Interest
References
- Borland, J.; Macdonald, R. Demand for Sport. Oxf. Rev. Econ. Policy 2003, 19, 478–502. [Google Scholar] [CrossRef]
- Kjær, J.B.; Agergaard, S. Understanding women’s professional soccer: The case of Denmark and Sweden. Soccer Soc. 2013, 14, 816–833. [Google Scholar] [CrossRef]
- Feddersen, A.; Rott, A. Determinants of demand for televised live football: Features of the german national football team. J. Sports Econ. 2011, 12, 352–369. [Google Scholar] [CrossRef]
- Jakobsen, T.G.; Storm, R.K.; Schelde, N. Stadium experience and word-of-mouth: A panel data analysis of national A-team men’s football matches in Denmark, 2013–2017. Manag. Sport Leis. 2020. [Google Scholar] [CrossRef]
- Valenti, M.; Scelles, N.; Morrow, S. Elite sport policies and international sporting success: A panel data analysis of European women’s national football team performance. Eur. Sport Manag. Q. 2019, 20, 300–320. [Google Scholar] [CrossRef]
- Meier, H.E.; Konjer, M.; Leinwather, M. The demand for women’s league soccer in Germany. Eur. Sport Manag. Q. 2016, 16, 1–19. [Google Scholar] [CrossRef]
- Valenti, M.; Scelles, N.; Morrow, S. Women’s football studies: An integrative review. Sport Bus. Manag. Int. J. 2018, 8, 511–528. [Google Scholar] [CrossRef]
- Clemes, M.D.; Brush, G.J.; Collins, M.J. Analysing the professional sport experience: A hierarchical approach. Sport Manag. Rev. 2011, 14, 370–388. [Google Scholar] [CrossRef]
- Valenti, M.; Scelles, N.; Morrow, S. The determinants of stadium attendance in elite women’s football: Evidence from the UEFA Women’s Champions League. Sport Manag. Rev. 2020, 23, 509–520. [Google Scholar] [CrossRef]
- Storm, R.K.; Solberg, H.A. European club capitalism and FIFA redistribution models: An analysis of development patterns in globalised football. Sport Soc. 2018, 21, 1850–1865. [Google Scholar] [CrossRef]
- Nielsen, C.G.; Storm, R.K.; Jakobsen, T.G. The impact of english premier league broadcasts on danish spectator demand: A small league perspective. J. Bus. Econ. 2019, 89, 633–653. [Google Scholar] [CrossRef]
- UEFA. The European Club Footballing Landscape: Club Licensing Benchmarking Report. Financial Year 2018; UEFA: Nyon, Switzerland, 2018; Available online: https://www.footballbenchmark.com/documents/files/UEFAClubLicensingBenchmarkingre-port_2020_FY2018.pdf (accessed on 15 January 2021).
- Solberg, H.A.; Mehus, I. The challenge of attracting football fans to stadia? Int. J. Sport Financ. 2014, 9, 3–19. [Google Scholar]
- Dobson, S.; Goddard, J. The Economics of Football; Cambridge University Press: Cambridge, MA, USA, 2011. [Google Scholar]
- Caruso, R.; Addesa, F.; Di Domizio, M. The Determinants of the TV demand for Soccer: Empirical evidence on italian serie a for the period 2008–2015. J. Sports Econ. 2019, 20, 25–49. [Google Scholar] [CrossRef]
- Watanabe, N.; Soebbing, B. Chinese super league: Attendance, pricing, and team performance. Sport Bus. Manag. Int. J. 2017, 7, 157–174. [Google Scholar] [CrossRef]
- Jones, J.C.H.; Ferguson, D.G. Location and survival in the national hockey league. J. Ind. Econ. 1988, 36, 443. [Google Scholar] [CrossRef]
- Baimbridge, M.; Cameron, S.; Dawson, P. Satellite Television and the demand for football: A whole new ball game? Scott. J. Political Econ. 1996, 43, 317–333. [Google Scholar] [CrossRef]
- Simmons, R. The demand for English league football: A club-level analysis. Appl. Econ. 1996, 28, 139–155. [Google Scholar] [CrossRef]
- Downward, P.; Dawson, A. The Economics of Professional Team Sports; Routledge: Oxfordshire, UK, 2000. [Google Scholar]
- Borland, J.; Lye, J. Attendance at Australian Rules football: A panel study. Appl. Econ. 1992, 24, 1053–1058. [Google Scholar] [CrossRef]
- Pawlowski, T.; Anders, C. Stadium attendance in German professional football—The (un)importance of uncertainty of outcome reconsidered. Appl. Econ. Lett. 2012, 19, 1553–1556. [Google Scholar] [CrossRef]
- Sumino, M.; Harada, M. Affective experience of J. League fans: The relationship between affective experience, team loyalty and intention to attend. Manag. Leis. 2004, 9, 181–192. [Google Scholar] [CrossRef]
- Tainsky, S.; Kerwin, S.; Xu, J.; Zhou, Y. Will the real fans please remain seated? Gender and television ratings for pre-game and game broadcasts. Sport Manag. Rev. 2014, 17, 190–204. [Google Scholar] [CrossRef]
- Jones, K.W. Female fandom: Identity, sexism, and men’s professional football in England. Sociol. Sport J. 2008, 25, 516–537. [Google Scholar] [CrossRef]
- Meier, H.E.; Strauss, B.; Riedl, D. Feminization of sport audiences and fans? Evidence from the German men’s national soccer team. Int. Rev. Sociol. Sport 2015, 52, 712–733. [Google Scholar] [CrossRef]
- Montgomery, S.S.; Robinson, M.D. Women’s attendance at sports events. In Handbook on the Economics of Women in Sports; Leeds, E.M., Leeds, M.A., Eds.; Edward Elgar Publishing: London, UK; New York, NY, USA, 2013; pp. 21–39. [Google Scholar]
- Meier, H.E.; Leinwather, M. Women as armchair audience? Evidence from German national team football. Sociol. Sport J. 2012, 29, 365–384. [Google Scholar] [CrossRef]
- Desbordes, M.; Ohl, F.; Tribou, G. Marketing du Sport; Economica: Paris, France, 2004. [Google Scholar]
- Hambrick, D.C.; Mason, P.A. Upper echelons: The organization as a reflection of its top managers. Acad. Manag. Rev. 1984, 9, 193. [Google Scholar] [CrossRef]
- Young, G.J.; Charns, M.P.; Shortell, S.M. Top manager and network effects on the adoption of innovative management practices: A study of TQM in a public hospital system. Strateg. Manag. J. 2001, 22, 935–951. [Google Scholar] [CrossRef]
- Naranjo-Gil, D.; Maas, V.S.; Hartmann, F.G.H. How CFOs determine management accounting innovation: An examination of direct and indirect effects. Eur. Account. Rev. 2009, 18, 667–695. [Google Scholar] [CrossRef]
- UEFA. Women’s Football across the National Associations. 2017. Available online: https://www.uefa.com/MultimediaFiles/Download/OfficialDocument/uefaorg/Women’sfootball/02/51/60/57/2516057_DOWNLOAD.pdf (accessed on 30 January 2021).
- FIFA. Women’s Football: For the Game. For the World. Available online: https://resources.fifa.com/image/upload/fifa-women-s-football-survey-2522649.pdf?cloudid=emtgxvp0ibnebltlvi3b (accessed on 30 January 2021).
- Lera-López, F.; Rapun, M.; Suarez, M.J. Determinants of individual consumption on sports attendance in Spain. Int. J. Sport Financ. 2011, 6, 204–221. [Google Scholar]
- Jennett, N. Attendances, uncertainty of outcome and policy in scottish league football. Scott. J. Political Econ. 1984, 31, 176–198. [Google Scholar] [CrossRef]
- Demmert, H. The Economics of Professional Team Sports; Lexington Books: Lexington, MA, USA, 1973. [Google Scholar]
- Falter, J.-M.; Perignon, C. Demand for football and intramatch winning probability: An essay on the glorious uncertainty of sports. Appl. Econ. 2000, 32, 1757–1765. [Google Scholar] [CrossRef]
- García, J.; Rodríguez, P. Sports attendance: A survey of the Literature 1973–2007. Riv. Dirit. Econ. Sport 2009, 5, 112–151. [Google Scholar]
- Cairns, J. The demand for professional team sports. Br. Rev. Econ. Issues 1990, 12, 1–20. [Google Scholar]
- Ferreira, M.; Bravo, G. A multilevel model analysis of professional soccer attendance in Chile 1990–2002. Int. J. Sports Mark. Spons. 2007, 8, 49–66. [Google Scholar] [CrossRef]
- Forrest, D.; Simmons, R.; Feehan, P. A spatial cross-sectional analysis of elasticity of demand for soccer. Scott. J. Political Econ. 2002, 49, 336–356. [Google Scholar] [CrossRef]
- García, J.; Rodriguez, P. The determinants of football match attendance revisited: Empirical evidence from the Spanish football league. J. Sports Econ. 2002, 3, 18–38. [Google Scholar] [CrossRef]
- Forrest, D.; Simmons, R. New issues in attendance demand. The case of the English football league. J. Sports Econom. 2006, 7, 247–266. [Google Scholar] [CrossRef]
- Buraimo, B.; Forrest, D.; Simmons, R. Insights for clubs from modelling match attendance in football. J. Oper. Res. Soc. 2009, 60, 147–155. [Google Scholar] [CrossRef]
- Forrest, D.; Simmons, R.; Szymanski, S. Broadcasting, attendance and the inefficiency of cartels. Rev. Ind. Organ. 2004, 24, 243–265. [Google Scholar] [CrossRef]
- Kringstad, M.; Solberg, H.A.; Jakobsen, T.G. Does live broadcasting reduce stadium attendance? The case of Norwegian football. Sport Bus. Manag. Int. J. 2018, 8, 67–81. [Google Scholar] [CrossRef]
- Kringstad, M.; Gerrard, B. The concepts competitive balance and uncertainty of outcome. In The Economics and Management of Mega Athletic Events: Olympic Games, Professional Sports and Other Essays; Papanikos, G.T., Ed.; ATINER: Anthia, Greece, 2004; pp. 115–130. [Google Scholar]
- Rottenberg, S. The Baseball Players’ Labor Market. J. Political Econ. 1956, 64, 242–258. [Google Scholar] [CrossRef]
- Kringstad, M.; Gerrard, B. Beyond competitive balance. In International Perspectives on the Management of Sport; Parent, M.M., Slack, T., Eds.; Butterworth-Heinemann: Burlington, MA, USA, 2007; pp. 149–172. [Google Scholar]
- Cairns, J.; Jennett, N.; Sloane, P. The economics of professional team sports: A survey of theory and evidence. J. Econ. Stud. 1986, 13, 3–80. [Google Scholar] [CrossRef]
- Buraimo, B. Stadium attendance and television audience demand in English league football. Manag. Decis. Econ. 2008, 29, 513–523. [Google Scholar] [CrossRef]
- Scelles, N.; Durand, C.; Bonnal, L.; Goyeau, D.; Andreff, W. Competitive balance versus competitive intensity before a match: Is one of these two concepts more relevant in explaining attendance? The case of the French football Ligue 1 over the period 2008–2011. Appl. Econ. 2013, 45, 4184–4192. [Google Scholar] [CrossRef]
- Schreyer, D.; Schmidt, S.L.; Torgler, B. Football spectator no-show behavior. J. Sports Econom. 2019, 20, 580–602. [Google Scholar] [CrossRef]
- Steenbergen, M.R.; Jones, B.S. Modeling multilevel data structures. Am. J. Political Sci. 2002, 46, 218. [Google Scholar] [CrossRef]
- Stegmueller, D. How many countries for multilevel modeling? A comparison of frequentist and bayesian approaches. Am. J. Political Sci. 2013, 57, 748–761. [Google Scholar] [CrossRef]
- Hox, J.J. Multilevel Analysis: Techniques and Applications; Routledge: New York, NY, USA, 2010. [Google Scholar]
- Mehmetoglu, M.; Jakobsen, T.G. Applied Statistics Using Stata: A Guide for the Social Sciences; Sage Publications: Los Angeles, CA, USA, 2017. [Google Scholar]
- Ely, J.; Frankel, A.; Kamenica, E. Suspense and surprise. J. Political Econ. 2015, 123, 215–260. [Google Scholar] [CrossRef]
- Pawlowski, T.; Nalbantis, G.; Coates, D. Perceived game uncertainty, suspense and the demand for sport. Econ. Inq. 2018, 56, 173–192. [Google Scholar] [CrossRef]
- Buraimo, B.; Forrest, D.; McHale, I.G.; Tena, J. Unscripted drama: Soccer audience response to suspense, surprise, and shock. Econ. Inq. 2019, 58, 881–896. [Google Scholar] [CrossRef]
- Trail, G.T.; Robinson, M.J.; Kim, Y.K. Sport consumer behavior: A test for group differences on structural constraints. Sport Mark. Q. 2008, 17, 190–200. [Google Scholar]


| Year | Date | Opponent | Result | Attendance | City | Mean Y | Type |
|---|---|---|---|---|---|---|---|
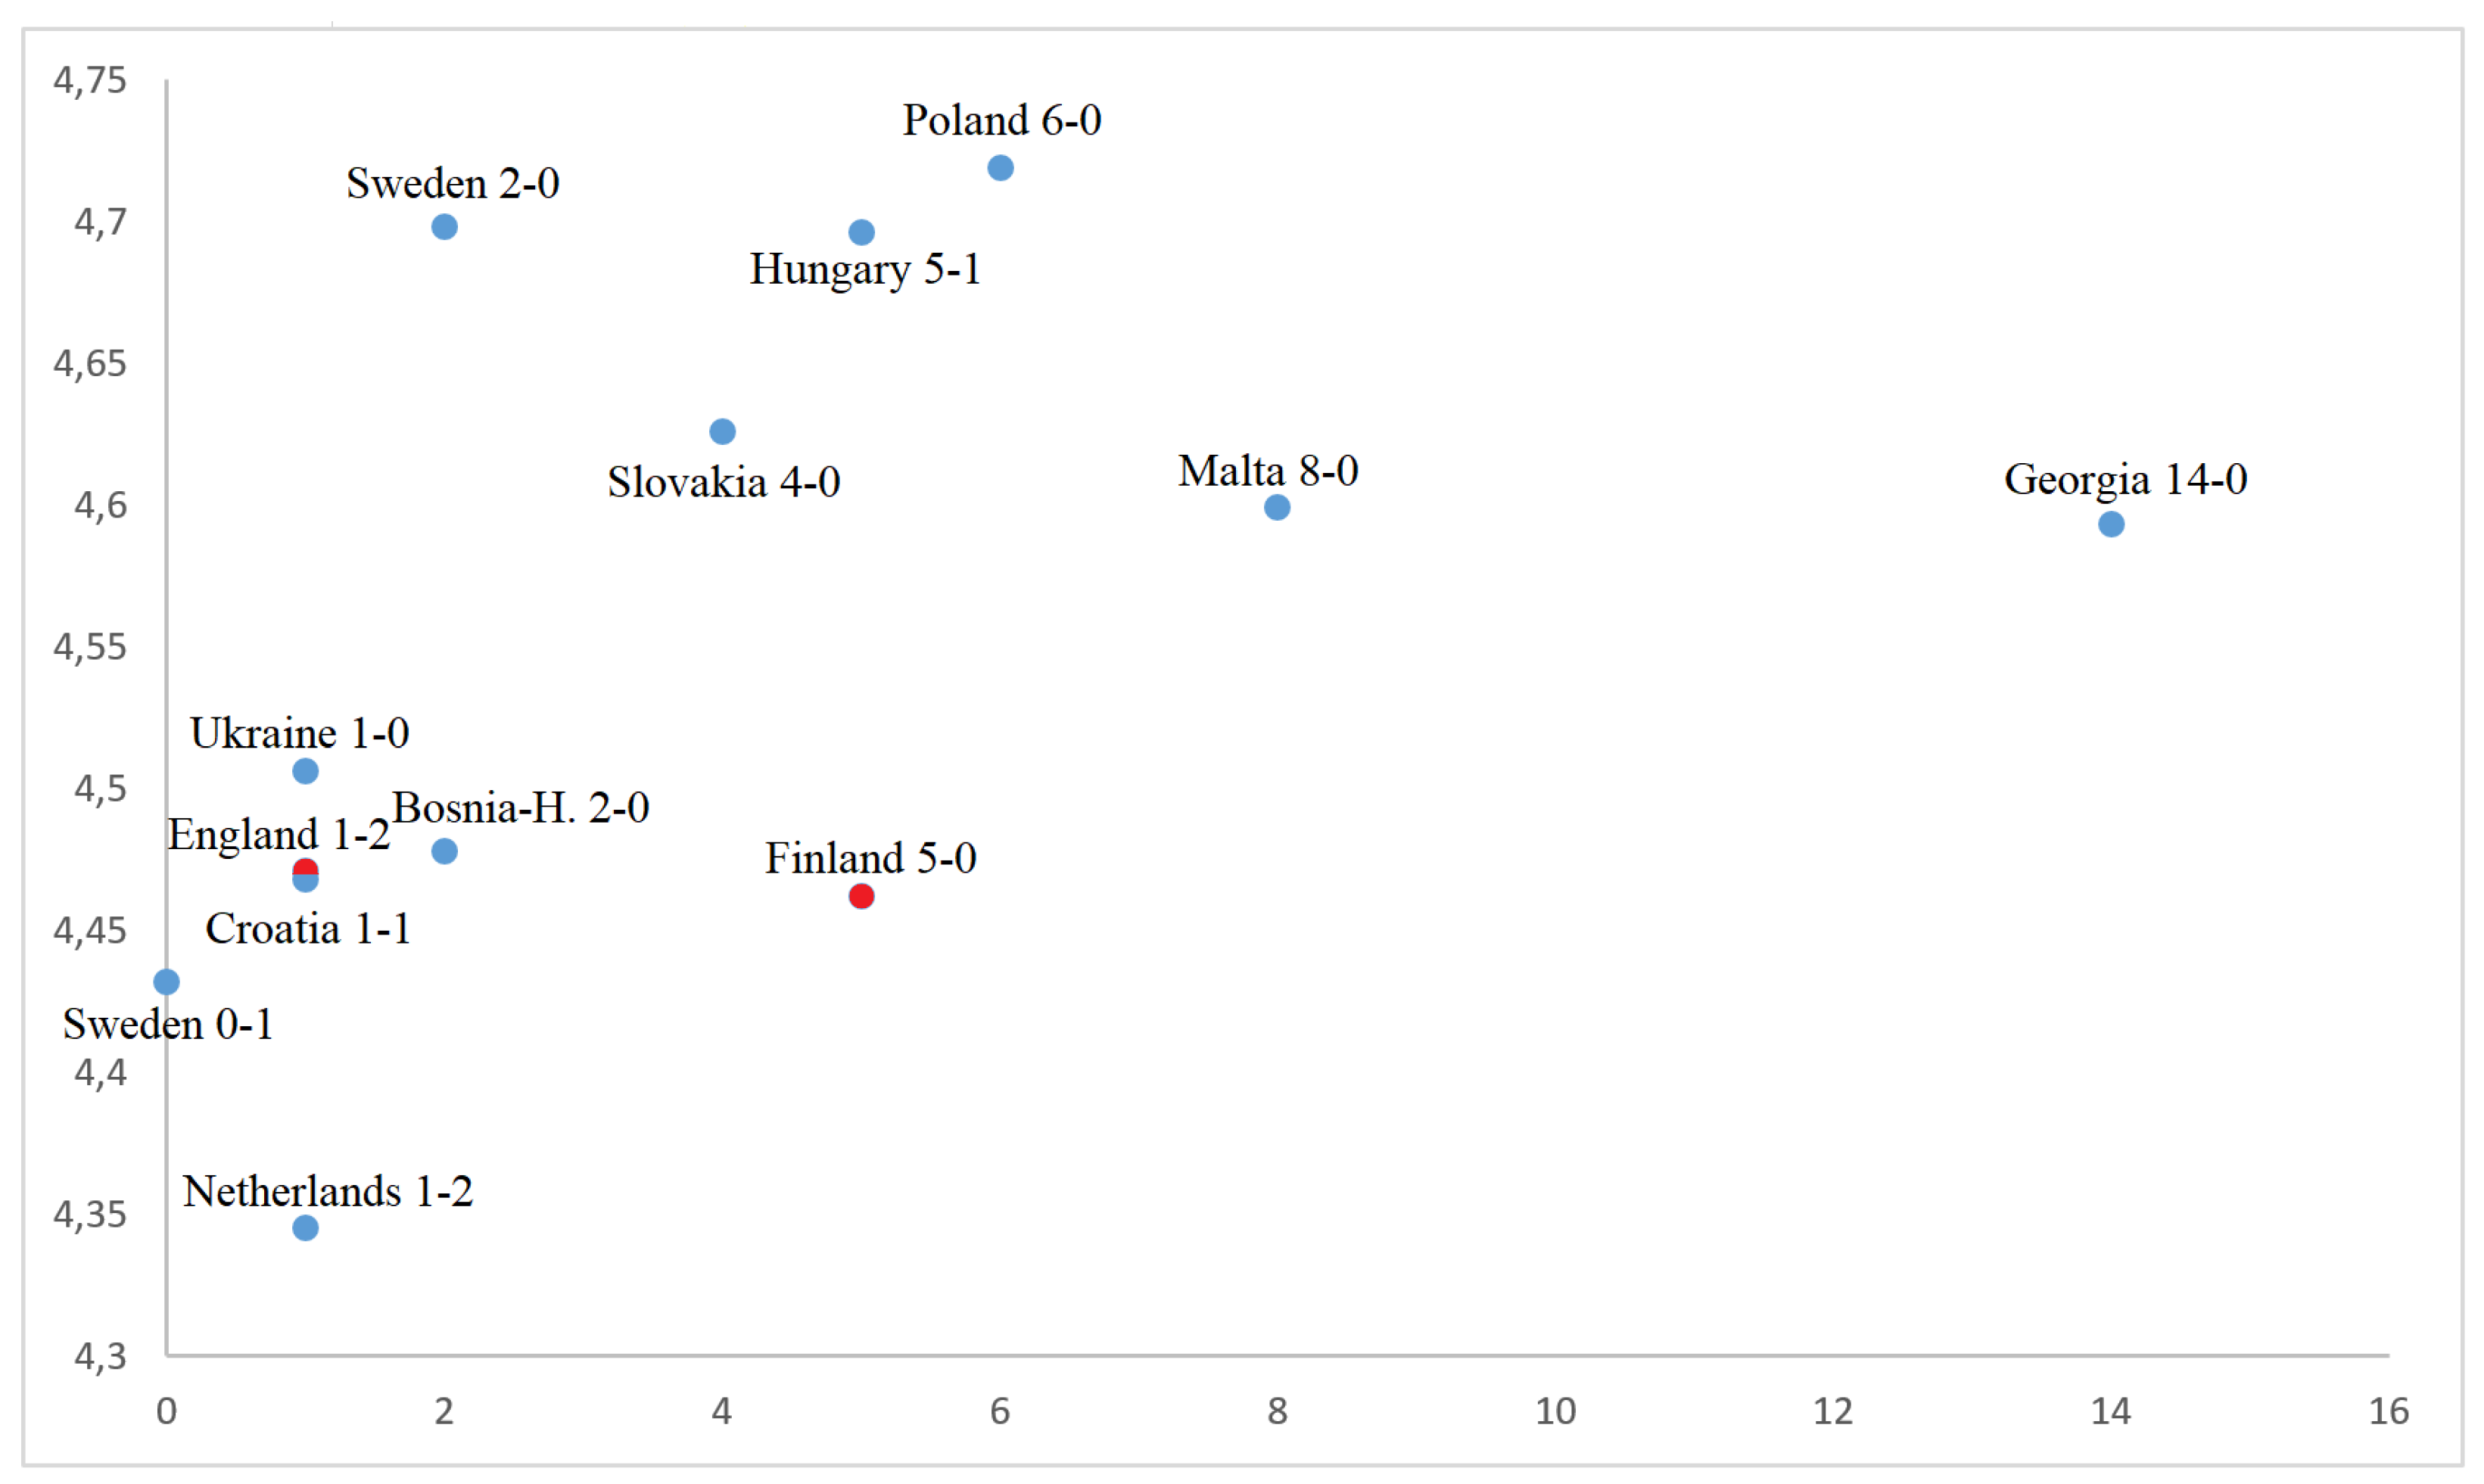
| 2016 | 2/6 | Slovakia | 4–0 | 3412 | Viborg | 4.636 | Euro17Q |
| 2016 | 7/6 | Poland | 6–0 | 4611 | Viborg | 4.719 | Euro17Q |
| 2016 | 20/9 | Sweden | 2–0 | 7432 | Viborg | 4.698 | Euro17Q |
| 2017 | 11/4 | Finland | 5–0 | 3312 | Slagelse | 4.462 | Friendly |
| 2017 | 1/7 | England | 1–2 | 2964 | Gladsaxe | 4.471 | Friendly |
| 2018 | 9/4 | Ukraine | 1–0 | 5475 | Viborg | 4.506 | WC19Q |
| 2018 | 12/6 | Hungary | 5–1 | 7028 | Viborg | 4.696 | WC19Q |
| 2018 | 30/8 | Croatia | 1–1 | 7045 | Viborg | 4.468 | WC19Q |
| 2018 | 4/9 | Sweden | 0–1 | 8182 | Viborg | 4.432 | WC19Q |
| 2018 | 9/10 | Netherlands | 1–2 | 5374 | Viborg | 4.345 | WC19PO |
| 2019 | 29/8 | Malta | 8–0 | 3890 | Viborg | 4.599 | Euro22Q |
| 2019 | 4/10 | Bosnia | 2–0 | 4552 | Viborg | 4.478 | Euro22Q |
| 2019 | 12/11 | Georgia | 14–0 | 3085 | Viborg | 4.593 | Euro22Q |
| Year | Opponent | Spectators | Unique Purchases | Mean Tickets Per Purchase | Responses | Response in % | Responses as % of Spectators |
|---|---|---|---|---|---|---|---|
| 2016 | Slovakia | 3412 | 443 | 7.7 | 181 | 41% | 5% |
| 2016 | Poland | 4611 | 494 | 9.3 | 217 | 44% | 5% |
| 2016 | Sweden | 7432 | 932 | 8.0 | 379 | 41% | 5% |
| 2017 | Finland | 3312 | 1171 | 2.8 | 435 | 37% | 13% |
| 2017 | England | 2964 | 677 | 4.4 | 281 | 42% | 9% |
| 2018 | Ukraine | 5475 | 926 | 5.9 | 425 | 46% | 8% |
| 2018 | Hungary | 7028 | 1255 | 5.6 | 420 | 33% | 6% |
| 2018 | Croatia | 7045 | 1586 | 4.4 | 612 | 39% | 9% |
| 2018 | Sweden | 8182 | 1578 | 5.2 | 526 | 33% | 6% |
| 2018 | Netherl. | 5374 | 1152 | 4.7 | 414 | 36% | 8% |
| 2019 | Malta | 3890 | 682 | 5.7 | 270 | 40% | 7% |
| 2019 | Bosnia | 4552 | 837 | 5.4 | 309 | 37% | 7% |
| 2019 | Georgia | 3085 | 544 | 5.7 | 183 | 34% | 6% |
| Total | 66,362 | 12,277 | 5.8 | 4652 | 39% | 7% |
| Variable | N | Mean | Std. Dev. | Min. | Max. |
|---|---|---|---|---|---|
| Overall experience | 4010 | 4.535 | 0.601 | 1 | 5 |
| Woman | 4010 | 0.525 | 0.499 | 0 | 1 |
| Region | 4010 | 1 | 6 | ||
| North Jutland | (359) | 0.090 | 0.286 | ||
| East–and Central Jutland | (2356) | 0.588 | 0.492 | ||
| South–and West Jutland | (377) | 0.094 | 0.292 | ||
| Funen and the Islands | (144) | 0.036 | 0.186 | ||
| Zealand | (463) | 0.115 | 0.320 | ||
| Greater Copenhagen | (311) | 0.078 | 0.268 | ||
| Age categories | 4010 | 1 | 5 | ||
| 0–18 | (135) | 0.034 | 0.181 | ||
| 19–30 | (397) | 0.099 | 0.299 | ||
| 31–45 | (1617) | 0.403 | 0.491 | ||
| 46–60 | (1371) | 0.342 | 0.474 | ||
| 61+ | (489) | 0.122 | 0.327 | ||
| With children | 4010 | 0.473 | 0.499 | 0 | 1 |
| Previous matches | 4010 | 1.850 | 0.874 | 1 | 3 |
| Result | 13 | 1 | 3 | ||
| Loss | 3 | 0.231 | 0.439 | ||
| Draw | 1 | 0.077 | 0.277 | ||
| Win | 9 | 0.692 | 0.480 | ||
| Home goals | 13 | 3.846 | 3.891 | 0 | 14 |
| Away goals | 13 | 0.538 | 0.776 | 0 | 2 |
| FIFA ranking Denmark | 13 | 15.692 | 2.562 | 13 | 20 |
| Time of day | 13 | 1 | 3 | ||
| 17:00 | 2 | 0.154 | 0.376 | ||
| 18:00 | 5 | 0.385 | 0.506 | ||
| 19:00 | 6 | 0.462 | 0.519 |
| Variables | Odds Ratios | Rob. Std.er. | p-Value |
|---|---|---|---|
| Woman | 1.535 | 0.063 | 0.000 |
| North Jutland | 1.588 | 0.229 | 0.043 |
| E & C Jutland | 1.495 | 0.168 | 0.016 |
| S & W Jutland | 1.640 | 0.166 | 0.003 |
| Funen & Islands | 1.847 | 0.203 | 0.003 |
| Zealand | 0.856 | 0.145 | 0.285 |
| 19–30 | 0.792 | 0.188 | 0.217 |
| 31–45 | 0.846 | 0.190 | 0.379 |
| 46–60 | 0.857 | 0.160 | 0.335 |
| 61+ | 1.092 | 0.191 | 0.646 |
| With children | 1.067 | 0.093 | 0.484 |
| Prev. match att. | 0.983 | 0.054 | 0.743 |
| Level-2 | |||
| Draw | 0.944 | 0.356 | 0.872 |
| Win | 2.415 | 0.439 | 0.045 |
| Home goals | 1.037 | 0.011 | 0.001 |
| Away goals | 1.380 | 0.238 | 0.176 |
| FIFA DK | 1.011 | 0.047 | 0.811 |
| 17:00 | 0.719 | 0.352 | 0.349 |
| 18:00 | 0.600 | 0.226 | 0.024 |
| Cut points | |||
| 1 | −5.100 | 1.094 | |
| 2 | −3.645 | 1.062 | |
| 3 | −2.250 | 1.080 | |
| 4 | 0.875 | 1.022 | |
| N | 4010 | ||
| Clusters | 13 | ||
| LL | −3203.507 | ||
| Variables | Model 1 | Model 2 | Model 3 | Model 4 | Model 5 |
|---|---|---|---|---|---|
| Woman | 1.498 *** | 1.496 *** | 1.495 *** | 1.497 *** | 1.496 *** |
| North Jutland | 1.238 | 1.297 | 1.257 | 1.391 | 1.378 |
| E and C Jutland | 1.172 | 1.232 | 1.189 | 1.312 | 1.300 |
| S and W Jutland | 1.282 | 1.348 | 1.303 | 1.438 * | 1.425 * |
| Funen and Islands | 1.494 * | 1.563 * | 1.515 * | 1.661 ** | 1.643 ** |
| Zealand | 1.035 | 1.085 | 1.061 | 1.131 | 1.100 |
| 19–30 | 0.797 | 0.797 | 0.797 | 0.794 | 0.795 |
| 31–45 | 0.834 | 0.836 | 0.835 | 0.835 | 0.835 |
| 46–60 | 0.845 | 0.844 | 0.845 | 0.842 | 0.843 |
| 61+ | 1.082 | 1.082 | 1.083 | 1.082 | 1.083 |
| With children | 1.074 | 1.073 | 1.075 | 1.074 | 1.074 |
| Prev. match att. | 0.975 | 0.970 | 0.974 | 1.081 | 0.977 |
| Level-2 | |||||
| Draw | 1.086 | --- | --- | --- | --- |
| Win | 1.857 *** | ---- | --- | --- | --- |
| Home goals | --- | 1.058 ** | --- | --- | --- |
| Away goals | --- | --- | 0.764 * | --- | --- |
| FIFA DK | --- | --- | --- | 1.081 * | --- |
| 17:00 | --- | --- | --- | --- | 0.565 * |
| 18:00 | --- | --- | --- | --- | 0.822 |
| Variance | |||||
| Level-2 | 0.083 | 0.116 | 0.121 | 0.123 | 0.121 |
| Level-1 N | 4010 | 4010 | 4010 | 4010 | 4010 |
| Level-2 N | 13 | 13 | 13 | 13 | 13 |
| Log Likelihood | −3203.427 | −3205.303 | −3205.483 | −3205.648 | −3205.566 |
| McKelvey R2 | |||||
| Full model | 0.058 | 0.057 | 0.058 | 0.058 | 0.058 |
| Fixed slopes | 0.039 | 0.025 | 0.027 | 0.023 | 0.024 |
| Hypothesis | Expected Sign | Actual Sign | Significance |
|---|---|---|---|
| Spectator-Level | |||
| H1: Previous Matches | + | – | Not significant |
| H2: Women | + | + | <0.01 |
| H3: Age | – | –(except for 61+) | Not significant |
| H4: Bringing children | + | + | Not significant |
| H5: Price of attending | – | – | Significant for Funen & Islands at the 10% level (models 1–3) and at the 5% level (models 4 and 5) |
| Match-level | |||
| H6: Weather conditions | No effect, not included in final models. | ||
| H7: Time of day | – | –(only for 17.00, not 18.00) | <0.10 |
| H8a: Sporting success | + | + | <0.01 (Win) <0.05 (Home goals) <0.10 (Away goals) |
| H8b: Sporting quality (ex-ante) | – | + | <0.10 (FIFA DK) |
| H8c: Match significance | + | + | Strong indications of a positive effect |
| H8d: Derby | + | + | Strong indications of a positive effect |
Publisher’s Note: MDPI stays neutral with regard to jurisdictional claims in published maps and institutional affiliations. |
© 2021 by the authors. Licensee MDPI, Basel, Switzerland. This article is an open access article distributed under the terms and conditions of the Creative Commons Attribution (CC BY) license (http://creativecommons.org/licenses/by/4.0/).
Share and Cite
Kringstad, M.; Olsen, T.-E.; Jakobsen, T.G.; Storm, R.K.; Schelde, N. Match Experience at the Danish Women’s Soccer National A-Team Matches: An Explorative Study. Sustainability 2021, 13, 2642. https://doi.org/10.3390/su13052642
Kringstad M, Olsen T-E, Jakobsen TG, Storm RK, Schelde N. Match Experience at the Danish Women’s Soccer National A-Team Matches: An Explorative Study. Sustainability. 2021; 13(5):2642. https://doi.org/10.3390/su13052642
Chicago/Turabian StyleKringstad, Morten, Tor-Eirik Olsen, Tor Georg Jakobsen, Rasmus K. Storm, and Nikolaj Schelde. 2021. "Match Experience at the Danish Women’s Soccer National A-Team Matches: An Explorative Study" Sustainability 13, no. 5: 2642. https://doi.org/10.3390/su13052642
APA StyleKringstad, M., Olsen, T.-E., Jakobsen, T. G., Storm, R. K., & Schelde, N. (2021). Match Experience at the Danish Women’s Soccer National A-Team Matches: An Explorative Study. Sustainability, 13(5), 2642. https://doi.org/10.3390/su13052642