Article

Factors Allowing Users to Influence the Environmental Performance of Their T-Shirt

Empa, Swiss Federal Laboratories for Materials Science and Technology, Technology and Society Laboratory, 9014 St. Gallen, Switzerland
*
Author to whom correspondence should be addressed.
Sustainability 2021, 13(5), 2498; https://doi.org/10.3390/su13052498
Submission received: 28 January 2021 / Revised: 19 February 2021 / Accepted: 22 February 2021 / Published: 25 February 2021

Abstract

:
Cotton t-shirts are a basic clothing item that everyone possesses. To date, no studies have taken into account the consumers’ perspective, even though they can play an important role regarding the actual environmental impact of their clothing items. Therefore, a life cycle assessment study was performed in order to inform the public about the environmental impacts of a typical cotton t-shirt and the relevance of consumer behavior (i.e., washing and drying) on the overall impacts along the entire life cycle of such a t-shirt. The aim was to provide hints, allowing users to reduce the impacts of their t-shirts. While the production phase was based on global data, the use phase focused on Switzerland as the study was established in the context of an exhibition in the Textile Museum in St. Gallen (Switzerland). With this study, it was found that users have various choices in order to make their t-shirt more sustainable. Wearing the t-shirt throughout its entire life expectancy was found to be the most important factor influencing the overall environmental performance of such a clothing item. The relevance of filling the washing machine to maximum capacity, washing at a lower temperature, or using a tumbler was also illustrated. In addition, choosing materials other than cotton or choosing textiles labelled for lower environmental impacts during production could further improve the environmental performance of t-shirts.

1. Introduction

The production of clothing items is known to use large quantities of non-renewable resources and to have high environmental impacts [1]. These impacts not only happen during the production phase of garments, but throughout their entire life cycle including during the use phase (e.g., washing and drying). The impacts are continuously increasing because of the rise of fast fashion, which encourages consumers to buy more clothes and discard them before their true end of life [1].
The life cycle assessment (LCA) methodology is a well-established, internationally standardized, comprehensive, and rigorous methodology used to evaluate potential environmental consequences of all the material, water, and energy flows along the complete life cycle of a product and/or a service [2]. According to the ISO 14040 and 14044 standards, an LCA consists of four different phases, which are (1) the goal and scope definition; (2) the inventory analysis; (3) the impact assessment; and (4) the interpretation of the results [3,4]. In the goal and scope, the system boundaries and the functional unit are described. The latter is the basis for defining the emissions and extractions to be included in the model. The inventory analysis consists of quantifying the emissions to the environment and the extraction of raw material to satisfy the need of the functional unit. In the impact assessment phase, the environmental impacts of the emissions quantified in the previous step are evaluated. Finally, in the last phase, the results are interpreted and key parameters of the model identified through sensitivity studies [5].
LCA has already been widely used to evaluate the impacts of the textile industry and clothing items. Many studies have focused on the level of fibers and yarn production including materials such as cotton, silk, wool, jute, kenaf, cellulose fibers, polyester, nylon, acryl, elastane, hemp, and flax [6,7,8,9,10,11,12,13,14,15,16,17,18,19]. For example, one study provided a comparison of woven textiles made of various fibers (cotton, polyester, nylon, acryl, and elastane) considering Ecocost, carbon footprint, cumulative-energy-demand, and ReCipe as evaluation methods [18]. Other studies have focused on the LCA of garments including jeans [20,21], woolen garments [22,23], cotton woven shirt [24], and silk dresses [25]. Another garment that is regularly found in the literature is the t-shirt. For instance, Baydar et al. (2015) compared the environmental impacts of conventional cotton t-shirts with “Eco” cotton t-shirts made in Turkey [26]. Bech et al. (2019) looked at the climate change impact of merino wool t-shirts with a use-oriented product/service system (PSS) business model and compared it with traditional synthetic t-shirts used by the British Ministry of Defense [27]. Zamani et al. (2017) investigated the effect of clothing libraries (collaborative consumption) compared to the usual consumption of jeans, t-shirts, and dresses [28]. Farrant et al. (2010) performed a LCA to compare the impacts of two modes of waste management: incineration and reuse through second hand shops [29]. They assessed a cotton t-shirt and a pair of polyester/cotton trousers. Roos and Peters (2015) focused on toxic environmental impacts by looking more closely at the wet treatment of a white cotton t-shirt [30], and Steinberger et al. (2009) assessed the life cycle of a cotton t-shirt and a polyester jacket produced in China and India, and consumed in Germany [31]. Another study from van der Velden and Vogtländer (2017) looked at the socio-economic costs of a pair of jeans and cotton t-shirts for three different production chains: USA–Europe, India–Bangladesh, and China/India–Bangladesh [32]. Zhang et al. (2015) conducted a LCA of a cotton t-shirt produced and used in China [33]. Finally, two studies conducted a LCA of a nanosilver treated t-shirt having antibacterial properties [34,35]. Further LCA studies of t-shirts can be found outside the peer-reviewed literature such as the study reports from Lehmann et al. (2019) and Sandin et al. (2019). The former conducted a LCA of a cotton t-shirt worn in Germany and had the objective to provide information regarding the effects of current laundry care practices in order to optimize laundry product development and give feedback to sustainability initiatives [36]. The latter study aimed to understand the current environmental impact of Swedish clothing consumption via a LCA and evaluated six types of clothing items including a t-shirt [37].
It has been shown that one of the most relevant life cycle stages of clothing items in terms of environmental impact is the use phase, and that consumer behavior can contribute significantly to its reduction [31,38,39,40,41]. However, all the studies that included the use phase had different goals and scopes. For example, two publications studied the washing behavior depending on fiber types and consumer habits in clothing maintenance [38,39] but did not apply a LCA. Another analyzed the life cycle inventory (LCI) of different use phase alternatives in Germany (i.e., air-drying vs. tumbler, washing temperatures (40 °C vs. 60 °C), and machine efficiency rating) of a cotton t-shirt and a polyester jacket. This study addressed carbon dioxide (CO2), nitrogen oxides (NOx), particulates (PMs), and sulfur dioxide (SO2) emissions [31]. As a last example, Wiedemann et al. (2020) looked at a woolen sweater and assessed its global warming potential, water stress, and use of fossil fuel energy [23].
To sum up, the information about the environmental impacts of a cotton t-shirt and that of the use phase is scattered. In addition, the water footprint was not considered most of the time, even though it is known as being a relevant impact in the textile industry. None of these studies comprehensively covered the production and use phase of a cotton t-shirt. Therefore, there is a need for a study consistently analyzing the life-cycle of a t-shirt and providing comparable results in order to integrate all the opportunities for consumers to reduce their environmental impact.
Therefore, the goal of the on-hand manuscript is to inform the public (i) about the environmental impacts of a (globally produced) cotton t-shirts and (ii) about the influence and the relevance of consumer behavior including washing (temperature and loading of the washing machine), drying (air-drying and tumbler use), and utilizing the lifetime of the t-shirt, and (iii) provide hints as to how to reduce those impacts. Last but not least, we also elaborated a LCA to compare various textile fiber materials in order to illustrate how the consumer can furthermore influence the environmental impact by selecting the material of a t-shirt. The use phase focused on Switzerland as the study was established in the context of an exhibition in the Textile Museum in St. Gallen (Switzerland). For this, the on-hand manuscript first clarifies the goal and scope of the study in the Materials and Methods Section. Next, the results are presented in two parts: first, the general overview of the life cycle impact assessment of a t-shirt is shown, and second, the influence that consumers can have on their t-shirt is presented. Finally, these results are discussed and the overall conclusions are summarized in the final section.

2. Materials and Methods

In order to provide the consumer with knowledge and advice on how to reduce the environmental impacts of their cotton t-shirts, a simplified LCA study was established. All the calculations were made in a simplified way by directly using the life cycle impact assessment (LCIA) results of the various datasets from the recycled-content (cut-off) model of the ecoinvent database version 3.6 [42]. The LCIA results from the applied ecoinvent datasets (i.e., the present study’s background data) were combined and linked with the related key characteristics of the here examined cotton t-shirt (i.e., the foreground system) with Microsoft Excel.
The functional unit for these calculations was “a knitted cotton t-shirt of 154 g (representing an average weight) having a lifespan of 44 washing cycles”. The number of washing cycles was based on the work of Lehmann et al. (2019) [36]. As the on-hand study aims to provide consumers with a first comprehensible idea of the potential environmental impacts of their t-shirts, four different impact categories were investigated. These are: (1) the global warming potential (hereafter carbon footprint) in kg CO2-equivalents (CO2-eq) according to the IPCC (Intergovernmental Panel on Climate Change) method [43]; (2) the non-renewable cumulative energy demand (nr-CED) in MJ-eq according to the VDI (Verein Deutsche Ingenieure) definition [44]; (3) the water depletion in m3 water-eq according to the AWARE methodology [45]; and (4) the overall environmental impact in ecopoints according to the Swiss method of ecological scarcity [46]. The four applied categories were chosen according to their relevance and their general acceptance in Switzerland (see [47]) as well as within the textile industry.

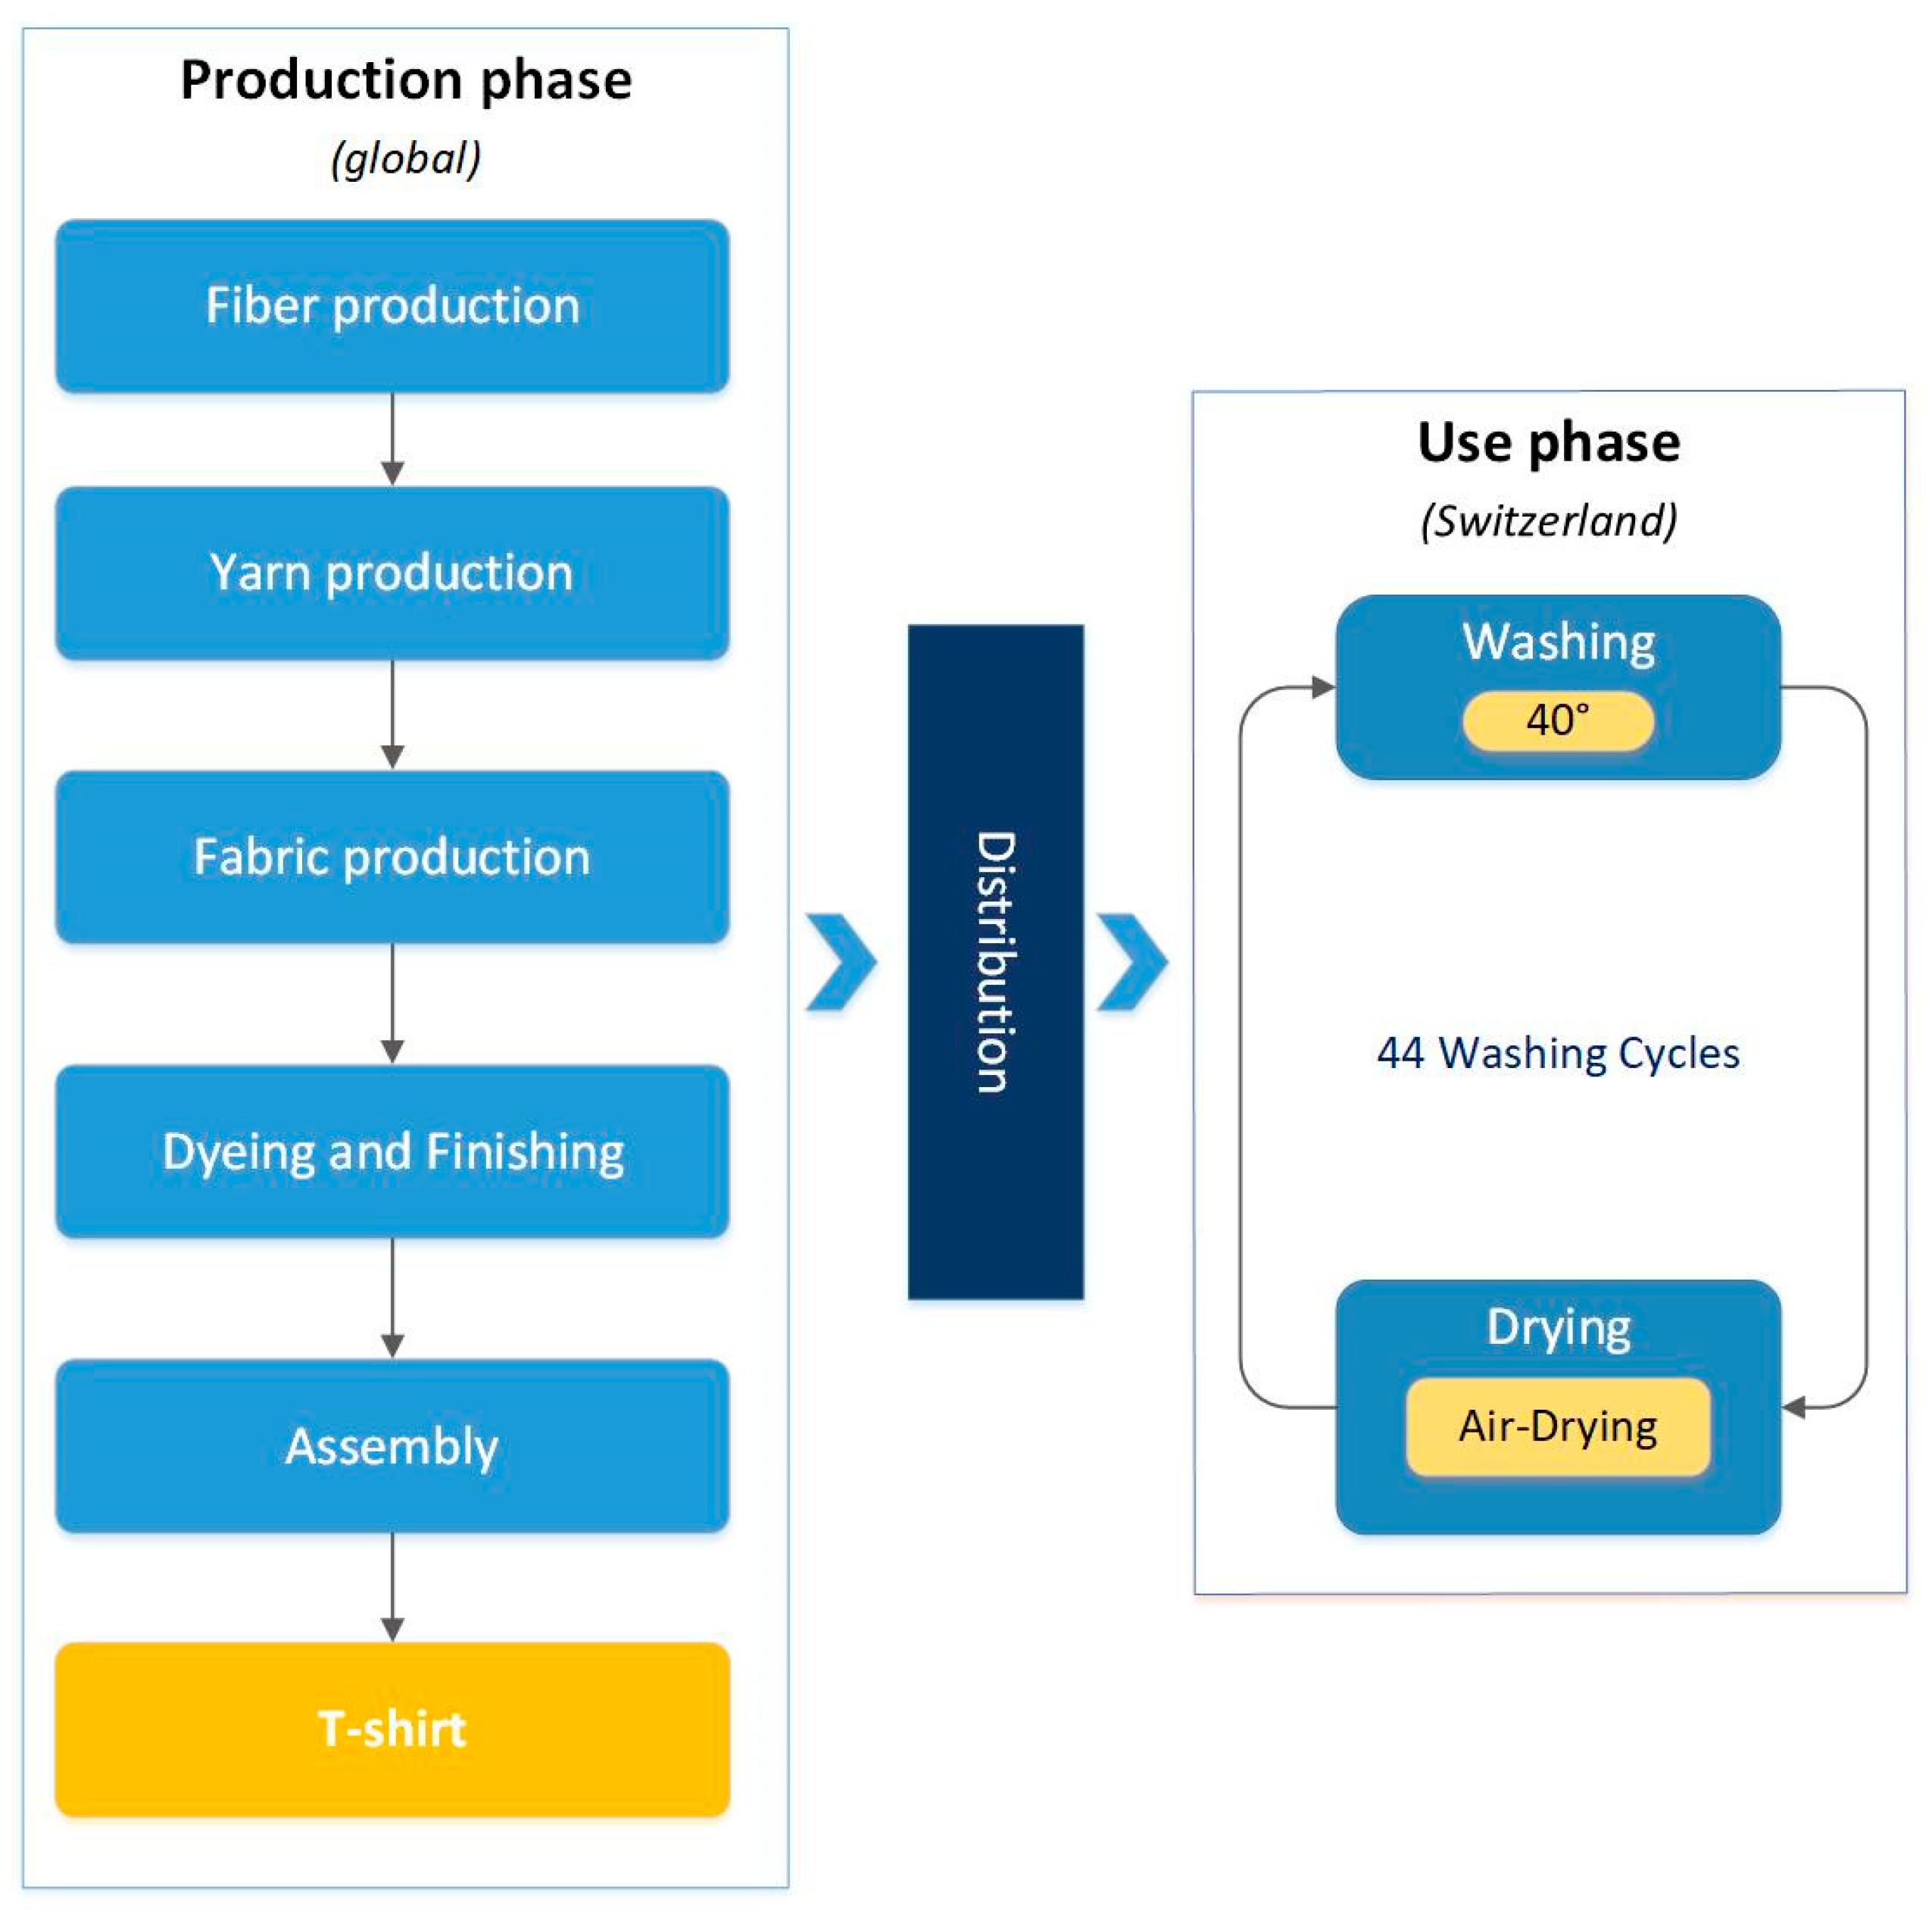
2.1. System Boundaries

The system boundaries of the present study can be seen in Figure 1. Within the production phase of the t-shirt, the following five steps were distinguished: (1) fiber production; (2) yarn production; (3) fabric production; (4) dyeing and finishing; and (5) assembly. These are typical production steps in the textile industry for clothing items as already shown elsewhere (e.g., [3,12]).
As most t-shirts are produced in a globally dispersed value chain, we used global market data from the ecoinvent database; datasets containing average, global transport efforts between the various process steps. Only knitted fabric was considered for calculations as t-shirts are mostly made of this type of fabric (although some t-shirts may contain parts made of weaved fabric) [48]. The assembly step is based on data from Lehmann et al. (2019) [36]. For the distribution step, the assumptions from Hischier et al. (2018) for an average transport mode from the production site to the point of sale were applied [47]. The respective life cycle inventory datasets used for the calculation can be seen in the Supplementary Materials (SM).
For the use phase, in the basic scenario, the t-shirt was washed 44 times in a half-full washing machine at 40 °C and air-dried, representing a typical use behavior [49,50]. These activities were modeled based on data from Lehmann et al. (2019), where the amount of water and energy needed for one washing cycle is provided [36]. For the detergent, data for 84 g of a representative European powder detergent as reported in Golsteijn et al. (2015) was used (see SM) [51]. The geographical boundaries of the use phase were no longer global, as this phase took place in Switzerland. Therefore, the Swiss energy mix and Swiss tap water were used for the respective calculations. The wastewater treatment after each washing cycle was also taken into account.

2.2. Sensitivity Analyses

2.2.1. Different Types of Fiber

T-shirts can be produced from other fibers. Therefore, the environmental impacts of the production of different fibers were compared as a sensitivity analysis in order to get an idea concerning the relevance of the choice of the raw material for producing a t-shirt. For this analysis, the following seven fibers were compared with cotton: wool, flax, silk, polyester, polyacrylic, nylon, and viscose. All of them represent fibers that are commonly used in the fashion industry (see SM). For the comparison, we used as a functional unit 264 g of fiber, representing the amount of cotton fiber required for manufacturing a cotton t-shirt of 154 g. In other words, we assumed that the amount of fiber for manufacturing a t-shirt is independent of the type of fiber material.

2.2.2. Different User Behavior

In the above-described basic scenario, the t-shirt was washed in a half-full washing machine at 40 °C and air-dried over 44 washing cycles. To better understand the extent to which human behavior patterns can influence the overall impacts in the four investigated impact categories, several factors were varied (Table 1): the washing temperature (washing at 30 °C or 60 °C), the fullness of the washing machine (full load or t-shirt washed alone), the mean of drying the t-shirt (tumbler instead of air-drying), and the t-shirt’s lifetime, respectively.
In order to have an idea of the impact of a t-shirt that is used less than its expected lifetime (here corresponding to 44 washing cycles), we looked at a scenario where the t-shirt’s lifetime was divided by four (corresponding to 11 washing cycles). If we assume that the t-shirt is washed once a week, this will mean that the t-shirt would be kept for three months (one season). This is believed to be a potential use behavior, which would be in accordance with the trend of fast-fashion. In order to be able to compare this scenario with the basic scenario, we had to calculate the number of t-shirts (with a lifespan of 11 washing cycles) needed to fulfill the lifespan aspect of our functional unit, corresponding as mentioned, to 44 washing cycles. This means that four t-shirts need to be produced and that the total number of washing cycles corresponds to 44 washing cycles (11 ∗ 4 = 44). The datasets and assumptions used for these calculations can be seen in the SM.

3. Results

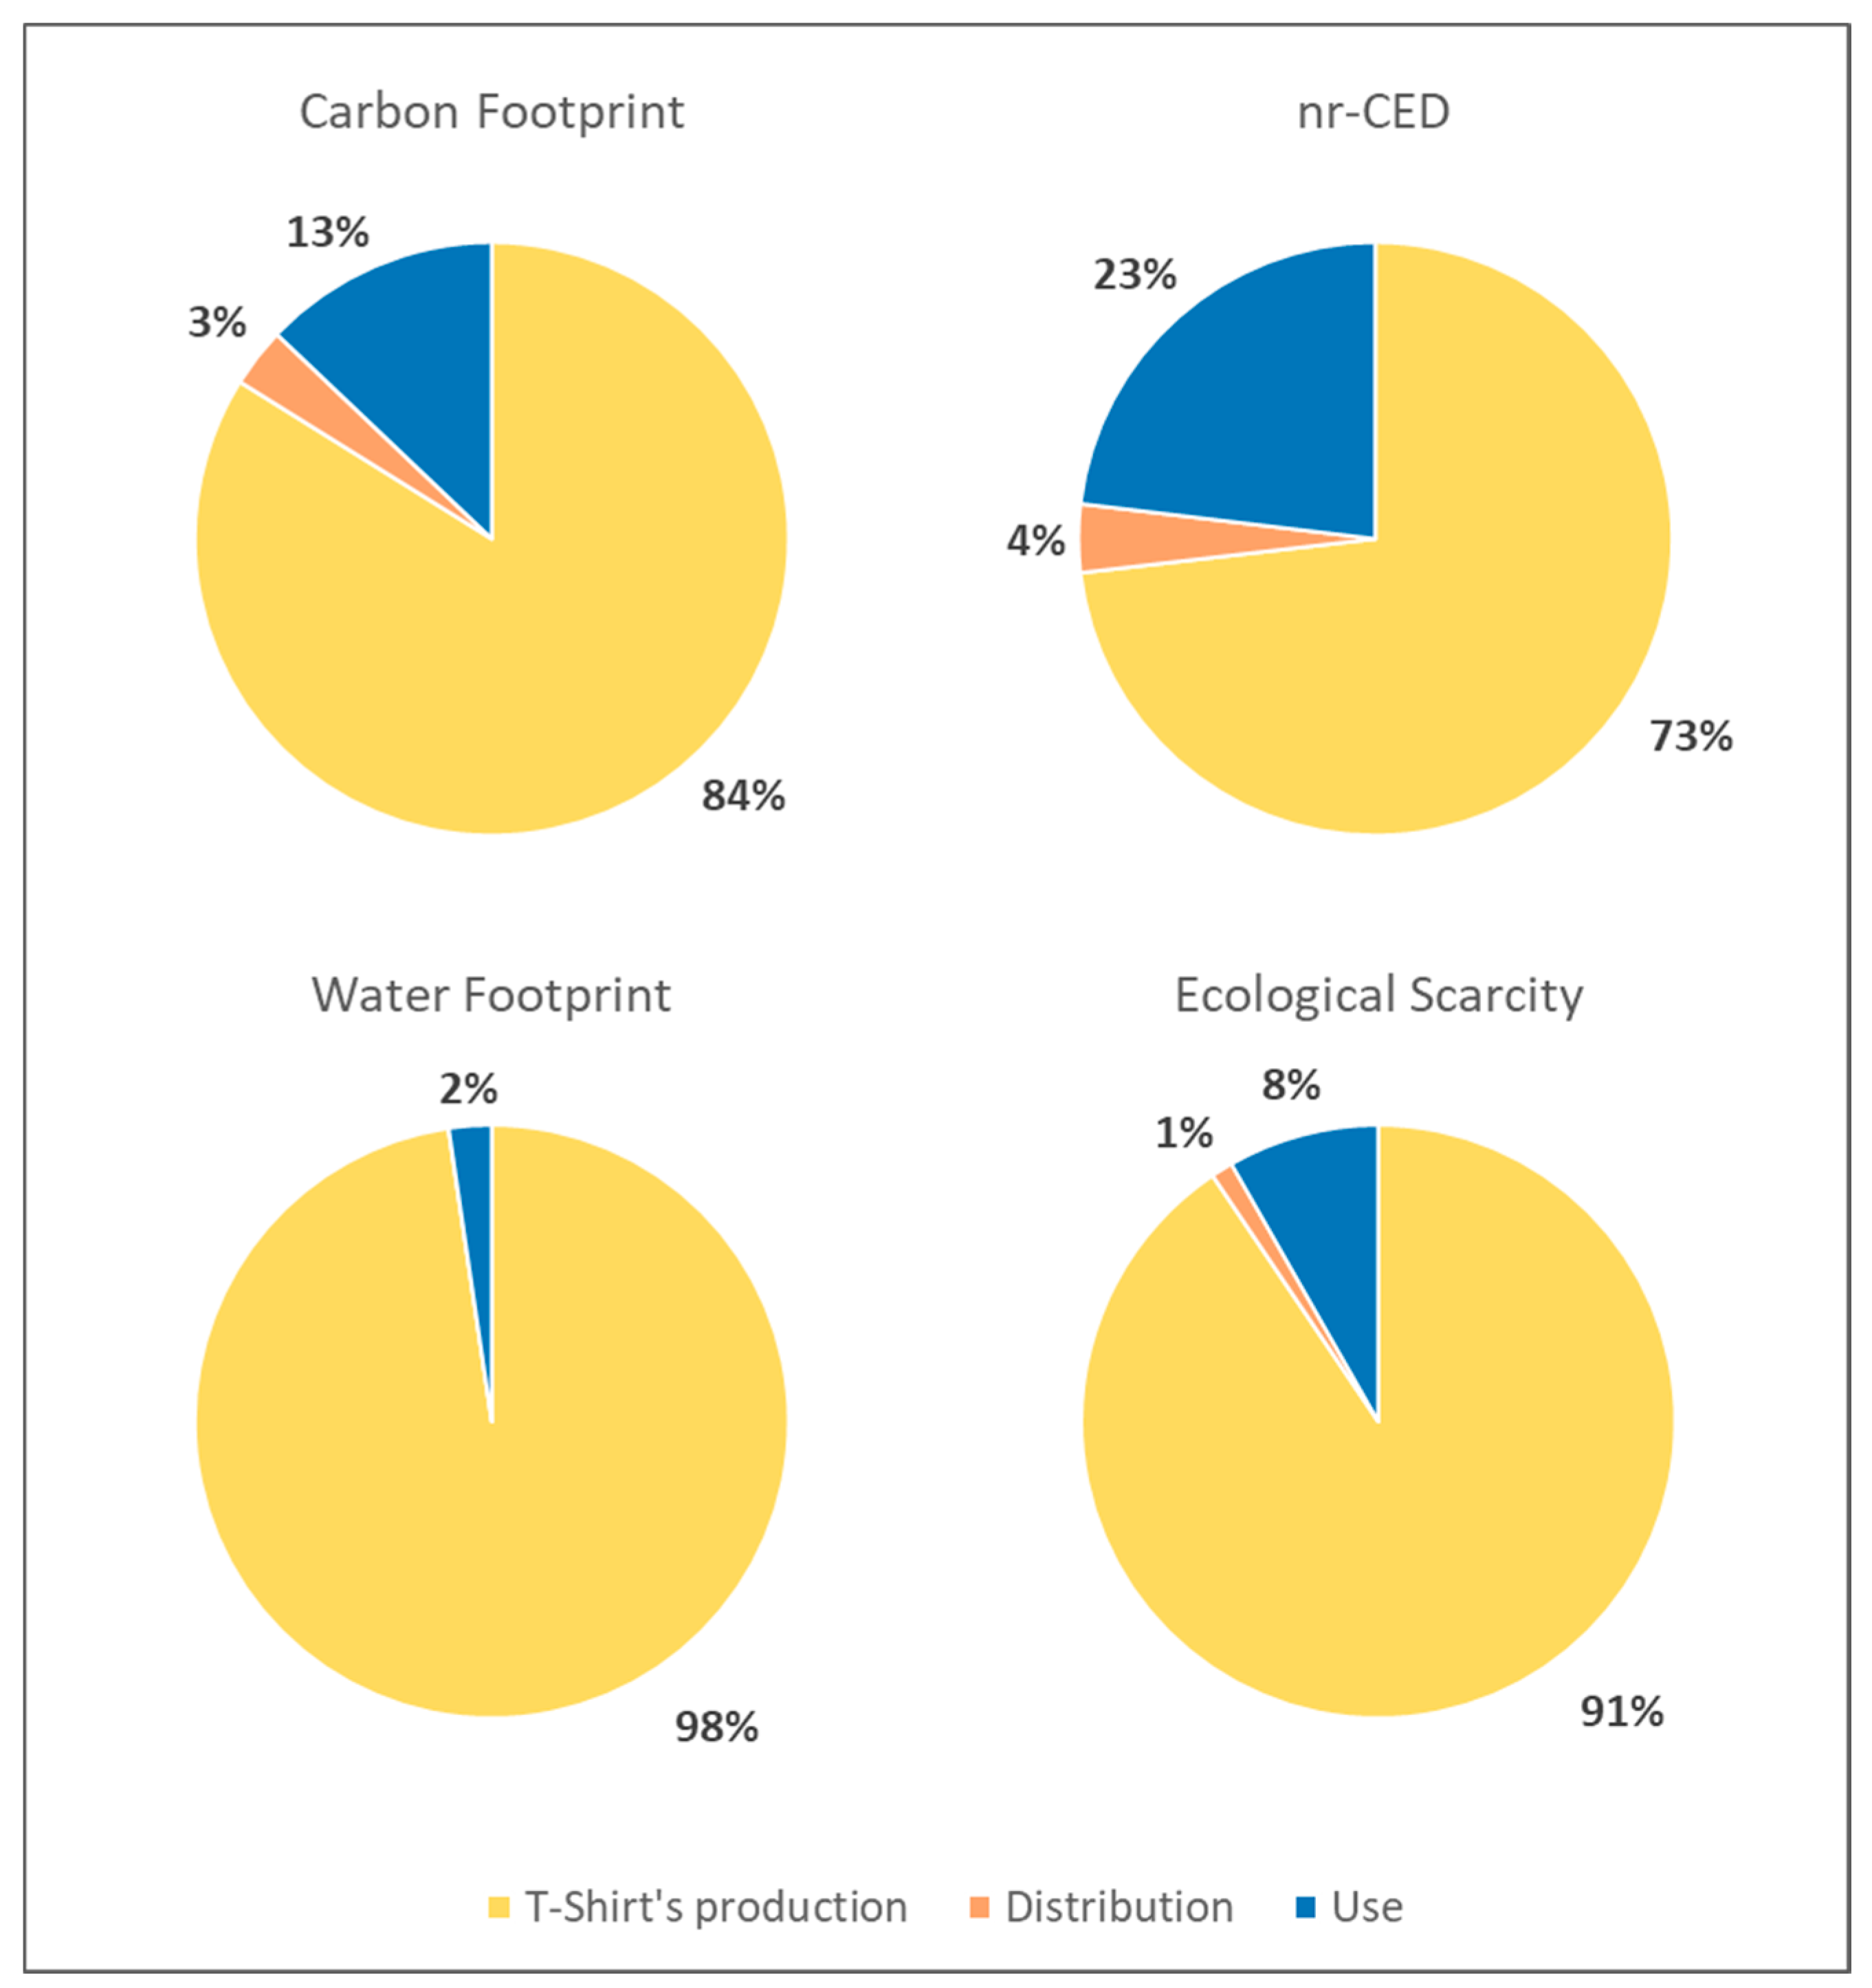
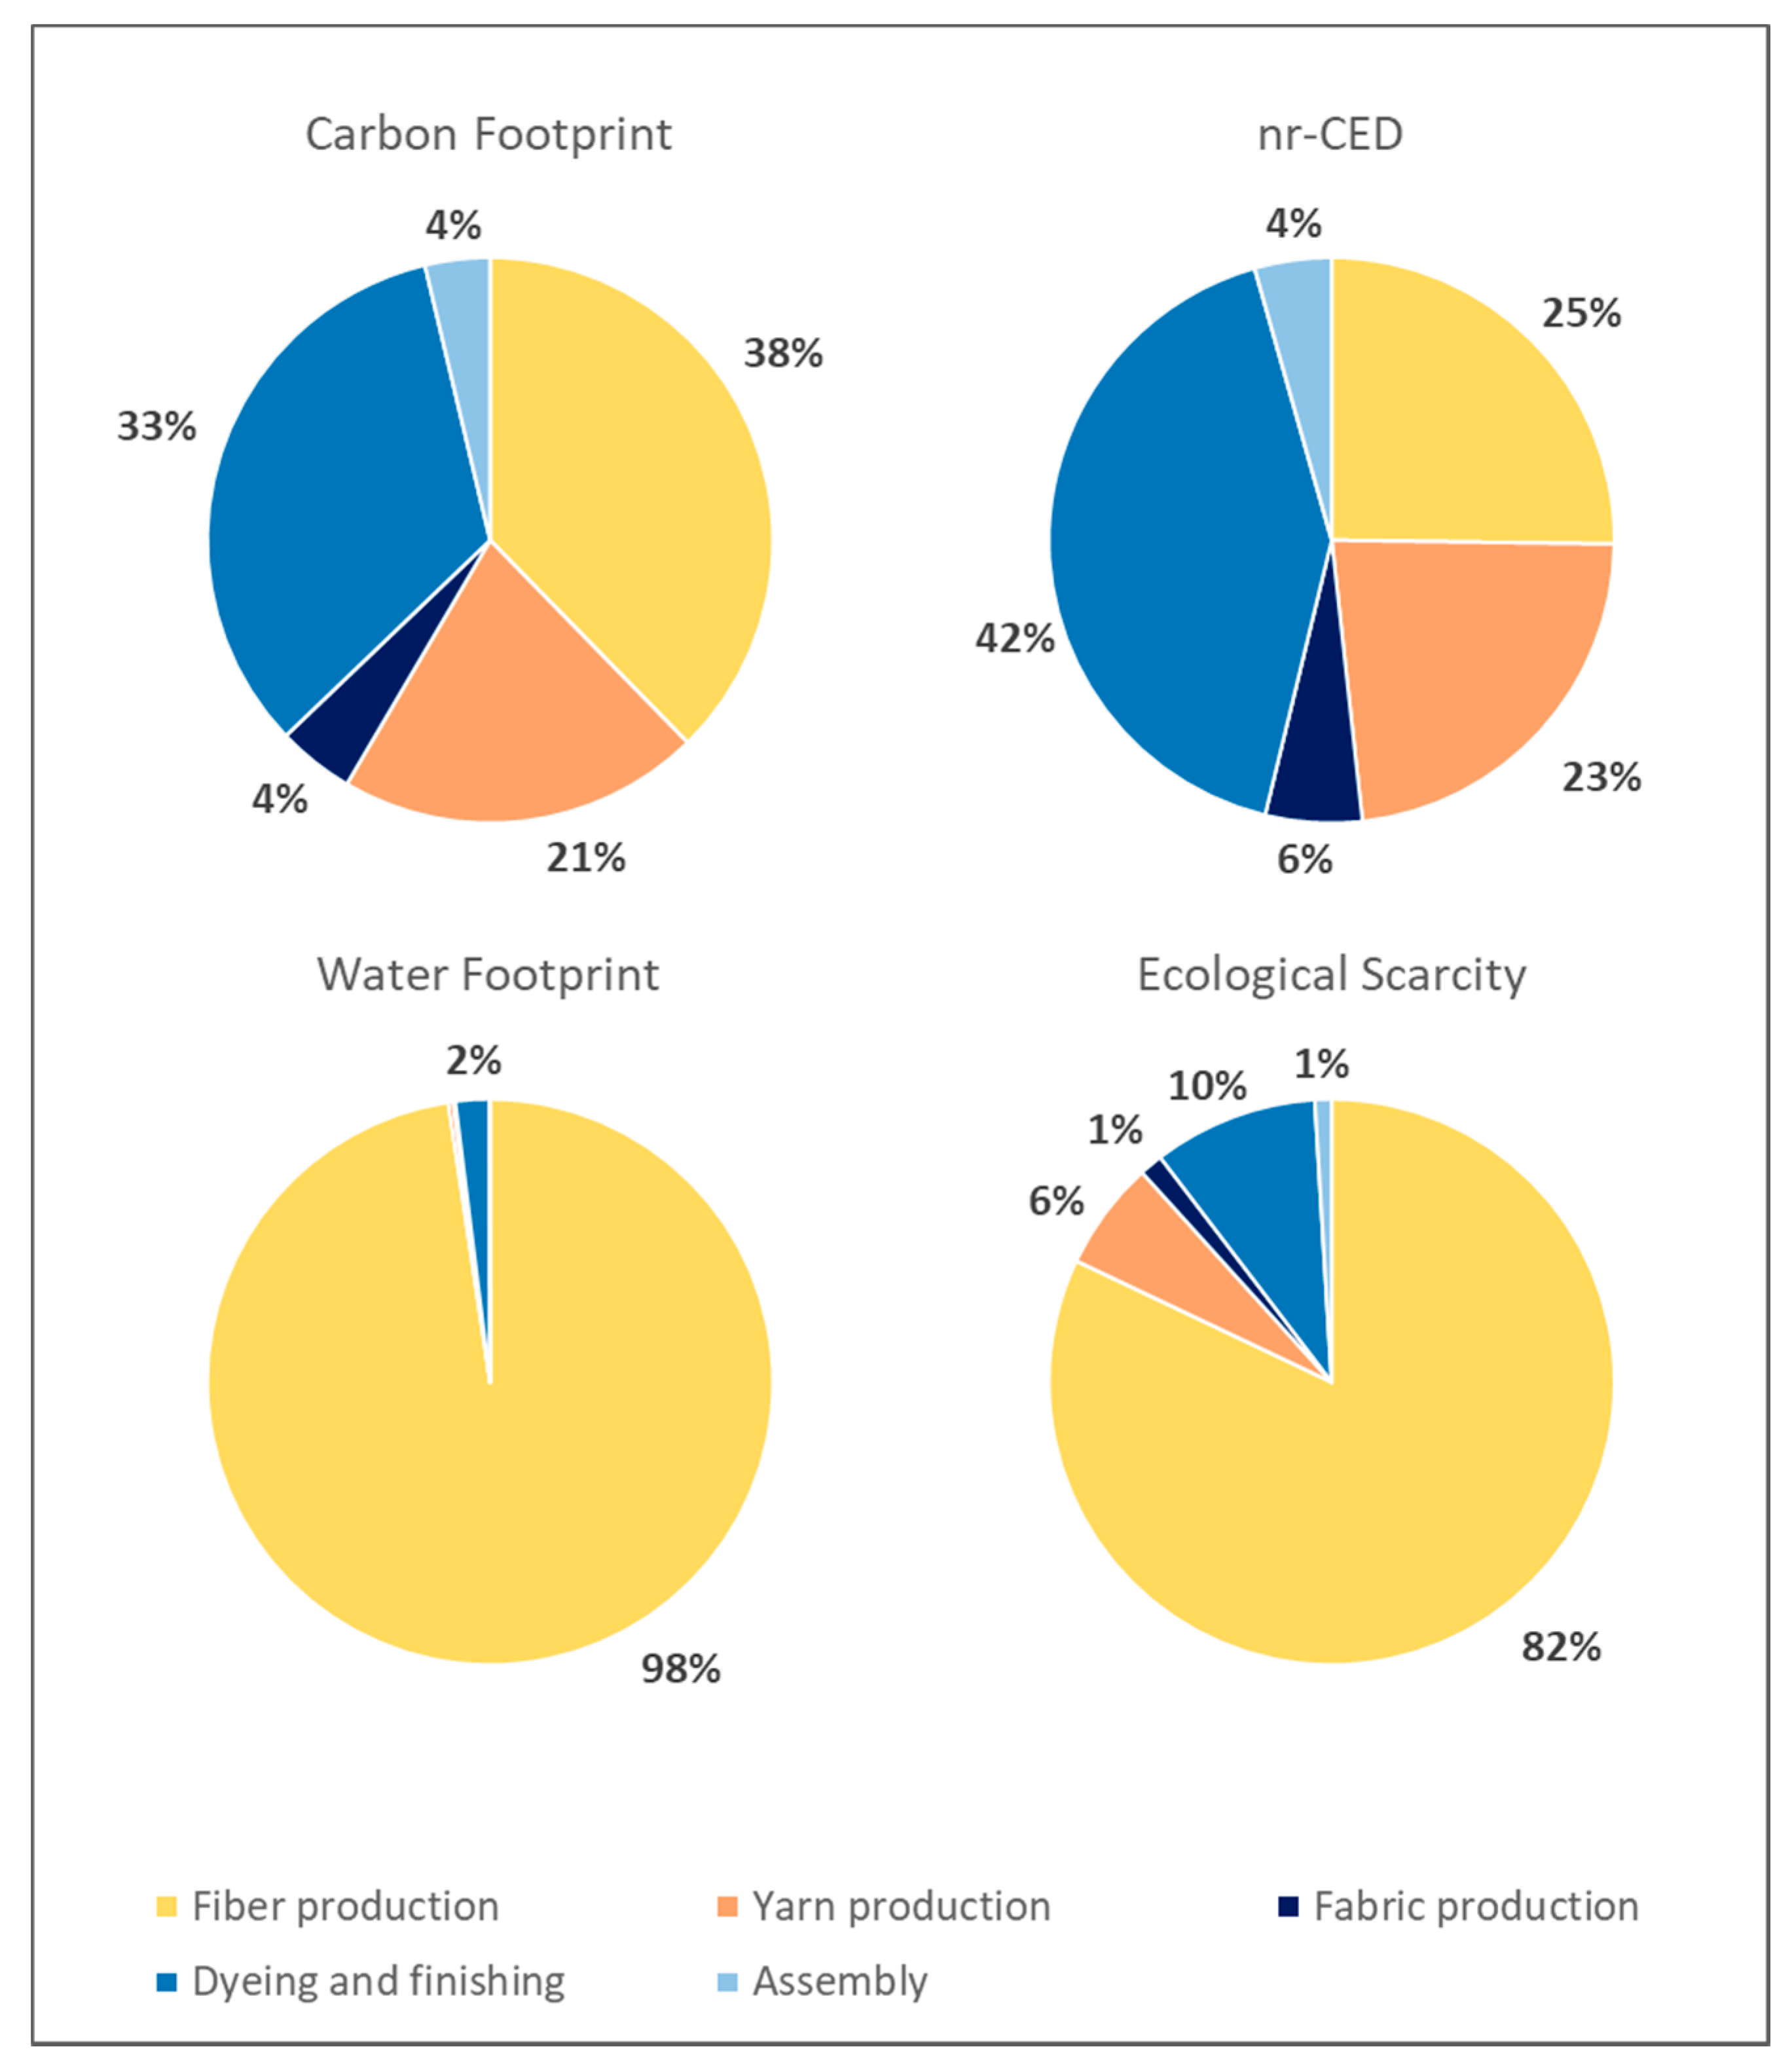
3.1. Overall Environmental Impact of the T-Shirt’s Life Cycle

Figure 2 presents the relative importance of production and distribution as well as use phase of the t-shirt. The total carbon footprint equaled 3.7 kg CO2-eq, the total nr-CED equaled 49.6 MJ-eq, the water footprint 52.7 m3 water-eq, and the ecological scarcity was 14,510 ecopoints. For all four impact categories, the t-shirt’s production contributed the most to the total impacts (i.e., 84% for the carbon footprint, 73% for the nr-CED, 98% for the water footprint, and 91% for the ecological scarcity). The use phase contributed more or less to the impact depending on the impact category. For instance, it is responsible for 13% of the carbon footprint, 23% of the nr-CED, 8% for the ecological scarcity, but only for 2% of the water footprint. Finally, in all cases, the distribution step of the t-shirt contributed less than 5% to the total impact.
Two conclusions can be drawn from the results presented in Figure 2. First, the production phase of a cotton t-shirt has a very high impact in relation to its total impact. Second, the use phase is mostly relevant for the nr-CED and the carbon footprint. Hence, these are the two impact categories where the consumer can have the most influence in order to reduce the impact of the use phase. More detailed investigations about the use phase can be found in Section 3.2.2.
To better understand where the high impacts of the production are coming from, first, the relevance of the individual production steps (as shown in Figure 1) were analyzed and are shown in Figure 3. The carbon footprint of the production (i.e., from raw material extractions to the final assembly) of such a cotton t-shirt equaled to 3.0 kg CO2-eq. This impact mostly comes from the fiber production step of the t-shirt (38%), followed by the dyeing and finishing step (33%), the yarn production (21%), the fabric production (4%), and the assembly (4%). The nr-CED shows a similar picture to the carbon footprint. In total, the production of a cotton t-shirt corresponds to 36.3 MJ-eq. The three steps with the most impact are the dyeing and finishing (42%), the fiber production (25%), and the yarn production (23%). These are followed by the fabric production (6%) and the assembly (4%). In total, the water footprint of the t-shirt’s production is equivalent to 51.4 m3 water-eq. The water footprint showed a different picture than the two others: here, the fiber production contributed to 98% of the impact, while the dyeing and finishing process only to 2%. Finally, the ecological scarcity was equivalent to 13,142 ecopoints. The majority of the impact came from the fiber production with 82%, followed by the dyeing and finishing step with 10% and the yarn production with 6%. Both the fabric production and the assembly contributed to 1% of the impact.
Overall, it can be concluded from Figure 3 that the fiber production step is highly relevant and contributes to the majority of the impacts for almost all of the investigated impact categories. This is another point where the consumer could influence the impacts. In the case of cotton, the high impact of fiber production is related to the fact that conventional cotton cultivation requires a lot of pesticides and fertilizers (usually fossil based) because of the plant’s poor nutrient uptake efficiency as well as a great amount of water needed to grow (i.e., irrigation) [52]. The dyeing and finishing step as well as yarn production are also quite relevant, especially for the nr-CED and the carbon footprint. However, these steps are more of a question of manufacturing and can hardly be influenced by the consumer. The information regarding these two steps is usually not available to the consumer (i.e., on the etiquettes, usually only the region of assembly and the fiber type are reported), and were thus not further investigated in the present study.

3.2. Means for the Consumer to Influence the Impact of Their T-Shirt

The analysis above identified two areas of influence of the consumer. In a first step, the influence of the choice of material was evaluated by comparing the production of other textile fiber materials with the production of cotton fibers (Section 3.2.1). In a second step (Section 3.2.2), the use phase was further analyzed by including different washing and drying behaviors that a consumer may have. In addition, the life expectancy of the t-shirt was also taken into account.

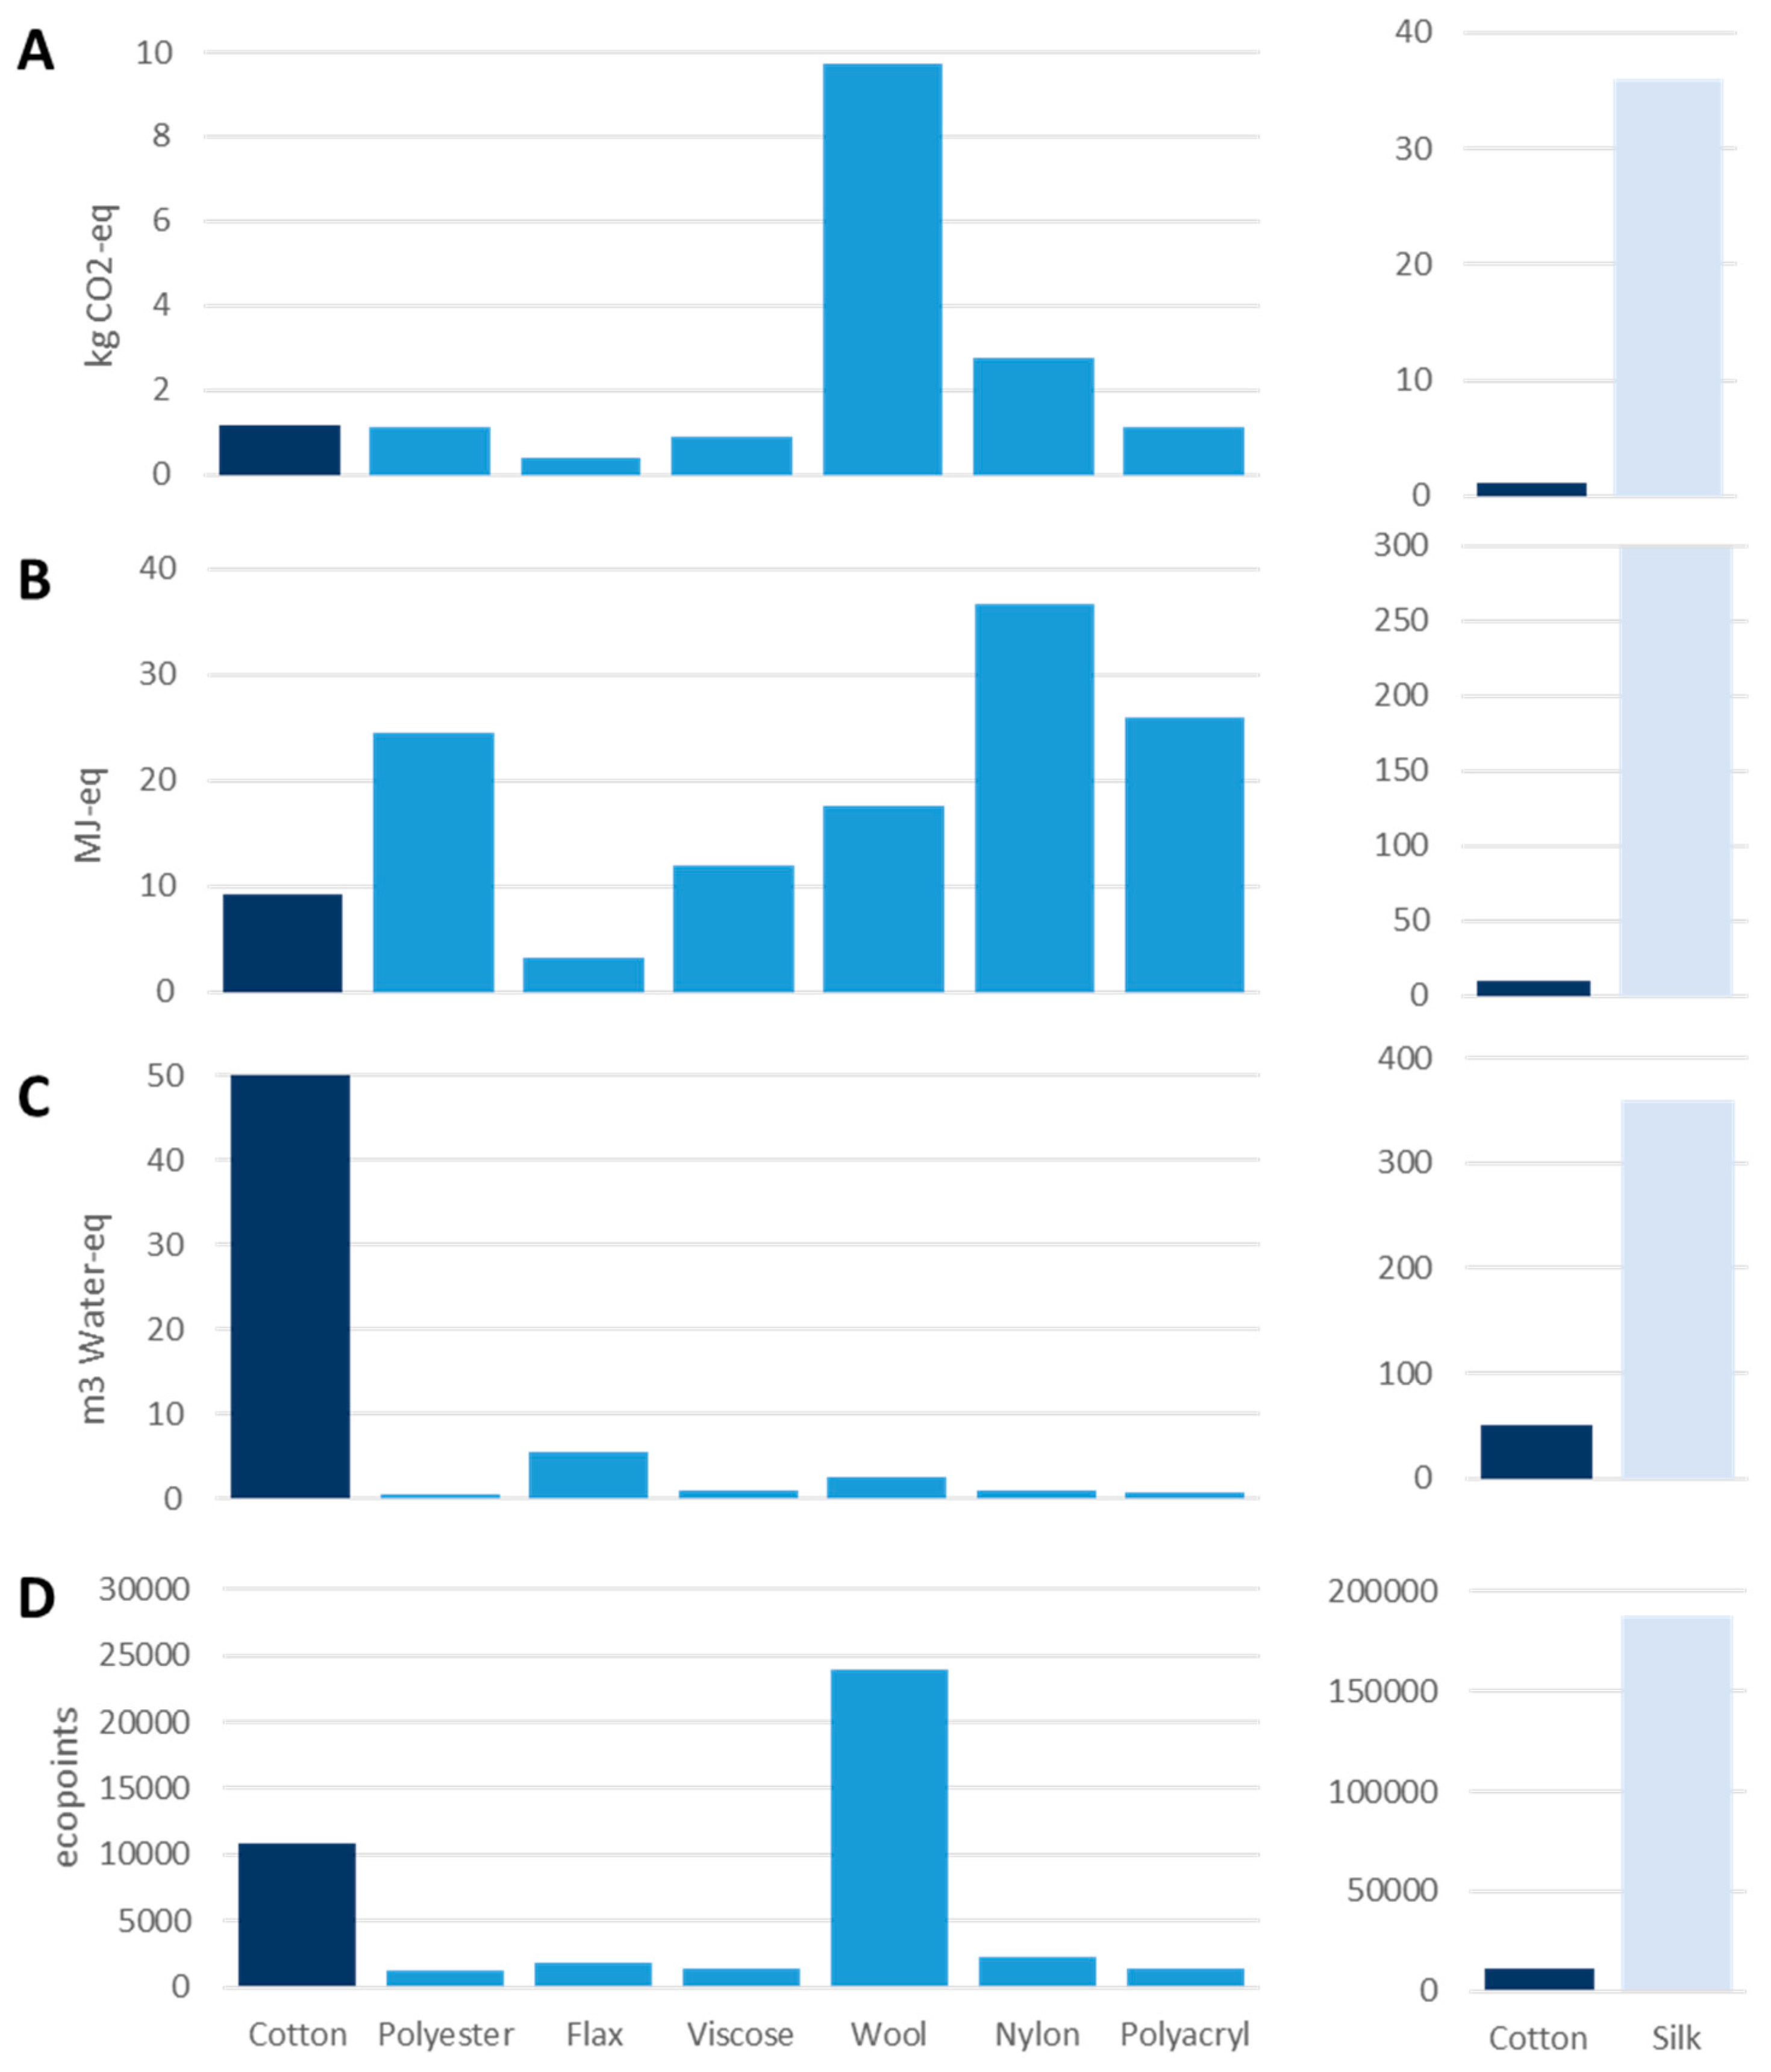
3.2.1. Influence of the Raw Material Choice

As above-mentioned (Figure 3), cotton fiber production is among the most impactful steps of the entire production chain of a t-shirt. [18]. The results of the comparison between the fiber production of cotton, polyester, flax, viscose, wool, nylon, polyacrylic, and silk can be seen in Figure 4, showing the respective impacts for 264 g of fiber:
  • Regarding the carbon footprint (Figure 4A), silk (36.0 kg CO2-eq) had the highest impact, followed by wool (9.7 kg CO2-eq), nylon (2.7 kg CO2-eq), cotton (1.2 kg CO2-eq), polyester (1.1 kg CO2-eq), polyacryl (1.1 kg CO2-eq), viscose (0.9 kg CO2-eq), and finally flax (0.4 kg CO2-eq).
  • The fiber with the highest nr-CED was also silk with 298.7 MJ-eq (Figure 4B). This was followed by nylon (36.7 MJ-eq), polyacryl (26.0 MJ-eq), polyester (24.5 MJ-eq), wool (17.5 MJ-eq), viscose (12.0 MJ-eq), cotton (9.1 MJ-eq), and flax (3.2 MJ-eq). The three fibers with the highest impact after silk were the three synthetic fibers.
  • For the water footprint (Figure 4C), silk again had the highest impact with 360.2 m3 water-eq, followed by cotton (50 m3 water-eq), flax (5.6 m3 water-eq), and wool (2.5 m3 water-eq). The three synthetic fibers had a very low impact (<1 m3 water-eq).
  • Finally, the ecological scarcity (Figure 4D) also showed that silk had the highest impact of all fibers (188,236 ecopoints). The second highest impact was from wool (24,005 ecopoints) and the third from cotton (10,783 ecopoints). The other fibers were in a similar range (between 1287 ecopoints and 2257 ecopoints).
Overall, in all four impact categories investigated, silk had the biggest environmental impact. The high impact of silk was mainly due to the cultivation of mulberry trees (71%), for which fertilizer is used. The mulberry trees are necessary for the production of silk because the domesticated silkworms Bombyx mori are fed with their leaves [6,53]. In order to have 264 g of silk fibers, 2 kg of cocoons are needed. Moreover, for 2 kg of cocoons, 48 kg of mulberry leaves are needed to feed the silkworms (ecoinvent Center, 2019). Therefore, the high impact of silk is due to the need of large amounts of mulberry leaves and the highly energy and water consuming steps to produce silk fiber. The other fibers were more difficult to interpret as they had a more or less high impact depending on the chosen impact. Flax always performed better than cotton because flax only requires a small amount of fertilizer and water compared to cotton [52]. However, flax did not always have the best performance of all fibers such as for the nr-CED and the ecological scarcity. Wool had a relatively high carbon footprint and ecological scarcity. This is mainly due to the methane emissions of sheep (56%), manure emissions of dinitrogen monoxide (16%), and the soybean for feeding sheep (17%) [42]. All synthetic fibers based on fossil resources (polyester, polyacryl, nylon) had a relatively high nr-CED, but a relatively very low water footprint and ecological scarcity. The high nr-CED principally came from the process to produce these fibers (filament extrusion), which has a relatively high-energy demand [18]. In order to help interpret the overall environmental impact of those fibers, the ecological scarcity can be used. This impact category combines many environmental impacts under one score, representing an overall environmental impact. This resulted in wool and cotton, after silk, having the highest impact of the seven fibers investigated. The other fibers had, on the other hand, impacts within the same range.

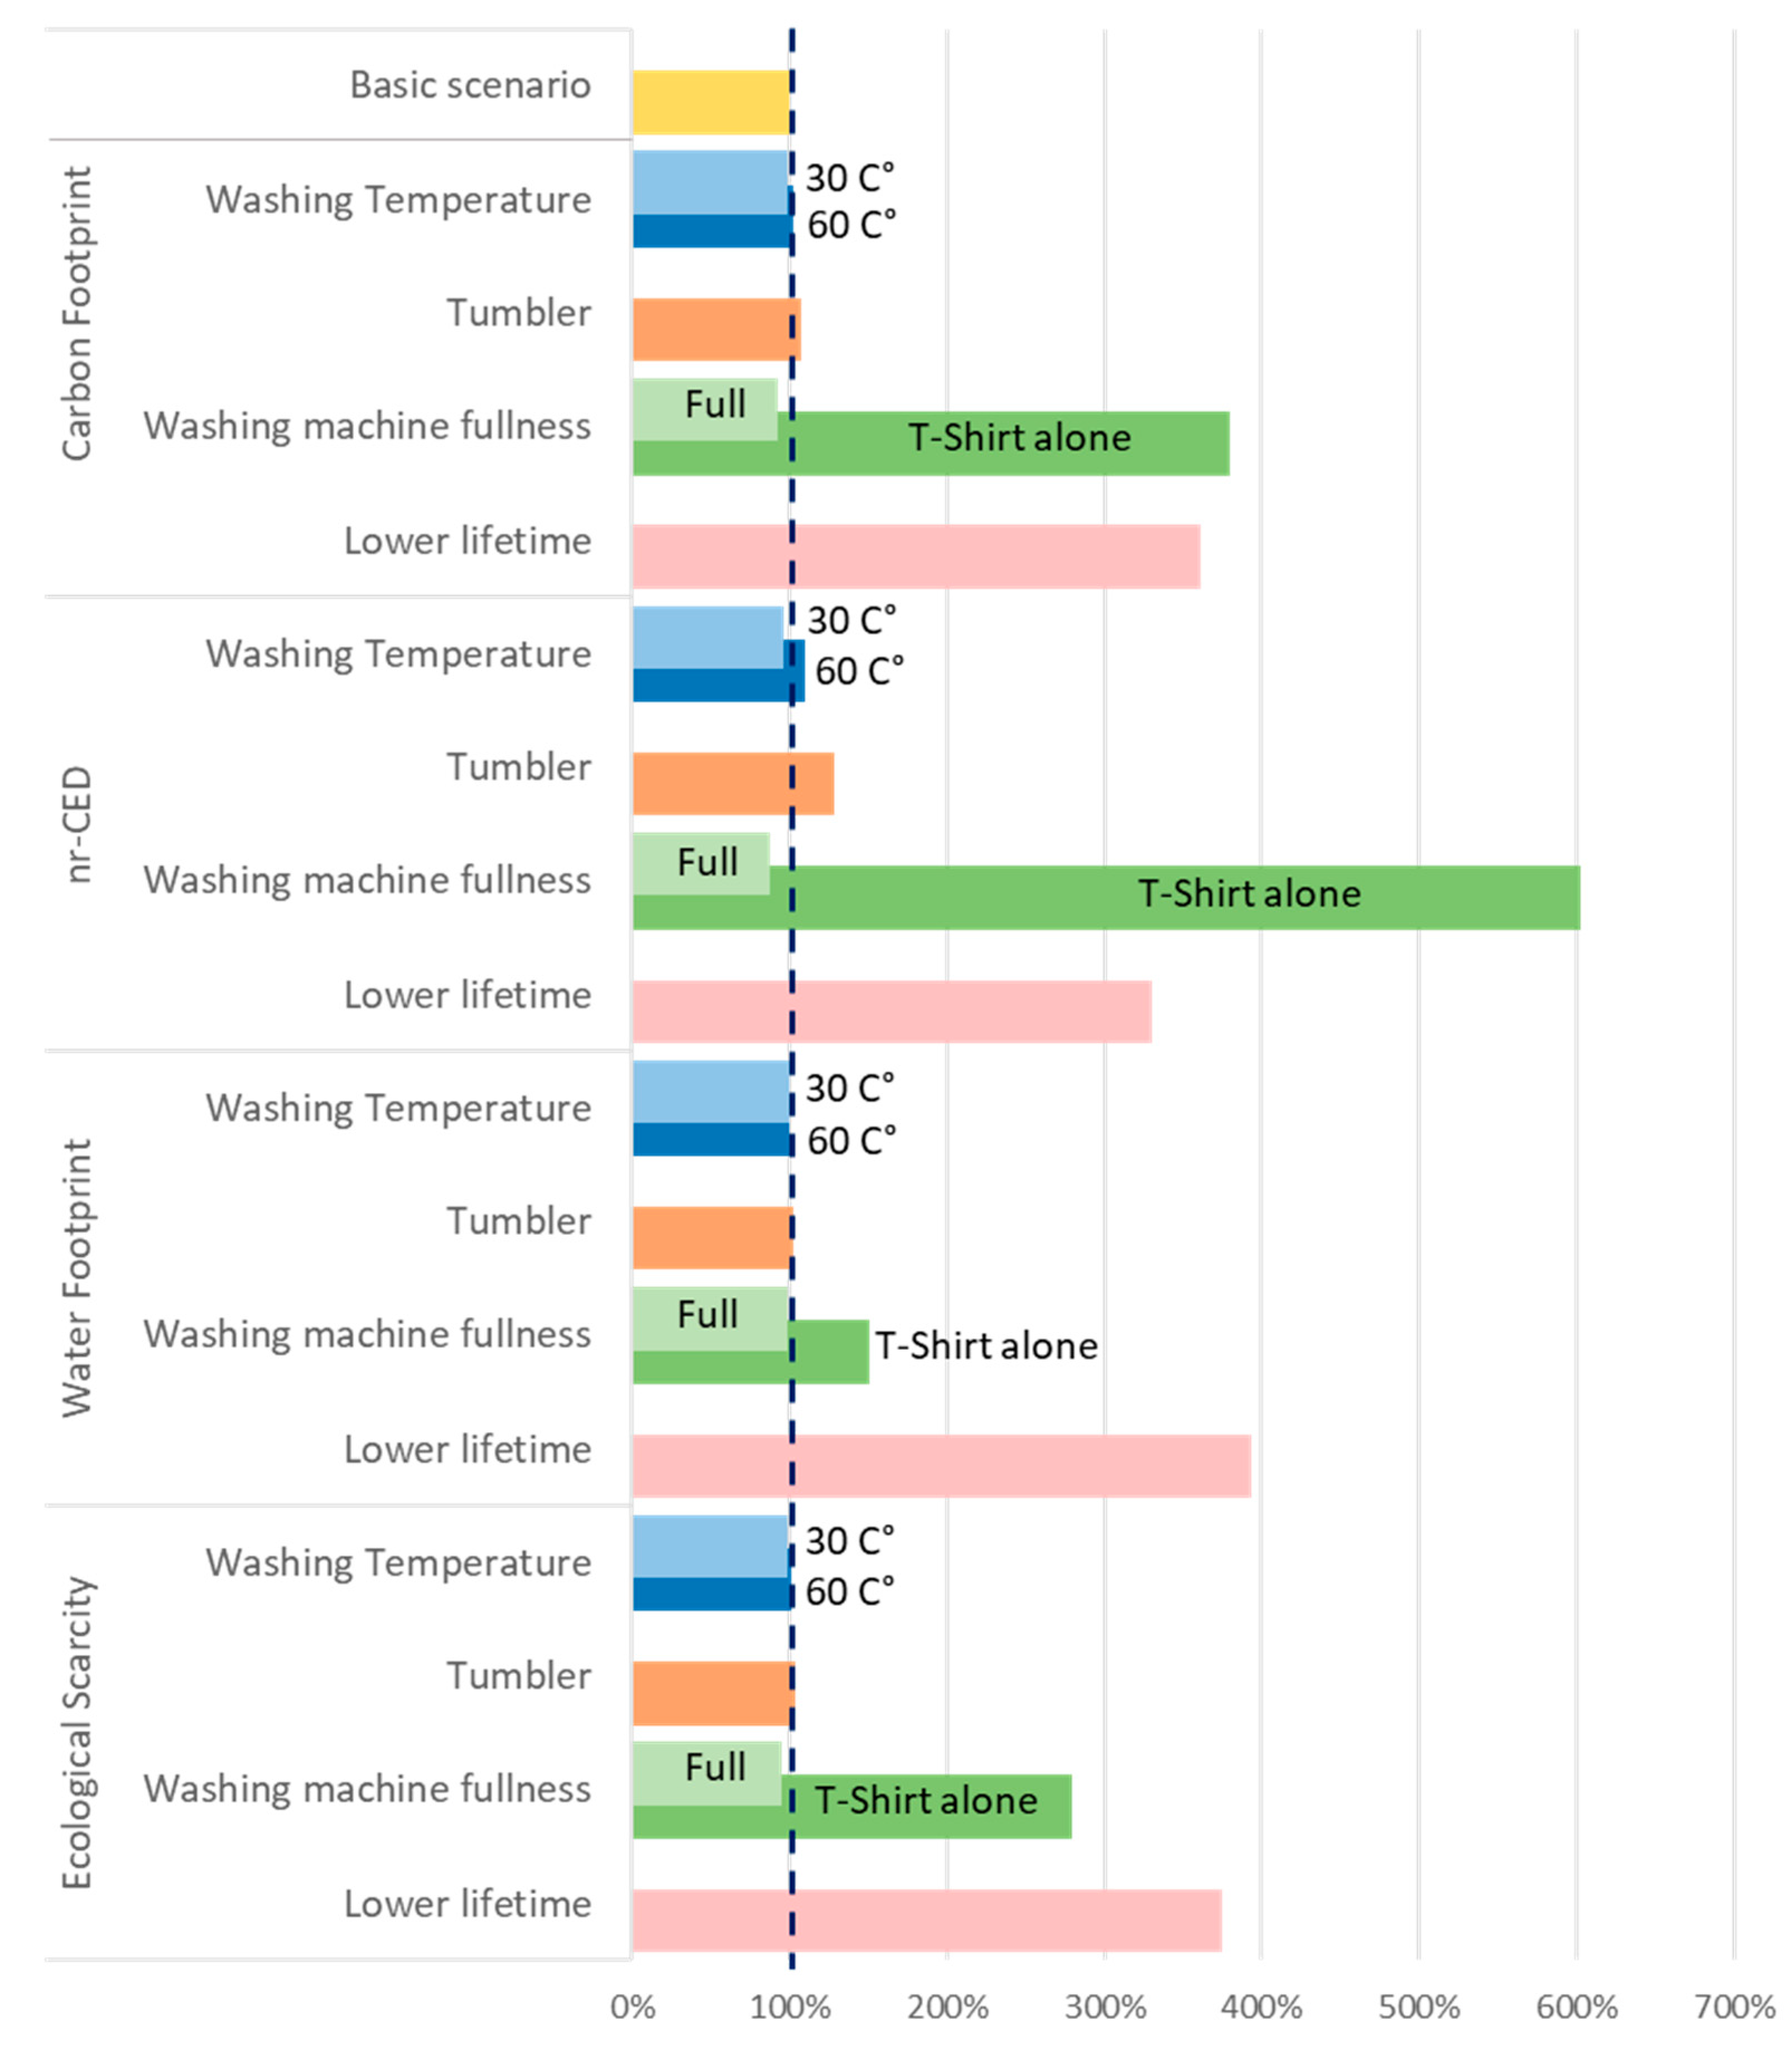
3.2.2. Influence of the Washing Behavior and of Decreasing the T-Shirt’s Lifetime

The results of all of these changing variables can be seen in Figure 5. The basic scenario in yellow was set at 100% for all four impact categories. This way, the other scenarios can directly be compared in relation to the basic scenario in terms of percentage increase or decrease. It can be seen that the fullness of the washing machine has a tremendous impact on all four investigated impacts, though to a lesser extent for the water footprint. Indeed, the impact of washing the t-shirt alone increased the carbon footprint by 280%, the nr-CED by 502%, the water footprint by 50% and the ecological scarcity score by 179%. On the other hand, washing in a full washing machine enabled a decrease in the impact of the carbon footprint by 7%, the nr-CED by 12%, the water footprint by 1%, and the ecological scarcity by 4%. Another aspect that has a tremendous influence on the impact of the use phase is the t-shirt’s lifetime. When decreasing the lifetime to 11 washing cycles (thus buying four t-shirts instead of one for the same overall use time), the impact increased by 261% for the carbon footprint, by 231% for the nr-CED, by 293% for the water footprint, and by 275% for the ecological scarcity. This factor resulted in the highest increase of the impact for the water footprint, which is not surprising, as we have seen in Figure 2 that 98% of this impact came from the t-shirt’s production. The washing temperature also influenced the results, though to a much lesser extent. By washing at 60 °C, the impact increased the most for the nr-CED with 10%. For the three other impacts, the increase was between 1 and 3%. When washing at 30 °C, the impact decreased by 1% for the carbon footprint and the ecological scarcity and by 4% for the nr-CED, while it did not change for the water footprint. One last aspect that increased the environmental impact of a t-shirt was the use of a tumbler for drying instead of air-drying. The impact increased by 8% for the carbon footprint, by 28% for the nr-CED, by 2% for the water footprint, and by 4% for the ecological scarcity.
Overall, it can be observed that the behavior of the consumer in the use phase (i.e., the washing behavior, temperature, fullness of the washing machine, and the mean of drying) had the highest influence regarding the nr-CED, followed by the carbon footprint. This confirms the findings presented in Figure 2, showing that these two impacts had the highest contribution to the use phase (23% and 13%, respectively). The two most relevant factors influencing the results are the lifetime and the fullness of the washing machine. Wearing the t-shirt throughout its entire life expectancy is highly relevant for the overall environmental performance of a t-shirt. Throwing away a t-shirt prematurely and buying more t-shirts would always result in an increase in the environmental impacts compared to keeping the same t-shirt during its entire lifetime. It is also interesting to see that washing the t-shirt alone was worse than buying four t-shirts for the carbon footprint and nr-CED, while for the water footprint and the ecological scarcity, the contrary applied. This is probably due to the fact that the contribution of the t-shirt’s production to the total impact (Figure 2) for the latter two was higher than for the two former. Washing in a full washing machine at 40 °C showed a bigger decrease in impact than washing at 30 °C within a half-full washing machine. Finally, using the tumbler always increased the total impact of the t-shirt. An interesting aspect to see is that washing the t-shirt alone in a half-full washing machine at 60 °C resulted in a lower impact in all four investigated impact categories than washing in a half-full washing machine at 40 °C and using a tumbler. This emphasizes the fact that the mean of drying has more impact than the washing temperature.

4. Discussion

4.1. Influence of the Consumer while Buying a T-Shirt

The first thing consumers can do in order to influence the environmental impact of their t-shirt takes place when buying it. Indeed, at this stage, consumers can look at the etiquette of the clothing item and check the type of fiber from which it is produced. As shown in Section 3.2.1, the choice of the actual raw material had a great influence on the overall environmental impacts of t-shirts, assuming that all subsequent production steps after the fiber production itself are not influenced by the choice of raw material. The results have shown that silk in comparison to cotton and other investigated fibers has a tremendously higher impact and therefore should be consumed carefully. It has been found, however, that silk garments in general have a longer lifespan and are washed less often than other fibers [38]. For the other fibers, it is a question of trade-off. Here, consumers are confronted with a choice: either they decide to target a specific environmental aspect such as carbon footprint, nr-CED, or water footprint, or they decide to follow the general environmental impact assessment represented by the ecological scarcity. If they choose the second strategy (i.e., ecological scarcity), the best performing fiber is polyester, followed by viscose, polyacryl, flax, nylon, cotton, wool, and finally silk. However, if their strategy is to target only one specific environmental impact, the choice is as follows (from best to worst):
  • Carbon footprint: flax < viscose < polyacryl = polyester < cotton < nylon << wool <<< silk
  • nr-CED: flax < cotton < viscose < wool < polyester < polyacryl < nylon <<< silk
  • Water footprint: polyester < polyacryl < nylon < viscose < wool < flax << cotton <<< silk
Van der Velden et al. (2013) showed, in their comparison of the life cycle of various fibers, that textiles made of acryl and polyester have the least environmental impacts and are followed by elastane, nylon, and cotton [18]. These results were based on the Ecocost 2012 characterization method and are similar to the ecological scarcity as shown in Figure 4.
For all this, it should be kept in mind that the data for the t-shirt production and thus for the fiber production are representative for a global market including both worst and best practices. Therefore, the results presented in this study have to be considered as average results, which includes various agricultural practices and technologies throughout the production steps of a t-shirt. Using case specific or company specific data may result in having different environmental impact results, as those depend heavily on the technology used and the agricultural practices behind the raw material cultivation processes. For example, cotton—being an agricultural product—could potentially have a much lower impact than presented here if it were coming from an organic farm or was rain-fed (thus decreasing the amount of pesticides, fertilizers, and artificial irrigation required). Another example can be highlighted with viscose fibers, which has been shown to be either the worst environmentally performing fiber or the best [54]. New types of cellulosic fibers have made their appearance on the market such as Tencel and Lyocell. According to Shen et al. (2010), modern man-made cellulose fibers have in general a better environmental performance than cotton, polyester, and polypropylene [16]. However, since the data in this study are confidential, we could not add them to our analysis. Based on our knowledge, we can conclude that the focus should not necessarily be on the fiber type per se, but rather on the best manufacturing processes used for their fabrication [54]. Each fiber has different functionalities and advantages that should also be taken into account in order to not reduce diversity [38].
In addition, further variables can influence the environmental impact of a t-shirt’s production such as the weight of the t-shirt itself, the diameter of the yarn, the fiber density, or the technology and chemicals used in the dyeing process. It has been shown that the use of energy needed for the yarn production and fabric production actually depends on the yarn diameter [18], which ultimately influences the environmental impact of the clothing item. However, as above-mentioned above, information regarding the manufacturing steps of a t-shirt (i.e., yarn production, fabric production, dyeing and finishing) are usually not available to consumers. If these manufacturing steps would, for example, be undertaken in Europe, the environmental impact of these phases would probably decrease, because of better electricity mixes and higher levels of regulations, though this would need to be studied. Even though this information is not yet available, it might be in the future. More and more efforts are being made by the textile industry to increase their transparency by using blockchain technologies, which have the potential to enable consumers to track the products through the entire supply chain [55].
In the meantime, instead of focusing on the type of fiber itself, other means can be used by the consumer to further help them in choosing their t-shirts such as using labels or platforms comparing products. Many labels already exist in the textile industry and can cover different aspects of sustainability (social or environmental). For example, the Global Organic Textile Standard (GOTS) certifies products made of organic fibers including ecological and social criteria, and looks at the entire supply chain [56]. Another example is “Made in Green” by Oeko-Tex. This label includes both the sustainable manufacturing of textile items and the exclusion of harmful chemical substances [57]. To the knowledge of the authors, no studies have been performed comparing the various labels in the textile industry in the context of LCA. New platform apps are also appearing in order to help consumers choose between brands such as the Good On You platform, which includes social and environmental aspects as well as animal welfare in their comparison tool [58].

4.2. Influence of the Consumer While Using a T-Shirt

In a second step, consumers can influence actively the use phase of their t-shirt. Consumers can decide many things during this phase as they can choose the washing temperature, how much they fill their washing machine, or the means of drying their clothes. As we have seen in Section 3.2.2 above, the nr-CED and carbon footprint are two impact categories where the consumer can have the most influence on increasing or decreasing the environmental impact of their t-shirt compared to the basic scenario. In fact, the basic scenario had quite a good environmental performance compared to the other scenarios shown in Figure 5. There are only two ways to decrease the impact: by decreasing the temperature from 40 °C to 30 °C and by filling the washing machine to its full load instead of running it half-full. Thus, if the t-shirt is washed at 30 °C within a full washing machine, the environmental impact would decrease further. For the nr-CED, this would correspond to a maximum decrease of 14% and for the carbon footprint to a 7% decrease. All other scenarios resulted in a higher impact than the basic scenario, especially when washing the t-shirt alone, and to a lesser extent when using the tumbler. Similar conclusions were made from the study of Steinberger et al. (2009) where the use phase happened in Germany [31]. Although Germany has a different energy mix than Switzerland, the study showed similar results. They concluded that the consumers should first choose air-drying instead of using a tumbler. The second biggest impact a consumer can have according to them is by decreasing the temperature of washings. However, they did not study the load of the washing machines. As shown in Figure 5, the load of the washing machine had a more important impact than the use of a tumbler and lower washing temperatures.
One last but most relevant way consumers can influence the environmental impact of their t-shirts is by wearing them as long as possible. This is what we have seen with the “lower lifetime” scenario from Figure 5. There, the impact was tremendously increased when the t-shirt was discarded before its expected end-of-life. Similar results have been found elsewhere [23,38,39]. The former focused on a woolen sweater, which shows that similar conclusions can be made for other types of garments than t-shirts [23]. Therefore, the consumer should favor high quality, because the quality or physical durability of a clothing item is directly linked to its lifetime expectancy. There are some possible ways to increase the lifetime of clothing items such as t-shirts. For example, it has been shown that reuse (second-hand shop) can increase the lifetime of clothing items and results in environmental advantages over simply discarding them [29,59]. Two other options that could be used to increase the lifetime are repairing or upcycling [60].

5. Conclusions

All in all, this study illustrates the relative environmental impacts of the different life cycle phases and of the different production steps of a cotton t-shirt for four impact categories: carbon footprint, the nr-CED, the water footprint, and the ecological scarcity. The study provides a comparison of different fiber materials and provides insights on how much consumers could decrease the environmental impacts of their t-shirts. This study illustrates how the consumers can reduce its impact before buying the t-shirt as well as while using it and to what extent. It shows that consumers have the power to make their t-shirts greener, as already partly demonstrated in other studies [38,39,41]. According to the results, the consumer should follow the following principles: (1) quality over quantity (in order to increase the t-shirt’s lifetime and thus favoring consumption reduction); (2) a fuller washing machine is better; (3) avoiding the tumbler and favoring air-drying; and (4) the lower the washing temperature, the better. Furthermore, as we have seen, the choice of fiber materials is less straightforward and depends on the impact category, highlighting that trade-offs need to be made. The consumer should therefore focus more on how the t-shirt is manufactured than on the type of fiber itself. For this, the consumer can look at the labels.
In a next step, the environmental impacts of different mixes of fibers for producing a t-shirt—a common practice in today’s textile industry—could be investigated as well as other new types of fibers such as Tencel and Lyocell. The washing specifications and consequences for each type of fiber, which are not necessarily similar to those of a cotton t-shirt, should also be included as it has been shown that textiles made of different fibers are taken care of differently [38]. Furthermore, the end-of-life (EoL) was not considered in this study because of the lack of consistent and transparent data and because consumers have less influence on EoL scenarios. However, consumers can decide to consume less in a first step and give their clothes to reuse/second-hand shops (thus prolonging the t-shirt’s lifetime) in a second step, as proposed by Yasin and Sun (2019) with their ladder of sustainability [61]. Finally, the quality of fibers, their life span as well as their actual potential to be recycled or reused would also be interesting to consider.

Supplementary Materials

The following are available online at https://www.mdpi.com/2071-1050/13/5/2498/s1, Table S1: Inputs for the production phase of a 154 g T-Shirt, Table S2: Input for 1 kg of “yarn, cotton//[GLO] market for yarn production, ring spinning, for knitting_modified”, Table S3: Inputs for the distribution step of the T-Shirt, Table S4: Inputs for the use phase of the T-Shirt and used datasets, Table S5: Inputs for the comparison of fiber production other than cotton and used datasets, Table S6: Inputs for the use phase scenarios with different washing temperatures and used datasets, Table S7: Inputs for the use phase scenarios with different mean of drying (tumbler) and used datasets.

Author Contributions

Conceptualization, all authors; Methodology, R.H. and C.S.; Formal analysis, M.S.; Investigation, M.S.; Data curation R.H. and C.S.; Writing—original draft preparation, M.S.; Writing—review and editing, All authors; Visualization, M.S. and R.H.; Supervision, C.S.; Project administration, C.S. All authors have read and agreed to the published version of the manuscript.

Funding

This research received no external funding.

Institutional Review Board Statement

Not applicable.

Informed Consent Statement

Not applicable.

Data Availability Statement

The data presented in this study are available in supplementary material.

Acknowledgments

Primary research for this paper was done in collaboration with the Textile Museum in St. Gallen for their exhibition. Our thanks go to Natasha Stoudmann for the English proofreading and to Akshat Sudheshwar for his critical comments.

Conflicts of Interest

The authors declare no conflict of interest.

References

  1. Ellen MacArthur Foundation. A new Textiles Economy: Redesigning Fashion’s Future. 2017. Available online: http://www.ellenmacarthurfoundation.org/publications (accessed on 12 October 2020).
  2. Ness, B.; Urbel-Piirsalu, E.; Anderberg, S.; Olsson, L. Categorising tools for sustainability assessment. Ecol. Econ. 2007, 60, 498–508. [Google Scholar] [CrossRef]
  3. ISO. Environmental Management—Life Cycle Assessment—Principles and Framework; Eur. Stand. EN ISO 14’440; International Standardization Organization (ISO): Geneva, Switzerland, 2006. [Google Scholar]
  4. ISO. Environmental Management—Life Cycle Assessment—Requirements and Guidelines; Eur. Stand. EN ISO 14’044; International Standardization Organisation (ISO): Geneva, Switzerland, 2006. [Google Scholar]
  5. Rebitzer, G.; Ekvall, T.; Frischknecht, R.; Hunkeler, D.; Norris, G.; Rydberg, T.; Schmidt, W.P.; Suh, S.; Weidema, B.P.; Pennington, D.W. Life cycle assessment Part 1: Framework, goal and scope definition, inventory analysis, and applications. Environ. Int. 2004, 30, 701–720. [Google Scholar] [CrossRef]
  6. Astudillo, M.F.; Thalwitz, G.; Vollrath, F. Life cycle assessment of Indian silk. J. Clean. Prod. 2014, 81, 158–167. [Google Scholar] [CrossRef]
  7. Bamonti, S.; Spinelli, R.; Bonoli, A. Environmental Footprint in the Production of Recycled Wool. Environ. Eng. Manag. J. 2018, 15, 1923–1931. [Google Scholar] [CrossRef]
  8. Wiedemann, S.G.; Simmons, A.; Watson, K.J.L.; Biggs, L. Effect of methodological choice on the estimated impacts of wool production and the significance for LCA-based rating systems. Int. J. Life Cycle Assess 2019, 24, 848–855. [Google Scholar] [CrossRef]
  9. Yacout, D.M.M.; Abd El-Kawi, M.A.; Hassouna, M.S. Cradle to gate environmental impact assessment of acrylic fiber manufacturing. Int. J. Life Cycle Assess 2016, 21, 326–336. [Google Scholar] [CrossRef]
  10. Liu, Y.; Zhu, L.; Zhang, C.; Ren, F.; Huang, H.; Liu, Z. Life cycle assessment of melange yarns from the manufacturer perspective. Int. J. Life Cycle Assess 2020, 25, 588–599. [Google Scholar] [CrossRef]
  11. Allison, A.L.; Ambrose-Dempster, E.; Aparsi, T.D.; Bawn, M.; Miguel Casas Arredondo, C.C.; Chandler, K.; Dobrijevic, D.; Hailes, H.; Lettieri, P.; Liu, C.; et al. The environmental dangers of employing single-use face masks as part of a COVID-19 exit strategy. UCL Open Environ. 2020, 53, 1689–1699. [Google Scholar] [CrossRef]
  12. La Rosa1, A.D.; Grammatikos, S.A. Comparative life cycle assessment of cotton and other natural fibers for textile applications. Fibers 2019, 7, 101. [Google Scholar] [CrossRef] [Green Version]
  13. Laitala, K.; Klepp, I.G.; Henry, B. Use phase of wool apparel: A literature review for improving LCA. Prod. Lifetimes Environ. 2017, 202–207. [Google Scholar] [CrossRef]
  14. Oelerich, J.; Bijleveld, M.; Bouwhuis, G.H.; Brinks, G.J. The life cycle assessment of cellulose pulp from waste cotton via the SaXcellTM process. IOP Conf. Ser. Mater. Sci. Eng. 2017, 254, 192012. [Google Scholar] [CrossRef]
  15. Sandin, G.; Peters, G.M.; Svanström, M. Moving down the cause-effect chain of water and land use impacts: An LCA case study of textile fibres. Resour. Conserv. Recycl. 2013, 73, 104–113. [Google Scholar] [CrossRef]
  16. Shen, L.; Worrell, E.; Patel, M.K. Environmental impact assessment of man-made cellulose fibres. Resour. Conserv. Recycl. 2010, 55, 260–274. [Google Scholar] [CrossRef]
  17. Esteve-Turrillas, F.A.; de la Guardia, M. Environmental impact of Recover cotton in textile industry. Resour. Conserv. Recycl. 2017, 116, 107–115. [Google Scholar] [CrossRef]
  18. Van Der Velden, N.M.; Patel, M.K.; Vogtländer, J.G. LCA benchmarking study on textiles made of cotton, polyester, nylon, acryl, or elastane. Int. J. Life Cycle Assess. 2014, 19, 331–356. [Google Scholar] [CrossRef]
  19. van der Werf, H.M.G.; Turunen, L. The environmental impacts of the production of hemp and flax textile yarn. Ind. Crops Prod. 2008, 27, 1–10. [Google Scholar] [CrossRef]
  20. Chico, D.; Aldaya, M.M.; Garrido, A. A water footprint assessment of a pair of jeans: The influence of agricultural policies on the sustainability of consumer products. J. Clean. Prod. 2013, 57, 238–248. [Google Scholar] [CrossRef] [Green Version]
  21. Morita, A.M.; Moore, C.C.S.; Nogueira, A.R.; Kulay, L.; Ravagnani, M.A.D.S.S. Assessment of potential alternatives for improving environmental trouser jeans manufacturing performance in Brazil. J. Clean. Prod. 2020, 247. [Google Scholar] [CrossRef]
  22. Lenzo, P.; Traverso, M.; Mondello, G.; Salomone, R.; Ioppolo, G. Sustainability Performance of an Italian Textile Product. Economies 2018, 6, 17. [Google Scholar] [CrossRef]
  23. Wiedemann, S.G.; Biggs, L.; Nebel, B.; Bauch, K.; Laitala, K.; Klepp, I.G.; Swan, P.G.; Watson, K. Environmental impacts associated with the production, use, and end-of-life of a woollen garment. Int. J. Life Cycle Assess. 2020, 25, 1486–1499. [Google Scholar] [CrossRef]
  24. Kazan, H.; Akgul, D.; Kerc, A. Life cycle assessment of cotton woven shirts and alternative manufacturing techniques. Clean Technol. Environ. Policy 2020, 22, 849–864. [Google Scholar] [CrossRef]
  25. Yang, Y.; He, W.; Chen, F.; Wang, L. Water footprint assessment of silk apparel in China. J. Clean. Prod. 2020, 260, 121050. [Google Scholar] [CrossRef]
  26. Baydar, G.; Ciliz, N.; Mammadov, A. Life cycle assessment of cotton textile products in Turkey. Resour. Conserv. Recycl. 2015, 104, 213–223. [Google Scholar] [CrossRef]
  27. Bech, N.M.; Birkved, M.; Charnley, F.; Kjaer, L.L.; Pigosso, D.C.A.; Hauschild, M.Z.; McAloone, T.C.; Moreno, M. Evaluating the environmental performance of a product/service-system business model for Merino Wool Next-to-Skin Garments: The case of Armadillo Merino®. Sustainability 2019, 11, 5854. [Google Scholar] [CrossRef] [Green Version]
  28. Zamani, B.; Sandin, G.; Peters, G.M. Life cycle assessment of clothing libraries: Can collaborative consumption reduce the environmental impact of fast fashion? J. Clean. Prod. 2017, 162, 1368–1375. [Google Scholar] [CrossRef]
  29. Farrant, L.; Olsen, S.I.; Wangel, A. Environmental benefits from reusing clothes. Int. J. Life Cycle Assess. 2010, 15, 726–736. [Google Scholar] [CrossRef]
  30. Roos, S.; Peters, G.M. Three methods for strategic product toxicity assessment—The case of the cotton T-shirt. Int. J. Life Cycle Assess. 2015, 20, 903–912. [Google Scholar] [CrossRef]
  31. Steinberger, J.K.; Friot, D.; Jolliet, O.; Erkman, S. A spatially explicit life cycle inventory of the global textile chain. Int. J. Life Cycle Assess. 2009, 14, 443–455. [Google Scholar] [CrossRef]
  32. van der Velden, N.M.; Vogtländer, J.G. Monetisation of external socio-economic costs of industrial production: A social-LCA-based case of clothing production. J. Clean. Prod. 2017, 153, 320–330. [Google Scholar] [CrossRef]
  33. Zhang, Y.; Liu, X.; Xiao, R.; Yuan, Z. Life cycle assessment of cotton T-shirts in China. Int. J. Life Cycle Assess. 2015, 20, 994–1004. [Google Scholar] [CrossRef]
  34. Manda, B.M.K.; Worrell, E.; Patel, M.K. Prospective life cycle assessment of an antibacterial T-shirt and supporting business decisions to create value. Resour. Conserv. Recycl. 2015, 103, 47–57. [Google Scholar] [CrossRef]
  35. Walser, T.; Demou, E.; Lang, D.J.; Hellweg, S. Prospective environmental life cycle assessment of nanosilver T-shirts. Environ. Sci. Technol. 2011, 45, 4570–4578. [Google Scholar] [CrossRef] [PubMed]
  36. Lehmann, A.; Roffeis, M.; Finkbeiner, M. Ökobilanzielle Bewertung des Lebensweges eines handelsüblichen weißen Baumwolle T-Shirts in Deutschland. Fachgebiet Sustainable Engineering (FG SEE) der TU Berlin: Berlin, Germany, 2019. [Google Scholar]
  37. Sandin, G.; Roos, S.; Peters, G. Environmental Assessment of Swedish Clothing Consumption—Six Garments, Sustainable Futures. RISE AB: Göteborg, Sweden, 2019; ISBN 9789189049055. [Google Scholar]
  38. Laitala, K.; Klepp, I.G.; Henry, B. Does use matter? Comparison of environmental impacts of clothing based on fiber type. Sustainability 2018, 10, 2524. [Google Scholar] [CrossRef] [Green Version]
  39. Laitala, K.; Boks, C.; Klepp, I.G. Potential for environmental improvements in laundering. Int. J. Consum. Stud. 2011, 35, 254–264. [Google Scholar] [CrossRef]
  40. Rana, S.; Pichandi, S.; Moorthy, S.; Bhattacharyya, A. Carbon Footprint of Textile and Clothing Products. Handb. Sustain. Appar. Prod. 2015, 128–155. [Google Scholar] [CrossRef]
  41. Yasin, S.; Behary, N.; Rovero, G.; Kumar, V. Statistical analysis of use-phase energy consumption of textile products. Int. J. Life Cycle Assess. 2016, 21, 1776–1788. [Google Scholar] [CrossRef]
  42. Centre, E. Ecoinvent Data v3.6—Recycled-Content System Model; Ecoinvent Association: Zürich, Switzerland; Available online: www.ecoinvent.org (accessed on 10 August 2020).
  43. IPCC. Climate Change 2013: The Physical Science Basis Working Group I Contribution to the Fifth Assessment Report of the Intergovernmental Panel on Climate Change; Cambridge University Press: Cambridge, UK; New York, NY, USA, 2013. [Google Scholar]
  44. Hischier, R.; Weidema, B.; Althaus, H.-J.; Bauer, C.; Doka, G.; Dones, R.; Frischknecht, R.; Hellweg, S.; Humbert, S.; Jungbluth, N.; et al. Implementation of Life Cycle Impact Assessment Methods; Swiss Centre for Life Cycle Inventories: Dübendorf, Switzerland, 2010. [Google Scholar]
  45. Boulay, A.M.; Bare, J.; Benini, L.; Berger, M.; Lathuillière, M.J.; Manzardo, A.; Margni, M.; Motoshita, M.; Núñez, M.; Pastor, A.V.; et al. The WULCA consensus characterization model for water scarcity footprints: Assessing impacts of water consumption based on available water remaining (AWARE). Int. J. Life Cycle Assess. 2018, 23, 368–378. [Google Scholar] [CrossRef] [Green Version]
  46. Frischknecht, R.; Büsser Knöpfel, S. Ökofaktoren Schweiz 2013 gemäss der Methode der ökologischen Knappheit. Methodische Grundlagen und Anwendung auf die Schweiz; BAFU: Bern, Switzerland, 2013. [Google Scholar]
  47. Hischier, R. Car vs. Packaging—A First, Simple (Environmental) Sustainability Assessment of Our Changing Shopping Behaviour. Sustainability 2018, 10, 3061. [Google Scholar] [CrossRef] [Green Version]
  48. PEFCR Product Environmental Footprint Category Rules (PEFCR)—T-Shirts. 2019, pp. 1–130. Available online: https://ec.europa.eu/environment/eussd/smgp/pdf/PEFCR_tshirt.pdf (accessed on 9 August 2020).
  49. Stamminger, R.; Schmitz, A. Washing machines in Europe–detailed assessment of consumption and performance. Tenside Surfactants Deterg. 2016, 70–86. [Google Scholar] [CrossRef]
  50. Schmitz, A.; Stamminger, R. Usage behaviour and related energy consumption of European consumers for washing and drying. Energy Effic. 2014, 7, 937–954. [Google Scholar] [CrossRef]
  51. Golsteijn, L.; Menkveld, R.; King, H.; Schneider, C.; Schowanek, D.; Nissen, S. A compilation of life cycle studies for six household detergent product categories in Europe: The basis for product-specific A.I.S.E. Charter Advanced Sustainability Profiles. Environ. Sci. Eur. 2015. [Google Scholar] [CrossRef] [PubMed] [Green Version]
  52. Kooistra, K.; Termorshuizen, A. The Sustainability of Cotton Consequences for Man and Environment; Science Shop Wageningen UR: Wageningen, The Netherlands, 2006. [Google Scholar]
  53. Babu, K.M. Natural Textile Fibres: Animal and Silk Fibres; Woodhead Publishing Limited: Cambridge, UK, 2015; ISBN 9780857095619. [Google Scholar]
  54. Sandin, G.; Roos, S.; Johansson, M. Environmental Impact of Textile Fibers–What We Know and What We Don’t know the Fiber Bible Part 2. 2019. Available online: https://www.researchgate.net/publication/331980907_Environmental_impact_of_textile_fibres_-_what_we_know_and_what_we_don’t_know_Fiber_Bible_part_2 (accessed on 4 January 2021).
  55. Pérez, J.J.B.; Queiruga-Dios, A.; Martínez, V.G.; del Rey, Á.M. Traceability of ready-to-wear clothing through blockchain technology. Sustainability 2020, 12, 7491. [Google Scholar] [CrossRef]
  56. GOTS Global Organic Textile Standard—Key Features. Available online: https://www.global-standard.org/the-standard/gots-key-features (accessed on 4 January 2021).
  57. Oeko-Tex Made in Green by Oeko-Tex. Available online: https://www.oeko-tex.com/en/our-standards/made-in-green-by-oeko-tex (accessed on 4 January 2021).
  58. Good on You Rating Brands on the Issues that Matter. Available online: https://goodonyou.eco/how-we-rate/ (accessed on 4 January 2021).
  59. Sandin, G.; Peters, G.M. Environmental impact of textile reuse and recycling—A review. J. Clean. Prod. 2018, 184, 353–365. [Google Scholar] [CrossRef]
  60. Vadicherla, T.; Saravanan, D.; Muthu Ram, M.; Suganya, K. Fashion Renovation via Upcycling. In Textiles and Clothing Sustainability; Textile Science and Clothing Technology; Muthu, S., Ed.; Springer: Singapore, 2016. [Google Scholar]
  61. Yasin, S.; Sun, D. Propelling textile waste to ascend the ladder of sustainability: EOL study on probing environmental parity in technical textiles. J. Clean. Prod. 2019, 233, 1451–1464. [Google Scholar] [CrossRef]
Figure 1. Flowchart of the production steps and use scenarios of one t-shirt. The different production steps were calculated with average global data, while the use phase scenarios were calculated for Switzerland. The use phase represents one t-shirt that was washed 44 times at 40 °C, and either air-dried or dried with a tumbler.
Sustainability 13 02498 g001
Figure 2. Relative environmental impacts of the life cycle of a cotton t-shirt. Shown are the carbon-eq, the nr-CED in MJ-eq, the water footprint in m3 water-eq, and the ecological scarcity in ecopoints for the basic use scenario (i.e., washing in a half-full washing machine at 40 °C and air-drying).
Sustainability 13 02498 g002
Figure 3. Environmental impacts of the production phase of a 154 g cotton t-shirt. Shown are the carbon footprint in CO2-eq, the nr-CED in MJ-eq, the water footprint in m3 water-eq, and the ecological scarcity in ecopoints.
Sustainability 13 02498 g003
Figure 4. Impact of the production of 264 g cotton, polyester, flax, viscose, wool, nylon, and polyacryl fibers. (A) carbon footprint; (B) nr-CED; (C) water footprint; (D) ecological scarcity.
Sustainability 13 02498 g004
Figure 5. Carbon footprint, nr-CED, water footprint, and the ecological scarcity of the various use phase scenarios for a cotton t-shirt. The yellow bar represents the basic scenario (t-shirt washed in a half-full washing machine at 40 °C) and was set at 100%.
Sustainability 13 02498 g005
Table 1. Scenarios for investigating the influence of the use phase.
ScenariosWashing TemperatureDryingFullness of Washing MachineLifetime
Basic scenario40 °CAir-dryingHalf-full44 washing cycles
Lower Washing Temperature30 °CAir-dryingHalf-full44 washing cycles
Higher Washing Temperature60 °CAir-dryingHalf-full44 washing cycles
Tumbler40 °CTumblerHalf-full44 washing cycles
Full Washing Machine40 °CAir-dryingFull44 washing cycles
T-shirt Washed Alone40 °CAir-dryingT-Shirt washed alone44 washing cycles
Lower Lifetime40 °CAir-dryingHalf-full11 washing cycles
Publisher’s Note: MDPI stays neutral with regard to jurisdictional claims in published maps and institutional affiliations.

