1. Introduction
The 21st century is called “the age of the metropolises and cities” as they become the predominant living environments of human beings [
1,
2,
3]. Nonetheless, what has historically been termed a “city” is an obsolete concept that comes from the ancient idea of the “city” in opposition to the wild rural and natural environment [
4]. Nowadays, the urban phenomenon is much more “pervasive,” and the character of urban areas has extended to dense and less dense metropolitan areas, both in the megalopolis and in the countryside [
5]. Approximately 75% of the European population lives in urban environments, and a quarter of the European’s land surface has been directly affected by urbanization [
6]. “Planetary urbanization” is the term used by Nail Brenner [
7] to define the end of specific dichotomies (urban/rural, center/periphery, nature/society) that have characterized territorial analysis and urban planning theories since the nineteenth century [
4]. Philosophically, Brenner’s proposal follows the views of “modern liquidity” made by Bauman. The intrinsic condition of modernity is the abandonment of dialectical, physical, social, and geographical categories that “shaped” the inductive/deductive comprehension of the world, and thereby his regulation. The translation of this “approach” into the practices of metropolitan systems’ governance puts forward radical innovations in the way and the speed it has conceived the interpretation and the formal classification of territories, societies, their political and economic representation and power, and the possibility for transformations.
Terms such as urban expansion, diffusion, dispersion, and relative patterns (radial urbanization, discontinued urbanization, leapfrogged urbanization, or jeopardized urbanization), including “sprawl” or “sprinkling” [
8,
9,
10], still refer to what, to some extent, can be viewed and classified by using a temporal “metric”, hence a hierarchical interpretation, and ultimately a modern view of space. The post-modern interpretation requires more dynamic and fast measurements and classifications, assuming that the urban phenomena is everywhere, without boundaries, with new metrics and categories, and furthermore, without a clear hierarchy, rational relations, or linear networks [
11].
This assumption makes our understanding of metropolitan dynamics more complex and self-adaptive while considering, for instance, that metropolises attract economies and people but also are extremely exposed to the climatic, health, social, and economic hazards that affect global and local economies.
Metropolitan areas are vulnerable systems for their intrinsic dense and interconnected nature. The experience from the COVID-19 crisis teaches how an epidemic emergency cannot be handled by local approaches alone and with the use of isolated “red zones” when the exchange of people and goods is the normal living condition of urban and metropolitan systems. Therefore, the governance of these systems needs to be reconsidered to reflect on how they should be managed, directed, and transformed to become more adaptive and resilient. It should also entail an interdisciplinary and integrated view, taking into account the economic, social, and environmental aspects/contexts [
12,
13].
Having assumed these premises, it is clear that post-modern cities need to be observed and governed using advanced technologies, updated data, and an ongoing environmental monitoring approach that classifies and assesses the “just-in-time” changes in land use composition (land use and land cover (LULC)).
In this perspective, the first initiative to construct a pan-European LULC dataset available to EU countries, the Corine Land Cover Program [
14,
15,
16], launched a new era of land monitoring based on satellite images that showed how accessibility, comparability, classification, accuracy, and geometric precision of LULC dataset [
17] is crucial to set environmental policies and strategies against climate change.
Nonetheless, Corine Land Cover soon became a limited dataset in addressing the need to quantify, in a detailed manner, the state and the speed of changes due to the long temporal production of data and the basic definition of the polygonal geometry while defining a common classification accuracy at the sub-national scale, leaving room for local thematic specifications for European regions [
18].
The unpredictable speed of change that shaped cities during recent years radically altered the balance between built and unbuilt land while highlighting the need to obtain a constant, updated, and reliable land monitoring system based on low-cost, accessible, and easy-to-classify satellite images.
The Copernicus Program, previously known as Global Monitoring for Environment and Security, is the European Union’s Earth observation program [
19] that offers different services. The land monitoring service provides a catalog of resources employed to build geographical information on land cover and its changes for terrestrial environmental applications. Copernicus Sentinel Data are nowadays fully accessible and downloadable by Data Integration and Analysis System (DIAS) platforms with a potential definition of user’s customizable solutions for diverse requirements. This innovation in the data access technology allows different users to easily extract Earth products while auto-producing informative layers such as the LULC or other real-time earth indexes.
It is well-known that the largest majority of environmental assessments (ranging from regional/landscape to urban and district-scale) are based on LULC data and even the biophysical modeling of ecosystem services (ESs) is largely based on LULC input [
20,
21,
22]. The utilization of geographic information system (GIS) for environmental modeling is, from McHarg to now [
23,
24], dependent on the land’s baseline status and its comparable properties. Even the different approaches to reduce the environmental effects of land-use changes such as the de-sprawl, the definition of urban growth boundaries, the land-take limitation/compensation, re-naturalization, and even the adoption of nature-based solutions are all based on a baseline classification of the land status.
The research question here is if medium-skilled practitioners can access, construct, and evaluate a real-time environmental monitoring dashboard to support policy while assisting the decision-making processes in urban planning with updated land products. Within this study, a supervised classification sampling has been applied to a Sentinel-2 L2A image downloaded from the ONDA-DIAS (
https://www.onda-dias.eu/cms/ (accessed on 2 December 2020) the service provided by Copernicus for the European Union’s Earth Observation Programme) website using as an area of interest the southern metropolitan catchment of Turin, including the main city. The supervised classification has been used to build two products—a LULC and a Normalized Difference Vegetation Index (NDVI). The two datasets were employed to classify the environment’s status at a double scale—a comparative metropolitan analysis between municipalities and an urban district scale assessing the health of public green areas. Both evaluations are employed to discuss gray-to-green strategies and policies while selecting adequate intervention and nature-based solutions.
This process’s main innovation regards automatizing the procedure from the download of data using cloud services to automatic processing by GIS model-builder processes while solving the problem of obtaining an updated LULC dataset and creating a real-time dashboard for environmental monitoring.
The paper is structured as follows:
Section 2 refers to the description of the methodology and data processing to obtain LULC, NDVI, and ES modeling,
Section 3 presents the results of elaborated products at the metropolitan and urban scale,
Section 4 discusses the results against strategies and solutions to mitigate environmental decay, and
Section 5 concludes the work with a synthesis of main goals and main innovations.
2. Materials and Methods
2.1. The Area of Interest
The original LULC used for ES modeling and NDVI creation purposes spans 182,284.28 hectares, covering the main city of Turin and the southern rural landscape until the Metropolitan City’s administrative limits. The northern and eastern limits are imposed by the cut-off margins between the adjacent vertical orbits originally downloaded from Copernicus images. In contrast, in the southern and western boundaries, the image has been resized using administrative limits due to the need to reduce image processing and ES modeling time.
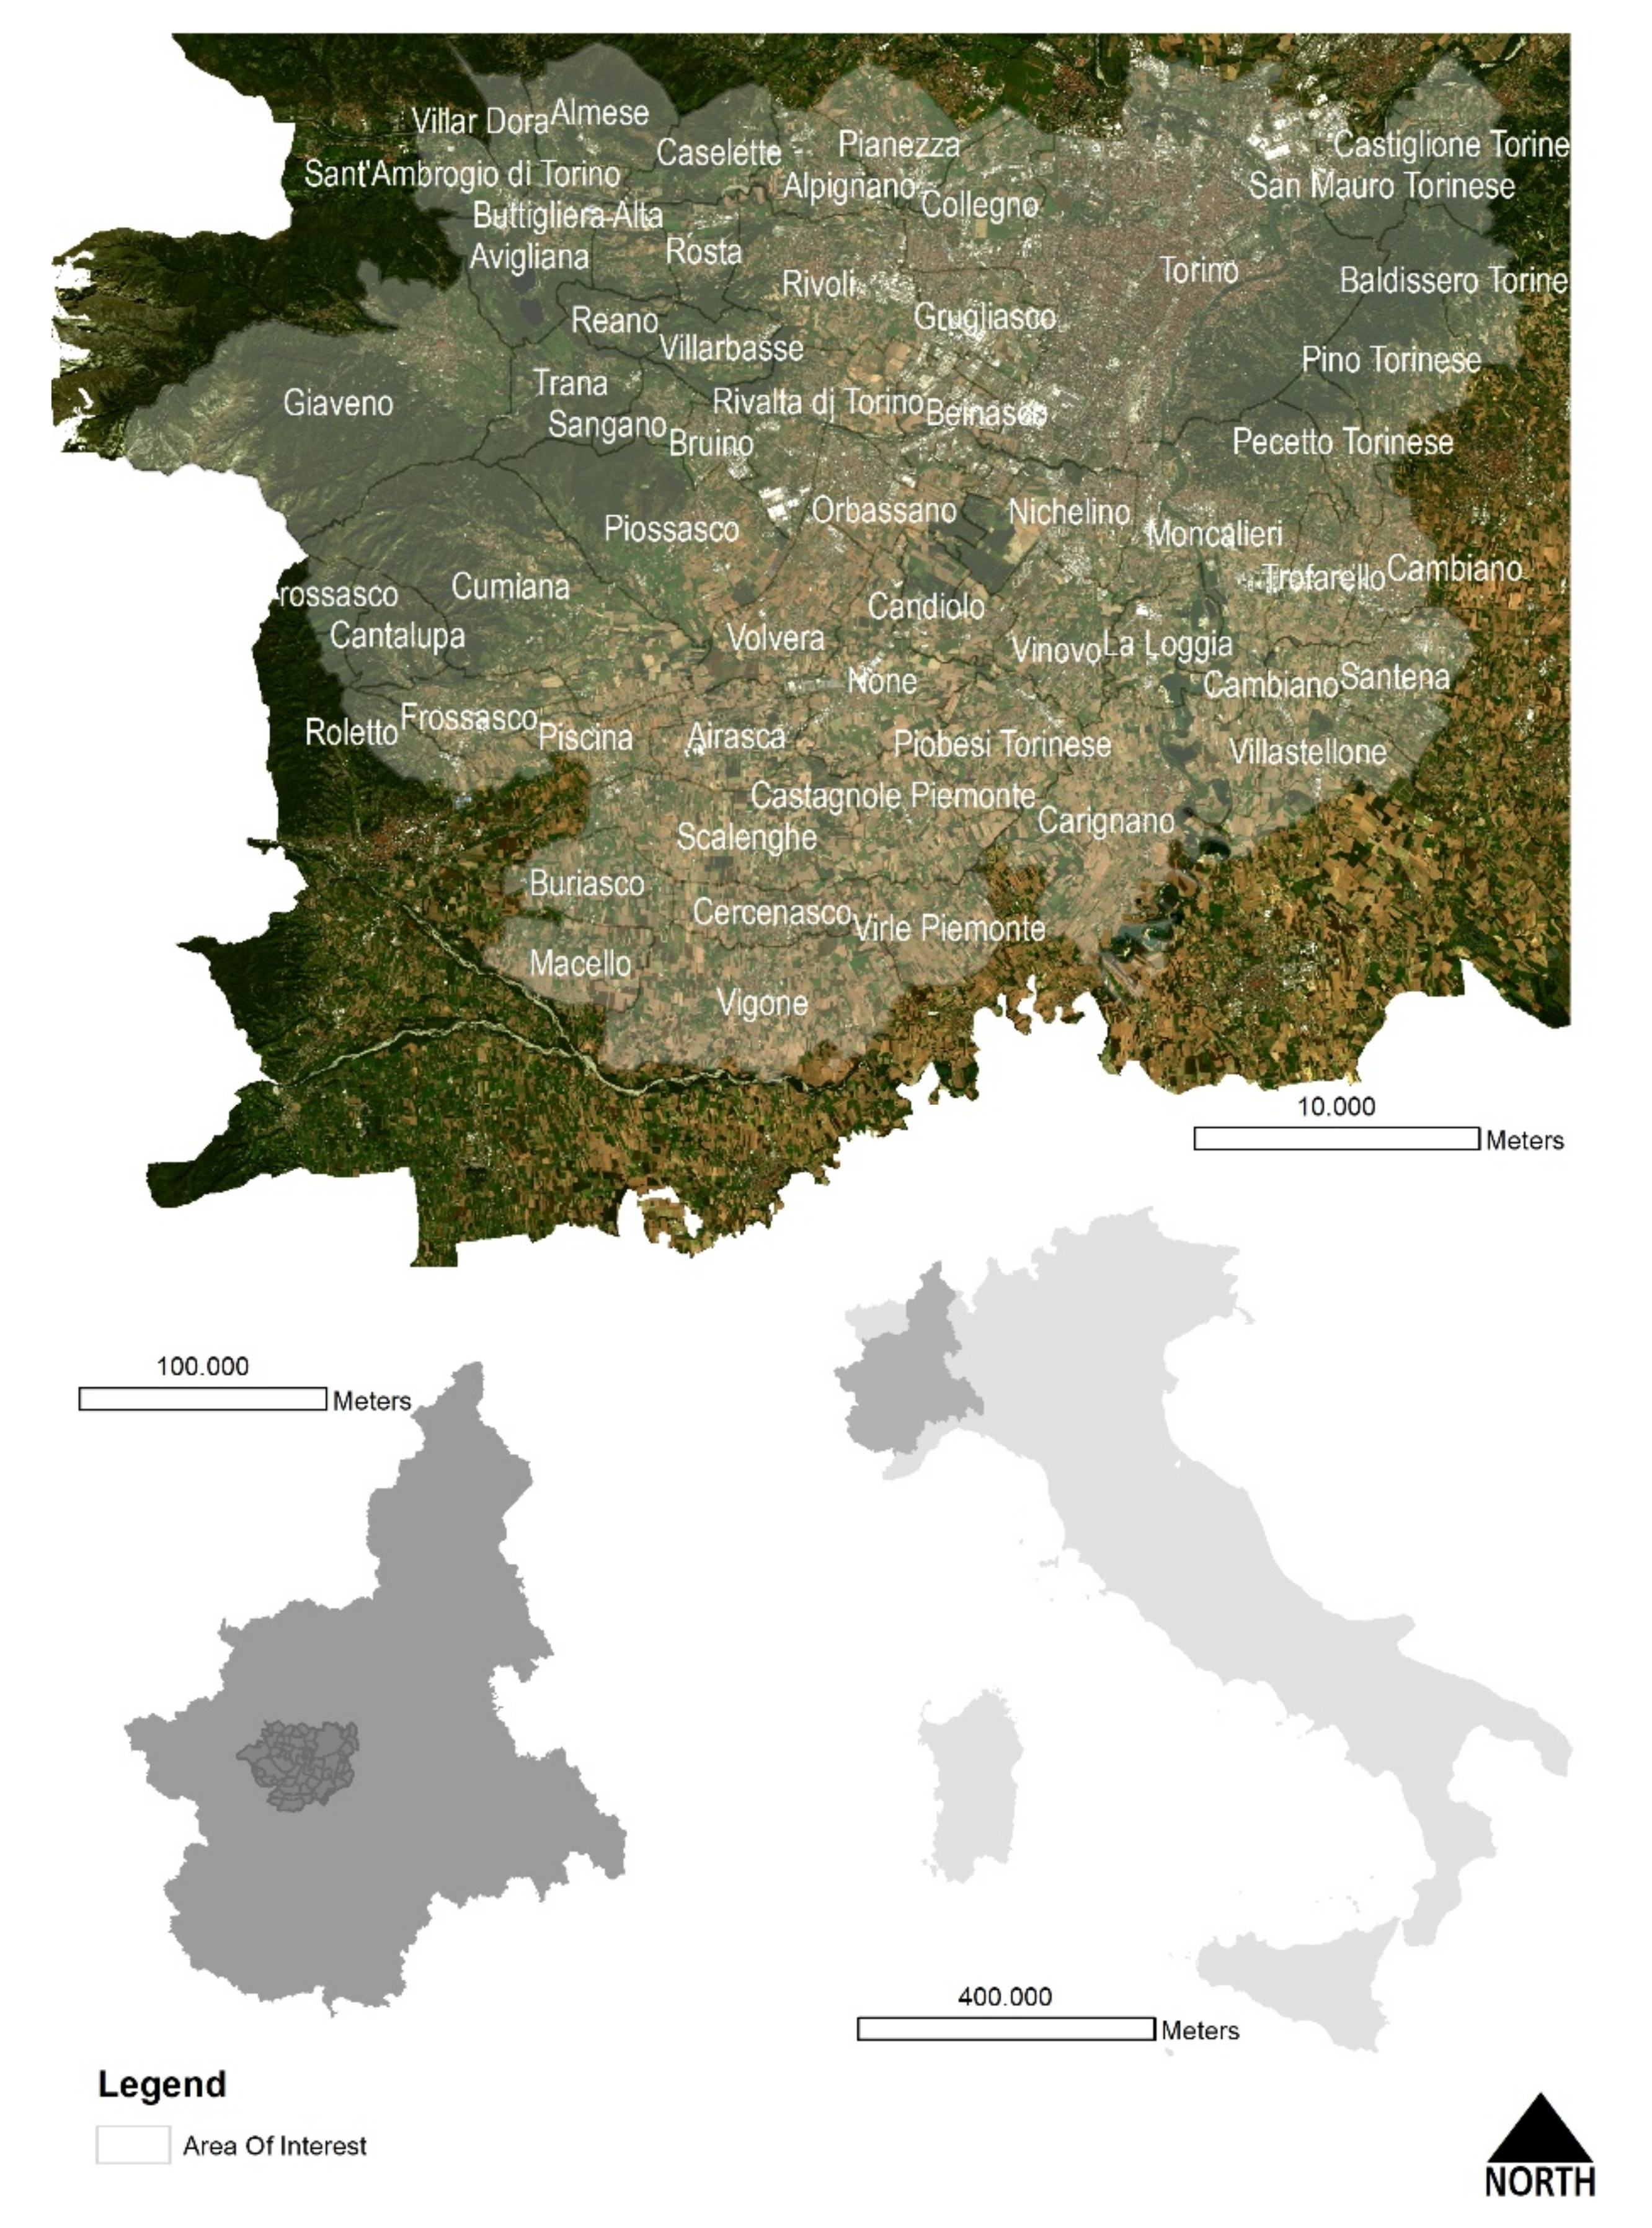
The area of interest (AOI) used for final calculations and considerations in the results and discussion sections is a portion of the original downloaded image, spanning 115,303.88 hectares, to avoid typical edge effects produced by modeling inputs near LULC borders (see
Figure 1). Nevertheless, the AOI represents a large part of the metropolitan territory of Turin that ranges from the dense city settlement of Turin and its neighborhoods to the minor sparse rural settlements in the near countryside both in plain and hilly (east) and pre-Alpine morphologies (west) [
25,
26].
This portion of land is characterized by a heterogeneous morphological condition, with huge natural systems in the hilly and mountain parts, and a comprehensive agricultural system developed along the Po riverbanks and its tributaries. The southern part of Turin is characterized by good high-fertile soil with high crop productivity while including several important peripheral towns and villages located in a typical rural or pre-Alpine environment that benefits from their relative proximity within the main city (30 km of distance), such as the municipalities of Almese, Giaveno, Roletto, Macello, or Villastellone.
Comprehensively, the AOI includes 54 municipalities of the Metropolitan Administrative Authority, thus representing a major part of the metropolitan administrative subdivision while having all the characteristics selected as a representative test site for the research purposes.
2.2. Supervised Classification of LULC
On 10 October 2020, a personal user’s account has been created to access Copernicus Services. The first operation concerned searching and downloading from the Copernicus website ONDA-DIAS a Sentinel-2 L2A image that covered an AOI including the main city of Turin. To do so, a selection of the Copernicus products has been applied manually selecting the city of Turin in the geographical dashboard of the website, while the research query “L2” has been inputted in the product list. A visual selection of the most recent cloud-free image has been applied while using the preview function of the website dashboard. The selected image “S2A_MSIL2A_20200928T102031_N0214_R065_T32TLQ_20200928T13181” has been obtained on 28 September 2020, with a ground resolution of 10 m per pixel (see
Table 1).
Table 1 shows that the selected product is a multispectral image acquired on 28 September and archived the following day with a second-processing level with a total weight of 1.10 gigabytes. The ground information (footprint) covers a multi-polygon area that spans between the following geodetic points: 7.74888294664043 44.1585153096049,9.12207449093611 44.1653012748966,9.12416639718779 45.153769755991,7.72745034166859 45.1467471878356,7.74888294664043 44.1585153096049.
Being a multispectral product, the band composition is detailed in
Table 2, which has been fundamental to apply the supervised sampling and the NDVI processing while using the most representative combination of bands for image classification.
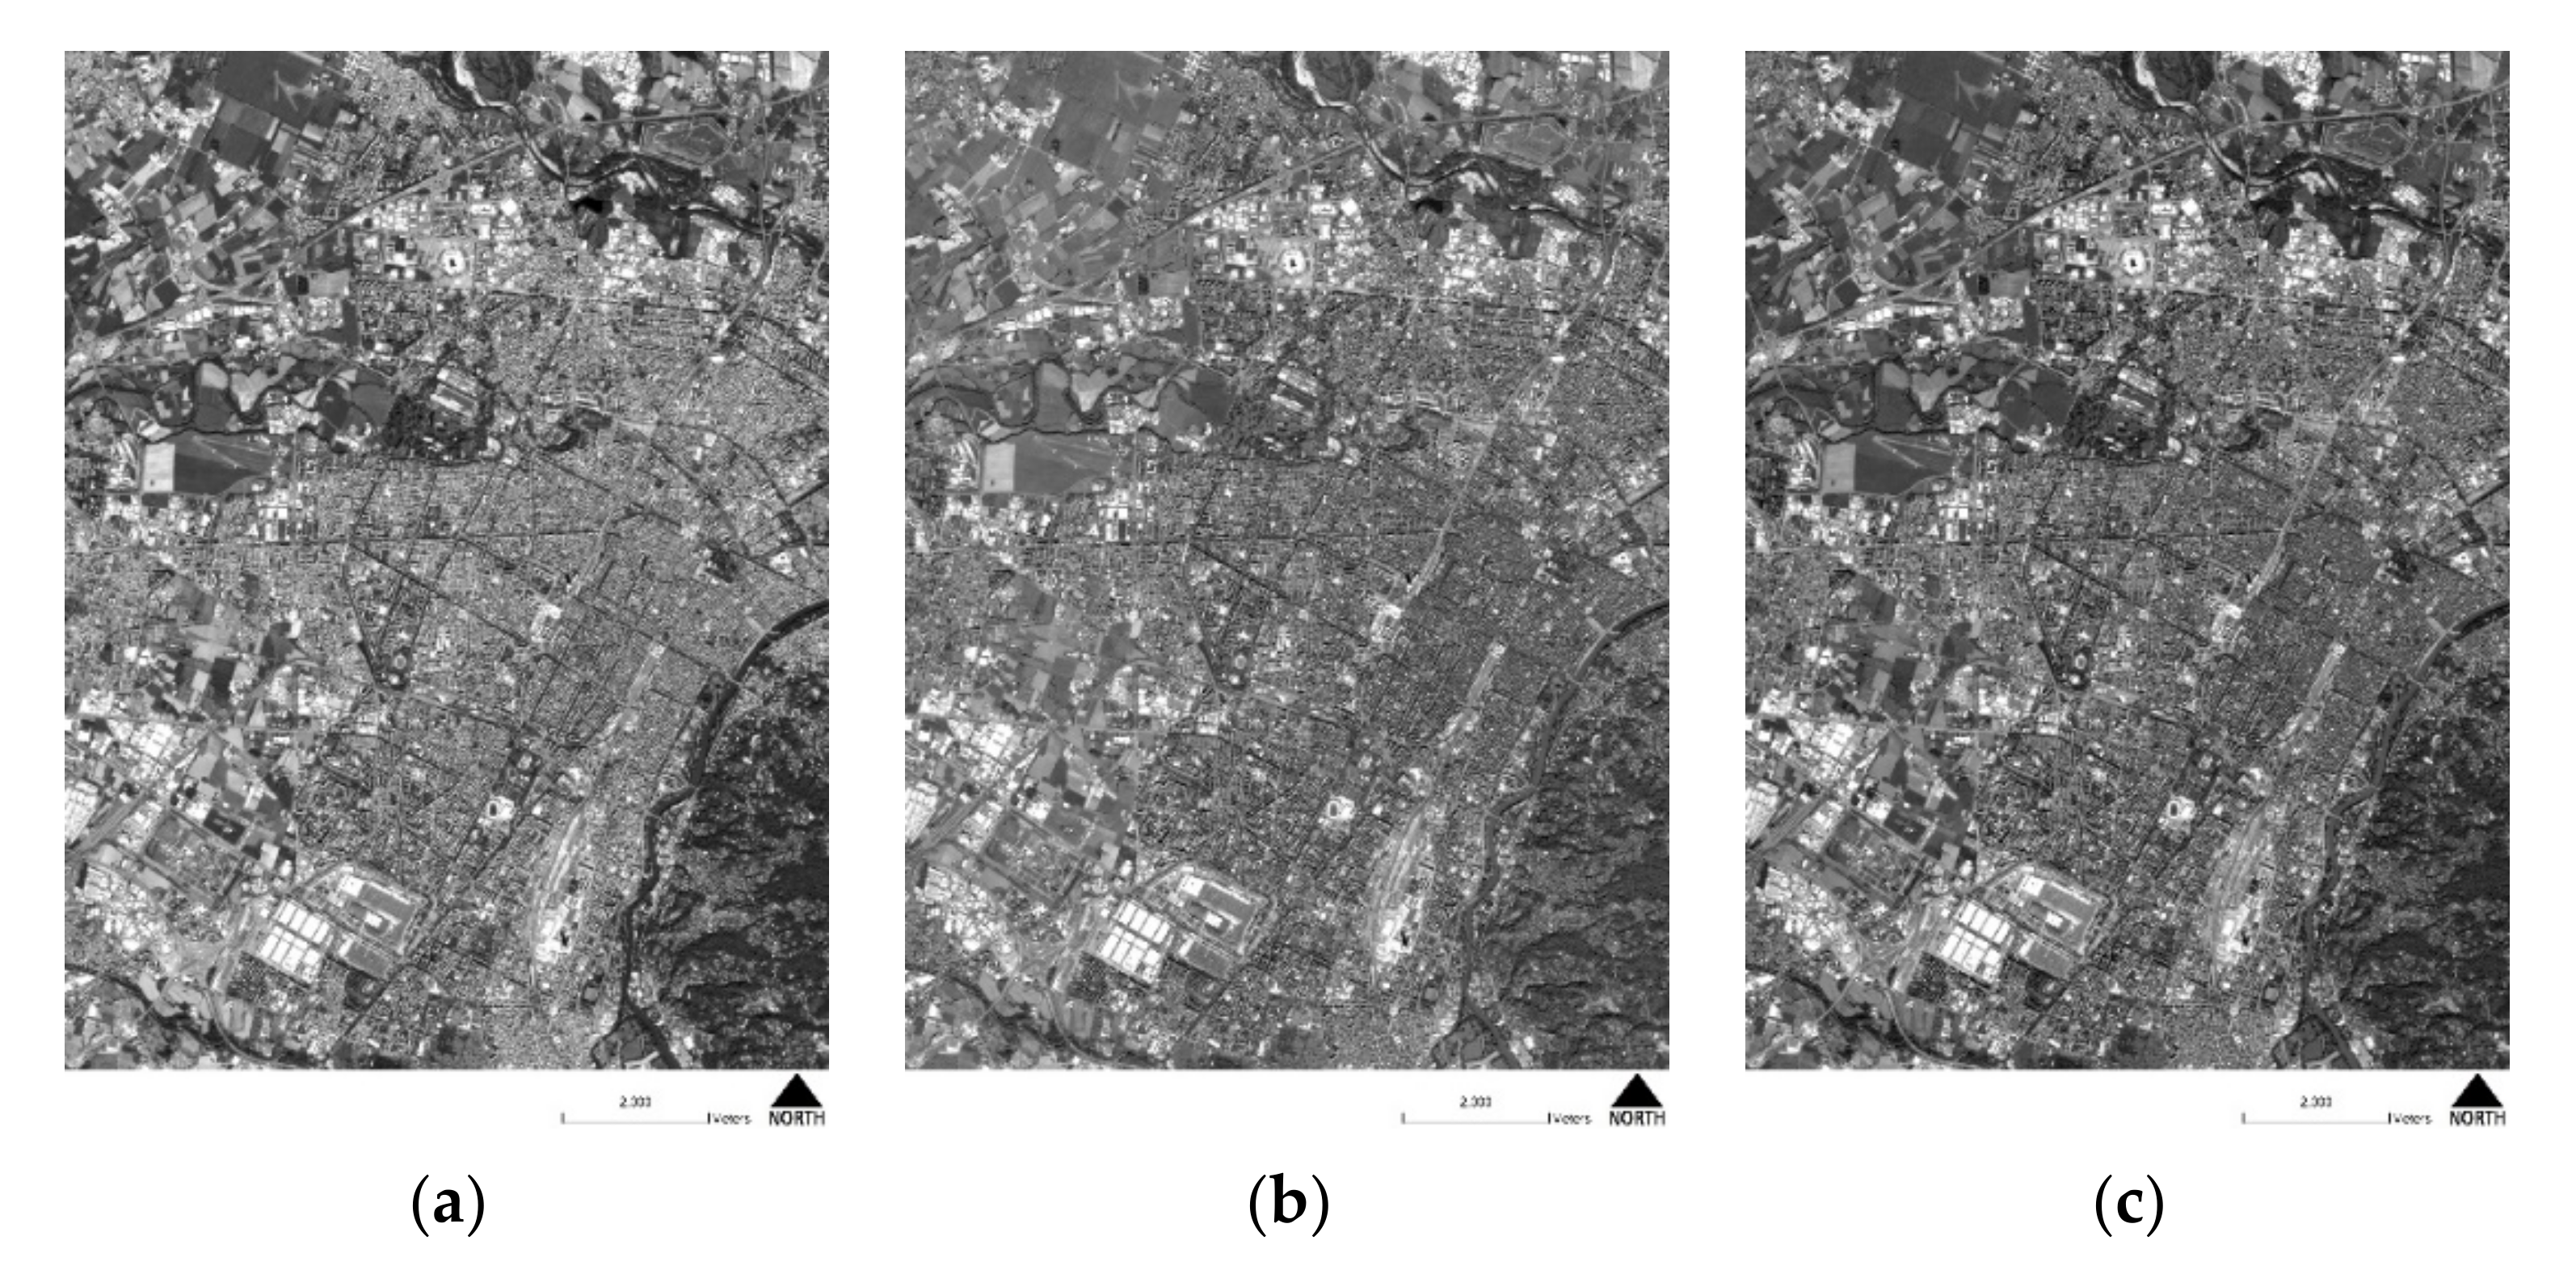
Table 2 shows that the original image is divided into different single bands with pixel values ranging from 0 to 255 (See
Figure 2). The bands collected in the composite layer were the following:
Band 2;
Band 3;
Band 4;
Band 8;
Band 12;
Band 11.
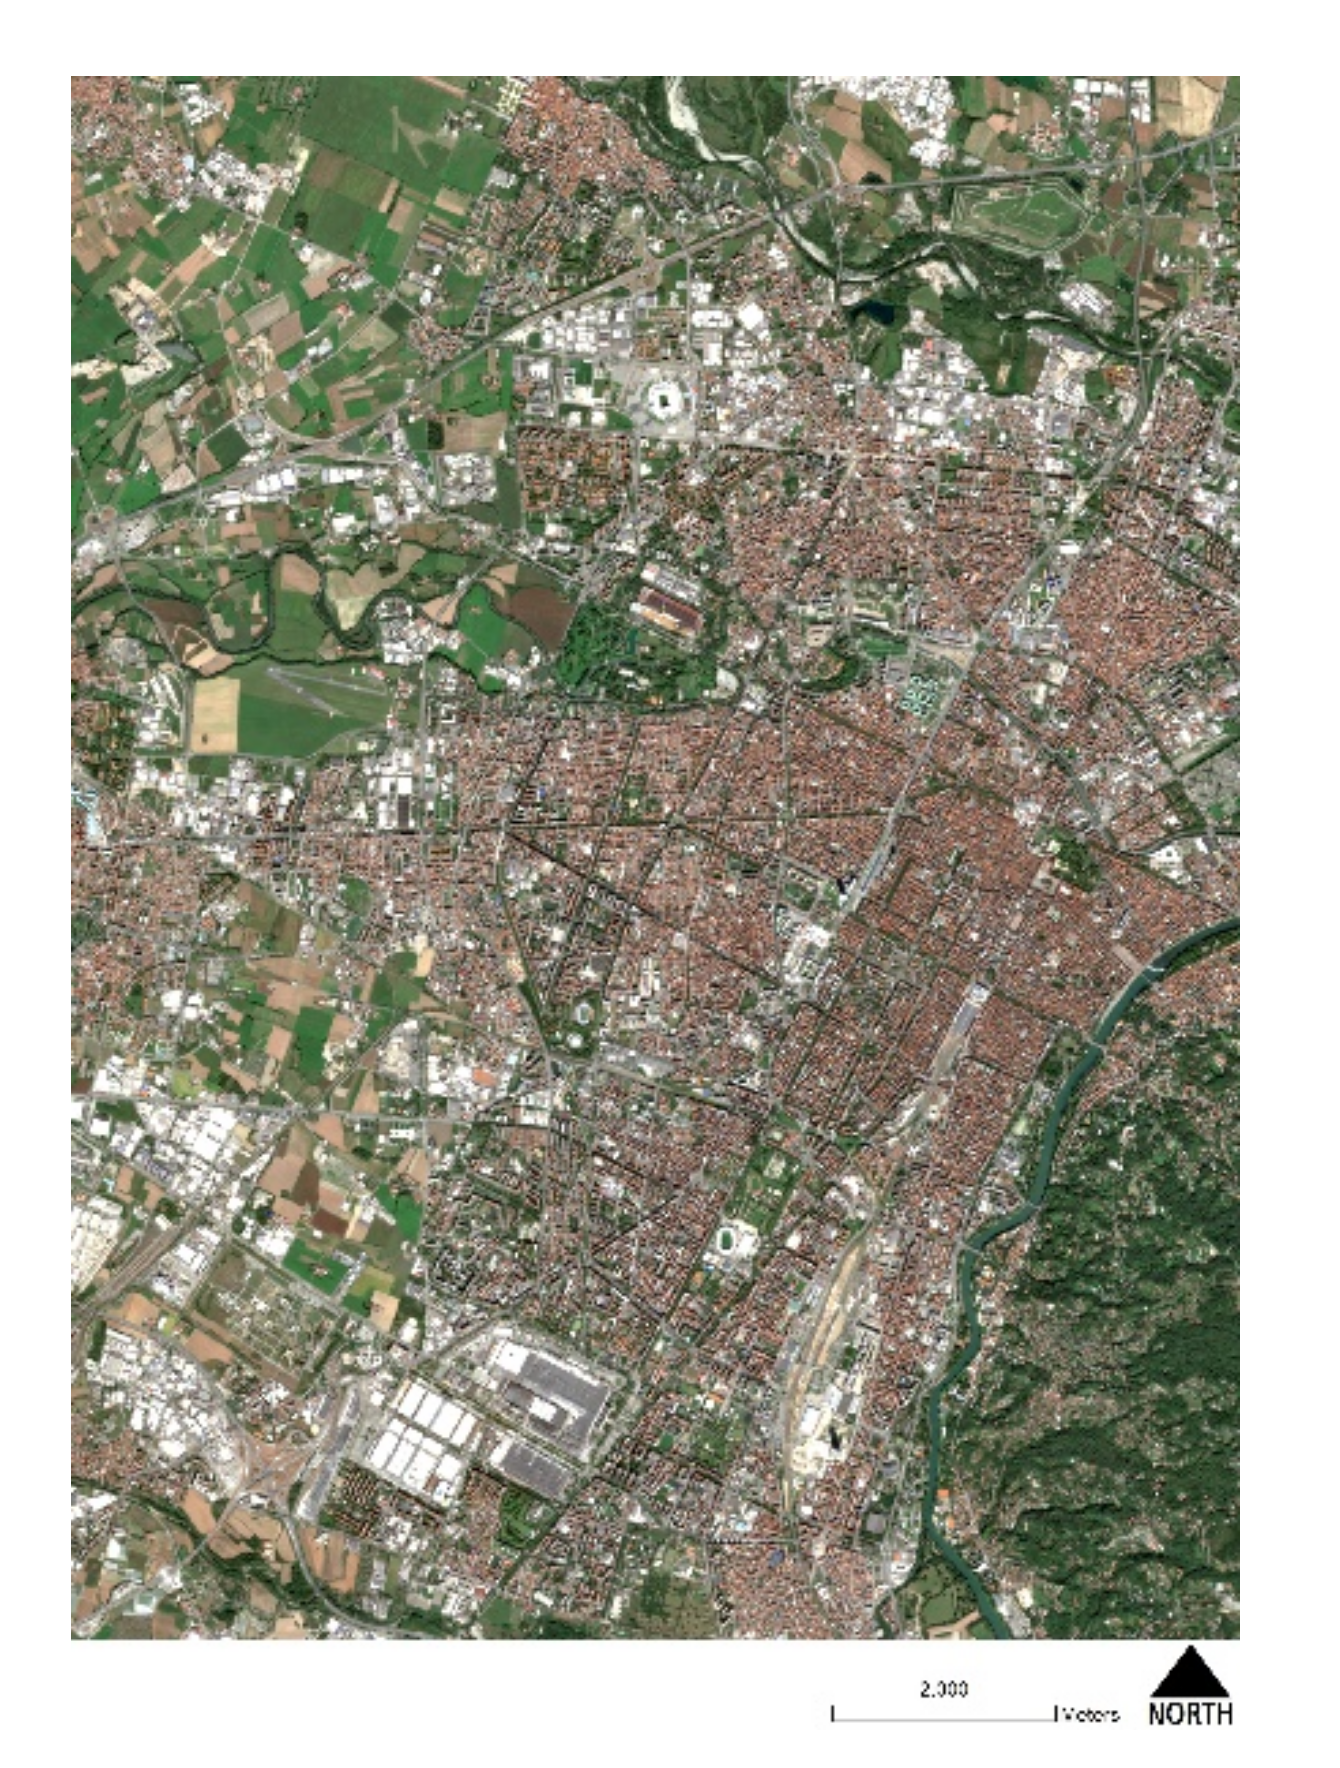
Therefore, the composite band’s tool has been used to convert a single band to a typical three-band (color) image with all red, green, and blue visible layers.
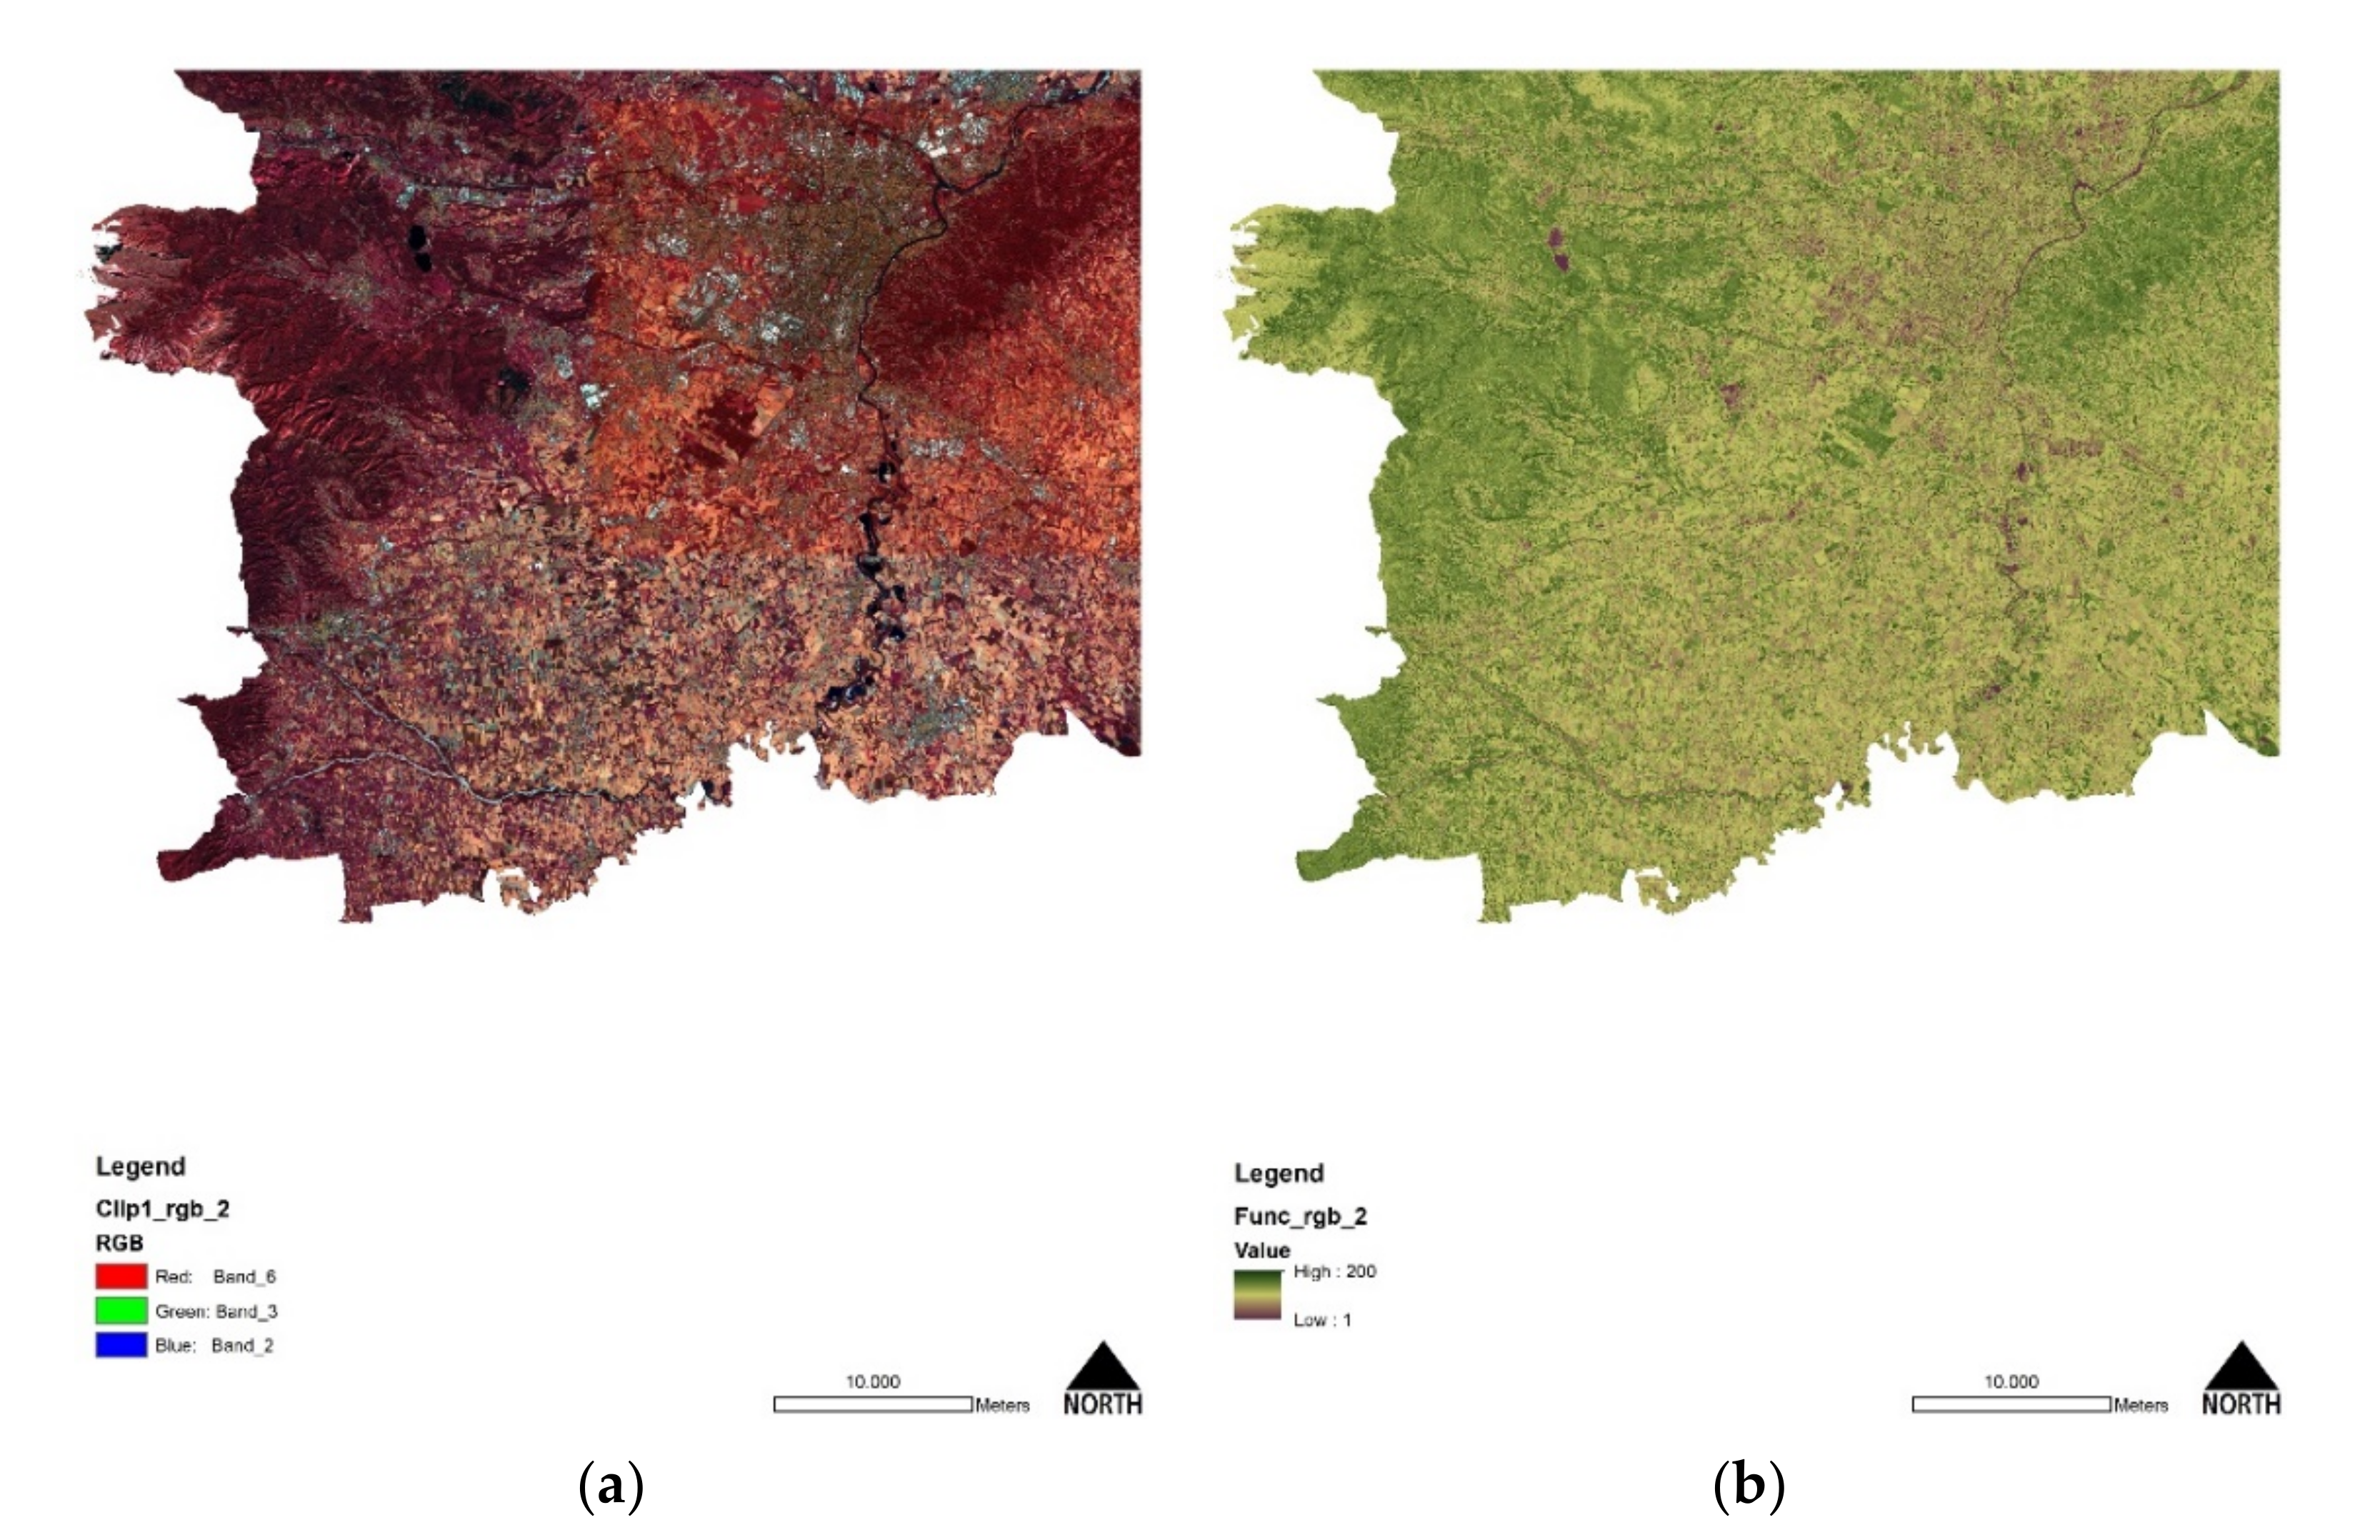
Figure 3 shows the processing output.
Additionally, Bands B8, B11, and B12 were also used to obtain different combinations during classification:
Natural Color (B4, B3, B2)
Color Infrared (B8, B4, B3)
Agriculture (B11, B8, B2)
These band combinations were revealed to be fundamental for defining sample clusters during supervised classification. The infrared and agriculture band combinations were much more useful for making visible differences between urban and non-urban pixel clusters while emphasizing the contrast between the bare agricultural lands in open fields from naturally vegetated land.
The sample collection took several days, and it has been crucial to set an adequate number of land use classes for defining the desirable number of LULC classifications in the catchment area.
For an ecosystem service (ES) mapping purpose, the classification of land use classes has been made by clipping the composite band image with the administrative boundary of the Metropolitan City of Turin; then launching the tool “image classification” and finally starting the classification of samples by the “training sample manager.” The following eight land use land cover (LULC) classes were detected by 71 sampling features:
Urban (6 samples);
Industry/High Impermeable Urban Layers (4 samples);
Streets (5 Samples);
Barren Land (6 Samples);
Grassland (4 Samples);
Agricultural Land (26 Samples);
Natural Land (5 Samples);
Water (15 Samples).
It is worth mentioning that the classification of agricultural land, due to its huge heterogeneity, has been the more problematic since the automatic classification often creates a mismatch between natural features or bare urban lands or industrial semi-compacted areas. Nonetheless, the classification by sample addition is often useful to solve these issues while obtaining a final visually reliable result.
2.3. Modeling of Habitat Quality Ecosystem Service Using InVEST
The Integrated Evaluation of Ecosystem Service and Tradeoff (InVEST) provided by the Natural Capital Program is an open-source suite of tools designed to meet the needs of public administrators, urban planners, soil scientists, and researchers of mapping ecosystem services while directly visualizing the biophysical od economic value of natural capital in a GIS environment. Among the many ES mapping software, InVEST has been widely diffused and shared among researchers for its simplicity, accessibility, and usability, having an online user’s guide that provides information and practical rules for model’s functioning [
27,
28,
29].
One of the most used models is the Habitat Quality suite, which is the basic tool that covers the supporting ES category [
30,
31,
32,
33]. For this study, this model has been employed to measure the “health” of the built and unbuilt environment in the AOI, thus assuming the Habitat Quality index (which is a relative index ranging from 0 to 1 in the AOI) as a proxy of the overall environmental condition of the context.
The inputs of the model are four, which include a raster image with the LULC classification, a raster image of habitat threats, the table of threats that assign a weight to each identified threat (see
Table 3), and a sensitivity table for each LULC to the selected threats (see
Table 4).
While the raster inputs are the product of the above-described LULC product by supervised classification sampling method, the values of input tables (
Table 3 and
Table 4) were assigned using the already acquired experience of modeling in this AOI during the LIFE Soil Administration Model 4 Community Profit research conducted during 2015–2018 [
29,
34].
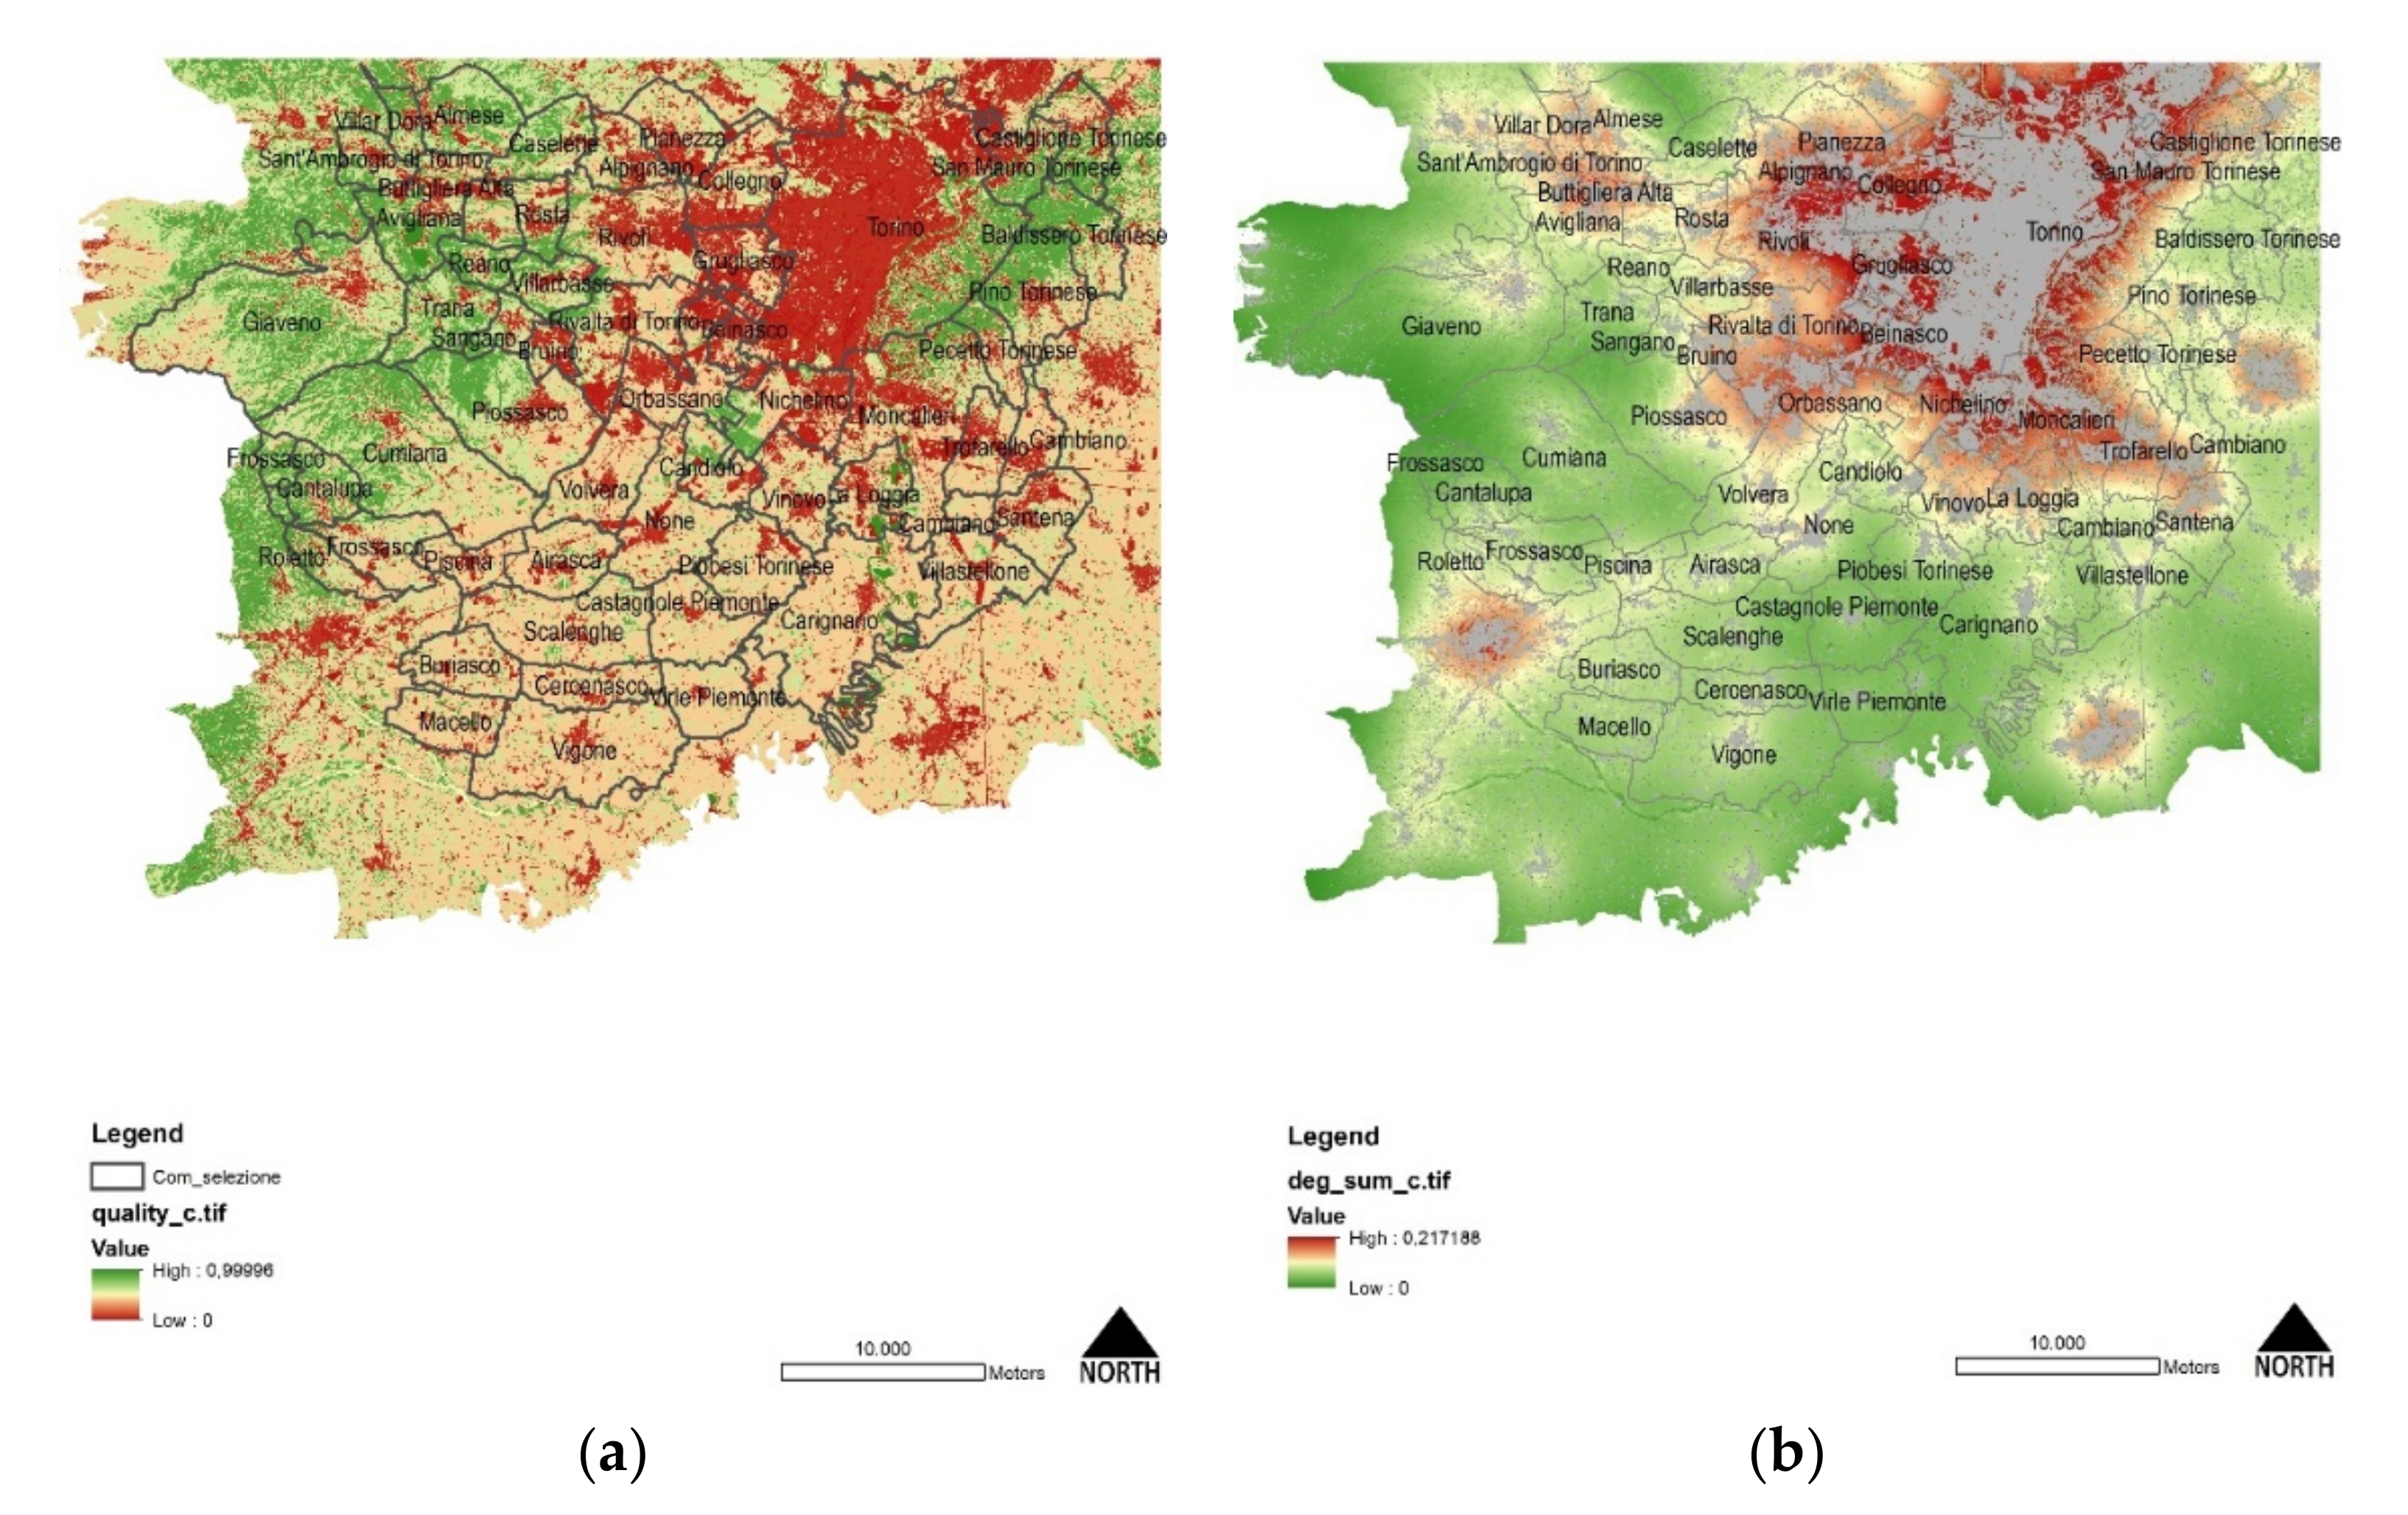
The model’s output consists of two rasters—the quality and the decay and of habitats in the AOI (see
Figure 4), represented from red to green colors.
2.4. Production of NDVI
The NDVI has been recently diffused into ordinary environmental research due to its properties of detecting the consistency of vegetation by using near-infrared (reflected by vegetation) and red light (absorbed by the plant) [
35]. Healthy vegetation reflects green light (near-infrared) compared to other wavelengths, while red and blue lights are absorbed. The index covers all kinds of land uses, giving an accurate description of dense and healthy vegetation on each land-use class type.
This product has been originally used to monitor forest productivity and health of natural or semi-natural areas or consider plant growth while maximizing soil productivity in an open field for agricultural efficiency [
36,
37]. Nowadays, the NDVI is massively used to monitor the health of urban areas due to this indicator’s capacity to detect the consistency of vegetation canopy even in small permeable areas, although not on small private spaces (building courts) or green roofs [
29].
The procedure to transform the original multiband layers to a single band layer with NDVI properties has been conducted by selecting the “image analysis” tool while processing a new temporary raster file by the NDVI function. The infrared (B12) and red-visible (B4) bands (see
Table 2) were selected to produce the final output (see
Figure 5).
3. Results
3.1. The LULC Classification
LULC classification has been conducted using the eight land-use classes (Urban, Streets, Industry, Barren Land, Natural Land, Agriculture Land, Grassland, Water) that performed the highest accuracy, having assumed (i) the barely limited resolution of the original raster image (10m) and (ii) the purpose of using the LULC for ES mapping. Therefore, adding more LULC classes was unproductive due to the potential mismatch in classification with a group of pixels with similar values.
Overall, the result has been initially visually checked against the ESRI ArcGis Imagery Basemap imported in the project, resulting in being acceptable because there was no similar dataset for immediate comparison.
Nonetheless, to check the output of classification, the auto-produced LULC has been superimposed to the National Land Use Dataset of ISPRA (Carta Nazionale di Copertura del Suolo) of 2017, which is the environmental baseline for land use change detection from national to regional level [
38,
39,
40].
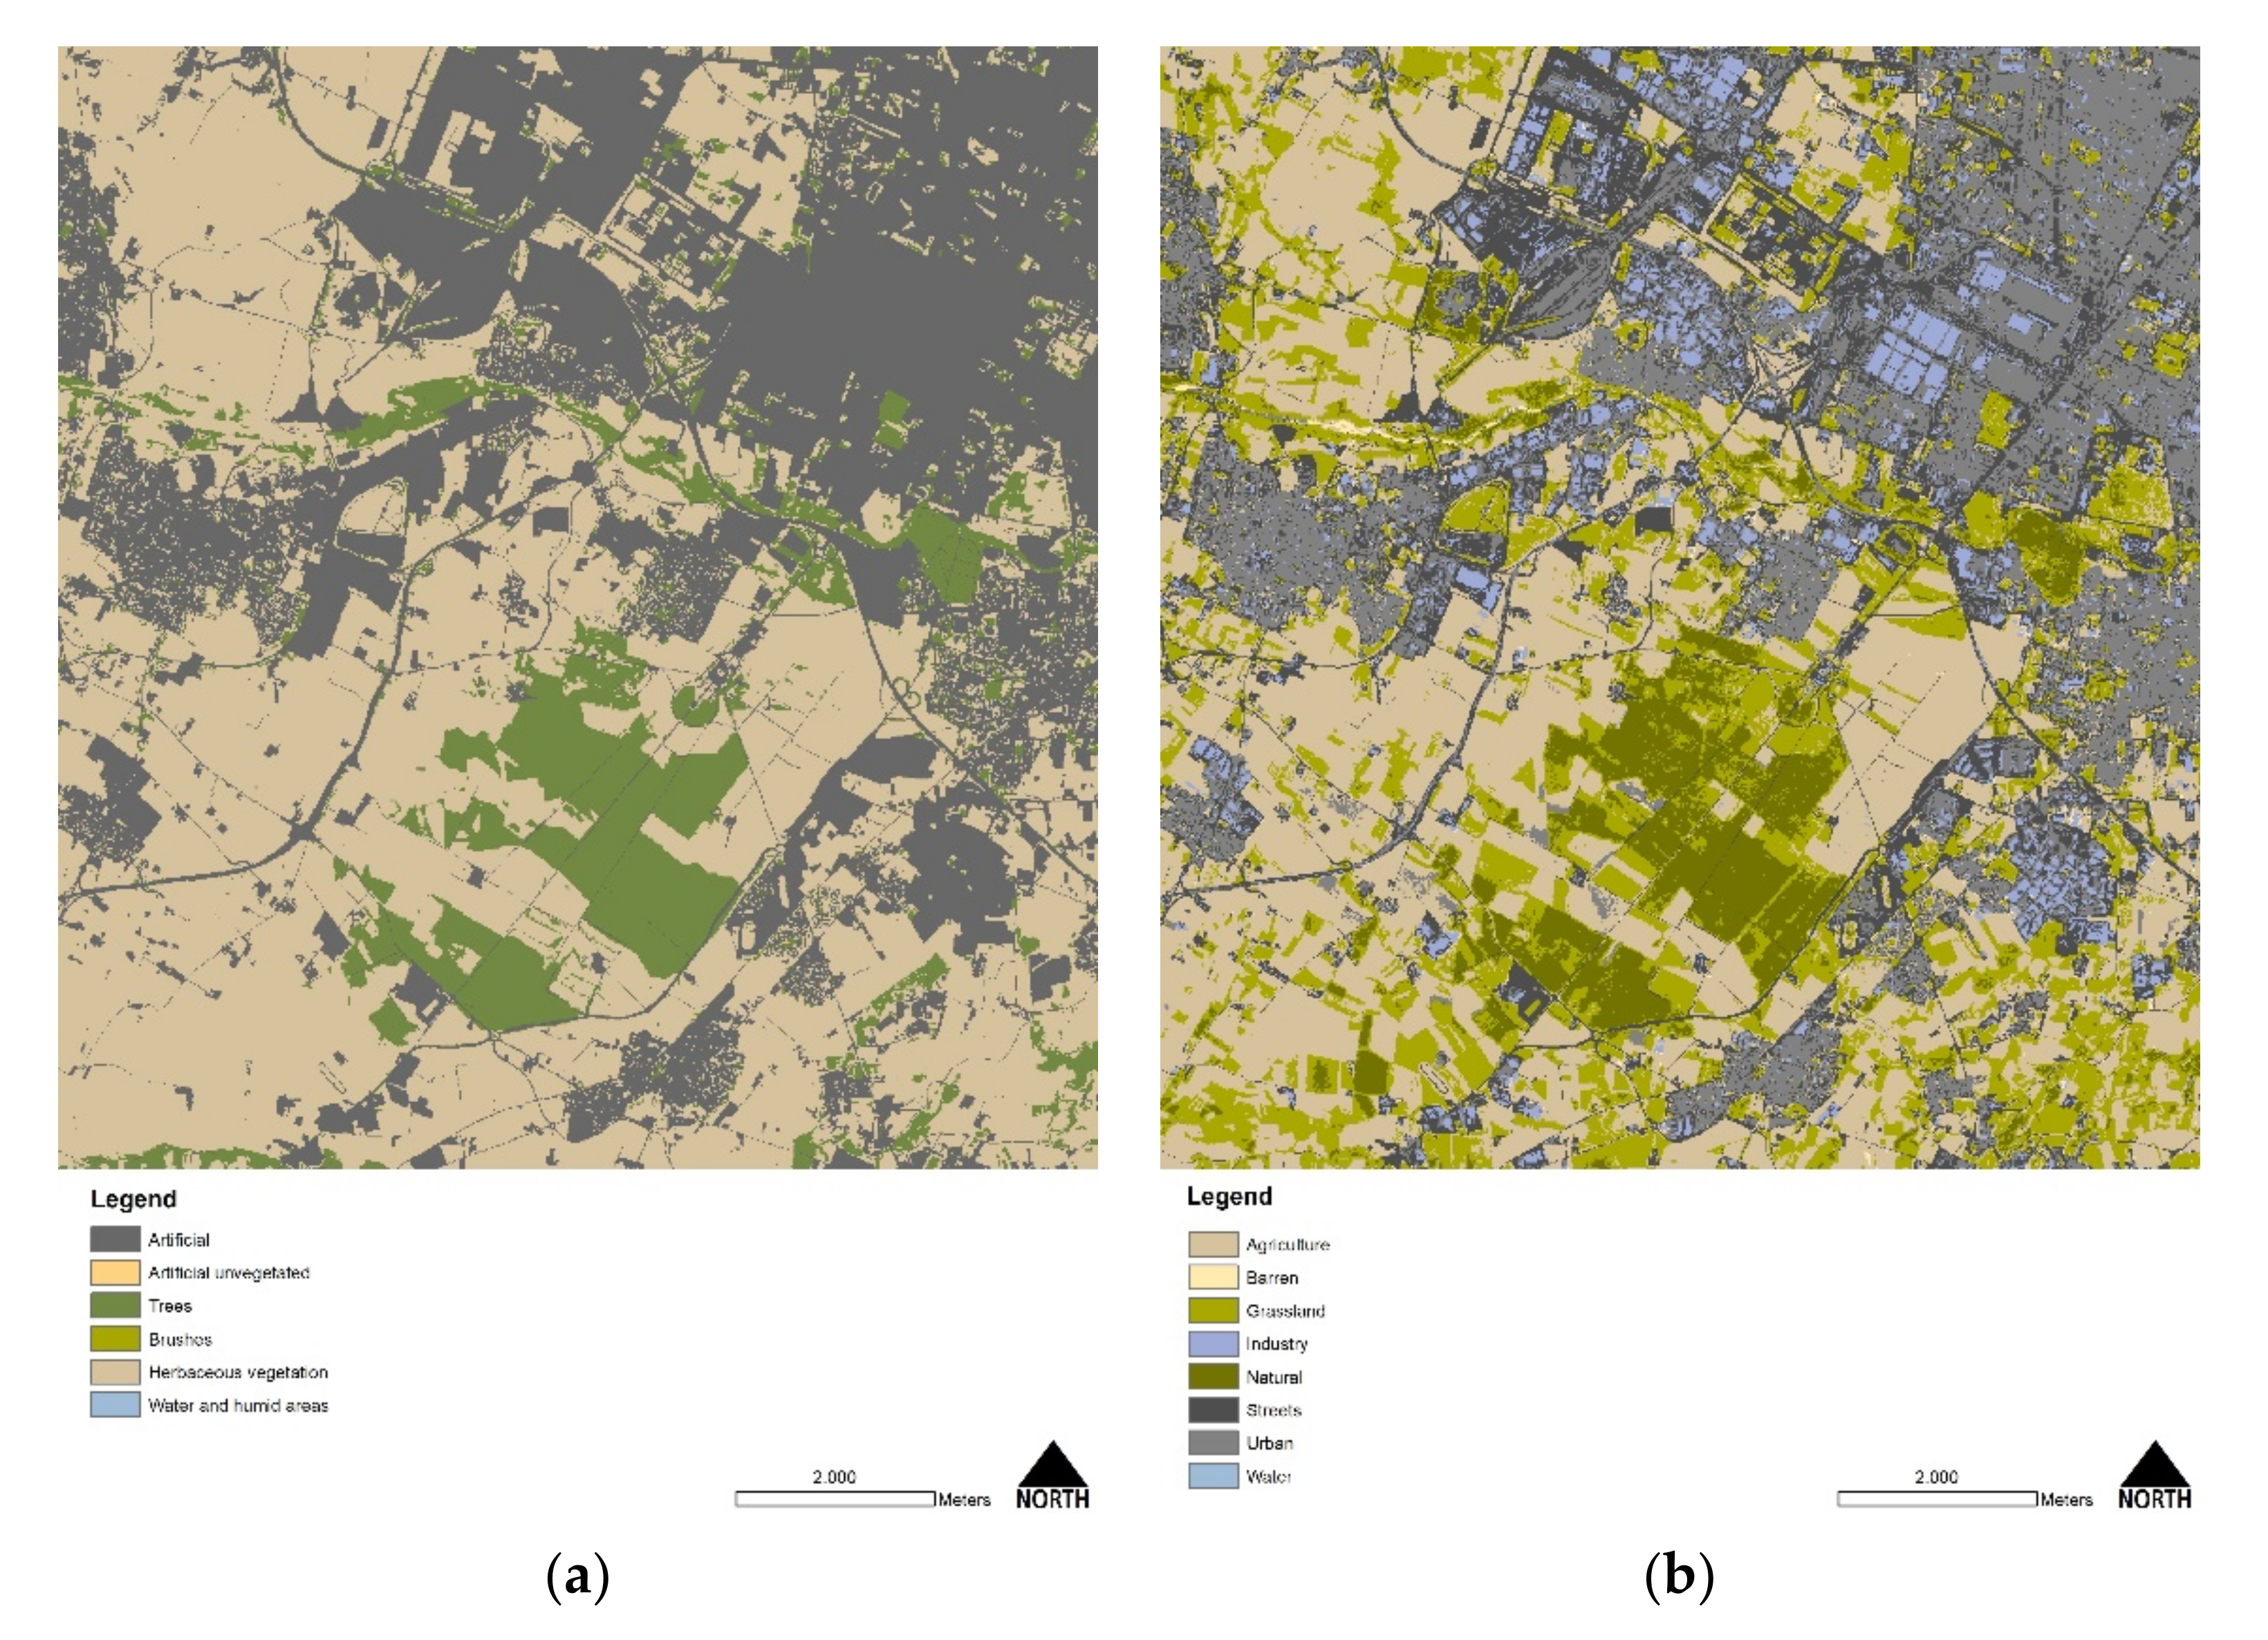
The land use and land cover national map is in raster format (10 × 10 m) and derives from the integration of monitoring data from the Copernicus Program’s Land Service (Corine Land Cover, High-Resolution Layers, Urban Atlas produced by the European Environment Agency of the European Union, Copenhagen) and regional dataset available. The two raster maps were first transformed from raster to vector and then statistically compared (see
Figure 6).
Despite the same ground resolution (10 m), the two datasets are produced with different processes and sources; thus, a proper statistical land-use comparison is only partially acceptable. Both LULC displays certain visual classification mistakes; 2017 has several watersheds classified as “artificial” and a large part of the land incorrectly classified as trees. In contrast, the LULC 2020 has a huge underestimation of artificial surfaces (−10%) due to the linear infrastructures that are not recognized for the Copernicus image’s pixel resolution. Because at least a good balance between artificial and non-artificial land should be minimally required to reach an ecosystemically pertinent modeling session, an additional step of integration of the road network has been applied to obtain a reliable result.
The road network has been extracted from the national dataset of 2017 and superimposed by intersecting to the new LULC 2020, thus obtaining a reliable final product. The post-processing result phases are reported as follows:
Export of Class1 from digital LULC 2017;
The union between the exported layer and the LULC 2020;
Tabular selection of urban features that overlaps non-artificial classes (apart from water which is a mistake of LULC 2017)
Dissolution by field land-use class of the new integrated LULC 2020 and calculation of areas.
The numerical synthesis of the process is shown below in
Table 5.
Table 5 provides an assessment of the numerical comparison between the national LULC 2017 and the auto-produced edition of LULC 2020 corrected with the infrastructure layer. At first, it is notable that LULC categories are incoherent; thus a complete comparison cannot be performed—the Artificial Land of LULC 2017 has been compared to a group of three LULC 2020 classes (Urban, Streets, and Industry). Artificial Unvegetated has been associated with Barren Land (but the two categories are quite different because the Barren Land cannot be considered among the anthropic surfaces). Trees and Shrubs are not comparable with the Natural Land class of LULC 2020, while the Agriculture Land class is not present in the LULC 2017. Therefore, the type of classification limits the possibility to perform an accuracy test using existing repertories. Nevertheless, the LULC classification of 2020 has been conducted considering the need to prepare a valuable input for ES modeling, thus obtaining an internal sub-articulation of the artificial land and distinguishing at least the unbuilt natural and agricultural land.
Because the balance of artificial and non-artificial land is crucial to set the Habitat Quality, the final result has been synthetically evaluated using the most reliable and updated dataset on artificial land, which is the one produced by theSuperior Institute for Environmental Protection and Research (National Land Take Database) of 2019 that measures the impervious area with a semi-automatic classification by satellite images [
41,
42]. Therefore, the classes Industry, Urban, and Streets of the integrated LULC 2020 were statistically compared with the land take dataset (Artificial Areas) of ISPRA under the column “comparison” on the right side of
Table 6 in a selected portion of the analyzed area.
Within this second-step reliability process, the comparative result seems to be acceptable because the difference of the artificial areas is about 11.06%, that is, the physiological effect of a different approach of land take detection in the ISPRA 2017 dataset, which classifies “soil sealing” instead of “urban land” while leaving all the porous urban areas inside the dense built-up system classified as grassland and not urban land (thus having a less quantity of land classified as “urban”). Once the auto-produced LULC classification has been considered sufficient, the results of the LULC-dependent indexes of Habitat Quality, Habitat Decay, and the NDVI were grouped together into a monitoring dashboard, where each spatial indicator has been simultaneously evaluated through a composite ranking.
3.2. The Construction of a Monitoring Dashboard for the LULC Classification
Figure 4 represents the differences between the two ES modeling outputs because Habitat Quality and Habitat Decay are different products. The quality shows how the system is “healthy” by its basic condition, while the decay represents how the system is vulnerable to anthropic threats.
Habitats Quality and Habitat Decay indexes were evaluated for each municipality using the AOI’s zonal statistics tool using the average value calculation. Values of the mean indexes range from 0.18 to 0.69 (absolute values in the AOI ranges from 0 to 1) for Habitat Quality and from 0.01 to 0.05 (absolute values in the AOI ranges from 0 to 0.21) for Habitat Decay. The same tool has been used to measure the average NDVI index for each municipality obtaining values ranging from 127.36 to 148.99 (absolute values in the AOI ranges from 1 to 200).
On average, in the observed catchment, the Habitat Quality is 0.45, with an average Habitat Decay of 0.03. Municipalities that have low Habitat Quality did not coincide with all those who display a high decline. Similar contrasting conditions can be detected where the low state of ecosystem service is also threatened by high decay. Moreover, the introduction of NDVI presents a further element to evaluate the environmental condition of the metropolitan area:
Habitat Quality provides an overall idea of the basic “condition” or “health” of the municipality representing the baseline index;
The decay adds relative crucial information concerning the vulnerability of habitats because the decline can affect even all those ecosystems that display average health status, thus having a Habitat Quality index above the average;
The NDVI presents a picture of the final condition qualifying the poor or rich vegetation in the analyzed landscape.
The three indicators are complementary but different and express the multiple conditions of the environment.
Therefore, a monitoring dashboard has been constructed using a statistical concatenation of values using the “if-then” function using MS Excel: if the Municipality “x” has a Habitat Quality lower than the average values in the metropolitan catchment and also the decay is above the average in the same catchment, then this municipality is in “critical” situation. On the other hand, if the mean Quality is above the average and the mean Decay is below, then the case is “fair.” Therefore, where the mean quality is above the average and the mean decay, the supporting ecosystem service capacity is “threatened” by the decline, thus requiring certain conservation and valorization measures. Finally, if the condition is “fair” but the NDVI is below the average, then the final output is “Low_Bio” (Low Biodiversity); if the condition is fair and NDVI is above the mean then the assigned result is “Health.” The five classes are summarized as follows (see
Table 7):
Critical, the mean quality is below the average while the mean decay is above;
Threatened, the mean quality is above the average and the mean decay too;
Low_Bio, the condition is “fair”, but NDVI is below the average;
Fair, the mean quality is above the average, while the mean decay is below;
Health, the condition is “fair” (not critical nor threatened) and NDVI is above the average.
Table 7 demonstrates that no direct relationship exists among the three auto-produced indexes (see the examples of Carignano, Alpignano, Macello, Pecetto Torinese, Pianezza, Piscina, None, Piobesi Torinese, Rivoli, Rosta, Villarbasse, Scalenghe, Vigone, Santena, Virle Piemonte, and Castagnole Piemonte), thus clarifying that a composite evaluation of the environmental condition is required to gain an overall picture of the ongoing supporting ecosystem dynamics in the AOI.
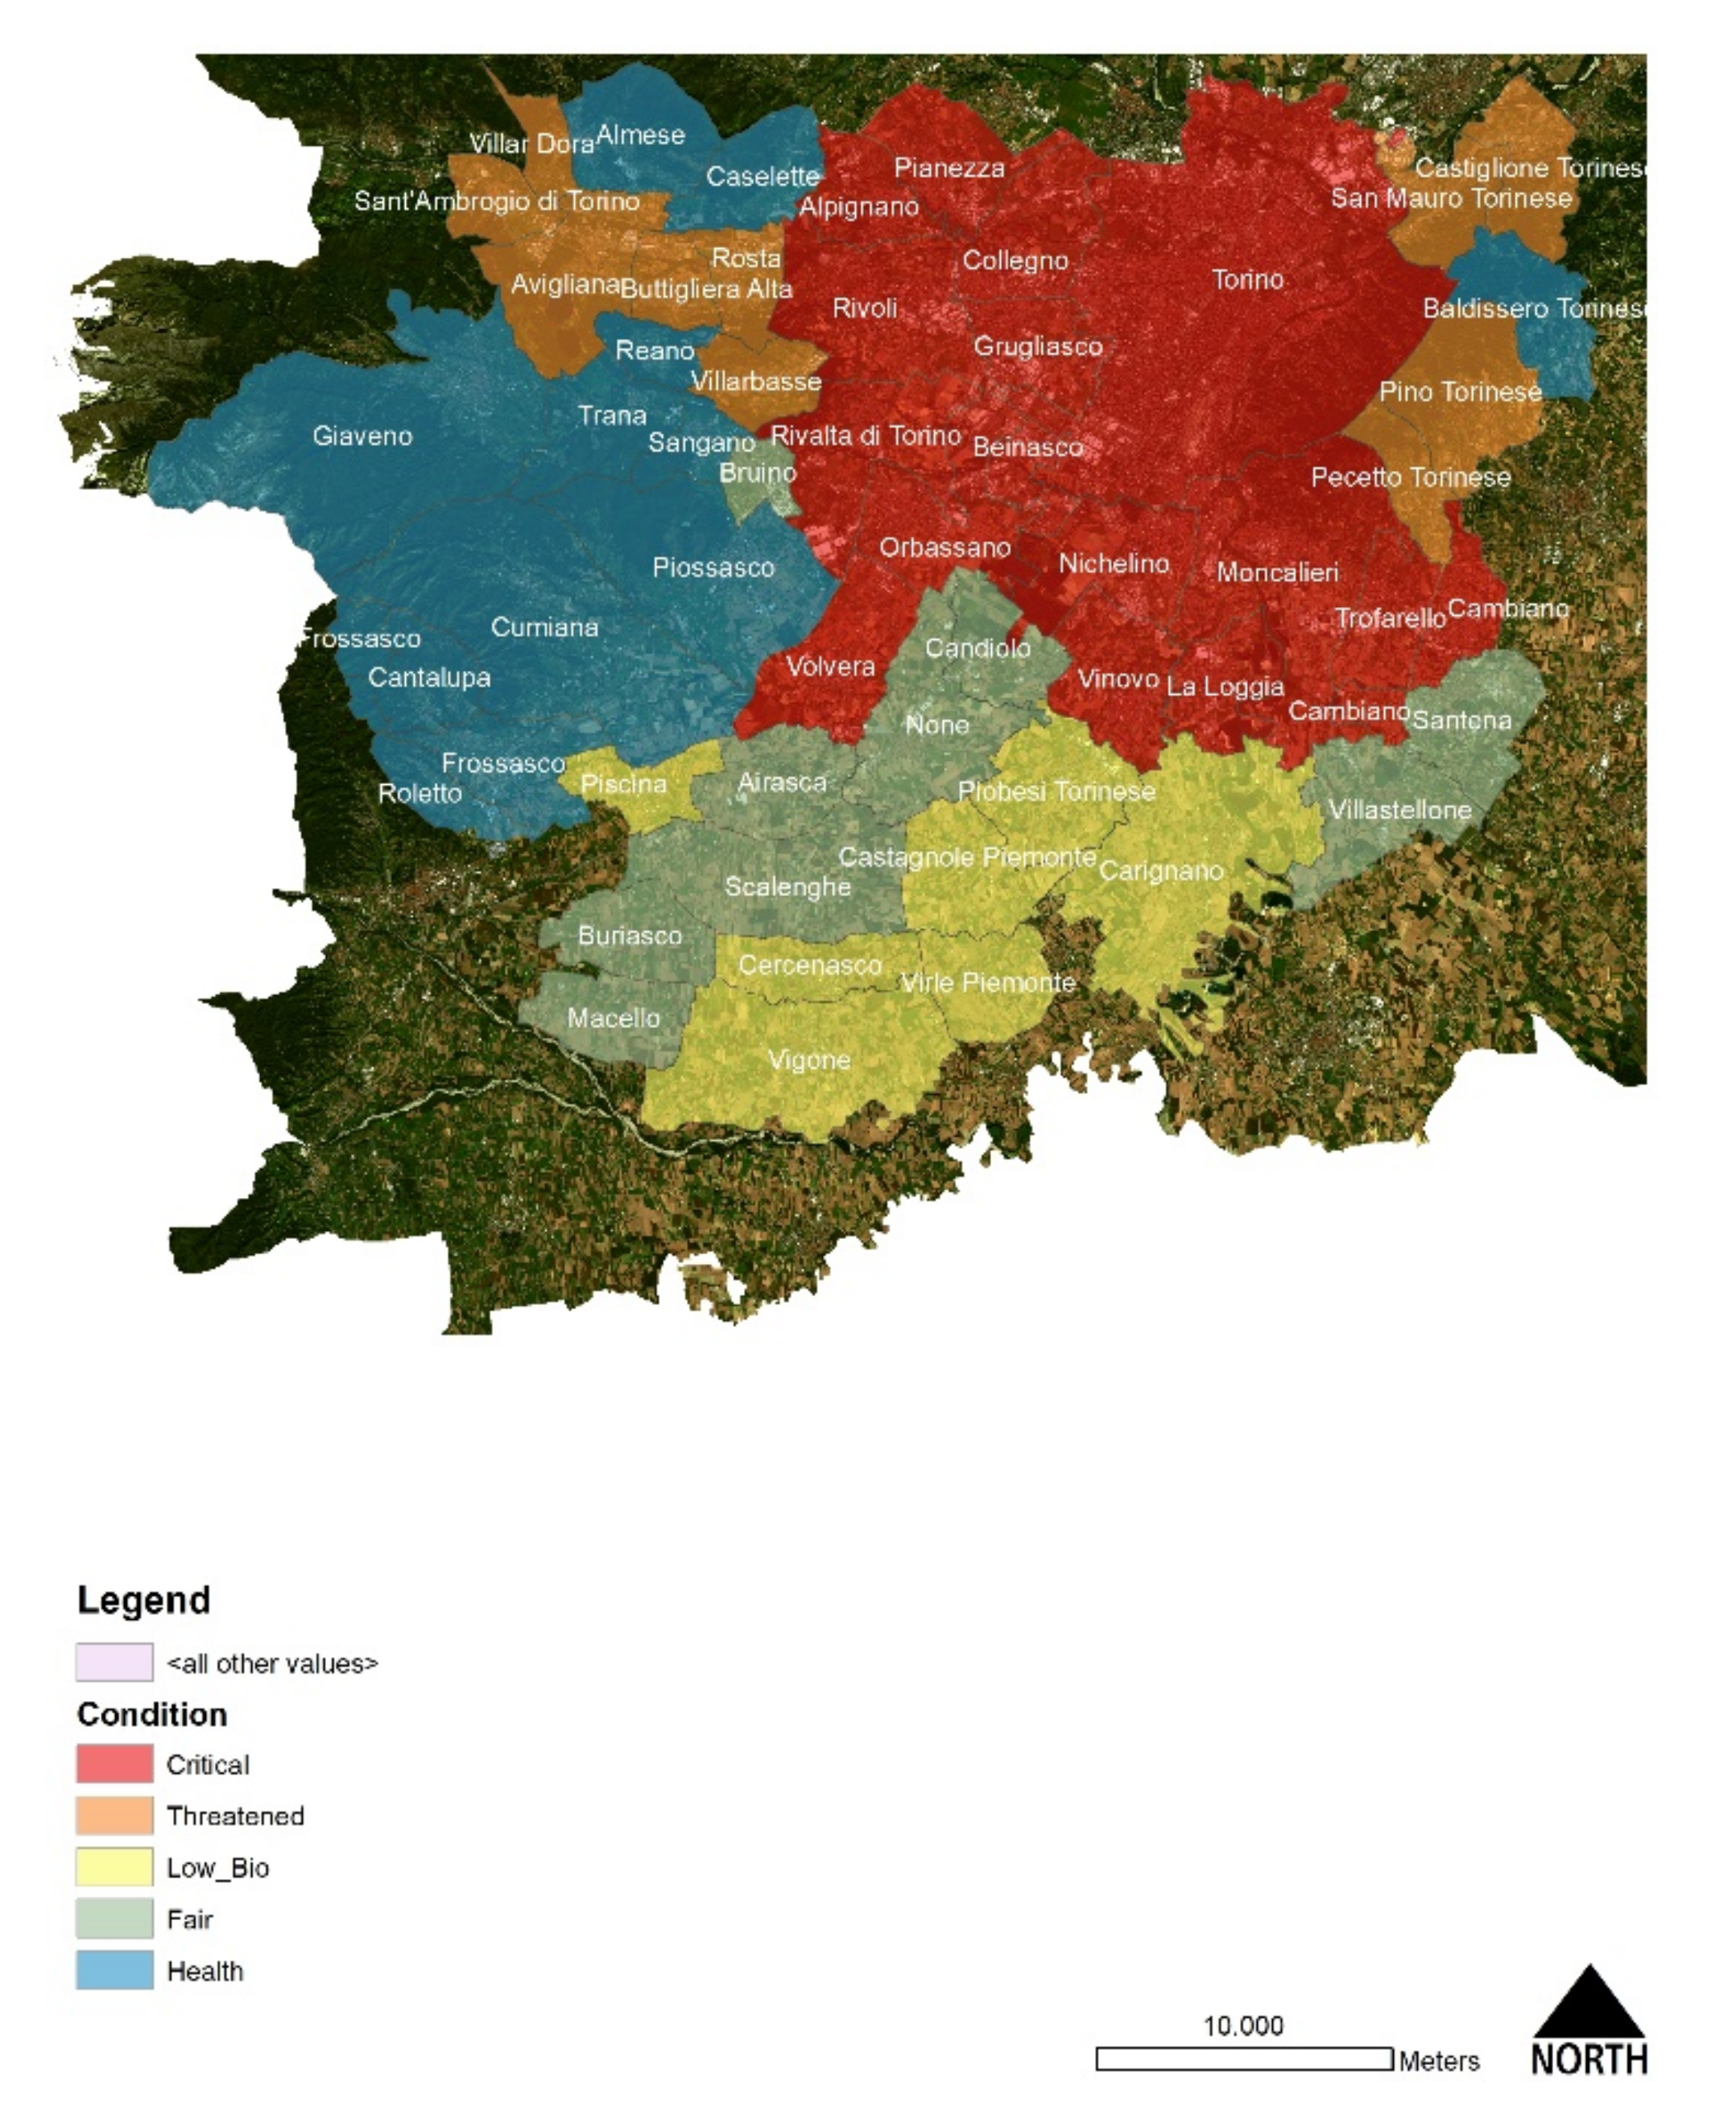
A spatial tabular join has been applied to visualize the distribution of values (see
Figure 7).
Figure 7 confirms that the five classes are spatially clustered while acknowledging that municipalities’ environmental conditions deal with their proximity/distance to the main city and other sources of threats such as the infrastructural system and major neighborhood settlement systems located in the metropolitan area.
The map confirms that the conurbation of Turin is affected by a critical condition that spans between the first neighborhood municipalities and goes far beyond, including “second-ring” municipalities such as Volvera, Cambiano and Trofarello, Pianezza, Albignano, Rivoli, and Rivalta di Torino, which are considered areas with a good quality of life in a comfortable environment composed by a continuum of urban–rural morphologies placed in the Turin hill, and in the western part at the foot of the Alpine system. Nonetheless, the Habitat Quality of these areas remains below the average value, with relatively poor biodiversity and a high decay of the ecosystems. For these municipalities, a priority of “green-to-gray” [
41,
43,
44,
45] measures should be delivered by local plans to recover Habitat Quality while generating a lower impact on the ecosystem.
Surprisingly, even the threatened municipalities are those belonging to a hilly environment. However, this group is composed in the western part by the territory of Val di Susa (which is the densest connection with France) and those located in the direction to Milan, thus receiving the influence of a hard built-up corridor. Both systems display an averagely good Habitat Quality, but a higher decay threatens the environment due to the proximity with the adjacent railway and motorway system that crosses these areas. These municipalities should promote mitigation and compensation measures against soil sealing [
46,
47] while reducing the impact of motorways and infrastructural corridors.
Not surprisingly, the southern part of the AOI is classified as “Low_Bio,” which indicates that even if the Habitat Quality and the Habitat Decay are fine on average, but there is a low vegetation presence (NDVI detection). These areas belong to the plain rural riverbeds system with fertile soils and intense agricultural activities. These areas should promote environmentally friendly “greening” actions, using the Common Agricultural Policy [
48,
49] as an engine to transform the farm production activity into a more sustainable one.
The south–west axes Turin–Pinerolo, plus a few eastern municipalities are classified as fair due to their balance values between Habitat Quality, Habitat Decay, and NDVI, thus representing overall stable situations that benefits from their proximity to environmentally compatible clusters but, at the same time, are relatively closed to critical or low biodiverse areas. For these situations, it is suggested to keep the existent status employing conservation and valorization policies.
Finally, despite the outlier of Baldissero Torinese in the eastern part, the health cluster is concentrated in the rich environment of the pre-alpine system composed of western municipalities. Here, agroforestry measures to protect and maintain biodiversity are welcomed to keep the positive metropolitan ecosystem balance.
4. Discussion
4.1. An In-Depth Assessment of Turin City
To check the reliability of results, the spatial dashboard has been applied at the city level while reaching a more spatially enclosed visualization of the ranking applied to the city’s public green areas.
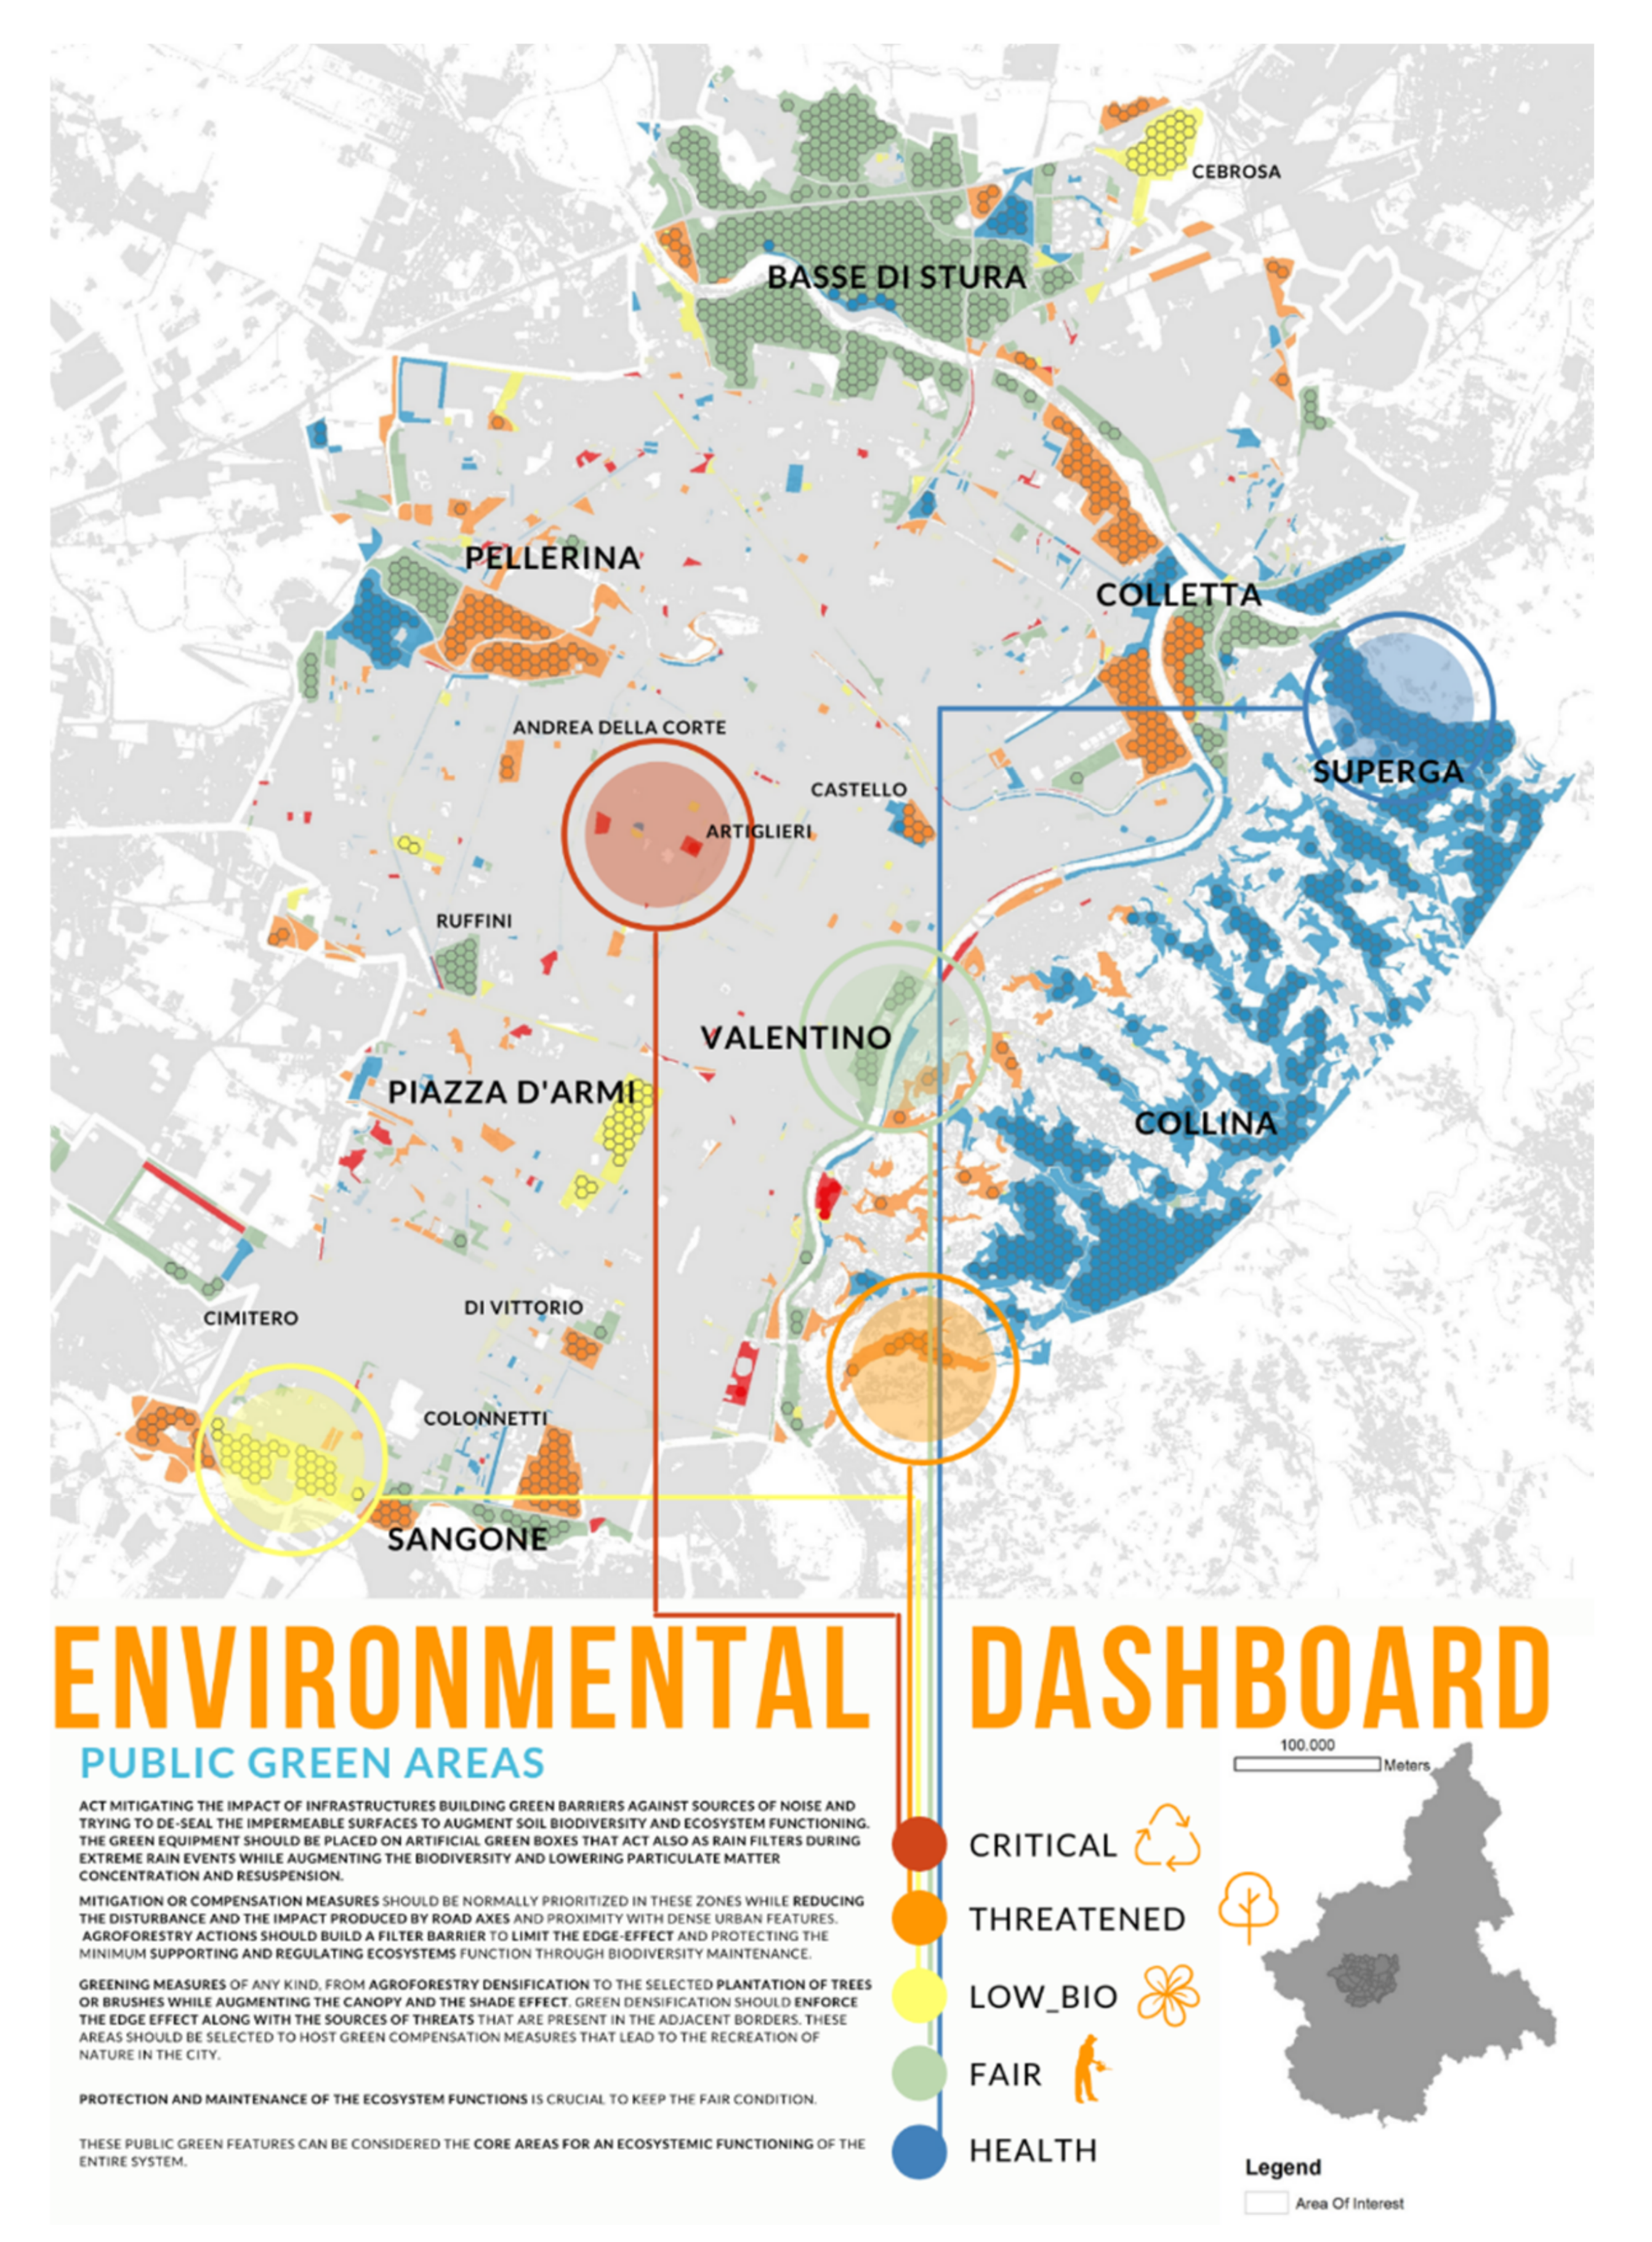
Indeed, a statistical overlap of the three indicators (Habitat Quality, Habitat Decay, and NDVI) with the city’s public green areas has been calculated, obtaining an evaluation of the ongoing status of urban green. The result is the output of a superimposition of the land use zones with the three auto-produced layers and the average values’ calculation by zonal statistics with the MS Excel dashboard (see
Figure 8). All those public areas placed along streets (linear green patches) that are considered elements of threats in the Habitat modeling were deleted from the final representation to avoid mistakes in the classification.
The final map has been produced to see which land use zones of the public city should consider priority interventions while maintaining or augmenting the supporting ecosystem function against the anthropic threats and the unpredictable natural events due to climate change.
Table 8 shows that more than 32 million square meters are composed of green public areas, while woods collect more than 3.8 million. Fortunately, having an abundant semi-natural hilly environment, more than 14 million square meters of public areas are in healthy condition. Green public areas are equally divided between healthy and fair conditions (11 million), while the largest quantity of woods is in health. Less than seven million square meters are threatened by habitat decay, which is a considerable amount, even considering that more than 840,000 square meters of woods are affected by a huge decay. This data sheds light on the fact that specific interventions are requested to maintain and upgrade urban green areas’ quality. Fortunately, the quantity of green public spaces under critical conditions is negligible (less than 700,000 square meters), while there are no woods under this category.
The environmental classification shows that a few public green areas are in a critical situation. These few zones suffer from an insufficient minimum environmental quality while being affected even by the proximity with primary sources of threats, therefore not reaching a minimum environmental rate and displaying high vulnerability. In these hotspots, it is crucial to mitigate the impact of infrastructures building green barriers against sources of noise and trying to de-seal the impermeable surfaces to augment soil biodiversity and ecosystem functioning. When the de-seal is not possible, the green equipment should be placed on artificial green boxes that also act as rain filters during extreme rain events while augmenting the biodiversity and lowering particulate matter concentration and resuspension.
Many public green areas are threatened by the decay of ecosystem functions, meaning that even though they have an overall minimum habitat quality, their location is exposed to threat sources. In this category falls certain extended and well-known green urban features that are exposed to high accessibility by many users—the eastern foothill public green system, which is more accessible by car and fruited for the scenic quality of the viewshed in the city; the Pellerina Park, which is one of the most known and important green sources of the town along the Corso Regina main road; and, finally, the Colletta Park, which is an environmentally equipped area places along the junction between the Stura and Po Rivers.
Mitigation or compensation measures should be normally prioritized in these land use zones since the main problem here is to reduce the disturbance and the impact produced by road axes and proximity with dense urban features. This means that a priority should be given to select all the agroforestry actions to build a filter barrier to limit the edge-effect and protect the minimum supporting and regulating ecosystems function through biodiversity maintenance.
The low biodiversity condition is mainly concentrated in three different locations—the park along the Sangone River in the southern border of Mirafiori area, the Piazza D’Armi District, and the northern public green spaces adjacent to the motorway junctions toward Milan and Aosta. The low-biodiversity condition is due to the absence of an adequate vegetational composition, thus displaying a low NDVI value. All those areas that fall under this condition should be undertaken by greening measures of any kind, from agroforestry densification to the selected plantation of trees or brushes while augmenting the canopy and the shade effect. Green densification should occur with priority enforcing the edge effect and the sources of threats present in the adjacent borders. Even these areas should be selected to host green compensation measures that lead to the recreation of nature into the city.
The fair condition is concentrated in two extended urban green features of the city—the neighbor Basse di Stura and the western part of the Pellerina Park. Here, the natural condition and the ecosystem supporting functions are overall fine while not suffering from anthropic features disturbances. Even the natural equipment and canopy are fair, so adequate protection and maintenance of the ecosystem functions are crucial to keeping the healthy condition.
Finally, the healthier condition is mainly displayed by the eastern hilly green public system, plus other fewer areas benefit from their proximity to external environmentally sound peri-urban features. All these areas seem to indicate an overall good status composed of a good ecosystem functioning, good protection from sources of threats, and huge vegetational equipment that guarantee biodiversity and good ecosystem-related regulative performances. These public green features can be considered the core areas for an ecosystemic functioning of the entire system.
4.2. Limits and Merits of the Study
This study demonstrated how it is possible nowadays to overcome the dependence of official land-use datasets while autonomously produce maps and indexes of the local environmental conditions. Nonetheless, the experiment here conducted has several limits. The first is the absence of a comparative analysis of the LULC dataset with an identical one. The systematic processing of an identical LULC should be considered while comparing this first experiment with a second auto-produced image acquired in the same season. For timing reasons, the comparison mentioned above remains unresolved, but the intention is to create a seasonal LULC assessment to make a comparative analysis and verifying how the different datasets are sensitive to the variable conditions of the land. The second limit is the raw resolution of free Sentinel data. The original LULC has been integrated with the road network since the linear sample size during the supervised classification could not capture the pixel composition due to the low-resolution and linear infrastructures. To overcome this limit, Copernicus also offers high-resolution products available with payment.
On the other hand, this first experiment revealed some promising advancements that can be considered in the upcoming research activity. The first is the potential automatization of the entire process by utilizing the Model Builder ArcGIS tool or using the online ONDA-DIAS automatic processing functions. Automatization consists of the memorization of the sample features LULC classification in the baseline map, allowing the same output’s automatic production when Copernicus processes the new orbit image in the same catchment. In the future, this process enables a LULC real-time production and a consequent implementation of local observatories of the ecosystemic condition at the regional and city level. The continuous update of the monitoring dashboard will support public authorities’ decision-making process on their green areas while selecting the kind and the priority of interventions to maximize the ecosystem benefits while limiting the decay of the environment.
5. Conclusions
The purpose of this study was to overcome the typical limit of obtaining updated land use data for environmental assessment and diagnosis. To overcome this limit, an auto-produced LULC digital map has been processed from Copernicus Sentinel-2 images. The production of LULC served to compose three different indexes—two are the output of an ES modeling session using the Habitat Quality model of InVEST, while the latter is the product of an NDVI processing from the originally downloaded multiband composition. The methodology has been mainly composed of three steps, namely, (i) classification of Copernicus-downloaded data, (ii) modeling ecosystem services and NDVI index in a GIS environment, and (iii) statistical processing of indexes in an MS Excel environment.
Results indicate that with some adjustment, the auto-produced LULC was considered reliable and used to build an environmental dashboard that supports the metropolitan environmental monitoring and the evaluation of priority intervention for ecological conservation and valorization at the city scale.
This experimental approach’s output reveals how the technological utilization of big open-access data in a GIS environment leads to overcome the dependence of public administrations on official and updated land cover datasets, which often are the product of long-time processing and do not represent the real-time status of the environment.
This approach aims to strengthen the UN Goals 11 and 13 “Make cities and human settlements inclusive, safe, resilient and sustainable” and “Take urgent action to combat climate change and its impacts,” demonstrating how urban systems can be adequately monitored with seasonal assessments and governed by real-time measures against climate change.
Future research should consider image processing automatization while reaching a seasonal intra-annual assessment of the ES and biodiversity variation. This study emphasizes the monitoring phase as one of the most representative to steer and inform the decision-making process on land use and landscape planning.
