
The ABC’s of Ecological and Nutrition Labels. The Impact of Label Theme and Complexity on the Environmental Footprint of Online Grocery Choices


Abstract
:1. Introduction
2. Study 1
2.1. Materials and Methods
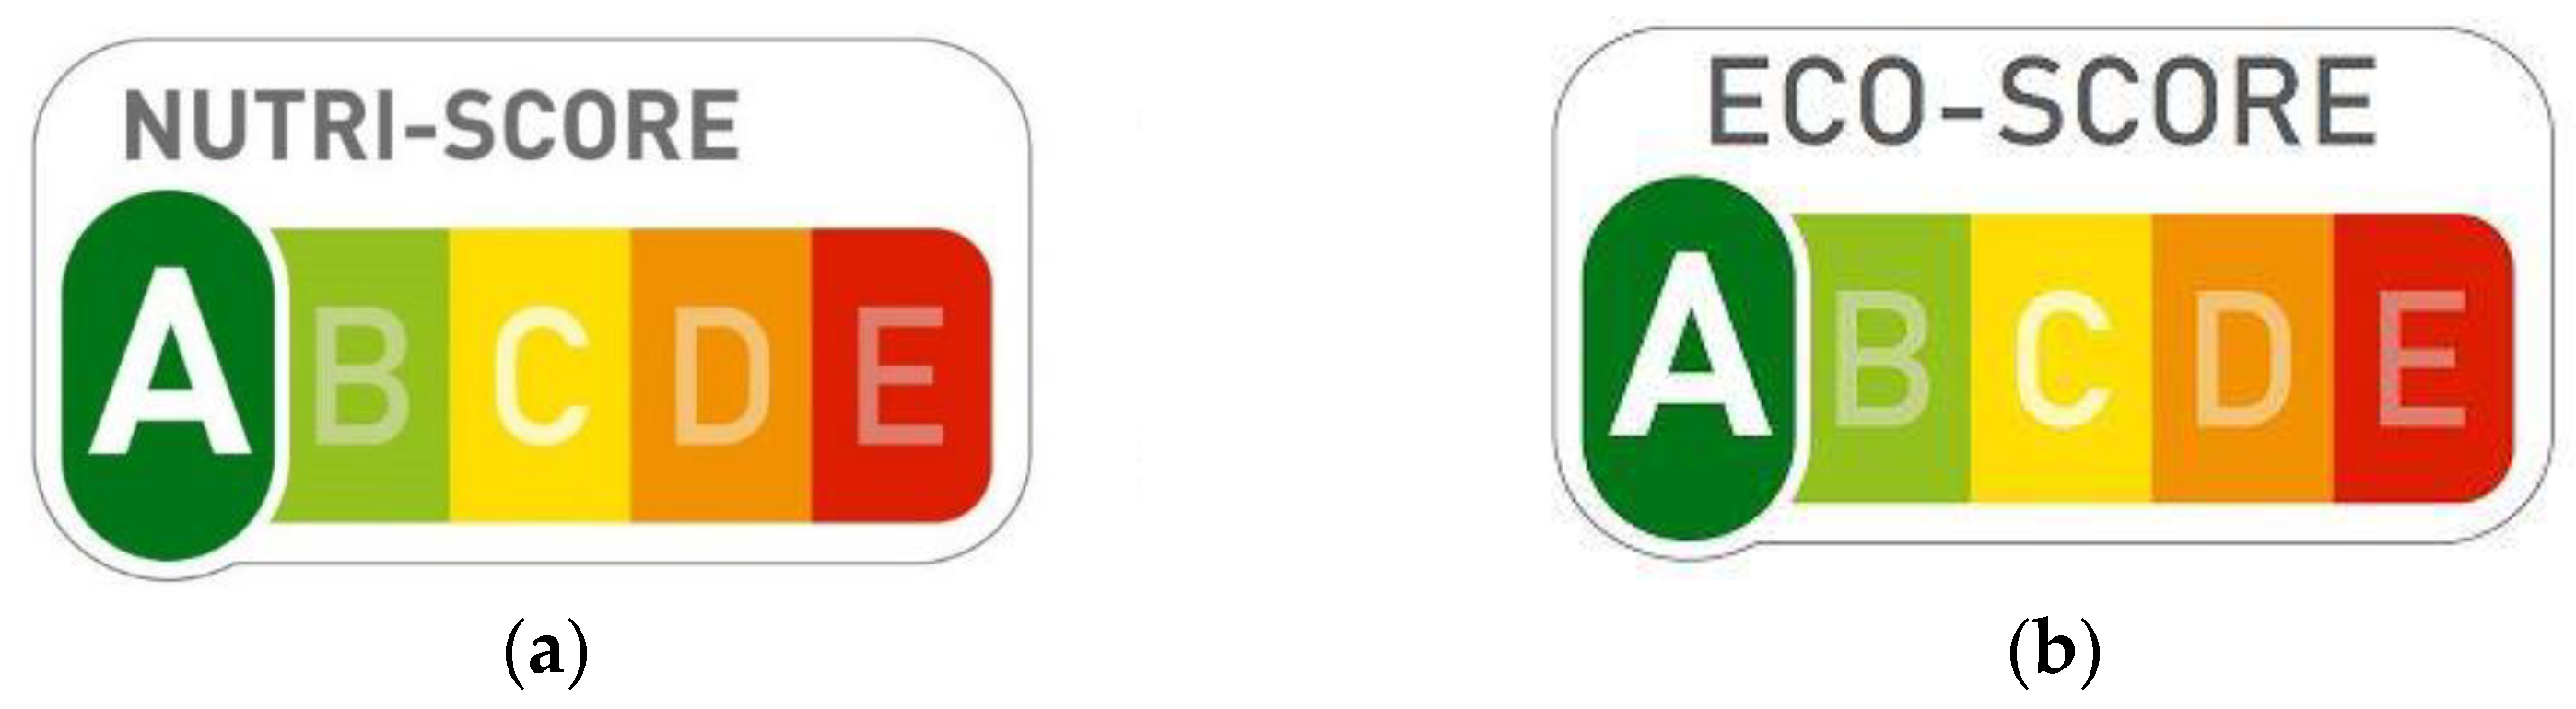
2.1.1. Design and Procedure
2.1.2. Participants
2.1.3. Measures
2.1.4. Statistical Analyses
2.2. Results
2.3. Discussion
3. Study 2
3.1. Materials and Methods
3.1.1. Design and Procedure
3.1.2. Participants
3.1.3. Measures
3.1.4. Statistical Analyses
3.2. Results
3.3. Discussion
4. Study 1 and Study 2: Overview
5. General Discussion
Supplementary Materials
Author Contributions
Funding
Institutional Review Board Statement
Informed Consent Statement
Data Availability Statement
Acknowledgments
Conflicts of Interest
Disclosure of Data Collection and Analysis
Appendix A


Appendix B


References
- Ritchie, H.; Roser, M. Environmental Impacts of Food Production. Available online: https://ourworldindata.org/environmental-impacts-of-food#citation (accessed on 17 November 2020).
- Westhoek, H.; Lesschen, J.P.; Rood, T.; Wagner, S.; De Marco, A.; Murphy-Bokern, D.; Leip, A.; van Grinsven, H.; Sutton, M.A.; Oenema, O. Food Choices, Health and Environment: Effects of Cutting Europe’s Meat and Dairy Intake. Glob. Environ. Chang. 2014, 26, 196–205. [Google Scholar] [CrossRef]
- Willett, W.; Rockström, J.; Loken, B.; Springmann, M.; Lang, T.; Vermeulen, S.; Garnett, T.; Tilman, D.; DeClerck, F.; Wood, A.; et al. Food in the Anthropocene: The EAT—Lancet Commission on Healthy Diets from Sustainable Food Systems. Lancet 2019, 393, 447–492. [Google Scholar] [CrossRef]
- Aleksandrowicz, L.; Green, R.; Joy, E.J.M.; Smith, P.; Haines, A. The Impacts of Dietary Change on Greenhouse Gas Emissions, Land Use, Water Use, and Health: A Systematic Review. PLoS ONE 2016, 11, e0165797. [Google Scholar] [CrossRef]
- European Commission. Special Eurobarometer 468; European Commission: Brussels, Belgium, 2017. [Google Scholar]
- Hughner, R.S.; McDonagh, P.; Prothero, A.; Shultz, C.J.; Stanton, J. Who Are Organic Food Consumers? A Compilation and Review of Why People Purchase Organic Food. J. Consum. Behav. 2007, 6, 94–110. [Google Scholar] [CrossRef]
- Testa, F.; Iraldo, F.; Vaccari, A.; Ferrari, E. Why Eco-Labels Can Be Effective Marketing Tools: Evidence from a Study on Italian Consumers. Bus. Strategy Environ. 2015, 24, 252–265. [Google Scholar] [CrossRef]
- European Environmental Agency. Food Consumption: Animal Based Protein. Available online: https://www.eea.europa.eu/airs/2018/resource-efficiency-and-low-carbon-economy/food-consumption-animal-based (accessed on 9 December 2020).
- Birt, C.; Buzeti, T.; Grosso, G.; Justesen, L.; Lachat, C.; Lafranconi, A.; Mertanen, E.; Rangelov, N.; Sarlio-Lähteenkorva, S. Healthy and Sustainable Diets for European Countries. Available online: https://eupha.org/repository/advocacy/EUPHA_report_on_healthy_and_sustainable_diets_20-05-2017.pdf (accessed on 24 August 2020).
- Milford, A.B.; Le Mouël, C.; Bodirsky, B.L.; Rolinski, S. Drivers of Meat Consumption. Appetite 2019, 141, 104313. [Google Scholar] [CrossRef] [PubMed]
- Goossens, Y.; Berrens, P.; Charleer, L.; Coremans, P.; Houbrechts, M.; Vervaet, C.; De Tavernier, J.; Geeraerd, A. Qualitative Assessment of Eco-Labels on Fresh Produce in Flanders (Belgium) Highlights a Potential Intention–Performance Gap for the Supply Chain. J. Clean. Prod. 2017, 140, 986–995. [Google Scholar] [CrossRef]
- Vermeir, I.; Verbeke, W. Sustainable Food Consumption: Exploring the Consumer “Attitude—Behavioral Intention” Gap. J. Agric. Environ. Ethics Dordr. 2006, 19, 169–194. [Google Scholar] [CrossRef]
- Symmank, C.; Mai, R.; Hoffmann, S.; Stok, F.M.; Renner, B.; Lien, N.; Rohm, H. Predictors of Food Decision Making: A Systematic Interdisciplinary Mapping (SIM) Review. Appetite 2017, 110, 25–35. [Google Scholar] [CrossRef] [PubMed]
- Nardi, V.A.M.; Jardim, W.C.; Ladeira, W.; Santini, F. Predicting Food Choice: A Meta-Analysis Based on the Theory of Planned Behavior. Br. Food J. 2019, 121, 2250–2264. [Google Scholar] [CrossRef]
- Gatersleben, B.; Murtagh, N.; Abrahamse, W. Values, Identity and pro-Environmental Behaviour. Contemp. Soc. Sci. 2014, 9, 374–392. [Google Scholar] [CrossRef]
- Molinario, E.; Lorenzi, C.; Bartoccioni, F.; Perucchini, P.; Bobeth, S.; Colléony, A.; Diniz, R.; Eklund, A.; Jaeger, C.; Kibbe, A.; et al. From Childhood Nature Experiences to Adult Pro-Environmental Behaviors: An Explanatory Model of Sustainable Food Consumption. Environ. Educ. Res. 2020, 26, 1137–1163. [Google Scholar] [CrossRef]
- Çoker, E.N.; van der Linden, S. Fleshing out the Theory of Planned of Behavior: Meat Consumption as an Environmentally Significant Behavior. Curr. Psychol. 2020. [Google Scholar] [CrossRef]
- Verain, M.C.D.; Sijtsema, S.J.; Antonides, G. Consumer Segmentation Based on Food-Category Attribute Importance: The Relation with Healthiness and Sustainability Perceptions. Food Qual. Prefer. 2016, 48, 99–106. [Google Scholar] [CrossRef]
- Siegrist, M.; Hartmann, C. Impact of Sustainability Perception on Consumption of Organic Meat and Meat Substitutes. Appetite 2019, 132, 196–202. [Google Scholar] [CrossRef] [PubMed]
- Wunderlich, S.; Gatto, K.A. Consumers’ Food Choices and the Role of Perceived Environmental Impact. Int. J. Sustain. Dev. Plan. Southampt. 2016, 11, 989–995. [Google Scholar] [CrossRef]
- Ungemach, C.; Camilleri, A.R.; Johnson, E.J.; Larrick, R.P.; Weber, E.U. Translated Attributes as Choice Architecture: Aligning Objectives and Choices Through Decision Signposts. Manag. Sci. 2017, 64, 2445–2459. [Google Scholar] [CrossRef]
- Hartikainen, H.; Roininen, T.; Katajajuuri, J.-M.; Pulkkinen, H. Finnish Consumer Perceptions of Carbon Footprints and Carbon Labelling of Food Products. J. Clean. Prod. 2014, 73, 285–293. [Google Scholar] [CrossRef]
- Macdiarmid, J.I.; Douglas, F.; Campbell, J. Eating like There’s No Tomorrow: Public Awareness of the Environmental Impact of Food and Reluctance to Eat Less Meat as Part of a Sustainable Diet. Appetite 2016, 96, 487–493. [Google Scholar] [CrossRef] [PubMed]
- Camilleri, A.R.; Larrick, R.P.; Hossain, S.; Patino-Echeverri, D. Consumers Underestimate the Emissions Associated with Food but Are Aided by Labels. Nat. Clim. Chang. 2019, 9, 53–58. [Google Scholar] [CrossRef]
- Hallez, L.; Qutteina, Y.; Raedschelders, M.; Boen, F.; Smits, T. That’s My Cue to Eat: A Systematic Review of the Persuasiveness of Front-of-Pack Cues on Food Packages for Children vs. Adults. Nutrients 2020, 12, 1062. [Google Scholar] [CrossRef] [PubMed]
- Vlaams Instituut Gezond Leven. Nutri-Score|Gezond Leven. Available online: https://www.gezondleven.be/themas/voeding/beleid/voedingslabels/nutri-score-label (accessed on 6 December 2020).
- Szabo de Edelenyi, F.; Egnell, M.; Galan, P.; Druesne-Pecollo, N.; Hercberg, S.; Julia, C. Ability of the Nutri-Score Front-of-Pack Nutrition Label to Discriminate the Nutritional Quality of Foods in the German Food Market and Consistency with Nutritional Recommendations. Arch. Public Health 2019, 77, 28. [Google Scholar] [CrossRef] [PubMed]
- De Temmerman, J.; Heeremans, E.; Slabbinck, H.; Vermeir, I. The Impact of the Nutri-Score Nutrition Label on Perceived Healthiness and Purchase Intentions. Appetite 2020, 104995. [Google Scholar] [CrossRef] [PubMed]
- Egnell, M.; Talati, Z.; Hercberg, S.; Pettigrew, S.; Julia, C. Objective Understanding of Front-of-Package Nutrition Labels: An International Comparative Experimental Study across 12 Countries. Nutrients 2018, 10, 1542. [Google Scholar] [CrossRef] [PubMed]
- Borzan, B.; Rivasi, M.; Trillet-Lenoir, V.; Goyens, M.; van Hevel, D.; Bazot, A.; Pirrone, A.; King, O.; Balhanas, A.; Mechels, I.; et al. Joint Letter to the European Commission Re: Mandatory Nutri-Score; Commissioner for Health and Food Safety, European Commission: Brussels, Belgium, 2020. [Google Scholar]
- European Commission. Food Information to Consumers—Legislation. Available online: https://ec.europa.eu/food/safety/labelling_nutrition/labelling_legislation_en (accessed on 14 January 2021).
- Bialkova, S.; Grunert, K.G.; van Trijp, H. From Desktop to Supermarket Shelf: Eye-Tracking Exploration on Consumer Attention and Choice. Food Qual. Prefer. 2020, 81, 103839. [Google Scholar] [CrossRef]
- Hawley, K.L.; Roberto, C.A.; Bragg, M.A.; Liu, P.J.; Schwartz, M.B.; Brownell, K.D. The Science on Front-of-Package Food Labels. Public Health Nutr. 2013, 16, 430–439. [Google Scholar] [CrossRef] [PubMed]
- Ecolabel Index All Ecolabels. Available online: http://www.ecolabelindex.com/ecolabels/ (accessed on 21 August 2020).
- Prag, A.; Lyon, T.; Russillo, A. Multiplication of Environmental Labelling and Information Schemes (ELIS): Implications for Environment and Trade. Available online: https://www.oecd-ilibrary.org/environment/multiplication-of-environmental-labelling-and-information-schemes-elis_5jm0p33z27wf-en (accessed on 20 August 2020).
- European Commission. The Organic Logo. Available online: https://ec.europa.eu/info/food-farming-fisheries/farming/organic-farming/organic-logo_en (accessed on 14 January 2021).
- Engels, S.V.; Hansmann, R.; Scholz, R.W. Toward a Sustainability Label for Food Products: An Analysis of Experts’ and Consumers’ Acceptance. Ecol. Food Nutr. 2010, 49, 30–60. [Google Scholar] [CrossRef] [PubMed]
- Taufique, K.M.R.; Vocino, A.; Polonsky, M.J. The Influence of Eco-Label Knowledge and Trust on pro-Environmental Consumer Behaviour in an Emerging Market. J. Strateg. Mark. 2017, 25, 511–529. [Google Scholar] [CrossRef]
- Vlaeminck, P.; Jiang, T.; Vranken, L. Food Labeling and Eco-Friendly Consumption: Experimental Evidence from a Belgian Supermarket. Ecol. Econ. 2014, 108, 180–190. [Google Scholar] [CrossRef]
- Clement, J.; Kristensen, T.; Grønhaug, K. Understanding Consumers’ in-Store Visual Perception: The Influence of Package Design Features on Visual Attention. J. Retail. Consum. Serv. 2013, 20, 234–239. [Google Scholar] [CrossRef]
- Muller, L.; Lacroix, A.; Ruffieux, B. Environmental Labelling and Consumption Changes: A Food Choice Experiment. Environ. Resour. Econ. Dordr. 2019, 73, 871–897. [Google Scholar] [CrossRef]
- Vanclay, J.K.; Shortiss, J.; Aulsebrook, S.; Gillespie, A.M.; Howell, B.C.; Johanni, R.; Maher, M.J.; Mitchell, K.M.; Stewart, M.D.; Yates, J. Customer Response to Carbon Labelling of Groceries. J. Consum. Policy Dordr. 2011, 34, 153–160. [Google Scholar] [CrossRef]
- Atkinson, L.; Rosenthal, S. Signaling the Green Sell: The Influence of Eco-Label Source, Argument Specificity, and Product Involvement on Consumer Trust. J. Advert. 2014, 43, 33–45. [Google Scholar] [CrossRef]
- Aertsens, J.; Verbeke, W.; Mondelaers, K.; Huylenbroeck, G.V. Personal Determinants of Organic Food Consumption: A Review. Br. Food J. Bradf. 2009, 111, 1140–1167. [Google Scholar] [CrossRef]
- Test Aankoop Peiling Test Aankoop: Meerderheid Consumenten Gewonnen Voor een Verplichte Nutri-Score. Available online: https://www.test-aankoop.be/action/persinformatie/persberichten/2020/peiling-nutri-score (accessed on 10 December 2020).
- Delhaize Belgium E-Shop Startpagina. Available online: https://www.delhaize.be/nl-be/shop/Naar-de-e-shop/c/v2WEB (accessed on 13 December 2020).
- Schau, E.M.; Fet, A.M. LCA Studies of Food Products as Background for Environmental Product Declarations. Int. J. Life Cycle Assess. 2008, 13, 255–264. [Google Scholar] [CrossRef]
- Thøgersen, J.; Haugaard, P.; Olesen, A. Consumer Responses to Ecolabels. Eur. J. Mark. Bradf. 2010, 44, 1787–1810. [Google Scholar] [CrossRef]
- Howse, E.; Hankey, C.; Allman-Farinelli, M.; Bauman, A.; Freeman, B. Buying Salad Is a Lot More Expensive than Going to McDonalds: Young Adults’ Views about What Influences Their Food Choices. Nutrients 2018, 10, 996. [Google Scholar] [CrossRef]
- Food and Agricultural Organization of the United Nations. Biodiversity and Sustainable Diets. 2010. Available online: http://www.fao.org/ag/humannutrition/29186-021e012ff2db1b0eb6f6228e1d98c806a.pdf (accessed on 19 January 2021).
- Rijksinstituut Voor Volksgezondheid en Milieu Milieubelasting Voedingsmiddelen. Available online: https://statline.rivm.nl/#/RIVM/nl/dataset/50060NED/table?ts=1594119197916 (accessed on 26 August 2020).
- Dutta-Bergman, M.J. Health Attitudes, Health Cognitions, and Health Behaviors among Internet Health Information Seekers: Population-Based Survey. J. Med. Internet Res. 2004, 6, e15. [Google Scholar] [CrossRef] [PubMed]
- Graham, T.; Abrahamse, W. Communicating the Climate Impacts of Meat Consumption: The Effect of Values and Message Framing. Glob. Environ. Chang. 2017, 44, 98–108. [Google Scholar] [CrossRef]
- de Groot, J.; Steg, L. Value Orientations to Explain Beliefs Related to Environmental Significant BehaviorHow to Measure Egoistic, Altruistic, and Biospheric Value Orientations. Environ. Behav. 2008, 40, 330–354. [Google Scholar] [CrossRef]
- Hess, R.; Visschers, V.H.; Siegrist, M. The Role of Health-Related, Motivational and Sociodemographic Aspects in Predicting Food Label Use: A Comprehensive Study. Public Health Nutr. 2012, 15, 407–414. [Google Scholar] [CrossRef] [PubMed]
- Satia, J.A.; Galanko, J.A.; Neuhouser, M.L. Food Nutrition Label Use Is Associated with Demographic, Behavioral, and Psychosocial Factors and Dietary Intake among African Americans in North Carolina. J. Am. Diet. Assoc. 2005, 105, 392–402. [Google Scholar] [CrossRef] [PubMed]
- Bacon, L.; Krpan, D. (Not) Eating for the Environment: The Impact of Restaurant Menu Design on Vegetarian Food Choice. Appetite 2018, 125, 190–200. [Google Scholar] [CrossRef] [PubMed]
- Statista Belgium: Share of Vegans and Vegetarians, by Region 2018. Available online: https://www.statista.com/statistics/807567/vegans-and-vegetarians-in-belgium-by-region/ (accessed on 4 December 2020).
- Carbonneau, E.; Lamarche, B.; Provencher, V.; Desroches, S.; Robitaille, J.; Vohl, M.-C.; Bégin, C.; Bélanger, M.; Couillard, C.; Pelletier, L.; et al. Associations Between Nutrition Knowledge and Overall Diet Quality: The Moderating Role of Sociodemographic Characteristics—Results From the PREDISE Study. Am. J. Health Promot. 2020, 0890117120928877. [Google Scholar] [CrossRef] [PubMed]
- Feunekes, G.I.J.; Gortemaker, I.A.; Willems, A.A.; Lion, R.; van den Kommer, M. Front-of-Pack Nutrition Labelling: Testing Effectiveness of Different Nutrition Labelling Formats Front-of-Pack in Four European Countries. Appetite 2008, 50, 57–70. [Google Scholar] [CrossRef] [PubMed]
- Ducrot, P.; Julia, C.; Méjean, C.; Kesse-Guyot, E.; Touvier, M.; Fezeu, L.K.; Hercberg, S.; Péneau, S. Impact of Different Front-of-Pack Nutrition Labels on Consumer Purchasing Intentions: A Randomized Controlled Trial. Am. J. Prev. Med. 2016, 50, 627–636. [Google Scholar] [CrossRef]
- Méjean, C.; Macouillard, P.; Péneau, S.; Hercberg, S.; Castetbon, K. Perception of Front-of-Pack Labels According to Social Characteristics, Nutritional Knowledge and Food Purchasing Habits. Public Health Nutr. 2013, 16, 392–402. [Google Scholar] [CrossRef] [PubMed]
- Poquet, D.; Ginon, E.; Goubel, B.; Chabanet, C.; Marette, S.; Issanchou, S.; Monnery-Patris, S. Impact of a Front-of-Pack Nutritional Traffic-Light Label on the Nutritional Quality and the Hedonic Value of Mid-Afternoon Snacks Chosen by Mother-Child Dyads. Appetite 2019, 143, 104425. [Google Scholar] [CrossRef] [PubMed]
- Grolleau, G.; Ibanez, L.; Mzoughi, N.; Teisl, M. Helping Eco-Labels to Fulfil Their Promises. Clim. Policy 2016, 16, 792–802. [Google Scholar] [CrossRef]
- Tobi, R.C.A.; Harris, F.; Rana, R.; Brown, K.A.; Quaife, M.; Green, R. Sustainable Diet Dimensions. Comparing Consumer Preference for Nutrition, Environmental and Social Responsibility Food Labelling: A Systematic Review. Sustainability 2019, 11, 6575. [Google Scholar] [CrossRef]
- Mahmood, K. Do People Overestimate Their Information Literacy Skills? A Systematic Review of Empirical Evidence on the Dunning-Kruger Effect. Commun. Inf. Lit. 2016, 10, 199–213. [Google Scholar] [CrossRef]
- Loeber, S.; Grosshans, M.; Herpertz, S.; Kiefer, F.; Herpertz, S.C. Hunger Modulates Behavioral Disinhibition and Attention Allocation to Food-Associated Cues in Normal-Weight Controls. Appetite 2013, 71, 32–39. [Google Scholar] [CrossRef] [PubMed]
- Moreno-Padilla, M.; Fernández-Serrano, M.J.; Reyes del Paso, G.A. Risky Decision-Making after Exposure to a Food-Choice Task in Excess Weight Adolescents: Relationships with Reward-Related Impulsivity and Hunger. PLoS ONE 2018, 13, e0202994. [Google Scholar] [CrossRef] [PubMed]
- Loewenstein, G. Out of Control: Visceral Influences on Behavior. Organ. Behav. Hum. Decis. Process. 1996, 65, 272–292. [Google Scholar] [CrossRef]
- US Department of Agriculture (USDA). Save More at the Store|ChooseMyPlate. Available online: https://www.choosemyplate.gov/eathealthy/budget/budget-save-more (accessed on 27 November 2020).
- Nayga, R.M. Nutrition Knowledge, Gender, and Food Label Use. J. Consum. Aff. 2000, 34, 97–112. [Google Scholar] [CrossRef]
- Huyghe, E.; Verstraeten, J.; Geuens, M.; Van Kerckhove, A. Clicks as a Healthy Alternative to Bricks: How Online Grocery Shopping Reduces Vice Purchases. J. Mark. Res. 2017, 54, 61–74. [Google Scholar] [CrossRef]
- Crosetto, P.; Lacroix, A.; Muller, L.; Ruffieux, B. Nutritional and Economic Impact of 5 Alternative Front-of-Pack Nutritional Labels: Experimental Evidence. Available online: https://hal.archives-ouvertes.fr/hal-01805431/document (accessed on 13 February 2021).
- Grolleau, G.; Mzoughi, N.; Sutan, A. Does Advertising the Green Benefits of Products Contribute to Sustainable Development Goals? A Quasi-Experimental Test of the Dilution Effect. Bus. Strategy Environ. 2019, 28, 786–793. [Google Scholar] [CrossRef]

| Factor | M | SD |
|---|---|---|
| Age | 20.64 | 1.59 |
| BMI | 22.11 | 3.23 |
| Health concern (5-point scale) | 3.64 | 0.57 |
| Environmental concern (7-point scale) | 4.19 | 0.41 |
| Egoistic values (9-point scale) | 5.19 | 1.14 |
| Altruistic values (9-point scale) | 7.92 | 0.96 |
| Biospheric values (9-point scale) | 7.39 | 1.19 |
| Peer descriptive norm (7-point scale) | 4.48 | 1.44 |
| Hunger (4-point scale) | 1.58 | 0.78 |
| Outcome | Label | M | SD | N |
|---|---|---|---|---|
| Label compliance score | Interpretative eco label | 10.61 | 4.25 | 47 |
| Interpretative nutrition label | 10.20 | 3.68 | 48 | |
| No label (control) | 9.89 | 3.75 | 47 | |
| Meat quantity (in grams) | Interpretative eco label | 78.29 | 84.63 | 47 |
| Interpretative nutrition label | 80.93 | 87.69 | 48 | |
| No Label (control) | 65.11 | 84.80 | 47 | |
| Carbon footprint (in grams) | Interpretative eco label | 3764.63 | 2065.30 | 47 |
| Interpretative nutrition label | 3791.85 | 2096.97 | 48 | |
| No Label (control) | 3266.39 | 2160.72 | 47 | |
| Blue water footprint (in liters) | Interpretative eco label | 114.13 | 54.60 | 47 |
| Interpretative nutrition label | 106.23 | 47.22 | 48 | |
| No Label (control) | 96.81 | 50.17 | 47 |
| Label Complexity | Label Theme | |
|---|---|---|
| Sustainability | Nutrition | |
| Interpretative | 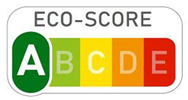 |  |
| Reductive |  | 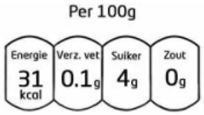 |
| Factor | M | SD |
|---|---|---|
| Age | 21.81 | 1.54 |
| Health concern (5-point scale) | 3.63 | 0.54 |
| Environmental concern (7-point scale) | 5.30 | 0.79 |
| Subjective nutrition knowledge (7-point scale) | 4.41 | 1.05 |
| Subjective environmental knowledge (7-point scale) | 3.38 | 1.06 |
| Hunger (4-point scale) | 2.08 | 1.17 |
| Outcome | Label | M | SD | N |
|---|---|---|---|---|
| Label compliance score | Interpretative eco label | 14.02 | 5.43 | 46 |
| Interpretative nutrition label | 13.47 | 4.43 | 53 | |
| No label (control) | 14.19 | 4.83 | 56 | |
| Meat quantity (in grams) | Interpretative eco label | 99.89 | 98.16 | 46 |
| Interpretative nutrition label | 121.04 | 101.98 | 53 | |
| No label (control) | 132.05 | 91.78 | 56 | |
| Carbon footprint (in grams) | Interpretative eco label | 3767.88 | 2342.41 | 46 |
| Interpretative nutrition label | 4459.54 | 2290.30 | 53 | |
| No label (control) | 4745.98 | 2426.59 | 56 | |
| Blue water footprint (in liters) | Interpretative eco label | 93.24 | 35.67 | 46 |
| Interpretative nutrition label | 103.86 | 36.00 | 53 | |
| No label (control) | 108.50 | 44.04 | 56 |
| Outcome | Label Theme | M | SD | N |
|---|---|---|---|---|
| Meat quantity (in grams) | Sustainability | 97.19 | 95.53 | 98 |
| Nutrition | 127.91 | 107.52 | 96 | |
| No label (control) | 132.05 | 91.78 | 56 | |
| Carbon footprint (in grams) | Sustainability | 3968.60 | 2474.59 | 98 |
| Nutrition | 4763.11 | 2572.23 | 96 | |
| No label (control) | 4745.98 | 2426.59 | 56 | |
| Blue water footprint (in liters) | Sustainability | 96.55 | 39.88 | 98 |
| Nutrition | 111.30 | 42.06 | 96 | |
| No label (control) | 108.50 | 44.04 | 56 |
| Outcome | Label Complexity | M | SD | N |
|---|---|---|---|---|
| Meat quantity (in grams) | Interpretative | 111.21 | 100.27 | 99 |
| Reductive | 113.63 | 105.38 | 95 | |
| No label (control) | 132.05 | 91.78 | 56 | |
| Carbon footprint (in grams) | Interpretative | 4138.17 | 2328.74 | 99 |
| Reductive | 4594.77 | 2751.39 | 95 | |
| No label (control) | 4745.98 | 2426.59 | 56 | |
| Blue water footprint (in liters) | Interpretative | 98.92 | 36.06 | 99 |
| Reductive | 108.98 | 46.18 | 95 | |
| No label (control) | 108.50 | 44.04 | 56 |
| Study 1 | Study 2 | ||||||
|---|---|---|---|---|---|---|---|
| Outcome | Label Group | M | SD | N | M | SD | N |
| Label compliance score | Interpretative eco label | 10.61 | 4.25 | 47 | 14.02 | 5.43 | 46 |
| Interpretative nutrition label | 10.20 | 3.68 | 48 | 13.47 | 4.43 | 53 | |
| Reductive eco label | - | - | - | - | - | - | |
| Reductive nutrition label | - | - | - | - | - | - | |
| No label (control) | 9.89 | 3.75 | 47 | 14.19 | 4.83 | 56 | |
| Meat quantity (in grams) | Interpretative eco label | 78.29 | 84.63 | 47 | 99.89 | 98.16 | 46 |
| Interpretative nutrition label | 80.93 | 87.69 | 48 | 121.03 | 101.98 | 53 | |
| Reductive eco label | - | - | - | 94.80 | 94.04 | 52 | |
| Reductive nutrition label | - | - | - | 136.40 | 114.64 | 43 | |
| No label (control) | 65.11 | 84.80 | 47 | 132.05 | 91.78 | 56 | |
| Carbon footprint (in grams) | Interpretative eco label | 3764.63 | 2065.30 | 47 | 3767.88 | 2342.41 | 46 |
| Interpretative nutrition label | 3791.85 | 2096.97 | 48 | 4459.54 | 2290.30 | 53 | |
| Reductive eco label | - | - | - | 4146.16 | 2595.56 | 52 | |
| Reductive nutrition label | - | - | - | 5137.28 | 2865.59 | 43 | |
| No label (control) | 3266.39 | 2160.72 | 47 | 4745.98 | 2426.59 | 56 | |
| Blue water footprint (in liters) | Interpretative eco label | 114.13 | 54.60 | 47 | 93.24 | 35.67 | 46 |
| Interpretative nutrition label | 106.23 | 47.22 | 48 | 103.86 | 36.00 | 53 | |
| Reductive eco label | - | - | - | 99.48 | 43.39 | 52 | |
| Reductive nutrition label | - | - | - | 120.48 | 47.33 | 43 | |
| No label (control) | 96.81 | 50.17 | 47 | 108.50 | 44.04 | 56 | |
Publisher’s Note: MDPI stays neutral with regard to jurisdictional claims in published maps and institutional affiliations. |
© 2021 by the authors. Licensee MDPI, Basel, Switzerland. This article is an open access article distributed under the terms and conditions of the Creative Commons Attribution (CC BY) license (http://creativecommons.org/licenses/by/4.0/).
Share and Cite
Hallez, L.; Qutteina, Y.; Boen, F.; Smits, T. The ABC’s of Ecological and Nutrition Labels. The Impact of Label Theme and Complexity on the Environmental Footprint of Online Grocery Choices. Sustainability 2021, 13, 2474. https://doi.org/10.3390/su13052474
Hallez L, Qutteina Y, Boen F, Smits T. The ABC’s of Ecological and Nutrition Labels. The Impact of Label Theme and Complexity on the Environmental Footprint of Online Grocery Choices. Sustainability. 2021; 13(5):2474. https://doi.org/10.3390/su13052474
Chicago/Turabian StyleHallez, Lotte, Yara Qutteina, Filip Boen, and Tim Smits. 2021. "The ABC’s of Ecological and Nutrition Labels. The Impact of Label Theme and Complexity on the Environmental Footprint of Online Grocery Choices" Sustainability 13, no. 5: 2474. https://doi.org/10.3390/su13052474
APA StyleHallez, L., Qutteina, Y., Boen, F., & Smits, T. (2021). The ABC’s of Ecological and Nutrition Labels. The Impact of Label Theme and Complexity on the Environmental Footprint of Online Grocery Choices. Sustainability, 13(5), 2474. https://doi.org/10.3390/su13052474