Abstract
Reducing non-revenue water (NRW) within a water distribution network may lead to significant water savings. Most existing literature tend to focus on the design and implementation aspects of NRW loss through better management of leaks, reservoir overflow, and water theft. In contrast, this paper examines the association between the various water pipe types and their respective impact on NRW loss in an emerging country. Malaysia is currently listed under emerging and developing economies category in the International Monetary Fund World Economic Outlook Database (October 2020). A correlation analysis is carried out using historical data obtained from the Malaysian water authority, covering fiscal years 2013 to 2017 (inclusive of both years). Further analysis is carried out by measuring the number of cases reported for two selected states in relation to the type of pipe materials used. Results show that there is a significant correlation between mild steel and polyethylene pipes to NRW loss. This study provides a better understanding of how water pipe types affect NRW loss, which is pertinent to developing best practices in the marketplace to manage NRW loss and protect water resources.
1. Introduction
Globally, the water development and supply sector’s economic sustainability are threatened by scarcity of freshwater around the world, and with ever rising demands straining the industry. The role of water service providers has become crucial in ensuring that water is distributed efficiently, equably, and sustainably. Unfortunately, they face several challenges, particularly, high losses of water within the distribution networks. These losses are reflected through non-revenue water (NRW) and are commonly defined as “the difference between the volume of water put into a water distribution system and the volume that is billed to customers” [1]. High NRW rates indicate that large volumes of water are mostly lost through leaks or breakage (real losses), water consumption that is not billed to customers (apparent losses), and unbilled authorized consumption [2,3,4]. One of the causes of high NRW rates in developing countries is the lack of incentives to promote more efficient and sustainable water management [5]. Approximately 32 billion cubic meters of treated water is lost worldwide each year due to physical breaks and leaks in water pipes. More than half of these losses tend to occur in developing countries, which exacerbates existing issues caused by disruption of supplies and poor water quality [6].
Given that water loss is a worldwide phenomenon [7], it is important to consider the context of water loss to the specific attributes of the local conditions. As reported by the Asian Development Bank in 2006, around 30% of produced water in South East Asian countries such as Indonesia, Malaysia, Thailand, Philippines, and Vietnam contribute to NRW [6]. Malaysia has been noted to have unusually high NRW values.
NRW in Malaysia
In recent years, water authorities in Malaysia have expressed concern over the issue of sustainable water management [8], due to high records of NRW rates. Pipe materials, joining methods of the distribution system components, the initial installation of system components, water conditions, and external environmental conditions contribute to the water loss problem [9]. The common types of pipes used in Malaysia’s water distribution system include asbestos-cement (AC), mild steel (MS), ductile iron (DI), polyethylene (PE), galvanized iron (GI), acrylonitrile butadiene (ABS), cast iron (CI), and un-plasticized polyvinylchloride (uPVC) [10].
Given the severity of the NRW issue, the Malaysian government in its Eighth Malaysia Plan 2001–2005 introduced numerous strategies and initiatives to curtail the water loss, including funding for replacing old water meters and enhancing the general public infrastructure [8,11]. Other incentives taken to tackle leakage problems and improve piping networks include replacing current asbestos–cement pipes with pipe materials with better durability such as ductile iron, mild steel, and polyethylene [12]. Although the government has implemented various incentive programs to curtail the NRW losses, the loss rate is still alarming. Figure 1 illustrates the trend of NRW rates in Malaysia over five years. It is evident that the NRW has gradually increased since 2014 [9,13,14,15]. In 2017, the NRW was recorded to be approximately 5929 million liters per day (MLD).
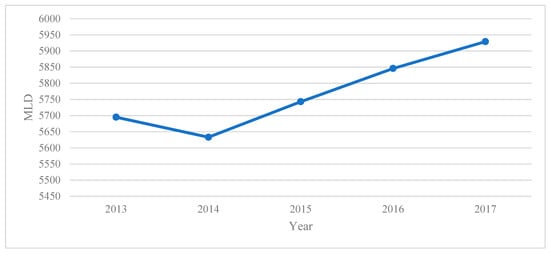
Figure 1.
Recorded NRW losses in Malaysia from 2013–2017. Note: MLD = million liters per day.
Given that physical losses stand as an undeniable source of water loss aside from commercial and unbilled authorized consumption, it is imperative to understand how different water pipe types contribute to the NRW losses. Yet, studies relating to water pipes and water loss phenomena are relatively limited. The NRW loss is mainly viewed as a water utility performance indicator [1]. Hence, many studies emphasize the design and implementation of aspects of NRW reduction through the improvisation of water utility performance [1,16,17]. Therefore, to gain a better insight into other contributing attributes of NRW, this study examines the association between the various types of water pipes and its significance on NRW loss. The types of water pipe studied in this paper are ductile iron, mild steel, and polyethylene. The remaining sections of the paper are structured as follows: Section 2 provides a comprehensive literature review of the various types of pipes utilized in the water networks and factors contributing to NRW in Malaysia. Section 3 outlines the research methodology used to analyze the factors that contribute to the cause of NRW. In Section 4, the results are presented, followed by a discussion on the implication of the results. In the final section, conclusions are drawn and limitations of the current study as opportunities for future research are included.
2. Literature Review
2.1. Non-Revenue Water (NRW)
NRW is a concerning issue faced by many nations worldwide [6,16,17,18]. High NRW loss has led to a considerable increase in the amount spent on operational and maintenance costs in ensuring undisrupted water supply to the end-users. NRW is defined as the “difference between the volume of water distributed by the system and the volume that is billed to customers” [1]. High NRW may indicate a high amount of water loss before it reaches the end-users, consequently leading to increased financial losses. According to the International Water Association (IWA), one of the causes of NRW rates is poor water resource management.
The components of NRW includes physical (or real) losses, commercial (or apparent) losses, and unbilled authorized consumption [19]. Real losses reflect the physical water losses due to leakages from parts of the distribution or overflow at storage tanks. The common causes of leakages and overflows are poor operations and maintenance, lack of active leak control, and degradation of underground assets [1,20]. The underground assets refer to part of an underground network such as water/drainage/sewerage, electricity, gas, or communications [20]. Commercial losses, sometimes referred to as apparent losses, include water metering errors, billing anomalies, and unauthorized consumption such as water theft. Water metering inaccuracy constitutes a large portion of commercial losses [21]. Furthermore, unbilled authorized consumption refers to the legitimate consumption of water, which is neither unbilled nor metered. Legitimate consumption constitutes water usage for firefighting, flushing of mains and sewers, street cleaning, frost protection, and supply of subsidized water because of government policies.
Countries like Singapore and Japan have successfully managed to lower their NRW rate tremendously through effective water management systems [18]. Other studies have highlighted that effective water management is pivotal in reducing NRW losses [1,16,17]. However, continuous improvement of NRW loss remains a challenge in many countries due to the technical difficulties and complexities of NRW management [1]. Particularly in Malaysia, the issue of NRW remains a challenge. One of the main contributing factors to this challenge is driven by low awareness among the public of the severity of the NRW issue and considering such a case to be the sole responsibility of the water authorities [22]. Additionally, the lack of cohesive government policy on water security and financial constraints further dampen the movement towards implementing NRW reduction programs [23,24]. Therefore, it is crucial to understand factors contributing to the NRW to establish an efficient water management system to reduce and control the NRW rate.
The research reveals that the NRW loss is the result of physical factors consisting of technical (system age, length, and type of network) and environmental factors (soil condition, traffic loading, and density of connections) [25]. In addition to physical and environmental factors, considerable emphasis should be placed on water management factors such as having sufficient trained staff to handle leakages and strong support from the water utility organizations [26]. In a cross-national study conducted over 63 countries, the authors concluded that the key drivers of water losses are linked to the physical characteristics of the water system and environmental factors such as urbanization and land settlement patterns [27]. Furthermore, high NRW rates may be caused by poor management, inadequate training of workers and experts, lack of timely replacement of devices, and inappropriate selection of pipes [28]. Research also shows that NRW is influenced by leakages due to aged and corroded underground assets [18]. However, it has been remarked that aged and corroded underground assets can be improved with pipe replacement and immediate repairs to burst cases. Hence, this study’s scope focuses on the different types of water pipes used in the water distribution system exiting the water reservoir.
2.2. Types of Water Pipes
Factors contributing to water leakages include old or poorly constructed pipelines, inadequate corrosion protection, poorly maintained valves, materials defects, faulty installation, excessive water pressure, water hammer, ground movement due to drought or freezing, extreme loads, and vibration from road traffic [29,30]. Beyond reservoir overflow and losses, one factor often highlighted was the effect of aged and corroded underground assets and their contribution to NRW rates. The solution to this problem is to replace aged and corroded pipes with new pipes. However, there is limited literature regarding pipe break rates segregated by pipe materials [31]. It is reported that the polyethylene piping system, which was replaced 20 years ago, has been catastrophically failing due to the usage of chlorine dioxide [32]. This demonstrates the piping system due to incompatibility of the piping material used in the water distribution system. Tabesh et al. emphasized that the “inappropriate quality selection of pipes and devices” can result in high NRW rates [28]. Therefore, it is crucial that the piping materials should be assessed before using it in the water distribution system.
This study aims to understand each type of water pipes’ characteristics and their effect on the NRW rate in the Malaysian context. The type of piping materials considered in this study includes ductile iron, mild steel, and polyethylene. In Malaysia, the main piping system is made up of mild steel pipes (29.1%), asbestos–cement pipes (27.1%), polyethylene pipes (19.0%), un-plasticized polyvinylchloride (14.3%), ductile iron pipes (8.0%), cast-iron pipes (0.5%), and others (2.1%) based on the 2017 data [10], as summarized in Figure 2.
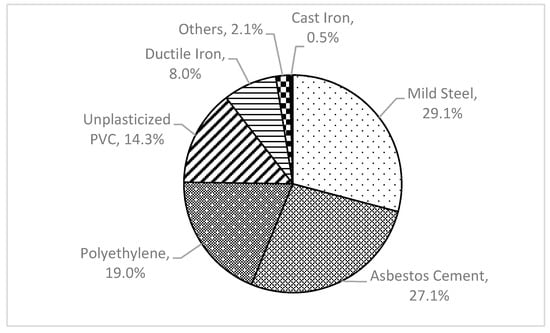
Figure 2.
Breakdown of piping materials used in the Malaysian main piping system.
It was reported that approximately half of the cases of pipe breaks annually resulted from asbestos–cement pipes [33]. To improve the NRW issue, the Malaysian government has invested in NRW reduction contracts [6] and replacement projects such as pipe replacement and water meter replacement [34,35,36]. As part of the proposed long-term solution, the replacement project involves the replacement of the existing asbestos–cement pipes with other piping materials such as ductile iron, mild steel, polyethylene, and modified un-plasticized polyvinyl chloride (MUPVC) [12]. Although asbestos–cement pipes were among the past options and served its purpose, these pipes are no longer plausible options, as the material poses health hazards [37,38]. In Malaysia, initiatives are taken towards reducing the use of asbestos [39,40].
2.2.1. Ductile Iron Pipes
Ductile iron pipes are pipes made from ductile cast iron [41]. Ductile iron pipes have been used in piping systems since the 1960s [42]. They were introduced to replace cast iron pipes due to issues of corrosion and manufacturing defects [41,43,44,45]. Compared to cast iron pipes, ductile iron pipes have increased resistance to breakage caused by rough handling in shipping and installation, with a greater margin of safety against service failures due to ground movements and beam stresses. The installation method for ductile iron pipes provides a clean tapping process using specialized tools and techniques using polyethylene encasement [46,47] along with a convenient spigot and socket joint. Ductile iron pipes have enhanced toughness, impact strength, and resistance towards corrosion compared to cast iron pipes [48]. Corrosion is a significant factor in the service life of pipes; it is reported that 28% of all pipe failures in the US were caused by corrosion [49]. Despite the improved strength and corrosion resistance in comparison with cast iron, graphitic corrosion is still possible in ductile iron pipes [50]. Graphitic corrosion is a deterioration that mainly occurs in gray cast iron, where metallic constituents are selectively leached and the graphite is left behind. The thin wall of metal pipes makes them more susceptible to corrosion. Thus, to reduce corrosion in metal pipes such as ductile iron and mild steel, pipe linings (inside the pipe) and coatings (outside the pipe) are used. With cement mortar lining, the said metal pipes will be more resistant to chemical degradation [51]. According to BS EN 545, ductile iron pipes are manufactured to be corrosion resistant.
2.2.2. Mild Steel Pipes
Steel pipes have been used for water distribution systems since the 19th century [44] as a substitute for iron pipes [52]. Generally, steel pipes are classified by the difference in chemical compositions, based on carbon. They are classified into three groups: low carbon (under 0.2% carbon), medium carbon (0.2% to 0.5% carbon), and high carbon (above 0.5% carbon) [53]. Mild steel pipes have a low carbon steel composition of below 0.2%. Particularly, mild steel has been widely used in industries and the water distribution systems due to low cost and availability in ease for fabrication cooling tower tanks and pipelines [54].
In comparison, mild steel pipes are stronger and more ductile than cast iron. However, mild steel pipes have lower corrosion resistance when compared to ductile iron in highly corrosive soil. Despite this, the mild steel pipe cost is lower compared to ductile iron pipes, and its welded joints offer many advantages in high-pressure pipes and flexibility [52,55]. Cement-lined mild steel pipes are mainly utilized for large transmission mains [56]. In an environment with highly corrosive soil, the usage of cement-lined mild steel pipes remains a concern, despite its low cost and advantages.
The issue of corrosion and leakages remains prominent. Traditional iron and steel pipelines were believed to have a long service life expectancy in the application of water distribution systems. However, its life expectancy has been reduced due to corrosion effects, especially in acidic soil environments. It is noted that the mechanism of corrosion depends on soil properties [57]. The deterioration of both ductile iron and steel pipe are greatly influenced by highly corrosive soil [52]. There are also complexities in protecting the inner surfaces using hand rendering of cement lining within mild steel pipes [58] at joints or tap-out points, which poses a higher risk of corrosion. These weak points cause corrosion to initiate and propagate, as mild steel is characterized by having low corrosion resistance and is often the source of water leakage.
2.2.3. Polyethylene Pipes
The development of polyethylene pipes has helped resolve the corrosion and leakage issues relating to traditional iron and steel pipelines, as polyethylene pipes are resilient to corrosion [41,59]. Different densities of materials are used for polyethylene pipes, such as low-density polyethylene (LDPE), medium-density polythene (MDPE), high-density polyethylene (HDPE), and linear low-density polyethylene (LLDPE). In general, polyethylene pipes are weaker (23 MPa in tensile strength) than steel pipes (400~650 MPa in tensile strength) [60,61,62]. Despite polyethylene pipes having corrosion resistivity, they can deteriorate under specific conditions, such as exposure to organic chemicals from chlorinated water and polluted soil [52,63]. Soil pollutants can diffuse through the polyethylene pipe, which affects the quality of drinking water [64]. In the case of chlorinated water, the usage of disinfectants deteriorates the wall of pipes through oxidation. Consequently, it embrittles the piping material over time, resulting in crack propagation due to internal pressure effects [65,66].
Literature has highlighted that an inappropriate selection of piping materials could lead to early failure of the water pipes, which may lead to high NRW loss. This study, therefore, explores the hypothesis that there is an association between types of pipes used and NRW loss. Thus, the hypothesis is postulated as:
Hypothesis 1:
There is an association between the types of pipes used and NRW loss, ceteris paribus.
3. Research Methodologies
Data collected on the volume of NRW losses per year and pipe lengths for this research were obtained from the Malaysian Water Industry Guide (MWIG) books published by the Malaysian Water Association, which specifically contain and provide a wide range of water industry data and statistics in Malaysia. The sample period covers the fiscal years from 2013 to 2017 (inclusive) and 70 state-year observations. This study employed multiple linear regressions using pooled ordinary least square regressions analysis. The sample period’s yearly variation is accounted for by introducing the year as a fixed effect. Given the nature of the data (a state-year case of panel), it was noted that the regressors were often highly correlated. Due to this, the error is correlated over time for a given state, resulting in heteroskedasticity in the residuals when it is estimated. White’s heteroskedastic robust estimator test was employed to account for heteroskedasticity in this study [67]. For this study, the following regression model was adopted:
where NRW is non-revenue water loss. LMS stands for the length of mile steel pipes, LDI refers to the length of ductile iron pipes, LPE is the length of polyethylene (HDPE variant) pipes, and LOP is the length of other pipes. Therefore, the length of water pipes refers to the level of usage of the pipes in the water network. In this study, mild steel pipes were widely used for large diameter pipes due to their ability to handle high strength and pressure, implying that they carry higher volumes of water than the other types. In this model, subscript β represents the beta coefficient, i represents the state, and t denotes time measured in years. A set of control variables was included in this model, and ɛ represents the random-error term. The definition and measurement of dependent, experimental, and control variables are explained in Appendix A.
For further analysis, the data on the number of news hits and water disruption notices that are available in the public domain were considered. The data was retrieved from Selangor (located in West Malaysia) and Sarawak (located in East Malaysia) due to the significant record of reports that included information about the type of pipes which failed. In Selangor, information on water disruptions and related types of pipe failures were gathered from several prominent online newspapers such as The Star, Malay Mail, and New Straits Times. Meanwhile in Sarawak, the types of pipe affected for each case were made available from water disruption notices provided by their state water authority website. Cases of water pipe leakage and bust pipes reported for both states are provided in Appendix B and Appendix C.
In this analysis, a case index is calculated by taking the number of cases divided by every 1000 km length of pipes laid in 2017, according to the corresponding pipe material reported. Since data on length of pipes according to pipe material in each state is not available after 2017 in the Malaysian Water Association official website, only cases within this timeframe were considered for consistency and comparison.
4. Results
Table 1 presents the NRW values for each state in Malaysia from 2013 to 2017 [10,13,14,15]. To obtain the values presented in Table 1, the NRW percentage is estimated based on the deduction of volumes of billed authorized consumption from the system input volume. Interestingly, 10 out of 14 states in Malaysia show an increase in NRW over the years. The related Malaysian states are denoted as * in Table 1.

Table 1.
NRW loss in million liters per day (MLD) and percentage (%) for each state in Malaysia.
Table 2 shows the total number of water service complaints on pipe burst/breakages/leak [10,13,14,15]. Based on the representation from Table 2, it is evident that six out of 14 states in Malaysia have shown an increase in terms of water service complaints on cases of pipe bursts/breakages/leaks. The growth in the number of cases signifies that there is an increased contribution towards real losses of NRW.
Table 2.
Total number of water service complaints on pipe bursts/breakages/leaks in each state.
The descriptive statistics of each variable are reported in Table 3. The mean NRW is 412.03 million liters per day with a standard deviation of 368.92. Meanwhile, the mean length of mild steel, ductile iron, and HDPE are 2959.5, 826.03, and 1839.84 km, respectively. The pipes with the longest lengths are mild steel.
Table 3.
Descriptive statistics (N = 70).
Table 4 presents the Pearson correlations between the variables. Non-revenue water (NRW) is found to be significantly and positively correlated with length of ductile iron pipes, length of mild steel pipes, length of polyethylene pipes, and length of other pipes listed in the Malaysian Water Industry Guide. At the same time, NRW is found to be significantly and positively correlated with domestic volume of water consumption (DVC), non-domestic volume of water consumption (NDVC), number of water services interruption scheduled (WSIS), number of water services interruption unscheduled (WSIUS), number of water services complaints of pipe bursts, breakages and leaks (WSC), and population served by state (POPSER). Some of the figures presented in Table 4 suggest absolute value exceeding 50%, which include those between LMS and NDVC (coeff. = 0.829, p = 0.00), between LMS and POPSER (coeff. = 0.867, p = 0.00), between DVC and NDVC (coeff. = 0.867, p = 0.00), between DVC and POPSER (coeff. = 0.897, p = 0.00), between NDVC and POPSER (coeff. = 0.874, p = 0.00), and between WSIS and POPSER (coeff. = 0.867, p = 0.00), and further, the absolute value between WCS and DVC (coeff. = 0.840, p = 0.00), between WCS and NDVC (coeff. = 0.818, p = 0.00), and between WCS and POPSER (coeff. = 0.785, p = 0.00). The variance inflation factor (VIF) for each independent variable is computed, and the mean VIF is 7.3 (unreported). For brevity, the results are not tabulated. This suggests that multicollinearity is not likely to be an issue in this analysis.
Table 4.
Pearson correlation (values are the correlation coefficients and p-values are in brackets).
The hypothesis presented in this paper predicts an association between the different types of pipes and NRW loss, ceteris paribus. Table 5 shows the influence of different types of pipes on NRW loss. The results show that the effects of different type of water pipes on NRW loss are positive and significantly correlated for mild steel pipes (β = 0.0849, t = 3.347, p = 0.0015) and HDPE pipes (β = 0.0687, t = 4.699, p < 0.01). The results support Hypothesis H1, thereby suggesting that mild steel and HDPE pipes positively contribute towards NRW loss. Table 5 also indicates that there are negative but insignificant association between ductile iron pipes (β = −0.0058, t = −0.126, p = 0.9003) and other pipes (β = −0.0037, t = −0.594, p = 0.5548) with NRW loss. This suggests that ductile iron and other pipes are not associated with NRW loss. Overall, the statistical results show that the types of water pipes have influence on the NRW loss.
Table 5.
Influence of water pipes on NRW loss in Malaysia.
The lengths of water pipes laid according to pipe materials for Selangor and Sarawak are presented in Figure 3. The distribution of pipe lengths in Selangor is very similar to the distribution seen in the entire country shown in Figure 1. Mild steel is mostly used, followed by other types of materials that consist of mostly asbestos cement water pipes. In contrast, ductile iron and polyethylene only take up a small portion of the pipes laid in Selangor. Therefore, one can say that Selangor could be a good representation of the distribution of water pipe material in the country in general. On the other hand, Sarawak took an unconventional approach compared to many other states in the country by using a lot of polyethylene, followed by ductile iron and very little mild steel. The data from Sarawak serves as a good contrast to the typical distribution in Selangor.
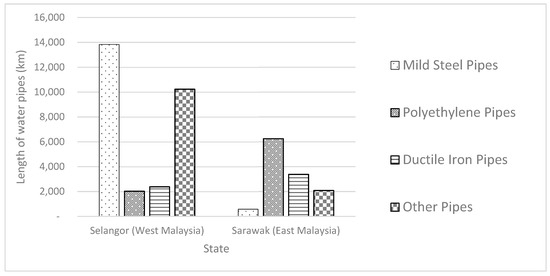
Figure 3.
Breakdown of piping materials used in Selangor and Sarawak.
Figure 4 shows the case index for Selangor and Sarawak between 2011 and 2017 (inclusive). The case index for Selangor has consistent ranking with the length of pipes laid in this state. Although the usage of ductile iron pipes was almost six times more than mild steel pipes in Sarawak, the case index is still the highest. Cases due to damaged pipe caused by construction projects were not included in this study.
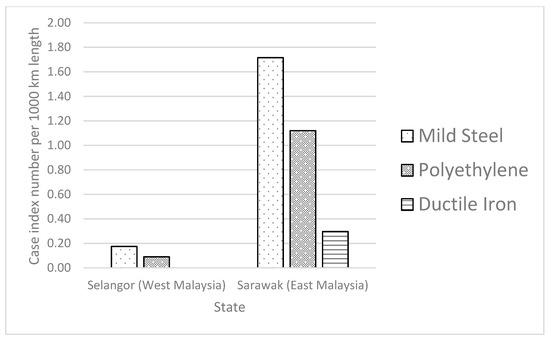
Figure 4.
Case index calculated for Selangor and Sarawak between 2011–2017.
Mild steel remains at the top for both states, followed by HDPE. The results from these case indexes measured supports the correlation study.
5. Discussion
NRW loss remains a crucial issue yet an endemic challenge in developing countries. The need to manage NRW better and protect precious water resources has become increasingly important. In this study, the association between different types of water pipes used and NRW loss was explored. Types of water pipes mainly affect NRW in the form of physical losses through pipe failures. The findings suggest that there is an association between different types of water pipes and NRW loss. Based on results presented, mild steel pipes had a significant effect on NRW loss. Despite the fact that mild steel pipes can carry large volumes of water for a relative length, they can contribute to NRW losses. Thereby, longer length usage of mild steel pipes suggests an increase on the plausibility of higher NRW loss. Similarly, results show that HDPE pipes are also associated with NRW loss. Thus, the longer length usage of HDPE pipes contributes towards NRW loss. On the contrary, ductile iron pipes were found to have an insignificant association with NRW loss. Overall, this study suggests that different kinds of water pipe have influence over NRW loss. Given the environment, inappropriate selection of water pipe can result in high failure rates, which increases NRW loss. Therefore, it is important to account for an appropriate selection of water pipes in the water distribution system.
Although applications of steel and iron pipelines are seen in the water distribution system, mild steel pipes appear to have a significant association to NRW loss in comparison to ductile iron pipes based on the correlation analysis and case index presented in this paper. Mild steel installation methods rely heavily on skilled workers to weld and seal off any exposed mild steel on both the inner and outer layer. The dominating factor for corrosion in steel water pipelines is coating wear and tear. These failures often occur due to negligence and improper application of coating [68]. In contrast, ductile iron pipes have an advantage of clean tapping process using specialized tools, which reduces the welding and installation skills dependencies [46,47]. These are important features for reticulation pipes, as they often have many tap-out points during new phases of development and for future expansion works. Hence, there are less tendencies for corrosion to propagate from joint failures in ductile iron pipes compared to mild steel pipes [69]. The life expectancy and performance could reach more than 100 years if they are designed and installed properly [70]. One study even showed that the flow test presented a “smooth” surface after 97 years of service [71].
For HDPE pipes, despite the advantage of eliminating the possibility of corroding, these pipes are easily damaged due to any unstable soil condition or weak soil support. Plastic pipes are also permeable when exposed to hydrocarbons and contaminated soil [72]. This could suggest that failure rates of polyethylene pipes are highly dependent on the environment. Therefore, the usage of polyethylene pipe in inappropriate or vulnerable environments could contribute a significant amount to NRW loss, after mild steel.
One possible confounding factor is large diameter pipe applications, where mild steel is a common choice. Nevertheless, this application may not represent the only major contribution to NRW loss. The pipes’ large size and high pressure also make leaks or breakage highly visible and thus quickly reported and repaired. The majority of NRW loss could have resulted from low volume leaks at numerous pipes of limited visibility.
6. Conclusions
This research provides insights on how different types of water pipes affect NRW loss in Malaysia. Given that mild steel pipes account for transporting large volumes of water before branching in a reticulation pipe system, one may assume that the total usage length contributing to NRW loss would be low. However, the results reveal that mild steel water pipes and polyethylene pipes contribute significantly toward NRW loss compared to ductile iron pipes in Malaysia, as different types of water pipes do affect NRW loss. Hence, water authorities need to reform and develop best practices in the marketplace to manage non-revenue water loss better and protect precious water resources. The correlation study is confined to using samples with varying pipe sizes or diameters. This study is also subjected to data availability restriction, particularly on factors relating to apparent losses and unbilled authorized water consumption. Future research could focus on apparent losses and unbilled authorized water consumption from the aspect of water metering losses with NRW loss.
Author Contributions
Conceptualization: P.R. and B.T.T.; methodology: P.R.; formal analysis: P.R.; resources: L.J.N.J.; writing—original draft preparation: P.R.; writing—review and editing: L.J.N.J., B.T.T., and D.K.; project administration: L.J.N.J. and D.K.; funding acquisition: L.J.N.J. All authors have read and agreed to the published version of the manuscript.
Funding
This research was funded by Jumbo Intuition Sdn. Bhd.
Institutional Review Board Statement
Not applicable.
Informed Consent Statement
Not applicable.
Data Availability Statement
Data available in a publicly accessible repository that does not issue DOIs. Publicly available datasets were analyzed in this study. This data can be found here: https://www.mwa.org.my/water-industry-guide/.
Acknowledgments
The authors extend their appreciation to Lillian Pui Yan Tan for her technical assistance and support throughout the project.
Conflicts of Interest
The authors declare no conflict of interest. The funders had no role in the design of the study; in the collection, analyses, or interpretation of data; in the writing of the manuscript; or in the decision to publish the results.
Appendix A
Table A1.
Variable definition.
Table A1.
Variable definition.
| Variables | Variables Definition |
|---|---|
| Dependent | |
| NRWi,t | Non-Revenue Water Loss in million liters per day; |
| Experimental | |
| LMSi,t | Length of Mild Steel pipes in kilometer; |
| LDIi,t | Length of Ductile Iron pipes in kilometer; |
| LPEi, t | Length of Polyethylene pipes in kilometer; |
| LOPi, t | Length of Other pipes in kilometer (inclusive of galvanized iron (GI) and acrylonitrile butadiene (ABS); |
| Control | |
| DVCi,t | Domestic Volume of Water Consumption in million liters per day; |
| NDVCi,t | Non-Domestic Volume of Water Consumption in million liters per day; |
| WSISi,t | Number of Water Services Interruption Scheduled. |
| WSIUSi,t | Number of Water Services Interruption Unscheduled. |
| WSCi,t | Number of Water Services Complaints of Pipe Burst, Breakages and Leak |
| POPSERi,t | Population served by state. |
| Year | Year dummy. |
Appendix B
Table A2.
Cases of Water Pipe Leakage and Burst Pipes Reported for Selangor (West Malaysia).
Table A2.
Cases of Water Pipe Leakage and Burst Pipes Reported for Selangor (West Malaysia).
Appendix C
Table A3.
Cases of Water Pipe Leakage and Burst Pipes Reported for Sarawak (East Malaysia).
Table A3.
Cases of Water Pipe Leakage and Burst Pipes Reported for Sarawak (East Malaysia).
References
- Frauendorfer, R.; Liemberger, R. The Issues and Challenges of Reducing Non-Revenue Water; Asian Development Bank: Mandaluyong, Philippines, 2010; ISBN 978-92-9092-398-5. [Google Scholar]
- Lambert, A.; Charalambous, B.; Fantozzi, M.; Kovac, J.; Rizzo, A.; Galea St John, S. 14 Years Experience of Using IWA Best Practice Water Balance and Water Loss Performance Indicators in Europe. In Proceedings of the IWA Specialized Conference, Water Loss, Vienna, Austria, 30 March–2 April 2014; pp. 1–31. [Google Scholar]
- Consolidated Utility District of Rutherford County Water Theft Policy. Available online: https://www.cudrc.com/water-theft/ (accessed on 30 September 2020).
- Bernama SPAN: Water Tariff Review Long Overdue; Malay Mail; Bernama: Kuala Lumpur, Malaysia, 2019.
- González-Gómez, F.; García-Rubio, M.A.; Guardiola, J. Why Is Non-Revenue Water So High in So Many Cities? Int. J. Water Resour. Dev. 2011, 27, 345–360. [Google Scholar] [CrossRef]
- Kingdom, B.; Liemberger, R.; Marin, P. The Challenge of Reducing Non-Revenue Rate (NRW) in Developing Countries- How the Private Sector Can Help: A Look at Performance-Based Service Contracting; Water Supply And Sanitation Sector Board Discussion Paper Series; The World Bank Group: Washington, DC, USA, 2006. [Google Scholar]
- Coles, C. “Teen Pregnancy and” Internal Poverty. Futurist 2005, 39, 9. [Google Scholar]
- Chelliapan, S.; Kamaruddin, S.; Zaini, N.; Othman, N.; Mohammad, R.; Nasri, N.; Yazid, N. Economic and Efficiency Indicators in Non-Revenue Water (NRW) Performance. Int. J. Civ. Eng. Technol. 2017, 8, 1419–1431. [Google Scholar]
- Lahlou, Z.M. Leak Detection and Water Loss Control. In Water Encyclopedia; Lehr, J.H., Keeley, J., Eds.; John Wiley & Sons, Inc.: Hoboken, NJ, USA, 2005; p. mv1817. ISBN 978-0-471-47844-7. [Google Scholar]
- The Malaysian Water Association (MWA). Malaysia Water Industry Guide 2018; The Malaysian Water Association (MWA): Kuala Lumpur, Malaysia, 2018. [Google Scholar]
- Abu-Bakar, M.S.; Ku-Mahamud, K.R.; Wan-Ishak, W.H. Identifying The Location And Magnitude of Non-Revenue Water: A Case Study at FELDA Chuping, Perlis. In Proceedings of the International Conference on Engineering & ICT (ICEI), Tunggal, Malaysia, 27–28 November 2007; Volume 2. [Google Scholar]
- Tan, V. Selangor Plans to Reduce Wasted Treated Water. TheStar, 12 January 2017. [Google Scholar]
- The Malaysian Water Association (MWA) Malaysia Water Industry Guide 2015; The Malaysian Water Association (MWA): Kuala Lumpur, Malaysia, 2015.
- The Malaysian Water Association (MWA) Malaysia Water Industry Guide 2016; The Malaysian Water Association (MWA): Kuala Lumpur, Malaysia, 2016.
- The Malaysian Water Association (MWA) Malaysia Water Industry Guide 2017; The Malaysian Water Association (MWA): Kuala Lumpur, Malaysia, 2017.
- Jabari, S.J. Non-Revenue Water Management In Palestine. Int. J. Urban Civ. Eng. 2017, 11, 953–959. [Google Scholar] [CrossRef]
- Murugan, S.S.; Chandran, S. Assessment of Non-Revenue Water in a Water Distribution System and Strategies to Manage the Water Supply. Int. Res. J. Eng. Technol. 2019, 6, 3488–3492. [Google Scholar]
- Kangangi, I.M. The Determinants of Non-Revenue Water in Water Services Provision in Kirinyaga Country in Kenya: A Case of Kirinyaga Water and Sanitation Company. Master’s Thesis, University of Nairobi, Nairobi, Kenya, 2015. [Google Scholar]
- Lambert, A.; Hirner, W. Losses from Water Supply Systems: Standard Terminology and Recommended Performance Measures; International Water Association: London, UK, 2000. [Google Scholar]
- Safework NSW Work near Underground Assets-Guide 2007; Safework: Wollongong, Australia, 2007.
- Criminisi, A.; Fontanazza, C.M.; Freni, G.; Loggia, G.L. Evaluation of the Apparent Losses Caused by Water Meter Under-Registration in Intermittent Water Supply. Water Sci. Technol. 2009, 60, 2373–2382. [Google Scholar] [CrossRef] [PubMed]
- Chan, N.; Lai, C.; Roy, R. Understanding Public Perception of and Participation in Non-Revenue Water Management in Malaysia to Support Urban Water Policy. Water 2017, 9, 26. [Google Scholar] [CrossRef]
- Lee, C. Water Tariff and Development: The Case of Malaysia; Working paper series; University of Manchester: Manchester, UK, 2005; ISBN 978-1-905381-16-6. [Google Scholar]
- Chan, N.W.; Lai, C.H.; Tan, D.T.; Roy, R.; Zakaria, N.A. Systems Thinking Approach for Analysing Non-Revenue Water Management Reform in Malaysia. Water Policy 2020, 22, 237–251. [Google Scholar] [CrossRef]
- Skipworth, P.J.; Saul, A.J.; Machell, J. The Effect of Regional Factors on Leakage Levels and the Role of Performance Indicators. Water Environ. J. 1999, 13, 184–188. [Google Scholar] [CrossRef]
- Farley, M.; Liemberger, R. Developing a Non-Revenue Water Reduction Strategy: Planning and Implementing the Strategy. Water Supply 2005, 5, 41–50. [Google Scholar] [CrossRef]
- van den Berg, C. Drivers of Non-Revenue Water: A Cross-National Analysis. Util. Policy 2015, 36, 71–78. [Google Scholar] [CrossRef]
- Tabesh, M.; Roozbahani, A.; Roghani, B.; Faghihi, N.R.; Heydarzadeh, R. Risk Assessment of Factors Influencing Non-Revenue Water Using Bayesian Networks and Fuzzy Logic. Water Resour Manag. 2018, 32, 3647–3670. [Google Scholar] [CrossRef]
- Hunaidi, O. Detecting Leaks in Water-Distribution Pipes. Constr. Technol. Update 2000, 40, 1–6. [Google Scholar]
- Georgia Environmental Protection Division (EPD). Water Leak Detection and Repair Program. In EPD Guidance Document 2007; Georgia Environmental Protection Division (EPD): Hong Kong, China, 2007. [Google Scholar]
- Wengstöm, T. Comparative Analysis of Pipe Break Rates: A Literature Review; Chalmers University of Technology: Göteborg, Sweden, 1993. [Google Scholar]
- Rutledge, M. Water-Treating Chemical Causing Early Failure in Hamilton Pipes. Journal-News, 2 December 2019. [Google Scholar]
- Rishyakaran, R. Selangor Should Prepare to Aggressively Replace Old Pipes; Malaysiakini: Petaling Jaya, Malaysia, 2016. [Google Scholar]
- Kaur, G. Selangor to Leverage on RM11bil Water Pipes Stockpile. TheStar, 24 February 2014. [Google Scholar]
- Lai, A.; Selva, M.N.T. RM125mil for New Pipes. TheStar, 4 November 2016. [Google Scholar]
- Bernama. Salcon to Replace Pipes for Air Selangor. TheStar, 18 September 2017.
- Toft, P.; Wigle, D.; Meranger, J.C.; Mao, Y. Asbestos and Drinking Water in Canada. Stud. Environ. Sci. 1981, 12, 77–89. [Google Scholar] [CrossRef]
- Luus, K. Asbestos: Mining Exposure, Health Effects and Policy Implications. Mcgill. J. Med. 2007, 10, 121–126. [Google Scholar] [PubMed]
- Safitri Zen, I.; Ahamad, R.; Gopal Rampal, K.; Omar, W. Use of Asbestos Building Materials in Malaysia: Legislative Measures, the Management, and Recommendations for a Ban on Use. Int. J. Occup. Environ. Health 2013, 19, 169–178. [Google Scholar] [CrossRef] [PubMed]
- Ab Razak, N.H.; Praveena, S.M.; Aris, A.Z.; Hashim, Z. Drinking Water Studies: A Review on Heavy Metal, Application of Biomarker and Health Risk Assessment (a Special Focus in Malaysia). J. Epidemiol. Glob. Health 2015, 5, 297–310. [Google Scholar] [CrossRef] [PubMed]
- Paradkar, A.B. An Evaluation of Failure Modes for Cast Iron and Ductile Iron Water Pipes. Master’s Thesis, University of Texas, Arlington, TX, USA, 2012. [Google Scholar]
- Rajani, B.; Kleiner, Y. Comprehensive Review of Structural Deterioration of Water Mains: Physically Based Models. Urban Water 2001, 3, 151–164. [Google Scholar] [CrossRef]
- Kirmeyer, G.J.; Richards, W.; Smith, C.D. An Assessment of Water Distribution Systems and Associated Research Needs; American Water Works Association Research Foundation: Denver, CO, USA, 1994. [Google Scholar]
- Walski, T.M. A History of Water Distribution. J.-Am. Water Work. Assoc. 2006, 98, 110–121. [Google Scholar] [CrossRef]
- Makar, J.M.; Desnoyers, R.; McDonald, S.E. Failure Modes and Mechanisms in Gray Cast Iron Pipe; NRC: Waterloo, ON, Canada, 2001; pp. 1–10. [Google Scholar]
- Gould, S.J.F.; Davis, P.; Marlow, D.R. Importance of Installation Practices for Corrosion Protection of Ductile Iron Pipe. Urban Water J. 2016, 13, 198–211. [Google Scholar] [CrossRef]
- Installation Guide for Ductile Iron Pipe 2016; DIPRA: Birmingham, Alabama, 2016.
- USEPA. Deteriorating Buried Infrastructure Management Challenges and Strategies; Office Of Ground Water And Drinking Water Distribution System Working Paper; USEPA: Washington, DC, USA, 2002. [Google Scholar]
- Folkman, S. Water Main Break Rates in the USA and Canada: A Comprehensive Study; Utah State University: Logan, UT, USA, 2018. [Google Scholar]
- Wang, W. Failure Analysis of Underground Pipeline Subjected to Corrosion. Ph.D. Thesis, RMIT University, Melbourne, Australia, 2018. [Google Scholar]
- Ruchti, G.F. (Ed.) Water Pipeline Condition Assessment; ASCE Manuals and Reports on Engineering Practice; The American Society of Civil Engineers: Reston, VA, USA, 2017; ISBN 978-0-7844-1475-0. [Google Scholar]
- Barton, N.A.; Farewell, T.S.; Hallett, S.H.; Acland, T.F. Improving Pipe Failure Predictions: Factors Affecting Pipe Failure in Drinking Water Networks. Water Res. 2019, 164, 114926. [Google Scholar] [CrossRef]
- Keil, B.; Devletian, J. Comparison of the Mechanical Properties of Steel and Ductile Iron Pipe Materials. In Proceedings of the Pipelines 2011 American Society of Civil Engineers, Washington, DC, USA, 23–27 July 2011; pp. 1301–1312. [Google Scholar]
- Ramesh, S.; Rajeswari, S.; Maruthamuthu, S. Effect of Inhibitors and Biocide on Corrosion Control of Mild Steel in Natural Aqueous Environment. Mater. Lett. 2003, 57, 4547–4554. [Google Scholar] [CrossRef]
- Twort, A.C.; Ratnayaka, D.D.; Brandt, M.J. Water Supply, 5th ed.; Arnold/IWA Pub: London, UK, 2000; ISBN 978-0-340-72018-9. [Google Scholar]
- Romano, M. Near Real-Time Detection and Approximate Location of Pipe Bursts and Other Events in Water Distribution Systems. Ph.D. Thesis, University of Exeter, Exeter, UK, 2012. [Google Scholar]
- Hou, Y.; Lei, D.; Li, S.; Yang, W.; Li, C.-Q. Experimental Investigation on Corrosion Effect on Mechanical Properties of Buried Metal Pipes. Int. J. Corros. 2016, 2016, 1–13. [Google Scholar] [CrossRef]
- SPAN Specification for Steel Pipes, Fittings and Joints for Water and Sewage—Part 1: Technical Delivery Requirements 2013; SPAN: Cyberjaya, Malaysia, 2013.
- Ellison, D.; Spencer, D. The True Causes of AC Pipe Failures—According to the Data. In Proceedings of the Pipelines 2016 American Society of Civil Engineers, Kansas City, MI, USA, 17–20 July 2016; pp. 637–647. [Google Scholar]
- Mitul, M. EN 10224 Grade L355 Carbon Steel Seamless Tubes—Ferropipe. Available online: https://www.ferropipe.com/en-10224-grade-l355-carbon-steel-seamless-tubes/ (accessed on 16 February 2020).
- Bonds, R.W. Material Comparisons: Ductile Iron Pipe vs. PVC-O Pipe 2017; DIPRA: Birmingham, Alabama, 2017. [Google Scholar]
- PE100+ Association PE & HDPE Pipe: Properties and Types of PE100 Pipe. Available online: https://www.pe100plus.com/PE-Pipes/Technical-guidance/Trenchless/Methods/PE-Pipe-i1341.html (accessed on 16 February 2020).
- Kowalska, B.; Klepka, T.; Kowalski, D. Influence of Chlorinated Water on Mechanical Properties of Polyethylene and Polyvinyl Chloride Pipes. In Proceedings of the 3rd International Conference on Design, Construction, Maintenance, Monitoring and Control of Urban Water Systems, Venice, Italy, 27–29 June 2016; pp. 63–74. [Google Scholar]
- Holder, S.L.; Hedenqvist, M.S.; Nilsson, F. Understanding and Modelling the Diffusion Process of Low Molecular Weight Substances in Polyethylene Pipes. Water Res. 2019, 157, 301–309. [Google Scholar] [CrossRef] [PubMed]
- Colin, X.; Audouin, L.; Verdu, J.; Rozental-Evesque, M.; Rabaud, B.; Martin, F.; Bourgine, F. Aging of Polyethylene Pipes Transporting Drinking Water Disinfected by Chlorine Dioxide. I. Chemical Aspects. Polym. Eng. Sci. 2009, 49, 1429–1437. [Google Scholar] [CrossRef]
- Ghabeche, W.; Alimi, L.; Chaoui, K. Degradation of Plastic Pipe Surfaces in Contact with an Aggressive Acidic Environment. Energy Procedia 2015, 74, 351–364. [Google Scholar] [CrossRef]
- White, H. A Heteroskedasticity-Consistent Covariance Matrix Estimator and a Direct Test for Heteroskedasticity. Econometrica 1980, 48, 817–838. [Google Scholar] [CrossRef]
- Joshi, T. An Evaluation of Large Diameter Steel Water Pipelines; University of Texas: Arlington, TX, USA, 2012. [Google Scholar]
- DIPRA, S. Ductile Iron Versus Steel. Available online: https://www.dipra.org/ductile-iron-pipe/dipra-facts-and-figures/ductile-iron-vs-steel (accessed on 1 January 2021).
- DIPRA Frequently Asked Questions—Corrosion Control. Available online: https://www.dipra.org/ductile-iron-pipe-resources/frequently-asked-questions/corrosion-control#:~:text=A%3A%20Properly%20designed%20and%20installed,do%20not%20change%20with%20age (accessed on 3 January 2020).
- DIPRA Charleston Water System: Flow Test of 97-Year-Old Cement-Mortar Lined Pipe. Available online: https://www.dipra.org/ductile-iron-pipe/pipeline/flow-test-of-97-year-old-cement-mortar-lined-pipe (accessed on 3 January 2020).
- Crippen, K.; Lever, E. The Impact of Heavy Hydrocarbon Permeation on PE Pipe. 2014. Available online: https://www.pe100plus.com/PPCA/The-Impact-of-Heavy-Hydrocarbon-Permeation-on-PE-Pipe-p1391.html (accessed on 16 February 2020).


Publisher’s Note: MDPI stays neutral with regard to jurisdictional claims in published maps and institutional affiliations. |
© 2021 by the authors. Licensee MDPI, Basel, Switzerland. This article is an open access article distributed under the terms and conditions of the Creative Commons Attribution (CC BY) license (http://creativecommons.org/licenses/by/4.0/).