Abstract
In this study, the impact of the electricity crisis on the economic growth of Nigeria is presented. Unlike other existing studies that checked the effect of electricity consumption on economic development or environmental sustainability for different countries, the present study will further present a techno-economic analysis of a proffered solution to the imminent electricity crisis. Time-series regression models are used to analyze the effect of electricity consumption on economic development and environmental sustainability while RETScreen professional software is used to perform a techno-economic analysis and determine the feasibility of a 500-kW microgrid Solar Photovoltaic (PV) system integrated for electricity generation. From the analysis results, a strong positive correlation effect is evident between electricity consumption and GNI, as well as a strong negative correlation between electricity consumption and gross domestic savings. Also, strong positive correlation effects are evident in the case of carbon emissions by buildings, by the power industry, and by other combustion industries on electricity consumption in Nigeria. Considering the net present value, internal rate of return and payback periods, the use of solar PV systems for electricity generation is feasible in the 12 different locations in Nigeria studied in this research. The most feasible area for solar PV installation is the northern part of Nigeria as Gombe and Kaduna recorded a simple PBP and an equity PBP are 6.3 years and 7.4 years respectively.
1. Introduction
The target of every country’s economy, be it developing, emerging, or developed country is to achieve sustainable development [1]. The globalization and growth rate witnessed by every economy is increasing the global energy demand consistently as this is a driver for most economic activities. Electricity has become a necessity and an integral part of day-to-day living due to its relationship with human’s industrial production, agricultural productivity, health, education, etc. [2]. Its accessibility enhances both domestic/residential needs and this positively correlates with economic factors like; reduced poverty, enhanced overall standard of living, and increased exportation [3]. Odekanle et al. [4] stated that the constant availability of energy supply for industrial, domestic, and agricultural purposes is a strong indicator of a community’s infrastructural development. In fact, energy consumption is a reflection of a nation’s development due to its immense contribution to socio-economic growth. Research has shown that there is a relationship between economic growth and total energy consumption for many developed countries, however, the share of electricity in the overall economic development of developing (African) countries was not considered [5]. Therefore, there is a need to study the impact of the electricity crisis in many African countries on its overall economic development. One of the main aims of the United Nations Sustainable Development Goals (UN-SDGs) is to provide access to modern and clean energy [6].
Globally, carbon emission from fossil fuel usage, cement production, and other industrial processes have played a significant role in global environmental sustainability. Adom et al. [7] studied the long-term effects of demographic, economic, and political indices on potential and actual carbon emissions. Their results showed that a higher oil and electricity price will reduce the current and future carbon emission [7]. The advantages and disadvantages of enforcing some emission restriction measures within carbon emission control areas were highlighted in another study [8]. It was reported that the introduction of emission restrictions will reduce the emitted sulfur oxide by 40.4%, however, this will require a significant decrease in the vessels sailed by liner shipping company [8]. Considering the transport sector, Lo et al. [9] analyzed the determinants of carbon emissions in air transport passenger traffic using Italy as a case study. They found that aircraft size decreases the emission per available seat kilometers but it increases total emissions [9]. The impact of economic growth on Azerbaijan carbon emissions shows that economic growth has a positive statistically significant impact on carbon emissions [10]. While Andersson et al. [11] presented the relationship between firm ownership and provincial carbon emissions in China, Lin and Xu [12] analyzed the regional differences in carbon emission efficiency in the Chinese metallurgical industry. In both studies, it is highlighted that carbon emission is an imminent global issue.
Nigeria has the largest economy and population in African and it is among the top 10 most populated in the world. Just like many African countries, Nigeria is still faced with the difficulty of meeting its ever-increasing population’s energy (especially electricity) demand [13]. Different governmental reforms and policies to rescue the situation in the energy sector have been ineffective over the years. The power sector has failed to provide electricity to over 40% of Nigerians in the last 10 years and over 80 million of its citizens are without access to electricity [14]. Even after five years of privatizing the electricity sector, the country’s electricity generation, transmission, and distribution remain erratic [15]. Ali et al. reported that the investors who acquired the electricity distribution and generation companies are grappled with problems like gas shortfall, water management, inadequate supply, electricity theft, limited distribution networks, and huge metering gap [1].
The energy crisis in the country has drawn both research and political attention to the need for an imminent solution and alternative sources to complement the existing system. Most researches [16,17,18], have proffered renewable energy integration is the most sustainable way forward. Ogundimu and Okoroigwe [19] presented the prospect and challenges of solar thermal energy for electricity production in Nigeria. They reported that fossil fuels subsidy in the country and the cost of solar thermal technology are two main factors discouraging investors and ultimately hindering the use of solar thermal technologies for electricity generation. Ejiofor et al. [20] studied the potential of rice husk gasification technology for off-grid electricity generation in Nigeria. A 1.52 MW power generation potential from rice husk which includes a yearly, monthly, and daily total generation of 13,132.8 MWh, 1094.4 MWh, and 36.48 MWh was reported from the study. The potential for electricity generation from abattoir wastes in Nigeria was presented in another study and an estimated range of 1040 MWh to 1665 MWh of electricity could be generated monthly from these wastes [4]. In another study, Tegina et al. [21] proposed the use of solar PV and wind turbines to fully drive the electricity sector. It was also estimated that about 1.54 million renewable energy technology jobs can be created in Nigeria by 2050. Similarly, Bamisile et al. [13] developed an approach for sustainable energy planning towards the full electrification of Nigeria by 2030 with the use of fossil fuels and renewable energy sources.
In all the aforementioned studies, it has been established that there is a need to increase electricity production in Nigeria, however, the impact of the on-going electricity crisis on the country’s economy is yet to be studied. Although Ali et al. [1] studied economic growth, urbanization, and electricity consumption nexus, their research only focused on the effect of rural-urban migration impact on electricity consumption and economic development. Though globalization, electricity consumption, and economic growth have been established as major players in the world’s environmental degradation in literature [22], this study only considered the top 10 electricity consuming countries globally. Therefore, in this paper, the impact of the electricity crisis in Nigeria on its economic growth is presented. As the world seeks to reduce carbon emissions, the sustainability of electricity production has been critically scrutinized in recent years. This research seeks will further this course by studying the impact of electricity consumption in Nigeria on its carbon emission. Unlike other existing researches in literature that checked the effect of electricity consumption on economic development [23,24] or environmental sustainability [25] for different countries, the present study will further present a techno-economic analysis of a proffered solution to the imminent electricity crisis. This study is novel as different time-series regression models are used to analyze the effect of electricity consumption on economic development and environmental sustainability. Also, RETScreen professional software is used to perform a techno-economic analysis and determine the feasibility of a small-scale off-grid solar photovoltaic (PV) system integrated for electricity generation. While the technical analysis will focus on the sizing of the system, the economic feasibility will present the payback period, net present value, and internal rate of return for the sized system. Ten different locations across Nigeria will be considered within the scope of this study for solar PV installation. This study will serve as a template for researchers to check the electricity consumption, carbon emission, and economic growth nexus. It will also enhance the knowledge of scholars about the techno-economic analysis of solar energy technology. A brief summary of Nigeria’s energy sector is presented in Section 2 of this paper while the electricity crisis in this country is detailed in Section 3. The effect of electricity consumption on the economic development and environmental sustainability of Nigeria based on data collected between 1971 and 2014 will be is presented in Section 4. A viable solution to the electricity crisis is proposed and analyzed in Section 5. The main concluding points are highlighted in Section 6.
2. Overview of Nigeria’s Energy and Electricity Sector
The electricity system in Nigeria is dominated by natural gas power plants. It accounts for 85% of the electricity produced while cars (and the transport sector in general) runs fully on diesel and gasoline (petrol) [26]. Therefore, satisfying the unmet electricity demand without increasing greenhouse gas emissions and considering resource constraints will create a dilemma for Nigeria’s energy decision-makers. To solve this crucial problem, the government has developed the National Renewable Energy and Energy Efficiency Policy (NREEEP). This policy is proposed for the sustainable development agenda and this will contribute to CO2 mitigation without ignoring its developmental priorities [27]. It outlines various programs and policies for the deployment and utilization of RE technologies. The NREEEP has short-term, medium-term, and long-term targets to integrate wind and solar energy into the commercial electricity sector. The long-term target year is 2030 and this includes the integration of over 6000 MW of solar (PV and CSP) electricity with other renewable electricity into the country’s power sector [28].
Nigeria has both Renewable (RE) and non-RE (conventional fossil) resource deposits in large quantities. However, these resources are un/under-utilized, leading to critical energy poverty in the country. For conventional energy or fossil fuel resources, Nigeria has a vast deposit of natural gas, coal, oil, and lignite. For renewables, there is a large potential energy source like solar, wind, biomass to hydropower [29]. Table 1 summarizes the reserves and potentials RE in Nigeria. Other fossil fuel sources like tar sand, bitumen, etc. are also available in the country [30]. Nigeria’s key Renewable Energy Sources (RES) are hydro, solar, biomass, geothermal energy, and wind [16]. Based on research, installing wind power plants appears to be more realistic in the coastal and northern parts of Nigeria [31]. Some potential sites for geothermal energy have been discovered in Nigeria, but they are yet to be explored on a large and useful scale. Some of the key factors limiting RE growth in Nigeria are (a) large fossil fuel deposits, (b) inadequate market clarity on the benefits/opportunities of RE to the private sector, (c) subsidies on oil and gas products, (d) high knowledge gaps on the financial support mechanisms available, and (e) poor power grid network [30].

Table 1.
Nigeria’s RE and non-RE reserves, potentials, and potentials [42,43].
Nigeria has 23 on-grid generating plants with a total installed capacity of 10,396 MW (out of which 6056 MW is the maximum available capacity). The only RE power plant connected to the power grid is hydro with an installed and an available capacity of 1938.4 MW and 1060 MW [32]. Also, there is a critical imbalance between power generation and transmission in Nigeria. The transmission network capacity is 5300 MW which is 29% lower than the theoretical generating capacity of 7500 MW and also about 41% lower than the available generation capacity. Because of the obvious inherent reliability issues in the transmission infrastructure, transmission losses are generally up to 7.4% [32]. Inadequate technological infrastructure, pertinent transmission issues, limited/zero access to the power grid, and insufficient power supply have all contributed to the energy poverty that has dominated Nigeria [33]. It is appalling that about 40% of Nigerians do not have access/connection to the electricity grid [13], while a significant percentage of those connected only have electricity from 0 to 15 hours daily [34]. Presently, it is practically impossible to have 100% renewable electrification as the hydro-power potential is limited [17]. To provide a solution to Nigeria’s electricity problem, researchers have made a series of recommendations. Aliyu et al. [35] detailed Nigeria’s electricity crisis with a special focus on capacity expansion and power generation. A 100% RE use for Nigeria electricity generation; comprehensive analysis of available RES and their potential for electricity generation was carried out Akuru et al. [17]. Considering the population and other factors, the future electricity demand for Nigeria was estimated in another study [36]. Electricity generation capacity was speculated to be 160 GW [33] and that load demand would be 19.6 TWh by the year 2030 [37].
The feasibility of generating hydrogen from biogas in south-western Nigeria has been analyzed and it was found that about 40.5 million tons of hydrogen could be generated yearly thereby producing 19.46 GWh of electricity [38]. The prospect of thermal grid electricity based on CSP was also reviewed by Ogunmodimu and Edmund [39] while Enongene et al. [40] analyzed the prospects of solar PV systems in residential buildings. Both studies found that solar energy is one of the most viable solutions to the present energy crisis in Nigeria. The effect of electricity consumption on economic development was presented in another literature [41]. It was discovered that the high the electricity demand and supply, the more the boost in the economy of the country.
Renewable Energy Potential and Utility in Nigeria
Solar energy is abundant and it is the most promising of all the RES in Nigeria. It has received much attention in recent decades due to the abundance of sunlight and it is seen to be a promising renewable energy source for the future [44]. Nigeria is close to the equator; hence the potential for large-scale solar development to drive the economy is feasible. The annual technical potential of solar energy with a 5% conversion efficiency in Nigeria is estimated to be 1.50 × 10¹⁸ J of energy [45]. The estimated average radiating solar energy in Nigeria is about 3.84 kWh/m2/day and this is about 1.082 million tons of oil equivalent in a day [45]. The solar potential in this country is also about 4000 times the current daily crude oil production and about 13,000 times the natural gas daily production [46]. The total energy demand of the nation could be met if only 0.1% of the total solar energy potential on Nigeria’s landmass is converted to electricity (using a 1% efficiency) [47]. In 2018, the total solar energy utilized to generate electricity only produced 28.2 GWh [48].
Despite the relatively huge potential of wind power generation in Nigeria, its development has been nonexistent over the years. The only prominent wind power plant in Nigeria is located in Rimi village, Katsina state and it has 37 wind turbines with a total capacity of 10 MW [49]. It is disappointing that despite the enormous potential, the total wind energy utilized for commercial electricity generation is zero or not documented as of 2019 [48]. Power generation using large hydropower contributes about 30% to the total installed generation capacity [50].
The combined electricity generation capacity from small hydropower in Nigeria is about 3500 MW [51]. In this country, energy is obtained from the 3 major hydropower stations at Kainji, Jebba, and Shiroro [52]. According to International Renewable Energy Agency (IRENA) [48], in 2018, the total hydropower potential (excluding pumped storage) utilized for electricity generation in Nigeria produced 6758 GWh.
Biomass is one of the potential resources for enormous RE power generation because of its availability and the application of traditional biomass energy in Nigeria. If this resource is tapped, it will reduce the adversative environmental and socio-economic effects of energy shortages in the country [53]. However, structured policies should be implemented effectively. Nigeria has the potential to produce an estimated 47.97 MTOE annually from biomass resources [54], however, it is very difficult to determine the consistency of this resource (Figure 1). Biomass production for energy generation can be a direct replacement for fossil fuels and also serve as a backup for the exhaustible fossil fuel resources. This will in turn reduce CO2 emissions and further decrease global warming [53]. The biogas potentials in Nigeria are vast but technical skills and infrastructures for widespread biogas production are insufficient [50]. On average, over 60,952 tons of CO2 can be reduced yearly if biogas is used to displace kerosene [55]. The IRENA has documented that the total bioenergy utility for the purpose of generating electricity in Nigeria is 25 GWh. This amount is from bioenergy solid biofuels (no electricity is generated from biogas and bioenergy municipal wastes) [48]. Table 2 presents the total renewable electricity generated in Nigeria in 2018 compared with other countries as reported by IRENA [48]. The report includes electricity generation from renewable energy resources such as hydropower, wind energy onshore, wind energy offshore, solar PV, solar thermal, bioenergy (solid biofuels), bioenergy (biogas), bioenergy (municipal wastes), geothermal energy, and marine energy.
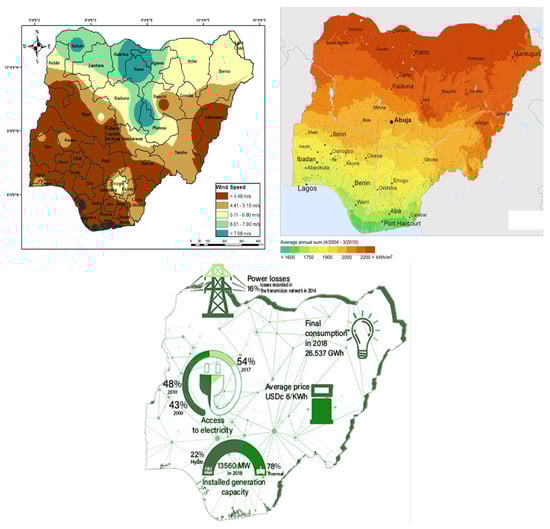
Figure 1.
Nigeria renewable (solar/wind) energy potential and electricity sector outlook [55,56,57].
Table 2.
Renewable electricity generation in Nigeria compared with other countries in 2018.
3. Nigeria Electricity Sector Crisis
The unavailability and inaccessibility of electricity in Nigeria keep increasing yearly and this is a major challenge yet to be resolved [13]. Globally, Nigeria is one of the poorest countries in terms of electricity generation. The grid-connected electricity per-capita consumption of this nation is 126 kWh. This is very low when compared with other African/developing countries (South Africa (3926 kWh) and Ghana (361 kWh)) [58]. Over 41% of the Nigerian populace has little or no access to electricity; this is more than 80 million people. Nigeria’s power sector problems affect the generation, transmission, and distribution arm of the power network. It is noteworthy that just 25% of the generated electricity is delivered for users’ consumption [59]. The remaining 75% is lost in the generation, transmission, and distribution process. Nigeria depends on gas-fired power plants for more than 80% of its electricity while hydropower generates less than 20% [60]. For several decades, electricity crisis in Nigeria has become a norm. This has led to the bane of her economic growth and development. The root causes of this deficiency are connected to financial, sociopolitical, and structural issues [60]. The major challenges facing the power generation companies are highlighted as follows:
- Pipelines are frequently vandalized by militants in Nigeria. Between June 2014 and June 2015, Nigeria National Petroleum Corporation (NNPC) recorded 3400–4000 attacks on the various pipeline locations in the country [61].
- Secondly, purchasing gas from the oil and gas companies to ensure adequate delivery of gas to fire the thermal power plants is another key issue. This is due to the price at which natural gas is sold to the electricity-generating companies. It leads to an increase in the price of electricity which eventually leads to a high cost of doing business [60].
- Thirdly, incessant strike actions embarked upon by different energy-based organizations. This causes gas supply to thermal power stations to be shut-off leading to a drop in the quantity of power available from the national grid by more than 70%. This action is capable of shutting down the country’s economy as the supply of electricity to consumers is highly dependent on the delivery of natural gas to these power stations.
Nigeria’s power sector is at the mercy of the availability of gas and adequate gas supply infrastructure, creating an urgent need for alternative ways of producing electricity. Finding permanent solutions that will resolve these problems is a herculean task for the government. This situation persists even though Nigeria is well endowed with a large amount of RE and non- RES. Most of the electricity generated in Nigeria comes from non-RES. Although the Nigerian federal government targets over 30% integration of renewables into the energy mix by 2030 [62], it is important for the country to respond to the demand of the circumstances and act fast on its energy policies.
Proposed Solutions to Nigeria Electricity Sector Crisis
In order to meet the high demands of electric power, there is a need to adopt multiple sources of energy with proper energy policies. The low power generation experienced in Nigeria since independence is mainly due to the nations’ concentrated efforts on electricity generation from only two sources which are hydro and natural gas [63]. From keen observation and obvious results both in literature and experiences, these two energy sources have been poorly harnessed and mismanaged. To overcome the challenge of low power generation in this country, there is a need to supplement both hydro and gas with other energy sources such as solar and wind [64]. It is also recommended that the current electric power generation capacity will have to rise to 160 GW by 2030 to solve Nigeria’s electricity sector crisis [36]. Adequate finance must be set aside for the operation, maintenance, upgrading, and expansion of the power sector infrastructure to solve this electricity crisis. Researchers have recommended different solutions to combat the crisis in Nigeria’s electricity sector and the most outstanding solutions are summarized in Table 3. However, no research in literature considered the role of EVs and hydrogen production in order to enhance renewable integration for electricity generation as a potential solution.
Table 3.
Summary of proposed solutions to Nigeria electricity sector crisis from literature.
4. Effect of Electricity Consumption on Economic Development and Carbon Emission
In this section, the impacts of the erratic nature of electricity availability to end-users on the country’s overall economic development are analyzed. Also, its effect on the environmental sustainability of Nigeria is considered. Panel estimators are used in regressing electricity consumption against economic indicators. The details of the method and the result of the analysis are presented in the subsequent subsections.
4.1. Panel Estimator
In analyzing the effect of inadequate electrification on economic development and environmental sustainability in Nigeria, economic development and greenhouse emissions data have been collected. First, the effect of economic development on electricity consumption between 1981–2014 is analyzed. The economic development indicator variables utilized in the model as the explanatory variables include gross national income (GNI), trade, gross domestic savings (GDS), and domestic credit to the private sector (DCPS). Electricity consumption is the primary response variable. Second, Nigeria’s carbon emissions data in six categories namely total carbon emissions, emissions by the power industry, by the transportation sector, by buildings, by other combustion industries, and by other sectors are used as response variables against economic development between 1981–2014. Third, the effect of carbon emissions on electricity consumption in Nigeria is analyzed by using the categorized carbon emissions data as predictor variables and electricity consumption as the response variable between 1971–2014.
GNI has been used in place of GDP as it has become a preferable measure of economic growth in the past few decades. While GDP measures the gross value added by residents within a country, GNI considers the total value produced by a country from within and without. The major shortcoming of simply using GDP is that it fails to attribute appropriately, the economic ups and downturns as real changes in cyclical fluctuations. GNI is therefore a reliable alternative with a more complete picture as an economic metric. In checking the impact of economic development on carbon emissions, Lin et al. [69] and Dong et al. [70], also considered GNI as a more appropriate measure of economic growth. Trading of goods and services alongside FDI inflow are often considered as factors leading towards economic growth [71,72]. Increased savings and domestic credit to the private sector which depicts investment into the private sector have also been added as economic development indicators. Table 4 provides the variables, definition, sources, and abbreviations for all the predictor and response variables used in the present study.
Table 4.
Definition of Variables.
Two time series data sets have been collected for Nigeria. First, economic data and electricity consumption data between 1981–2014, and carbon emissions and electricity consumption data from 1971–2014. The analysis is done by using the time series linear regression model according to the literature specifications [77,78]. First, the analysis is done in static form, and then in one-year finite distributed lag form with all autoregressive dynamics in place. The standard static time series formula is therefore implemented as:
where Y is the dependent variable, t time period, the population Y-intercept, and the error term. With the finite distributed lag form defined as:
As a robustness measure, the autoregressive integrated moving average (ARIMA) test model is also utilized in order to capture autoregressive dynamics more explicitly. The ARIMA test model is most appropriate as a robustness measure for better understanding, analyses, and forecasting of the time series data. The standard ARIMA model formula is therefore implemented as:
where L is the lag operator, are the autoregressive parameters, and the error term. The augmented dickey-fuller test for stationarity is also carried out.
Stata and R statistical program has been used as the tool for running each econometric model described above and also for plotting the bivariate scatter plots. Table 5 reports the descriptive statistics first for electricity consumption, carbon emissions, and economic development for Nigeria between 1981–2014, and then electricity consumption and carbon emissions from 1971–2014.
Table 5.
Descriptive Statistics.
4.2. Empirical Results and Discussions
In this section, the time series static, finite distributed lag, and ARIMA test model estimation results are discussed to check the effect of economic development on electricity consumption and carbon emissions, as well as the impact of carbon emissions on electricity consumption in Nigeria between 1981–2014, and 1971–2014 respectively. Economic development indicators used include GNI, trade, GDS, and DCPS. To first get a visual representation of the correlation between these variables, bivariate scatter plots have been provided in Figure 2 and Figure 3 showing the effect of electricity consumption on economic development from 1981–2014, and then the carbon emissions and electricity consumption nexus effect.
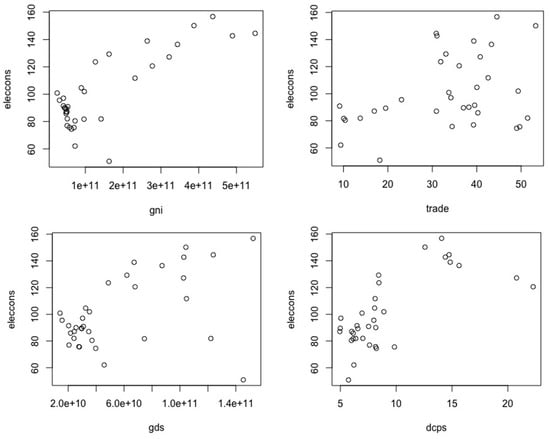
Figure 2.
Effect of Economic Development on Electricity Consumption from 1981–2014.
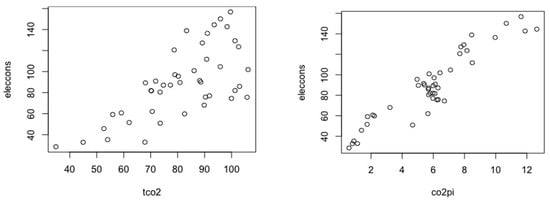
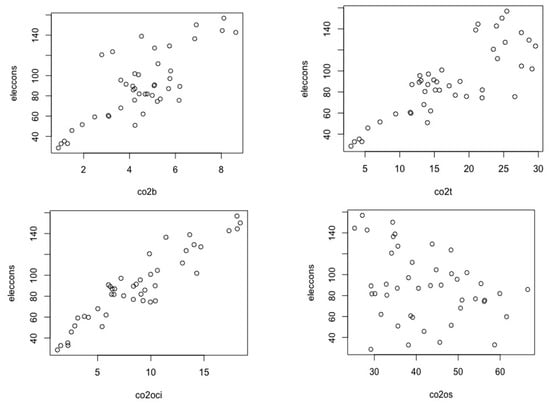
Figure 3.
Effect of Carbon Emissions on Electricity Consumption from 1971–2014.
In Figure 2, a strong positive correlation effect is evident between electricity consumption and GNI, as well as electricity consumption and gross domestic savings between 1981 and 2014 while the others do not show particularly strong positive or negative correlations. This signifies that as electricity consumption increases, the GNI of the country increase. This further stresses the need for more electricity supplies to end-users as this will increase the overall economic development of the country. The negative correlation between electricity correlation and GDS is a reflection of the current reality of the country. Due to the erratic nature of the electricity supply available, many end-users are forced to generate their own electricity using small-scale electricity generating sets (popularly known as generators). The purchase, operation, and maintenance of these generators consume a significant amount of their income, thereby reducing their savings. Hence the negative correlation between electricity consumption and GDS.
In Figure 3, strong positive correlation effects are evident in the case of carbon emissions by buildings, by the power industry, and by other combustion industries on electricity consumption in Nigeria between 1971 and 2014. However, it is noteworthy that electricity consumption does not affect the total CO2 emission of the nation. To empirically test these nexus effects, the time series regression model is utilized in static form and then in one year finite distributed lag form. As a robustness measure, the ARIMA test model is implemented to check these effects. Table 6 comprehensively reports findings for all 3 models as regards the effect of economic development on electricity consumption and carbon emissions in 6 layers.
Table 6.
Estimation Results for Effect of Economic Development on Electricity Consumption and Carbon Emissions from 1981–2014.
The effect of economic development on electricity consumption and carbon emissions in Nigeria from 1981–2014 is presented in Table 6 using three models. These are static time series regression model, a 1-year lag finite distributed model, and ARIMA test model as a robustness measure. The static model which checks the effect of the economic predictors on the response variables shows that gross national income and electricity consumption are strongly positively correlated. This indicates that a unit increase in GNI results in increased electricity consumption at a 1% significance level in the same year. In contrast, gross domestic savings and electricity consumption are negatively correlated at a 5% significance level. This indicates that increased domestic savings amount to a decrease in electricity consumption in the same year. In the one year finite distributed lag model, the most significant effect is once more seen between GNI and electricity consumption at a 1% significance level. This indicates that GNI increase in 1981 for instance positively impacts electricity consumption in 1982 and onwards. The ARIMA test model agrees with the static and one year finite distributed lag regression findings in that GNI and electricity consumption remain strongly positively correlated while GDS and electricity consumption remain strongly negatively correlated at a 1% significance level. These findings agree with other studies on electricity consumption and economic growth in that economic growth tends to act as a catalyst for increased electricity consumption [79,80].
Furthermore, economic development as a predictor variable has also been tested on six other response variables which are categories of carbon emissions in Nigeria. In the static model, total carbon emissions and GNI are positively correlated at the 10% significance level while trade and total carbon emissions are strongly positively correlated at the 1% significance level. This indicates that as an economic development indicator, trading activity increases amount to increases in total carbon emissions in the same year. Strong significant effects are also evident in terms of carbon emissions by the power industry and by buildings. For these two categories, GNI increase amounts to increased carbon emissions while DCPS and emissions are strongly negatively correlated at a 1% significance level. This indicates that as domestic credit to the private sector in Nigeria increases, emissions by the power industry and buildings decrease in tandem.
As for the transportation sector, an increase in trading activities is found to negatively affect carbon emissions levels in the same year and similarly in the case of a one-year lag. Such that increased trading activities aggravate the carbon emissions by the sector. This finding agrees with recent studies that have found the carbon footprint of the transportation sector especially high [81,82].
Additionally, carbon emissions by the other combustion industries and sectors are similarly found to be aggravated by increases in trading activities. Interestingly, although carbon emissions by the other combustion industries are aggravated by increases in gross national income, a negative effect is the case in terms of emissions by all other sectors. Indicating that carbon emissions are reducing in other economic sectors besides building, transport, and the power industry. These findings are further reiterated by the ARIMA test model at stronger significance levels. Table 7 reports the estimation results of the 3 models on the effect of carbon emissions on electricity consumption between 1971–2014. The first and second models are the time series regression in static form and then one-year finite distributed lag form. ARIMA test model is used as the third model as a robustness measure. All autoregressive dynamics are in place.
Table 7.
Effect of Carbon Emissions on Electricity Consumption from 1971–2014.
Using the time series static regression model, Table 7 shows that carbon emissions by the power industry and by the other combustion industries have strong positively significant correlations with electricity consumption at 5% and 1% significance levels respectively. This indicates that increased carbon emissions by the power and other combustions industries amount to increased electricity consumption rates in the same year. The one year finite distributed lag model also provides the same positive significant effect at the 5% significance level. It shows that increased carbon emissions by the power and other combustion industries in 1971 for instance, results in an increase in electricity consumption in 1972. The ARIMA test model further reiterates the same finding at the 1% significant level with significant sigma and critical values. As the power industry is predominantly responsible for energy production and the other combustion industries for high levels of greenhouse gas emissions, it is no surprise that out of all the sectors, their impact on electricity consumption is most evident.
5. The Way Forward; Techno-Economic Feasibility of Solar PV System in Nigeria
As stated in Section 3, different researchers have proposed different methods to solve the current electricity crisis in Nigeria. One of the most feasible solutions is the use of renewable energy sources for electricity generation considering an off-grid system or a smart/micro-grid. Adesanya and Pearce [83] evaluated the economic viability of captive off-grid diesel and solar PV hybrid energy systems. Their model was proposed for six different Nigerian private sectors. The analysis results showed that five of the six sectors had discounted payback times for the systems under the same year and the return on investment is greater than 100% [83]. Salihu et al. [84] presented an off-grid PV microgrid developmental study for rural electricity generation in Nigeria. They reported that the commissioning of the project in January 2018 improved the economic activities and social life of the beneficiary communities greatly [84]. Following the propositions in existing literature, the present study will present the techno-economic analysis of a 500-kW PV installation for 12 different locations in Nigeria. An off-grid (microgrid) system is considered for the feasibility study and a schematic diagram of the PV layout is illustrated in Figure 4. Also, a fixed axis solar PV system is considered as it is the most utilized solar PV technology in Sub-Sahara Africa. Further details about the techno-economic analysis are presented in subsequent subsections.
Figure 4.
Solar PV microgrid layout for Nigeria.
5.1. Site Selection
The electricity crisis in Nigeria has plagued all its urban and rural communities as there is no particular location that has 24 h of electricity supply consistently. Therefore, in this study, 12 different locations from all the geo-political zones in Nigeria have been considered for solar PV installation. These locations have been selected based on the available data in the National Aeronautics and Space Administration (NASA) database. The performance comparison of solar PV off-grid systems will also be done in this study. This will help determine the most feasible location for the solar PV installation. The details of each of the locations considered in this study are summarized in Table 8.
Table 8.
Effect of Carbon Emissions on Electricity Consumption from 1971–2014.
5.2. Materials and Methods
In this section, the materials used for the simulation of the off-grid PV installation is justified. RETScreen simulation program is used to execute the designed 500 kW PV system. This simulation program has been used for different techno-economic feasibility studies in existing works of literature [85,86,87]. In this study, a China Sunergy PV module with 200 kW peak capacity is used considering the PV module availability in the RETScreen database. The module has a module efficiency of 15.7% and a practical efficiency of 15.3% (as stated in Table 9). The PV module is also chosen based on its availability in the market and it has been used in other existing studies [87] that considered the feasibility of PV installation. Other details such as current, voltage, operating temperature, etc. of the PV module are summarized in Table 9.
Table 9.
Photovoltaic module specifications [87,88].
A 650 kW inverter system is used in modeling the solar PV micro-grid system in accordance with works of literature [85,86,87]. The PV modules and the inverters are considered to have 3.2% and 1% miscellaneous losses respectively. Also, the inverter used in this study has an efficiency of 95%. The operative relative humidity of the solar PV module is 40–95% while the frame of the module is made with an anodized aluminum profile. In summary, the capacity factor of the PV system varies from one location to the other and these are similar to the capacity factor used in another study that considered PV installation in Nigeria [13].
5.3. Economic Parameters
To calculate the economic viability of the proposed solution, it is important to use the appropriate economic variables. It is noteworthy that Nigeria’s currency (Naira) has been fluctuating in recent years and therefore a 420 Naira to a Dollar exchange rate is used for the economic analysis presented while all the calculations are made/presented in Dollars. In this study, the total investment (including, installation, PV modules, inverter, development, periodic, engineering, and balance of system component) cost for the 500 kW PV installation is $757,500 [13,89]. Based on the most recent electricity tariff update in Nigeria, the electricity pricing used for the economic analysis in this study is $ 0.1484 per kilowatt-hour [90]. Also, 1% of the total investment cost is considered as the annual operation and maintenance (O&M) cost [87]. Furthermore, the interest rate is set at 4%, and a 22-years project life span is used in calculating the economic viability [91]. Although most solar PV systems’ life span is 25 years, it is noteworthy that the production of the system reduces by 10% or more after the first 20–22 years, therefore, 22 years has been used in this study. An inflation rate of 1% is considered while a 15% effective income tax is used for the analysis.
5.4. Results and Discussions
In this study, a 500-kW PV system is simulated based on technical and economic parameters in order to determine its viability in different locations in Nigeria. RETScreen simulation program has been used for the analysis and the feasibility will be determined based on different economic indicators (PBP, IRR, NPV). For comparison purposes, the capacity of the PV plants is the same for all the locations considered and therefore the required solar collector area (3266 m2) is the same. However, the electricity production from the PV systems varies from one location to the other as seen in Figure 5. Typically, the solar radiation in the northern part of Nigeria is higher (Table 8) in comparison to the other parts of the country. This is evident in the electricity produced for the PV plants analysis in Northern locations namely; Gombe (858 MWh/yr), Kaduna (855 MWh/yr), and Abuja (824 MWh/yr). Based on the result of the analysis, Port-Harcourt (PH) had the least yearly electricity export rate (582 MWh/yr) followed by Warri (675 MWh/yr) and Aba (MWh/yr).
Figure 5.
Comparison of electricity production by the PV systems for different locations.
The electricity production rate of the PV plant for each of the locations is directly proportional to the cumulative cashflow rate (Figure 6). While the cash flow for the Northern locations is higher, locations like Ankpa, Enugu, Ibadan, Osogbo, and Onitsha all had a comparatively similar income cashflow rate. Although the use of storage systems has not been considered in the scope of this study, the yearly electricity production from the PV plants in all the locations shows the potency of the technology for solving the current electricity crisis. Considering the NPV, IRR, and PBP for the projects in all the locations, it can be concluded that the use of solar PV is economically viable. A project is said to be feasible if the NPV is greater than 1. As seen in Table 10, the net present value for all the locations is between $794,108 and $1,245,681. This further justifies the importance of decentralized renewable energy-based off-grid systems for meeting Nigerians electricity needs.
Figure 6.
Cash cumulative flow for different locations.
Table 10.
Summary of the electricity production and the economic indicators for the 500-kW installation in all the locations.
The pre-tax and after-tax IRR also reflect that the use of solar PV for electricity production will be a good investment for both private individual and commercial companies/organization. Since solar radiation is mostly available during working hours, the integration of solar PV plants without storage systems will be more suitable for office/commercial buildings. The simple payback period and the equity payback period of the project in all the locations is also very feasible. For Gombe and Kaduna, the simple PBP and equity PBP are 6.3 years and 7.4 years respectively (Figure 7). it is noteworthy that the simple PBP and equity PBP for all the locations are less than 10 years (excluding Equity PBP for PH). This further shows that this is the right way forward if the country will solve its electricity crisis soon.
Figure 7.
Simple and Equity PBP for 500-kW PV installation in Nigeria.
As seen in Table 10, other economic parameters such as; annual life cycle saving, benefit-cost ratio, electricity production cost, and electricity export income show that the project will be viable in any location in Nigeria. Also, considering the continuous increase in Nigeria’s electricity tariffs in recent years, the economics of solar PV utilization will increase positively within the next few years. This will further make the project more viable and bring-in more profit for investors. Comparing the difference in locations, the northern part of Nigeria is more suitable for solar PV utilization while the extreme south (PH and Warri) is the least suitable. The integration of the PV system in the western part (Osogbo, Lagos, and Ibadan), as well as the eastern part (Onitsha, Enugu) of the country, has similar performance.
Apart from the economic and technical feasibility of the solar PV plant, the environmental sustainability of the project further justifies its importance. The 500-kW will reduce the yearly CO2 emission by a substantial amount (677 tCO2/yr–861 tCO2/yr). Also, considering the 22-years lifespan of the project, about 21,513 tCO2/yr can be saved from being emitted to the atmosphere by installing a 500-kW PV plant in Gombe. The total emission reduction for all the locations is summarized in Table 11.
Table 11.
Emission reduction summary.
6. Conclusions
In this study, the electricity crisis in Nigeria has been discussed extensively and some of the proposed solutions in works of literature were reviewed and presented. Also, the effect of the electricity crisis on the economic development of Nigeria over the years has been analyzed based on the data collected between 1971 and 2014. The use of solar PV microgrid system for electricity generation has been proposed as the way forward and the techno-economic viability of the solution has been analyzed extensively. The main concluding points from this study are highlighted as follows:
- Based on the time series regression analysis, electricity consumption affects the GNI of the country. Therefore, it can be concluded that economic consumption affects the country’s GNI and an increase in electricity consumption will increase the country’s GNI.
- While electricity consumption affects the CO2 emission from the power industry and other combustion industries, it is noteworthy that the electricity consumption of Nigeria does not affect the total carbon emission. This further shows the inadequacies in the power industry and it can be concluded that the use of more sustainable means of electricity generation will not affect the country’s environmental sustainability.
- The techno-economic analysis of solar PV micro-grid application for electricity generation showed that this is one of the most effective immediate solutions to the power sector crisis in Nigeria. Considering the economic indicator (NPV, IRR, and PBP) results for the use of a 500-kW solar PV system for electricity generation in 12 different locations in Nigeria, it can be concluded that the use of solar PV is an economically viable solution to the imminent electricity crisis.
In the future study, the use of other renewable energy sources available in Nigeria will be considered for electricity generation. Also, the integration of storage will be analyzed to show the feasibility of total electricity production based on renewable energy sources. It is noteworthy that the techno-economic analysis presented in this study only considers the use solar PV for the micro-grid and this is a limitation for the solution presented. In the future, the use of other renewable energy-based technologies will be considered for further analysis.
Author Contributions
Conceptualization, M.M.; S.O.; N.Y.; Z.Q.; O.B.; P.J.; and Y.I.I.; methodology, M.M.; S.O.; N.Y.; Z.Q.; O.B.; P.J.; and Y.I.I.; software, M.M.; S.O.; N.Y.; Z.Q.; O.B.; P.J.; and Y.I.I.; validation, M.M.; S.O.; N.Y.; Z.Q.; O.B.; P.J.; and Y.I.I..; formal analysis, M.M.; S.O.; and O.B.; investigation, M.M.; S.O.; N.Y.; Z.Q.; O.B.; P.J.; and Y.I.I.; resources, M.M.; S.O.; N.Y.; Z.Q.; O.B.; P.J.; and Y.I.I.; data curation, M.M.; S.O.; N.Y.; Z.Q.; O.B.; P.J.; and Y.I.I.; writing—original draft preparation, M.M.; S.O.; N.Y.; Z.Q.; O.B.; P.J.; and Y.I.I.; writing—review and editing, M.M.; S.O.; N.Y.; Z.Q.; O.B.; P.J.; and Y.I.I.; visualization, M.M.; S.O.; N.Y.; Z.Q.; O.B.; P.J.; and Y.I.I.; supervision, M.M.; S.O.; N.Y.; Z.Q.; O.B.; P.J.; and Y.I.I.; project administration, M.M.; S.O.; N.Y.; Z.Q.; O.B.; P.J.; and Y.I.I.; funding acquisition. All authors have read and agreed to the published version of the manuscript.
Funding
This research received no external funding.
Institutional Review Board Statement
Not applicable.
Informed Consent Statement
Not applicable.
Data Availability Statement
The data presented in this study are available on reasonable request from the corresponding author.
Conflicts of Interest
The authors declare no conflict of interest.
References
- Ali, H.S.; Nathaniel, S.P.; Uzuner, G.; Bekun, F.V.; Sarkodie, S.A. Trivariate modelling of the nexus between electricity consumption, urbanization and economic growth in Nigeria: Fresh insights from Maki Cointegration and causality tests. Heliyon 2020, 6, e03400. [Google Scholar] [CrossRef] [PubMed]
- Asumadu-Sarkodie, S.; Owusu, P.A. Recent evidence of the relationship between carbon dioxide emissions, energy use, GDP, and population in Ghana: A linear regression approach. Energy Sources Part B Econ. Plan. Policy 2017, 12, 495–503. [Google Scholar] [CrossRef]
- Poveda, A.C.; Martínez, C.I.P. Trends in economic growth, poverty and energy in Colombia: Long-run and short-run effects. Energy Syst. 2011, 2, 281–298. [Google Scholar] [CrossRef]
- Odekanle, E.L.; Odejobi, O.J.; Dahunsi, S.O.; Akeredolu, F.A. Potential for cleaner energy recovery and electricity generation from abattoir wastes in Nigeria. Energy Rep. 2020, 6, 1262–1267. [Google Scholar] [CrossRef]
- Ozturk, I.; Acaravci, A. Electricity consumption and real GDP causality nexus: Evidence from ARDL bounds testing approach for 11 MENA countries. Appl. Energy 2011, 88, 2885–2892. [Google Scholar] [CrossRef]
- Owusu, P.A.; Asumadu-Sarkodie, S.; Ameyo, P. A review of Ghana’s water resource management and the future prospect. Cogent Eng. 2016, 3, 1164275. [Google Scholar] [CrossRef]
- Adom, P.K.; Kwakwa, P.A.; Amankwaa, A. The long-run effects of economic, demographic, and political indices on actual and potential CO2 emissions. J. Environ. Manag. 2018, 218, 516–526. [Google Scholar] [CrossRef]
- Dulebenets, M.A. Advantages and disadvantages from enforcing emission restrictions within emission control areas. Marit. Bus. Rev. 2016, 1, 107–132. [Google Scholar] [CrossRef]
- Lo, P.L.; Martini, G.; Porta, F.; Scotti, D. The determinants of CO2 emissions of air transport passenger traffic: An analysis of Lombardy (Italy). Transp. Policy 2020, 91, 108–119. [Google Scholar] [CrossRef]
- Mikayilov, J.I.; Galeotti, M.; Hasanov, F.J. The impact of economic growth on CO2 emissions in Azerbaijan. J. Clean. Prod. 2018, 197, 1558–1572. [Google Scholar] [CrossRef]
- Andersson, F.N.G.; Opper, S.; Khalid, U. Are capitalists green? Firm ownership and provincial CO2 emissions in China. Energy Policy 2018, 123, 349–359. [Google Scholar] [CrossRef]
- Lin, B.; Xu, M. Regional differences on CO2 emission efficiency in metallurgical industry of China. Energy Policy 2018, 120, 302–311. [Google Scholar] [CrossRef]
- Bamisile, O.; Huang, Q.; Xu, X.; Hu, W.; Liu, W.; Liu, Z.; Chen, Z. An approach for sustainable energy planning towards 100 % electrification of Nigeria by 2030. Energy 2020, 197, 117172. [Google Scholar] [CrossRef]
- Bamisile, O.; Huang, Q.; Dagbasi, M.; Alowolodu, O.; Williams, N. Development and Assessment of Renewable Energy-Integrated Multigeneration System for Rural Communities in Nigeria: Case Study. J. Energy Eng. 2020, 146, 1–10. [Google Scholar] [CrossRef]
- Okafor, C. Nigeria’ s Power Sector: 58 Years of Falling behind Expectations. 2018. Available online: https://www.thisdaylive.com/index.php/2018/10/02/nigerias-power-sector-58-years-of-falling-behind-expectations/ (accessed on 1 December 2020).
- Shaaban, M.; Petinrin, J.O. Renewable energy potentials in Nigeria: Meeting rural energy needs. Renew. Sustain. Energy Rev. 2017, 29, 72–84. [Google Scholar] [CrossRef]
- Akuru, U.B.; Onukwube, I.E.; Okoro, O.I.; Obe, E.S. Towards 100% renewable energy in Nigeria. Renew. Sustain. Energy Rev. 2015, 71, 943–953. [Google Scholar] [CrossRef]
- Oyewo, A.S.; Aghahosseini, A.; Bogdanov, D.; Breyer, C. Pathways to a fully sustainable electricity supply for Nigeria in the mid-term future. Energy Convers. Manag. 2018, 178, 44–64. [Google Scholar] [CrossRef]
- Ogunmodimu, O.; Okoroigwe, E.C. Solar thermal electricity in Nigeria: Prospects and challenges. Energy Policy 2019, 128, 440–448. [Google Scholar] [CrossRef]
- Ejiofor, O.S.; Okoro, P.A.; Ogbuefi, U.C.; Nnabuike, C.V.; Okedu, K.E. Off-grid electricity generation in Nigeria based on rice husk gasification technology. Clean. Eng. Technol. 2020, 100009. [Google Scholar] [CrossRef]
- Tegina, I.T.; Dioha, M.O.; Failler, P. Renewable energy scenarios for sustainable electricity supply in Nigeria. Energy Clim. Chang. 2020, 100017. [Google Scholar] [CrossRef]
- Rahman, M.M. Environmental degradation: The role of electricity consumption, economic growth and globalisation. J. Environ. Manag. 2020, 253, 109742. [Google Scholar] [CrossRef] [PubMed]
- Fang, D.; Hao, P.; Yu, Q.; Wang, J. The impacts of electricity consumption in China’s key economic regions. Appl. Energy 2020, 267, 115078. [Google Scholar] [CrossRef]
- Rajkumari, L. Relation between electricity consumption and economic growth in Karnataka, India: An aggregate and sector-wise analysis. Electr. J. 2020, 33, 106768. [Google Scholar] [CrossRef]
- Obiora, S.C.; Bamisile, O.; Opoku-Mensah, E.; Frimpong, A.N.K. Impact of banking and financial systems on environmental sustainability: An overarching study of developing, emerging, developed economies. Sustainability 2020, 12, 8074. [Google Scholar] [CrossRef]
- Dioha, M. Nigeria’s Renewable Energy Policy: A Fantasy or Reality? Renew. Energy World 2018. Available online: https://www.renewableenergyworld.com/solar/nigerias-renewable-energy-policy-a-fantasy-or-reality/#gref (accessed on 20 December 2020).
- Ministry of Power Federal Republic of Nigeria. National Renewable Energy and Energy Efficiency Policy (Nreeep) Approved by Fec for the Electricity Sector; Ministry of Power Federal Republic of Nigeria: Abuja, Nigeria, 2015. Available online: http://admin.theiguides.org/Media/Documents/NREEE%20POLICY%202015-%20FEC%20APPROVED%20COPY.pdf (accessed on 20 June 2020).
- Offiong, P. Nigerian Renewal Energy and Energy Efficiency Policy (NREEEP)—Climate Scorecard; 2019; Available online: https://www.climatescorecard.org/2019/02/nigerian-renewal-energy-and-energy-efficiency-policy-nreeep/ (accessed on 20 June 2019).
- Bamisile, O.; Dagbasi, M.; Babatunde, A.; Ayodele, O. A review of renewable energy potential in Nigeria; Solar power development over the years. Eng. Appl. Sci. Res. 2017, 44, 242–248. [Google Scholar] [CrossRef]
- GET Invest. Nigeria Renewable Energy Potential. 2014. Available online: https://www.get-invest.eu/market-information/nigeria/renewable-energy-potential/ (accessed on 20 June 2020).
- Wellig, S.D.; Nusslé, S.; Miltner, D.; Kohle, O.; Glaizot, O.; Braunisch, V.; Obrist, M.K.; Arlettaz, R. Mitigating the negative impacts of tall wind turbines on bats: Vertical activity profiles and relationships to wind speed. PLoS ONE 2018, 13, e0192493. [Google Scholar] [CrossRef] [PubMed]
- Commission, N.E.R. Power Generation in Nigeria. 2018. Available online: https://www.nercng.org/index.php/home/nesi/403-generation# (accessed on 20 June 2019).
- Monyei, C.G.; Adewumi, A.O.; Obolo, M.O.; Sajou, B. Nigeria’s energy poverty: Insights and implications for smart policies and framework towards a smart Nigeria electricity network. Renew. Sustain. Energy Rev. 2017, 81, 1582–1601. [Google Scholar] [CrossRef]
- Dada, J.O. Towards understanding the benefits and challenges of Smart/Micro-Grid for electricity supply system in Nigeria. Renew. Sustain. Energy Rev. 2014, 38, 1003–1014. [Google Scholar] [CrossRef]
- Aliyu, A.S.; Ramli, A.T.; Saleh, M.A. Nigeria electricity crisis: Power generation capacity expansion and environmental ramifications. Energy 2013, 61, 354–367. [Google Scholar] [CrossRef]
- Ibitoye, A.; Adenikinju, F.I. Future demand for electricity in Nigeria. Appl. Energy 2007, 84, 492–504. [Google Scholar] [CrossRef]
- Ibrahim, H.; Kirkil, G. Electricity Demand and Supply Scenario Analysis for Nigeria Using Long Range Energy Alternatives Planning (LEAP). J. Sci. Res. Rep. 2018, 19, 1–12. [Google Scholar] [CrossRef]
- Ayodele, T.R.; Alao, M.A.; Ogunjuyigbe, A.S.O.; Munda, J.L. Electricity generation prospective of hydrogen derived from biogas using food waste in south-western Nigeria. Biomass. Bioenergy 2019, 127, 105291. [Google Scholar] [CrossRef]
- Ogunmodimu, O.; Okoroigwe, E.C. Concentrating solar power technologies for solar thermal grid electricity in Nigeria: A review. Renew. Sustain. Energy Rev. 2018, 90, 104–119. [Google Scholar] [CrossRef]
- Enongene, K.E.; Abanda, F.H.; Otene, I.J.J.; Obi, S.I.; Okafor, C. The potential of solar photovoltaic systems for residential homes in Lagos city of Nigeria. J. Environ. Manag. 2019, 244, 247–256. [Google Scholar] [CrossRef]
- Iyke, B.N. Electricity consumption and economic growth in Nigeria: A revisit of the energy-growth debate. Energy Econ. 2015, 51, 166–176. [Google Scholar] [CrossRef]
- Emodi, K.J.; Boo, N.V. Sustainable energy development in Nigeria: Current status and policy options. Renew. Sustain. Energy Rev. 2015, 51, 356–381. [Google Scholar] [CrossRef]
- Ley, K.; Gaines, J.; Ghatikar, A. The Nigerian Energy Sector: An Overview with a Special Emphasis on Renewable Energy, Energy Efficiency and Rural Electrification. 2015. Available online: https://www.giz.de/en/downloads/giz2015-en-nigerian-energy-sector.pdf (accessed on 1 June 2019).
- Babatunde, A.A.; Abbasoglu, S.; Senol, M. Analysis of the impact of dust, tilt angle and orientation on performance of PV Plants. Renew. Sustain. Energy Rev. 2018, 90, 1017–1026. [Google Scholar] [CrossRef]
- Lin, B.; Ankrah, I. On Nigeria’s renewable energy program: Examining the effectiveness, substitution potential, and the impact on national output. Energy 2019, 167, 1181–1193. [Google Scholar] [CrossRef]
- Idigbe, S.O.; Onohaebi, K.I. Repositioning the power industry in Nigeria to guarantee reliability in operations and services. J. Eng. Appl. Sci. 2009, 4, 119–125. [Google Scholar]
- Bugaje, I.M. Renewable energy for sustainable development in Africa: A review. Renew. Sustain. Energy Rev. 2006, 10, 603–612. [Google Scholar] [CrossRef]
- IRENA. Renewable Energy Technologies; IRENA: Abu Dhabi, UAE, 2020; Available online: https://www.irena.org/-/media/Files/IRENA/Agency/Publication/2020/Mar/IRENA_RE_Capacity_Statistics_2020.pdf (accessed on 1 June 2019).
- Salisu, L.; Garba, I. Electricity Generation Using Wind in Katsina State, Nigeria. Int. J. Eng. Res. Technol. 2013, 2, 1–13. [Google Scholar]
- Aliyu, A.S.; Dada, J.O.; Adam, I.K. Current status and future prospects of renewable energy in Nigeria. Renew. Sustain. Energy Rev. 2015, 48, 336–346. [Google Scholar] [CrossRef]
- Kela, R.; Usman, K.M.; Tijjani, A. Potentials of Small Hydro Power in Nigeria: The Current Status and Investment Opportunities. Int. J. Sci. Eng. Res. 2012, 9, 1703. [Google Scholar]
- Giwa, A.; Alabi, A.; Yusuf, A.; Olukan, T. A comprehensive review on biomass and solar energy for sustainable energy generation in Nigeria. Renew. Sustain. Energy Rev. 2017, 69, 620–641. [Google Scholar] [CrossRef]
- Simonyan, O.; Fasina, K.J. Biomass resources and bioenergy potentials in Nigeria. Afr. J. Agric. Res. 2013, 8, 4975–4989. [Google Scholar] [CrossRef]
- Akinbami, J.F.K.; Ilori, M.O.; Oyebisi, T.O.; Akinwumi, I.O.; Adeoti, O. Biogas energy use in Nigeria: Current status, future prospects and policy implications. Renew. Sustain. Energy Rev. 2001, 5, 97–112. [Google Scholar] [CrossRef]
- Ayodele, T.R.; Ogunjuyigbe, A.S.O.; Odigie, O.; Jimoh, A.A. On the most suitable sites for wind farm development in Nigeria. Data Br. 2018. [Google Scholar] [CrossRef]
- SOLARGIS. Solar resource maps of Nigeria. 2018. Available online: https://solargis.com/maps-and-gis-data/download/nigeria (accessed on 11 November 2020).
- Portal, A.E. Nigeria-Energy Sector. 2019. Available online: https://africa-energy-portal.org/fr/country/nigeria (accessed on 12 November 2020).
- Advisory Power Team, Office of the Vice President, Federal Government of Nigeria in conjunction with Power Africa. Nigeria Power Baseline Report. 2015, pp. 1–36. Available online: http://mypower.ng/wp-content/uploads/2018/01/Baseline-Report.pdf (accessed on 10 December 2020).
- World Energy Council. WEC Trilemma: Country Profile; World Energy Council: Oliver Wyman, UK, 2019. [Google Scholar]
- Paul, O.; Albert, O.; Adeiza, A. Electricity Crisis in Nigeria: The Way Forward. Am. J. Renew. Sustain. Energy 2015, 1, 180–186. [Google Scholar]
- Kachikwu, I.E. NNPC GMD to End Oil theft in 8 Months, to Use Drones to Monitor oil Vessels. 2015. Available online: https://www.vanguardngr.com/2015/09/nnpc-gmd-to-end-oil-theft-in-8-months-to-use-drones-to-monitor-oil-vessels/ (accessed on 12 November 2020).
- Fashola, B. FG Targets 30 Per Cent in Renewable Energy Mix by 2030. 2018. Available online: https://punchng.com/fg-targets-30-per-cent-in-renewable-energy-mix-by-2030-fashola/ (accessed on 12 November 2020).
- Emovon, I.; Samuel, O.D. Prioritising Alternative Solutions to Power Generation Problems Using MCDM Techniques: Nigeria as Case Study. Int. Integr. Eng. 2017, 9, 11–17. [Google Scholar]
- Bode Adewuyi, O.; Kiptoo, M.K.; Fisayo Afolayan, A.; Amara, T.; Alawode, O.I.; Senjyu, T. Challenges and prospects of Nigeria’s sustainable energy transition with lessons from other countries’ experiences. Energy Rep. 2020, 6, 993–1009. [Google Scholar] [CrossRef]
- Emovon, I.; Samuel, O.D.; Mgbemena, C.O.; Adeyeri, M.K. Electric Power generation crisis in Nigeria: A Review of causes and solutions. Int. J. Integr. Eng. 2018, 10, 47–56. [Google Scholar] [CrossRef]
- Arowolo, W.; Perez, Y. Market reform in the Nigeria power sector: A review of the issues and potential solutions. Energy Policy 2020, 144, 111580. [Google Scholar] [CrossRef]
- Urpelainen, J.; Yang, J. Global patterns of power sector reform, 1982–2013. Energy Strateg. Rev. 2019, 23, 152–162. [Google Scholar] [CrossRef]
- Amoo, R.L.; Fagbenle, L.M. An integrated impact assessment of hydrogen as a future energy carrier in Nigeria’s transportation, energy and power sectors. Int. J. Hydrog. Energy 2014, 39, 12409–12433. [Google Scholar] [CrossRef]
- Lin, S.; Wang, S.; Marinova, D.; Zhao, D.; Hong, J. Impacts of urbanization and real economic development on CO2 emissions in non-high income countries: Empirical research based on the extended STIRPAT model. J. Clean. Prod. 2017, 166, 952–966. [Google Scholar] [CrossRef]
- Dong, K.; Hochman, G.; Timilsina, G.R. Do drivers of CO2 emission growth alter overtime and by the stage of economic development? Energy Policy 2020, 140, 111420. [Google Scholar] [CrossRef]
- Le, B.; Tran-Nam, T.H. Trade liberalization, financial modernization and economic development: An empirical study of selected Asia–Pacific countries. Res. Econ. 2018. [Google Scholar] [CrossRef]
- Zhang, Y.; Zhang, S. The impacts of GDP, trade structure, exchange rate and FDI inflows on China’s carbon emissions. Energy Policy 2018, 120, 347–353. [Google Scholar] [CrossRef]
- WBS. GDP Per Capita. 2011. Available online: https://data.worldbank.org/indicator/NY.GDP.PCAP.CD (accessed on 20 May 2020).
- WBS. Gross Domestic Saving. 2020. Available online: https://data.worldbank.org/indicator/NY.GDS.TOTL.CD (accessed on 20 May 2020).
- World Bank Statistics. Trade (% of GDP). 2020. Available online: https://data.worldbank.org/indicator/NE.TRD.GNFS.ZS (accessed on 19 May 2020).
- International Monetary Fund. Domestic Credit to Private Sector by Banks. 2020. Available online: https://data.worldbank.org/indicator/FD.AST.PRVT.GD.ZS (accessed on 18 May 2020).
- Madsen, H. Time Series Analysis. 2007. Available online: http://henrikmadsen.org/wp-content/uploads/2014/02/lect07.pdf (accessed on 12 November 2020).
- Tan, C.W.; Bergmeir, C.; Petitjean, F.; Webb, G.I. Time Series Regression. Available online: https://arxiv.org/abs/2006.10996 (accessed on 10 December 2020).
- Parajuli, R.; Østergaard, P.A.; Dalgaard, T.; Pokharel, G.R. Energy consumption projection of Nepal: An econometric approach. Renew. Energy 2014, 63, 432–444. [Google Scholar] [CrossRef]
- Bennouna, A.; El Hebil, C. Energy needs for Morocco 2030, as obtained from GDP-energy and GDP-energy intensity correlations. Energy Policy 2016, 88, 45–55. [Google Scholar] [CrossRef]
- Erdogan, S.; Okumus, I.; Guzel, A.E. Revisiting the Environmental Kuznets Curve hypothesis in OECD countries: The role of renewable, non-renewable energy, and oil prices. Environ. Sci. Pollut. Res. 2020, 27, 23655–23663. [Google Scholar] [CrossRef] [PubMed]
- ITF. The Carbon Footprint of Global Trade. Int. Transp. Forum Glob. 2015, 12, 1–12. [Google Scholar]
- Adesanya, J.M.; Pearce, A.A. Economic viability of captive off-grid solar photovoltaic and diesel hybrid energy systems for the Nigerian private sector. Renew. Sustain. Energy Rev. 2019, 114, 109348. [Google Scholar] [CrossRef]
- Salihu, T.Y.; Akorede, M.F.; Abdulkarim, A.; Abdullateef, A.I. Off-grid photovoltaic microgrid development for rural electrification in Nigeria. Electr. J. 2020, 33, 106765. [Google Scholar] [CrossRef]
- Salehin, S.; Ferdaous, M.T.; Chowdhury, R.M.; Shithi, S.S.; Rofi, M.S.R.B.; Mohammed, M.A. Assessment of renewable energy systems combining techno-economic optimization with energy scenario analysis. Energy 2016, 112, 729–741. [Google Scholar] [CrossRef]
- Ramli, M.S.; Wahid, S.S.A.; Hassan, K.K. A comparison of renewable energy technologies using two simulation softwares: HOMER and RETScreen. AIP Conf. Proc. 2017, 1875. Available online: https://aip.scitation.org/doi/10.1063/1.4998384 (accessed on 1 June 2020). [CrossRef]
- Bamisile, O.; Olubiyo, F.; Dagbasi, M.; Adun, H.; Wole-Osho, I. Economic analysis and performance of PV plants: An application in Kurdistan region of Iraq. Int. J. Renew. Energy Dev. 2019, 8, 293–301. [Google Scholar] [CrossRef]
- CSun-Solar. 2017. Available online: http://www.csun-solar.com/fileadmin/dateiablage/media/datasheets/p-mod/en/CSUN305-72P_ENG.pdf (accessed on 1 June 2017).
- Modernize. How Much Does Solar Panel Installation Cost? 2020. Available online: https://modernize.com/solar/panel-cost-calculator#:~:text=Solarpanelinstallationcostsaround,%2424%2C552intotalinstallationcosts (accessed on 10 December 2020).
- BBC News|PIDGIN. New Electricity Tariffs in Nigeria 2020. 2020. Available online: https://www.bbc.com/pidgin/tori-53995109#:~:text=Newelectricitytariffwitmore, as62.33Nairaperkwh (accessed on 10 December 2020).
- Doing Business. Available online: www.doingbusiness.org/getting-electricity (accessed on 1 June 2017).
Publisher’s Note: MDPI stays neutral with regard to jurisdictional claims in published maps and institutional affiliations. |
© 2021 by the authors. Licensee MDPI, Basel, Switzerland. This article is an open access article distributed under the terms and conditions of the Creative Commons Attribution (CC BY) license (http://creativecommons.org/licenses/by/4.0/).