Article

Emotional Well-Being in Urban Wilderness: Assessing States of Calmness and Alertness in Informal Green Spaces (IGSs) with Muse—Portable EEG Headband

by
Krzysztof Herman
1,2,*,
Leon Ciechanowski
3,4 and
Aleksandra Przegalińska
3
1
Department of Landscape Art, Institute of Environmental Engineering, Warsaw University of Life Sciences (WULS-SGGW), 02-787 Warsaw, Poland
2
School of Architecture, Victoria University of Wellington, PO Box 600, Wellington 6140, New Zealand
3
Department of Management in Digital Societies, Kozminski University, Jagiellonska 57, 03-301 Warsaw, Poland
4
Department of Psychology, University of Social Sciences and Humanities, Chodakowska 19/31, 03-815 Warsaw, Poland
*
Author to whom correspondence should be addressed.
Sustainability 2021, 13(4), 2212; https://doi.org/10.3390/su13042212
Submission received: 17 November 2020 / Revised: 4 February 2021 / Accepted: 9 February 2021 / Published: 19 February 2021

Abstract

:
In this experiment, we operated within the novel research area of Informal Green Spaces (often called green wastelands), exploring emotional well-being with the employment of portable electroencephalography (EEG) devices. The apparatus (commercial EEG Muse headband) provided an opportunity to analyze states of calmness and alertness in n = 20 participants as they visited selected Informal Green Spaces in Warsaw, Poland. The article aims to test the hypothesis that passive recreation in Informal Green Spaces (IGSs) has a positive impact on emotional well-being and that there is a connection between the intensity of states of calmness and alertness and 1. the type of green space (IGS/GS), 2. the type of scenery and 3. the type of IGS. The preliminary experiment showed that there might be no substantial distinction in the users’ levels of emotional states when considering existing typologies. On the other hand, data-driven analysis suggests that there might be a connection between the state of alertness and some characteristics of specific areas. After carrying out the multivariate analyses of variance in the repeated measurement scheme and finding significant differences between oscillations in different areas, we conclude that there might be three possible sources of lower alertness and increased calmness in some areas. These are 1. the presence of “desirable” human intervention such as paths and urban furniture, 2. a lack of “undesirable” users and signs of their presence and 3. the presence of other “desirable” users.

1. Introduction

1.1. The Importance of Urban Greenery for Well-Being and Mental Health

Access to urban greenery is seen as important for both mental and physical health. Public parks can provide much needed contact with the natural environment [1] and can help users to regenerate, fight stress and deal with the enormous number of stimuli in the urban environment [2]. Urban green spaces are an important factor in lifestyle choices, keeping people physically active and therefore being beneficial for mental health, self-esteem and mood [1,2]. Green space exposure is beneficial in a range of ways, making the idea of “green prescriptions”, prescribed physical activity performed specifically in green spaces, widely recognized [3]. Lifetime availability of public parks helps to slow down the rate of cognitive decline in later life [4]. Residing within areas with walkable green spaces positively influenced the longevity of urban senior citizens [5]. Limited evidence suggests a beneficial association between green space exposure and children’s emotional and mental well-being, behavioral difficulties and depressive symptoms [6]. Not only does greenery influence health while being visited—as a space of everyday life or activities—but it is also proven that views on natural environments influence the recovery [7], health and well-being of urban dwellers [8]. High-quality views on urban greenery, including seemingly irrelevant landscape design nuances, can be crucial in contemplative passive recreation [9].

1.2. Informal Green Spaces and “Green Wastelands”

Green space has been identified in recent years as a broader and more complex infrastructure (system) within the urban fabric. Green wastelands and overgrown vacant lots are recognized as Informal Green Spaces (IGSs). Positioned somewhere between formal green space in its traditional meaning (parks, gardens) and natural conservation (protected) areas, IGSs are both spaces of human origin (cultural) and areas of ecological value (natural) while not being managed by an official owner or administrator. IGSs are defined as “explicitly socio-ecological entities” that “consist of any urban space with a history of strong anthropogenic disturbance that is covered at least partly with non-remnant, spontaneous vegetation” [10]. This novel wilderness on urban grounds is recognized as the Fourth Nature, the kind that emerges spontaneously on urban vacant lots, post-industrial areas, former building sites, heaps etc. [11]. Kowarik’s theory recognizes four types of nature, with the Fourth Nature being a “novel urban green space” that emerges spontaneously despite severe habitat transformations: “it may be shaped accidentally by human agency but may also develop towards wild urban woodlands” [12]. IGSs as spaces that are left behind urban or rural sites, transitional spaces and neglected land can also be located on the fringe of the “third landscape” as categorized by Gilles Clément [13,14]. They are spaces that are temporarily “set aside” in the reality of the dynamic urban environment, and at the same time under constant pressure of potential change: development, intensification of the urban fabric, contamination etc.
Recreation and any other use of IGSs is usually transitory and informal but access to IGSs can be crucial in reducing inequalities in urban green space availability [15]. These spaces can be quite “wild” or have a rather “natural” character that evokes extra-urban forest landscapes. IGSs can play a significant role in urban conservation, providing continuation of ecological corridors, as well as in recreation and community engagement [16]. They are increasingly important for mitigating air pollution [17] and urban heat island effect. Such “leftover” spaces are recognized for their unique aesthetics and ambient, and thus according to some scholars should be left unharnessed [18] or enhanced leading to acceptance of urban wilderness and functional hybrids between Fourth Nature and Third Nature (designed green space) [12].

1.3. Encephalography (EEG) in Urban Landscape Research

The aspects of well-being and mood in various urban environments have been raised in some experimental research projects that used electroencephalography (EEG) as a core method [8,19]. The impact of natural versus urban settings, importance of greenery in the window view etc. were in the past commonly tested in indoor (laboratory) settings [8,20].
Research experiments of this type test human reactions to visual stimuli, most commonly a pre-selected view represented by: photograph, 360° photograph [21], projected image [8], 3D video [22] or an actual view as seen on the site (as observed from precisely established viewpoints) [23]. These methods are derived and evolved from various Visual Quality Assessment [21] methods, including Scenic Beauty Estimation [24,25], moving away from aesthetics towards other intrinsic landscape values [26] such as capability to influence well-being and health [27]. A Contemplative Landscape Model (CLM) specifically is a tool designed to include aesthetic, environmental and mental health values in evidence-based urban landscape evaluations [9].
EEG methods have been extensively used for wellness, mindfulness and meditation studies and have revealed changes to brain waves, including major changes in alpha waves and certain increases in theta and gamma rhythms [28]. Other authors [29] report that, in addition to significant increases in alpha and theta activity, the states of mindfulness and meditation are associated with activation of the prefrontal cortex and anterior cingulate cortex, areas related to attention.
New, commercial and low-cost mobile EEG recorders allow investigators to advance research on affective experiences in various types of urban environments, including green spaces. Valuable and good-quality data can be obtained in outdoor recording conditions and with affordable EEG hardware [30]. Small, light and easy-to-operate devices have been used in outdoor stationary tests [8,20] as well as during activities (e.g., walking) [31]. The device that we are using in the current study—the Muse headband (https://choosemuse.com/muse-research/, accessed on 13 November 2020)—has been successfully used in many studies, including medical interventions and health monitoring [32,33], as well as psychological and cognitive tasks [34,35]. Muse has also been proven to allow for replication of standard EEG effects [36]. At the same time, numerous studies used the Emotiv headset (a portable EEG device similar to Muse) in research that focused on health and well-being [37] and outdoor activity [31], specifically targeting older adults and seniors [38,39]. The latter research aimed to “understand the impact of walking through different urban environments (urban busy, urban green and urban quiet spaces) on neural activity” [39], and recorded EEG sessions during the activity of walking. In this case and several other cases, encephalography performed in outdoor settings, often referred to as “Neurourbanism” [39,40], was the main and sole method used and was unaccompanied by additional interviews or heart rate monitoring. Neurourbanism has also been applied in research on outdoor, individual physical exercise [41] and urban behaviors [42] including the restorative impact of natural landscapes versus urban scenes [20].
The Muse headband used in our experiment can serve multiple purposes [43], but was initially designed as a device assisting in meditation and mindfulness training [44]. It can also serve as an “attention recorder” [45] capturing alpha waves while performing various tasks. The headband gathers data from four electrodes: temporoparietal (TP9 and TP10) and frontal (AF7 and AF8) locations. There is also a fifth frontal electrode (Fpz) that is used as the reference. Mobile EEG could be used to understand how individuals experience urban environments, supporting the design process by indicating to architects, urban designers and planners how spaces function affectively (i.e., the effect of the constructed environment on mood) [42].
This experiment aimed to test three hypotheses concerning the connection between the levels of calmness and alertness and: 1. the formality or informality of a green space (IGS vs. green space (GS)); 2. the type of viewed scenery (as identified by Gawryszewska et al. [46]); and 3. the type of IGS (as categorized by Rupprecht and Byrne [10]). This, in essence, will bring us closer to understanding how the level of temporary emotional well-being (the levels of calmness and alertness) is influenced by passive recreation in IGSs as compared to green spaces (GSs, mostly city parks).

2. Materials and Methods

2.1. Research Areas and Viewpoints

This experiment is part of a larger interdisciplinary research grant conducted in 2017–2019 by a multidisciplinary group of scholars from several departments at Warsaw University of Life Sciences in cooperation with the City of Warsaw. The goal of this project was to create an inventory and valorization of selected degraded and polluted areas in Warsaw measuring the natural and social potential of wastelands [47]. An analysis of planning and zoning documents, ownership status, aerial photographs and several site visits resulted in a list of over 30 “green wasteland” areas (GWA) within the city limits of Warsaw, Poland. All these areas are recognized as brownfields or other types of wastelands with potentially contaminated soil, and are intensively or partially overgrown with spontaneous, uncultivated vegetation. Many of these lots of city-owned land are marked in planning strategies as potential areas for new urban parks and recreation spaces. All of them already play an important role providing ecosystem services. In later stages of the research, the term green wasteland was subsequently replaced with Informal Green Spaces (IGSs) as a term that better describes the character of the research subject.
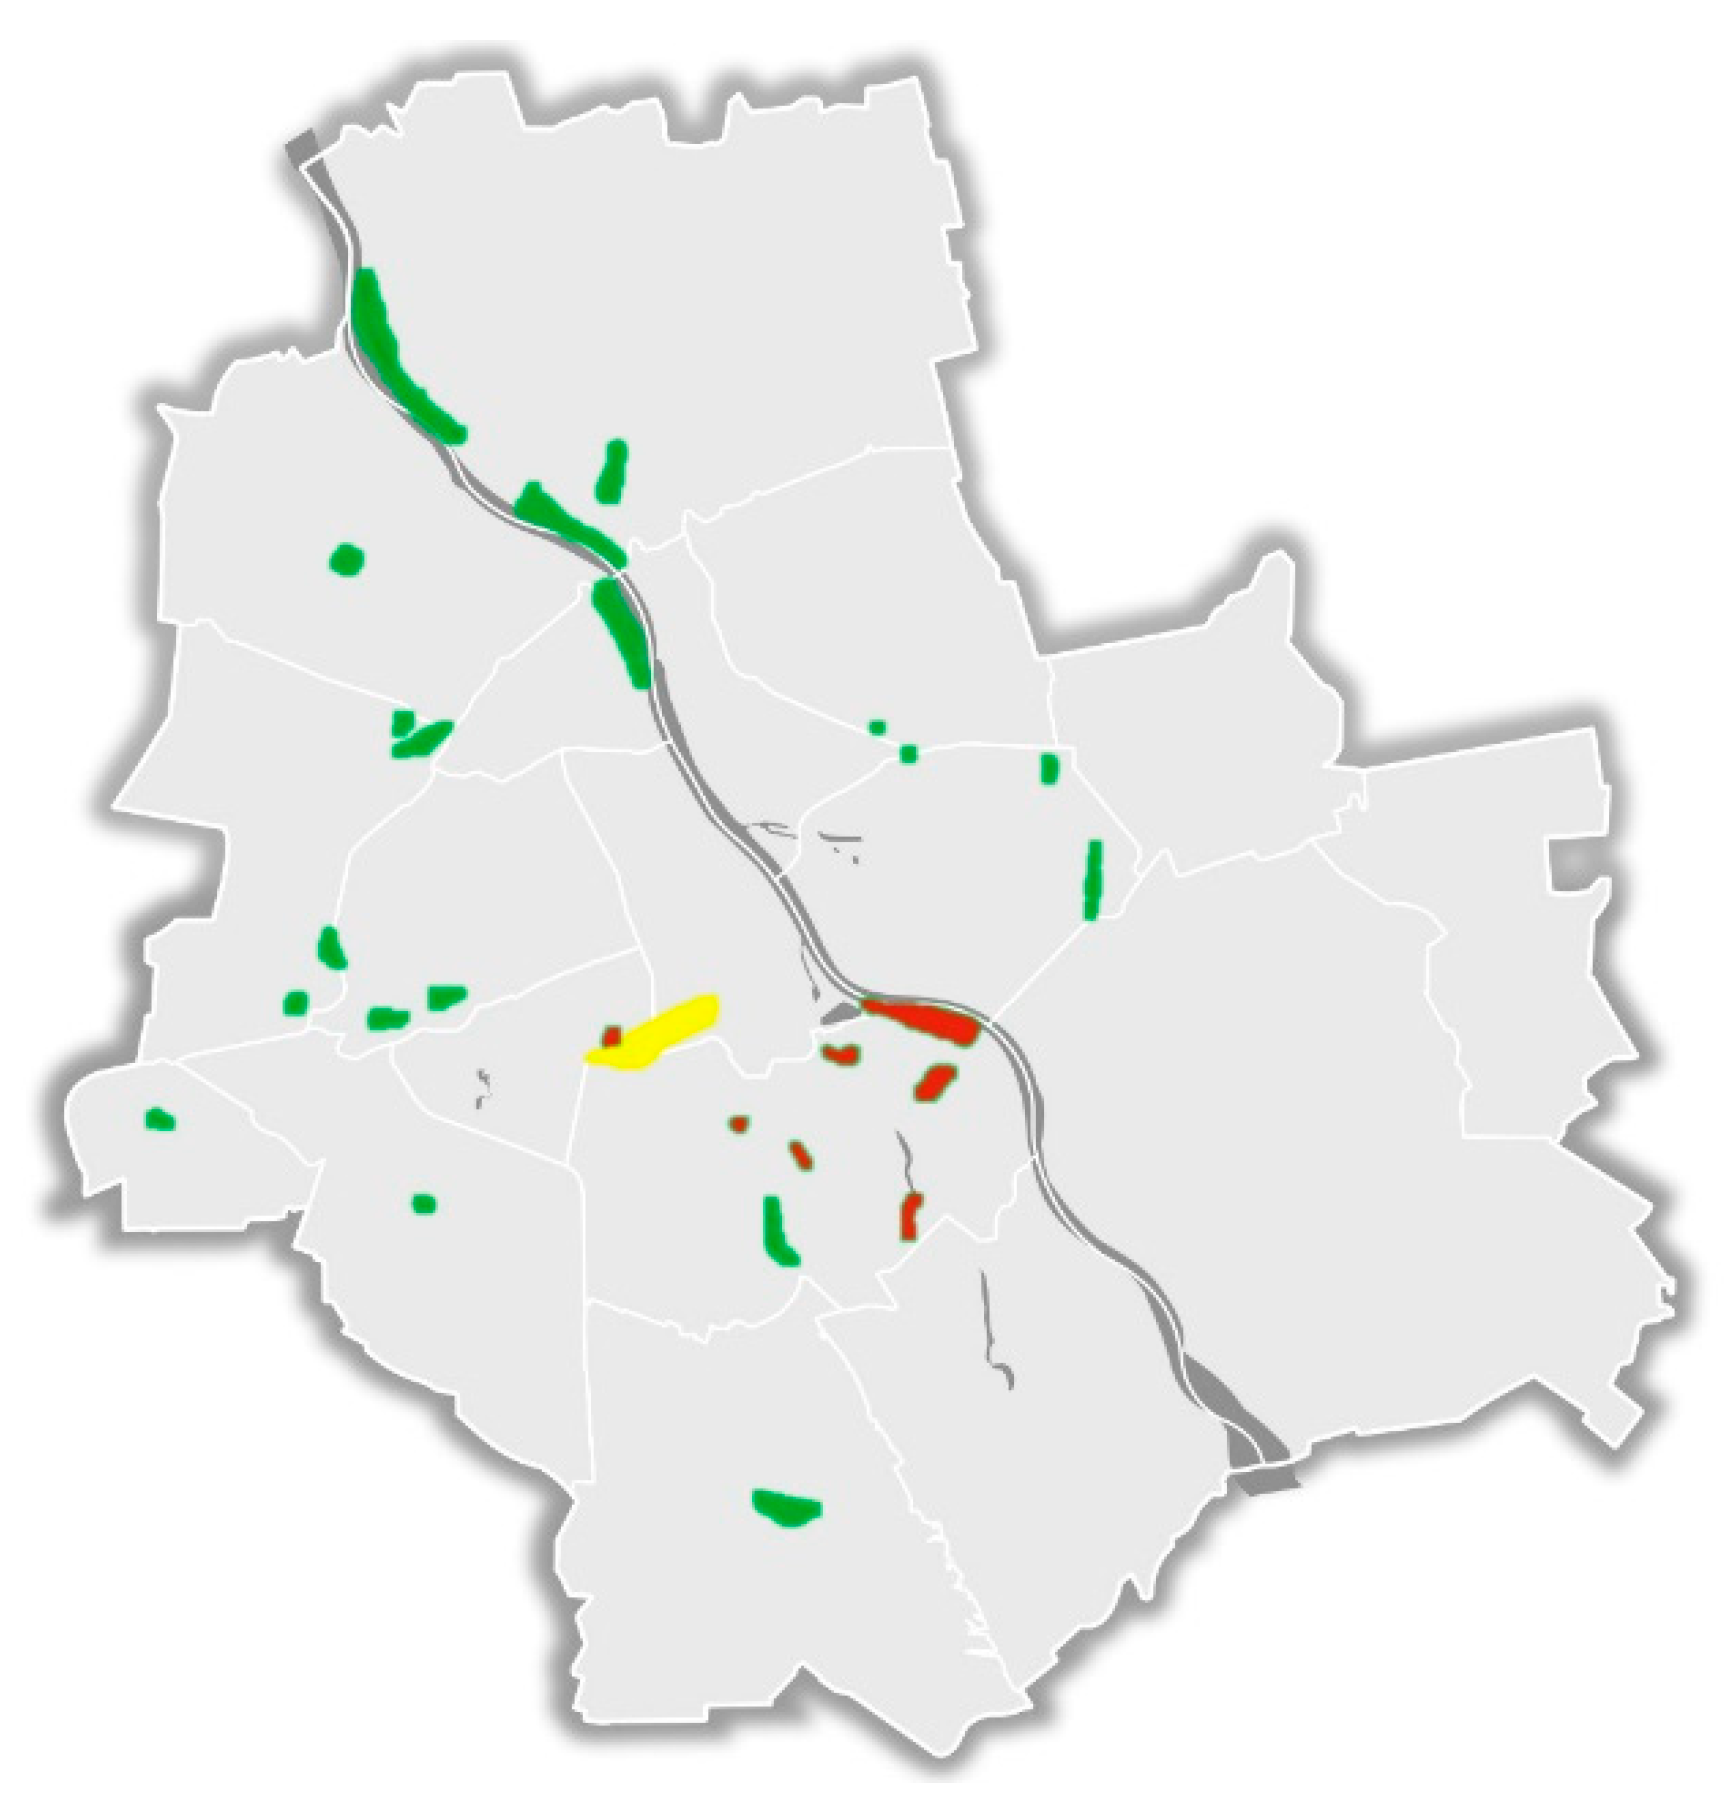
Seven out of more than thirty identified IGSs were chosen for the purposes of this study (Figure 1). Four characteristic points were chosen within each of the seven IGSs.
There were three selection criteria:
  • Diversity of scenery types. Viewpoints were selected to represent all 12 Warsaw IGSs scenery types as identified by Gawryszewska et al. [46]. Table 1 presents the scenery types and number of scenery type instances for the 33 viewpoints. Some viewpoints are described by two types of scenery (e.g., road/path through low thickets). Viewpoints were selected to maximize the amount of scenery types and provide satisfactorily equal representation. This was a primary selection criterion.
  • Distance and connection between areas. In order to make it attainable for the participants, we delimited the scope of areas by choosing areas that are easier to reach with public transport. This helped to avoid long-distance travel for participants and also favored areas that were closer to the city center and dense urban fabric, residential areas.
  • Free public access. All areas but one were publicly accessible. One of them (Skra IGS) is fenced but publicly owned and unsupervised, and access through gaps in the fence was reasonably easy.
A reference area, one of the most popular, centrally located urban parks (a “traditional” green space—GS), was added to the seven IGSs. Five viewpoints were chosen around the Pole Mokotowskie Park. All in all, each participant was entrusted with the task of recording 33 sessions in 33 viewpoints within 8 areas.
Later on, an additional classification was added that was not one of the selection criteria: IGS type as categorized by Rupprecht and Byrne [10]. This typology included (abandoned) “lots”, “brownfields” and “waterside” areas (Appendix A), providing an opportunity for additional tests.
A short description of each of the research areas (Figure 2):
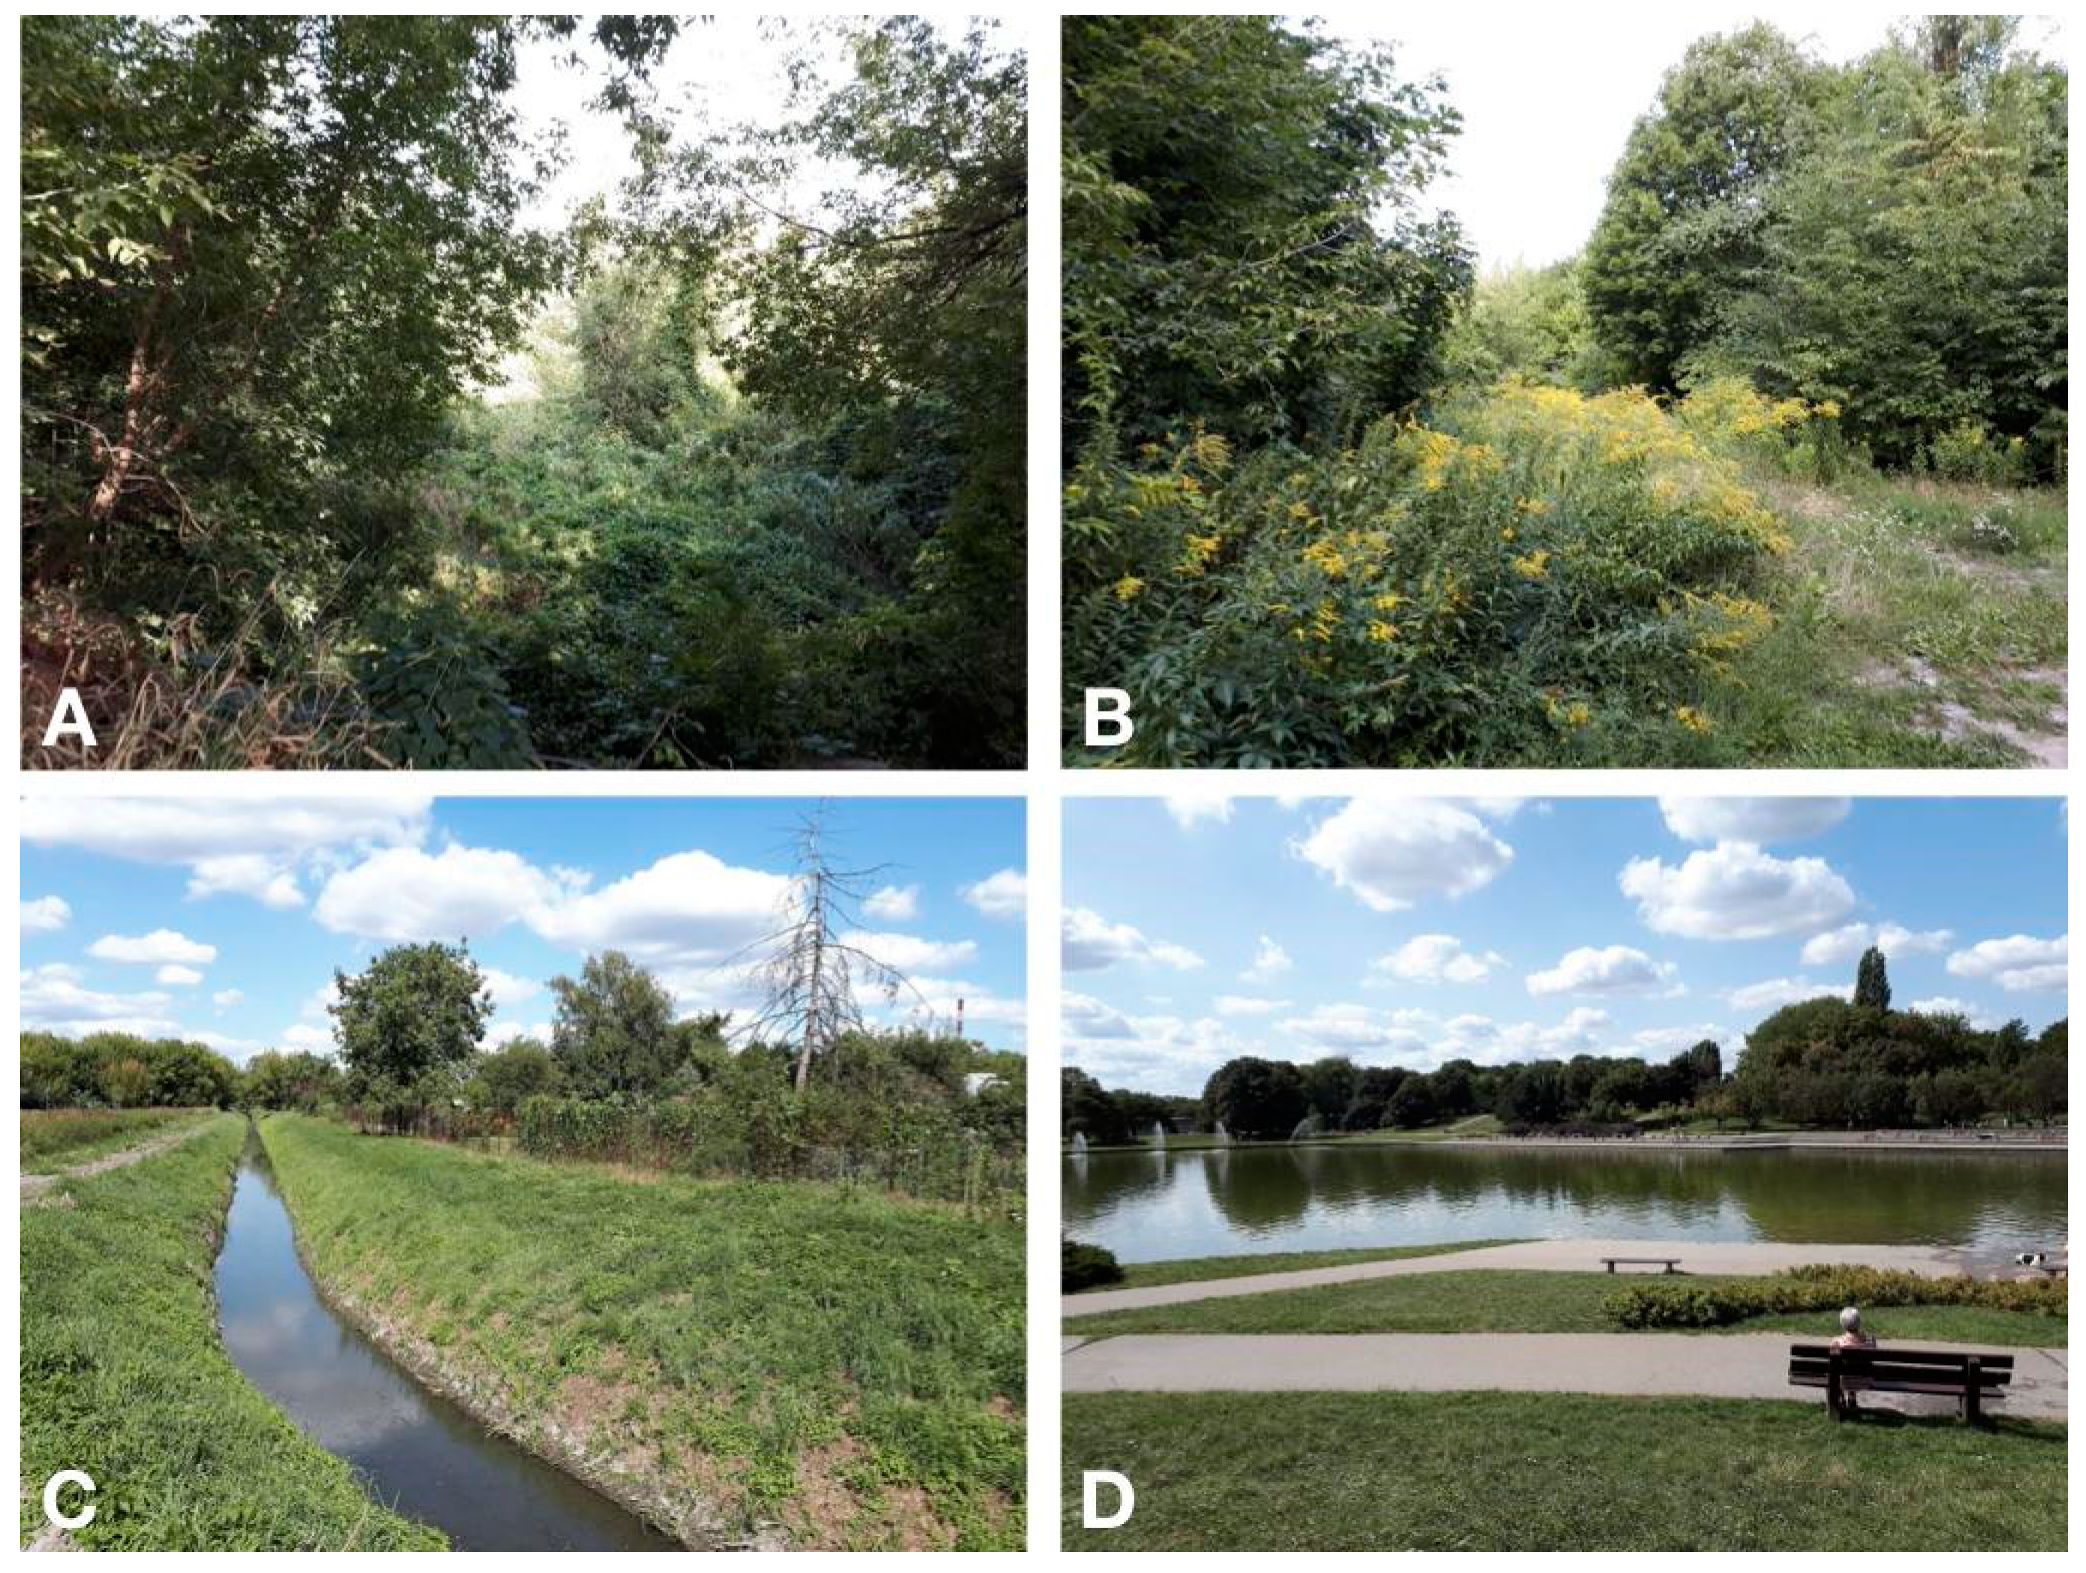
  • Kopiec Powstania Warszawskiego IGS (Warsaw Uprising Mount, thenceforward referred to as “Kopiec”)—7.45 ha of a dense and mostly uncultivated greenery between a park-monument-mound, warehouses and a new development of multi-family buildings. Part of the area used as a parking/storage site during the construction works for the nearby highway. Vegetation consists partly of dense forest of approx. 40-year-old trees as well as some unmoved grasslands and low thickets (dense shrubbery).
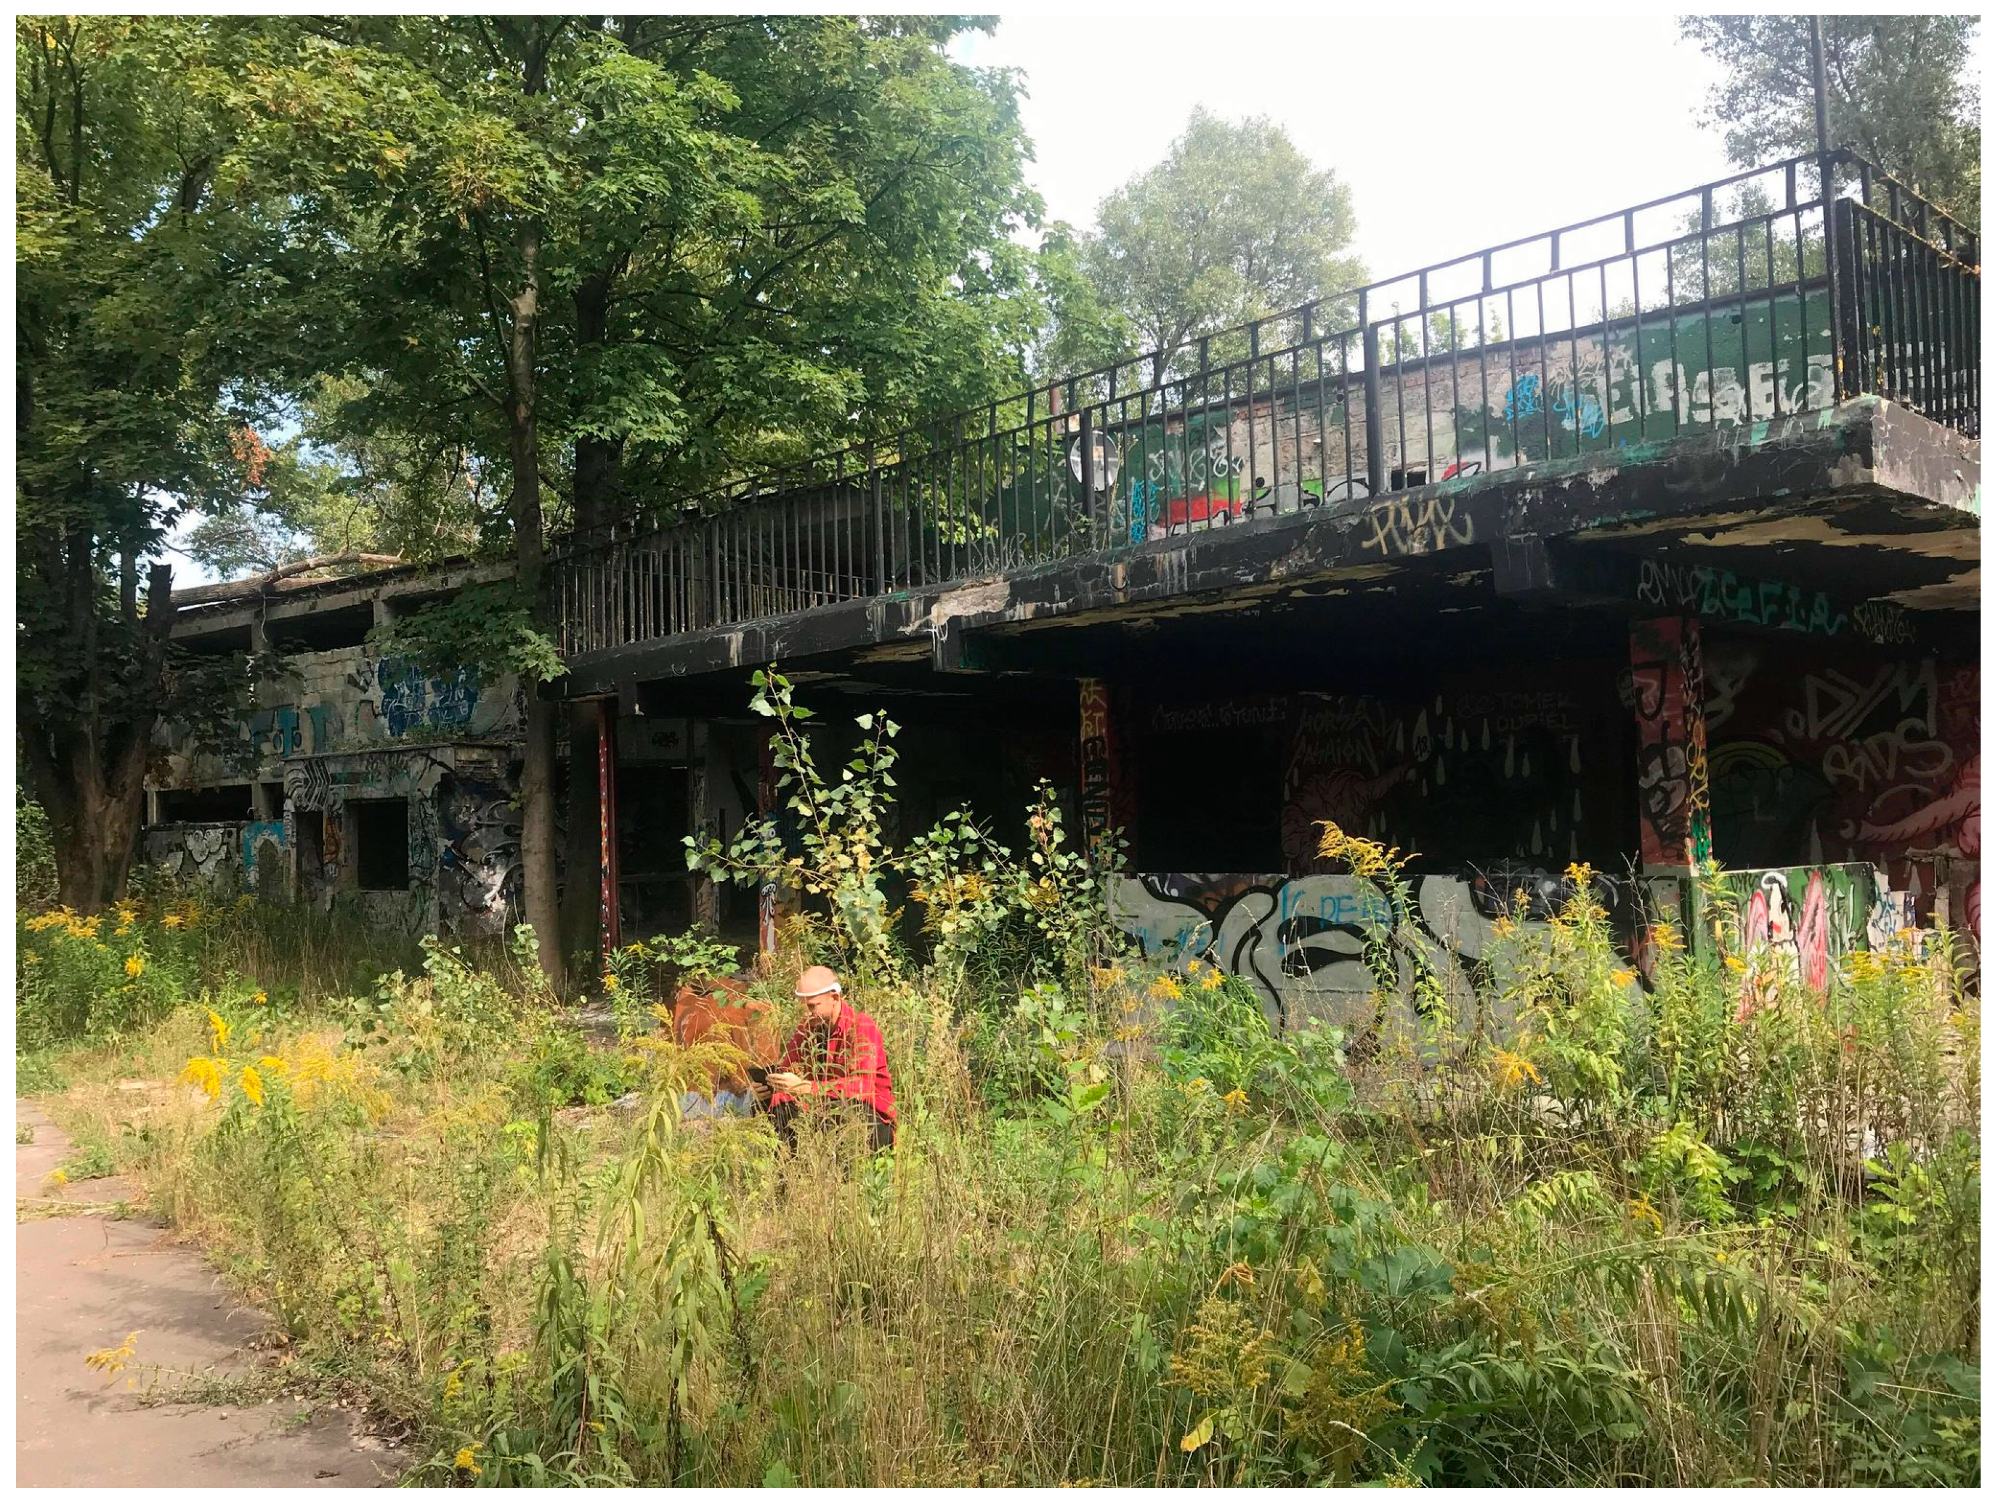
  • Skra IGS—4.64 ha of a former sportsground with ruins of swimming pools and other accompanying facilities, overgrown and wild, with narrow paths, rubble and garbage as a sign of spontaneous parties; fenced with several (usually open) entrances; patches of Canada goldenrod and grass with some dense shrubbery and approx. 40-year old-trees; rarely used space—quiet and calm (a great contrast to the busy, nearby urban park—Pole Mokotowskie)
  • Pole Mokotowskie GS (Mokotów Field Park)—65 ha of a large urban park. Designed and built in the 1970s and 1980s. Considered to be the central park of Warsaw, it is busy with many activities including communication (bike lanes), amateur sports, food and drink consumption and dog walking. A former horse racing track and an airport, the park has large patches of older trees (planted from 1950s) as well as extensive mowed grass areas. The midpoint of this green space is occupied by a large concrete pond.
  • Dolna IGS—a small informal green space (2.49 ha) around a pond, mostly overgrown with reeds. An example of an “intermediate” space between “green wasteland” and urban park. It has areas of mowed grass and some sparse furniture (a few old benches) but no formal paths or arrangement. It is a well-used space (dog walkers from the nearby blocks of flats) and has some DYI elements such as a small track for mountain biking (the area is adjacent to the Warsaw escarpment). There is a noticeable presence or evidence of “undesirables” [48] (people drinking alcohol etc.).
  • Sadyba IGS—5.71 ha—small forest area and grasslands (mowed once/twice a year) at the side of a small stream (ditch). It is not a very populated area, popular mostly with dog owners. There are a few narrow ground footpaths and proof of homeless people residing in the area.
  • Siekierki pod mostem IGS (“Siekierki under the bridge”)—another example of an intermediate green space (between IGS and GS). While not considered a park, it is a partially urbanized and developed area of 14.2 ha, under and next to a highway overpass, with several paved paths and some benches. Greenery around the two ponds is generally not cultivated with large areas of herbaceous monoculture.
  • Wisła (Vistula river) banks near Siekierki district—a large (50 ha) area of riparian forest, meadows and shrubbery, partially protected as a part of larger “Nature 2000” site “Middle Vistula Valley”). It is hardly used with very few paths leading towards the river.
  • Sobieskiego street ditch—a small, very narrow and overgrown IGS area (1.62 ha) along a large street and a ditch that is only temporarily filled with water. This area, perhaps because of its rather central location and dense tree/shrub cover, is populated by homeless people, who have created a small “camp” that is not visible from the main street.

2.2. Participants and the Procedure

The participant group consisted of n = 20 people (14 women, 6 men). These were landscape architecture students and volunteers recruited through social media posts. There was a modest remuneration offered for completing the full procedure in the experiment. Records of three participants were removed from the database before performing the analyses due to incorrectly collected data (their files from the Muse device were empty or incomplete). Thus, the final results come from analysis of recordings of n = 17 participants.
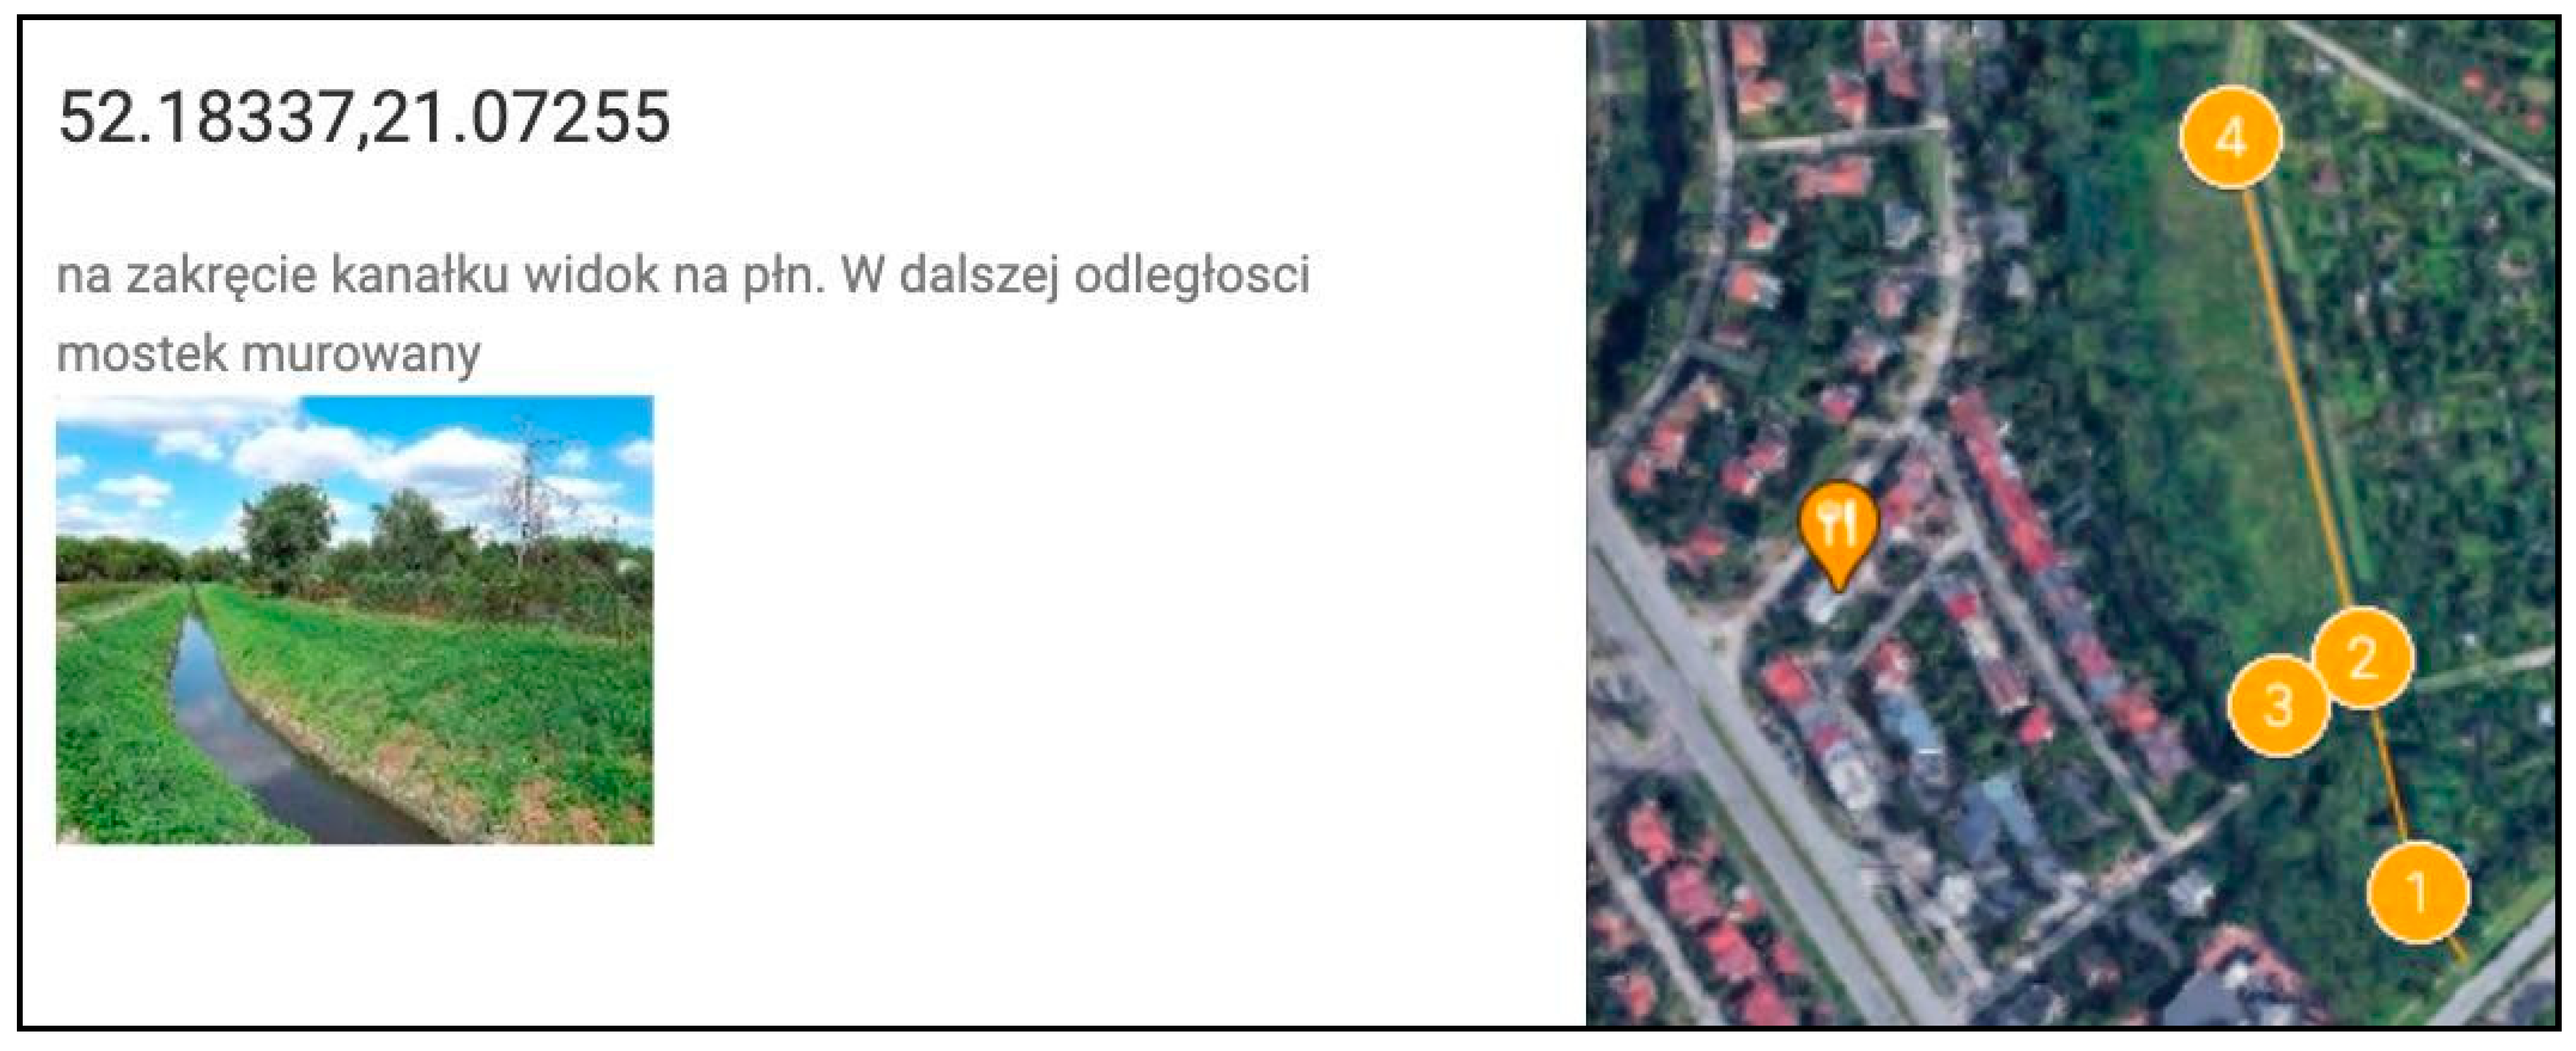
The experiment was designed to be independently executed by each of the participants, and each recorded session was executed individually (Table 2 and Appendix C). All participants underwent a short training and a short sample session with the apparatus. They were instructed by the researchers on how to perform the experiment—find designated viewpoints in research areas and operate the apparatus. They were also provided with a printed manual, a link to Google Maps with the exact location of each research viewpoint, its coordinates, description and an attached photograph of the view from the viewpoint (Figure 3). After this, participants traveled between areas in a random order (Appendix B), finding viewpoints and setting up the apparatus independently. Most participants chose biking as their method of moving between areas. Light foldable chairs were made available for comfort, though some of the participants chose to sit on the ground or blankets etc.
At the sites of the experiment, each time connectivity with the Muse headband had to be established with Bluetooth and checked for all four electrodes (TP9, AF7, AF8, TP10). After ensuring the proper connection of smartphones with Muse, the baseline phase of the experiment—the relaxation phase—was established. During this time, participants were asked to close their eyes and relax for 30 s while their EEG data were recorded by Muse (the baseline phase was later on used as a reference for analyzing changes in the signal (by being subtracted from the signal), hypothetically caused by communing with the environment in designated places). Next an alarm clock was set for 3 min and the recording session would start. During the 3 min sitting, participants would look at the view (landscape) without unnecessary movement. After saving the session, the participant would move to another viewpoint within the research area, repeating the same steps at each of them. Complete recording of sessions at 4 viewpoints (plus the transfer time) within one area would take between 30 and 60 min.

2.3. The Apparatus

The participants in the experiment were equipped with a Muse headband (Figure 4)—a wearable brain sensing device. The device is fully portable and can be paired with any tablet or smartphone and operated with the Muse application. The application, apart from recording and preprocessing EEG data, can be used as a personalized meditation guide. Muse is equipped with 4 electrodes and collects electroencephalographic (EEG) signals from frontal areas (TP9, AF7, AF8 and TP10 electrodes); thus, it uses two channels on the left and two on the right, and can explore hemispheric asymmetries. Muse is also equipped with two micro-USB ports on the back of the ear pods where two auxiliary electrodes can be attached. These electrodes can be used to measure EMG, electrocardiography (ECG) or EEG on other areas of the body or head. The sampling frequency was 300 Hz. Participants were either provided a smartphone with an installed Muse Monitor application or had the choice of using their own smartphone.

2.4. Psychophysiological Indices

The EEG device tracks and records brain wave patterns. The sensors are placed on the frontal lobes of subjects. When brain cells (neurons) are activated, local current flows are produced. EEG measures mostly the currents that flow during synaptic excitations of the dendrites of many pyramidal neurons in the cerebral cortex. Differences in electrical potentials are caused by summed postsynaptic graded potentials from pyramidal cells that create electrical dipoles between the body of neurons and the dendrites. Brain electrical current consists mostly of Na+, K+, Ca++ and Cl− ions that are pumped through channels in neuron membranes in the direction governed by membrane potential [49]. The detailed microscopic description includes different types of synapses involving a variety of neurotransmitters. In weak electrical signals detected by the scalp, electrodes are massively amplified and then stored to computer memory. Due to its capability to reflect both the normal and abnormal electrical activity of the brain, EEG has been found to be an insightful, although often difficult, technique in the field of neurology and clinical neurophysiology.
When analyzing the data, we focused on comparing the proportions of four types of oscillations: alpha (8–15 Hz)—indicating alertness, calmness and meditative states; beta (15–30 Hz)—indicating alertness, agitation, mental involvement, active learning and conscious processing of information; delta (0.5–4 Hz)—indicating deep sleep and calmness, but also excitement or stimulation when the delta waves are suppressed; theta (4–8 Hz)—indicating deep meditative states, dreams and automatic behavior [50]. The gamma oscillations (25–140 Hz, with 40 Hz being the common point of interest), which are present on visualizations below, are correlated with large-scale brain network activity and cognitive phenomena such as working memory, attention and perceptual grouping, and can be increased in amplitude via meditation or neurostimulation [51]. However, there is a controversy around using gamma in analyses, since its frequency band overlaps with muscle activity [52]. It is advisable to preprocess the signal using, e.g., independent component analysis (ICA); however, in our case the study was not controlled in laboratory conditions, and therefore we decided not to use gamma waves in our interpretations. There are also other indicators of emotional arousal referring to the oscillation bands, such as the alpha asymmetry [27]. However, there is an increasing critique of this type of measure, and therefore we have not used it in our analyses [53].
EEG can serve as a reliable tool to measure stress [54,55,56]. High stress response can be unveiled through results showing a decrease in high alpha power (11 to 12 Hz), as well as an increase in the high beta band (23 to 36 Hz, considered a “busy brain” indicator) and a decrease in the approximate entropy. However, various other physiological indicators of stress and calm are becoming increasingly used in outdoors research. Among others, researchers use psychophysiological feedback devices such as electrocardiography (ECG) [57,58] and skin conductance (SC) [59] to detect the affective states of the users during task performance. Their increased application is related to the fact that measurements of the SC/GSR, EEG and HRV [60,61,62] are considered to be adequate indicators of stress and calm. GSR is considered to be one of the most sensitive and valid markers of emotional arousal and is one of the most sensitive methods of capturing the autonomic nerve response [63,64]. GSR devices allow the capture of biomarkers of sympathetic nervous system activation. For instance, during high levels of emotional arousal, sweat secretion is intensely activated and can be captured with a GSR sensor. HRV, on the other hand, is used as an indicator to measure physical stress, and reflects the sympathetic and parasympathetic activities of the autonomic nervous system measuring the temporal difference between successive heartbeats in milliseconds (time between beats is called the R-R interval).

2.5. Statistical Analysis

The EEG signal from the Muse headband was recorded with the use of the Muse Monitor mobile app (currently called Mind Monitor). The sampling was set by the users to 500 Hz, with a 16 bit resolution, without a notch filter. The raw EEG data for each channel on the headband were measured in microvolts. Because of the Bluetooth connection, some of the EEG samples were dropped due to connection issues. However, there is a parameter in the final database that allows for identification of such samples and interpolation of the signal. The raw signal is later preprocessed with the use of Muse algorithms (https://web.archive.org/web/20181105231756/, accessed on 13 November 2020, http://developer.choosemuse.com/tools/available-data, accessed on 13 November 2020). The signal first undergoes a Fast Fourier Transform (FFT). This computes the power spectral density of each frequency on each channel. Basically, it shows which frequencies make up a signal, and “how much” of each frequency is present. Each path contains 129 decimal values with a range of roughly −40.0 to 20.0. Each array represents FFT coefficients (expressed as power spectral density) for each channel, for a frequency range of 0–110 Hz divided into 129 bins. The absolute band power for a given frequency range (for instance, alpha, i.e., 9–13 Hz) is the logarithm of the sum of the power spectral density of the EEG data over that frequency range. It is provided for each of the four channels/electrode sites on Muse. Since it is a logarithm, some of the values will be negative (i.e., when the absolute power is less than 1). It is given on a log scale, and the units are bels. This is the final data type we have used for analyses. The developers of Muse provide an experimental metric of “mellow” and “concentration” scores; however, we have not used them, since the developers warn that they are “highly experimental” and do not provide any information about the characteristics of the algorithm.
In order to prepare the data for analysis, we carried out additional preprocessing and then statistical analyses using Python programming language (with the libraries scipy, statsmodels and scikit_posthocs). At first, the signal was reviewed in terms of the number of non-informative elements and errors (e.g., missing data, non-numeric values, poor signal quality obtained from a particular electrode, dropped samples etc.). The Muse dataset also provides an annotation of eye blinks and jaw clenches, which may produce artifacts in the signal. Therefore, such samples were removed from the signal. Then, we subtracted the 30 s baseline (relaxation phase of the study) from the rest of the signal, for each area and for each participant separately. Subsequently, we averaged the absolute band power of the five oscillations for each session in the parks as well as for each person, for later comparisons.
After the preprocessing of the data and extraction of all 5 oscillation bands, we carried out analysis of variance (ANOVA) with repeated measures (with Sidak’s correction for multiple comparisons), where the mean oscillation power/values for each location were the dependent variables, and the type of park and type of oscillation were independent variables.
For the data-driven analyses, we again carried out analysis of variance (ANOVA) with repeated measures (with Sidak’s correction for multiple comparisons), where the mean oscillation power/values for each location were the dependent variables, and the type of oscillation was an independent variable.

3. Results

In the initial phase of data analysis, we focused on three tests based on literature-derived typologies. The hypothesis for the first test was that there is a connection between emotional well-being (states of calmness and alertness) and the type of viewed scenery. Based on the scenery typology for Warsaw IGSs developed by Gawryszewska et al. [46] (Table 1 and Appendix A), four groups of scenery types were used in the analysis. The first group consisted of the wildest sceneries (low thickets and wilderness), the second of cultivated grasslands (mowed grasslands, “savannah”), the third of rarely cultivated low vegetation (herbaceous monoculture, unmowed grasslands) and finally the fourth group of scenery with tree-cover (light forest, sparse tree-cover). The second test was a straightforward analysis of all IGS areas versus one GS (Pole Mokotowskie Park) area. The third test took into consideration possible connections between emotional well-being and IGS type as categorized by Rupprecht and Byrne [10] (Appendix A). These three tests did not bring any statistically significant differences within the described groups.
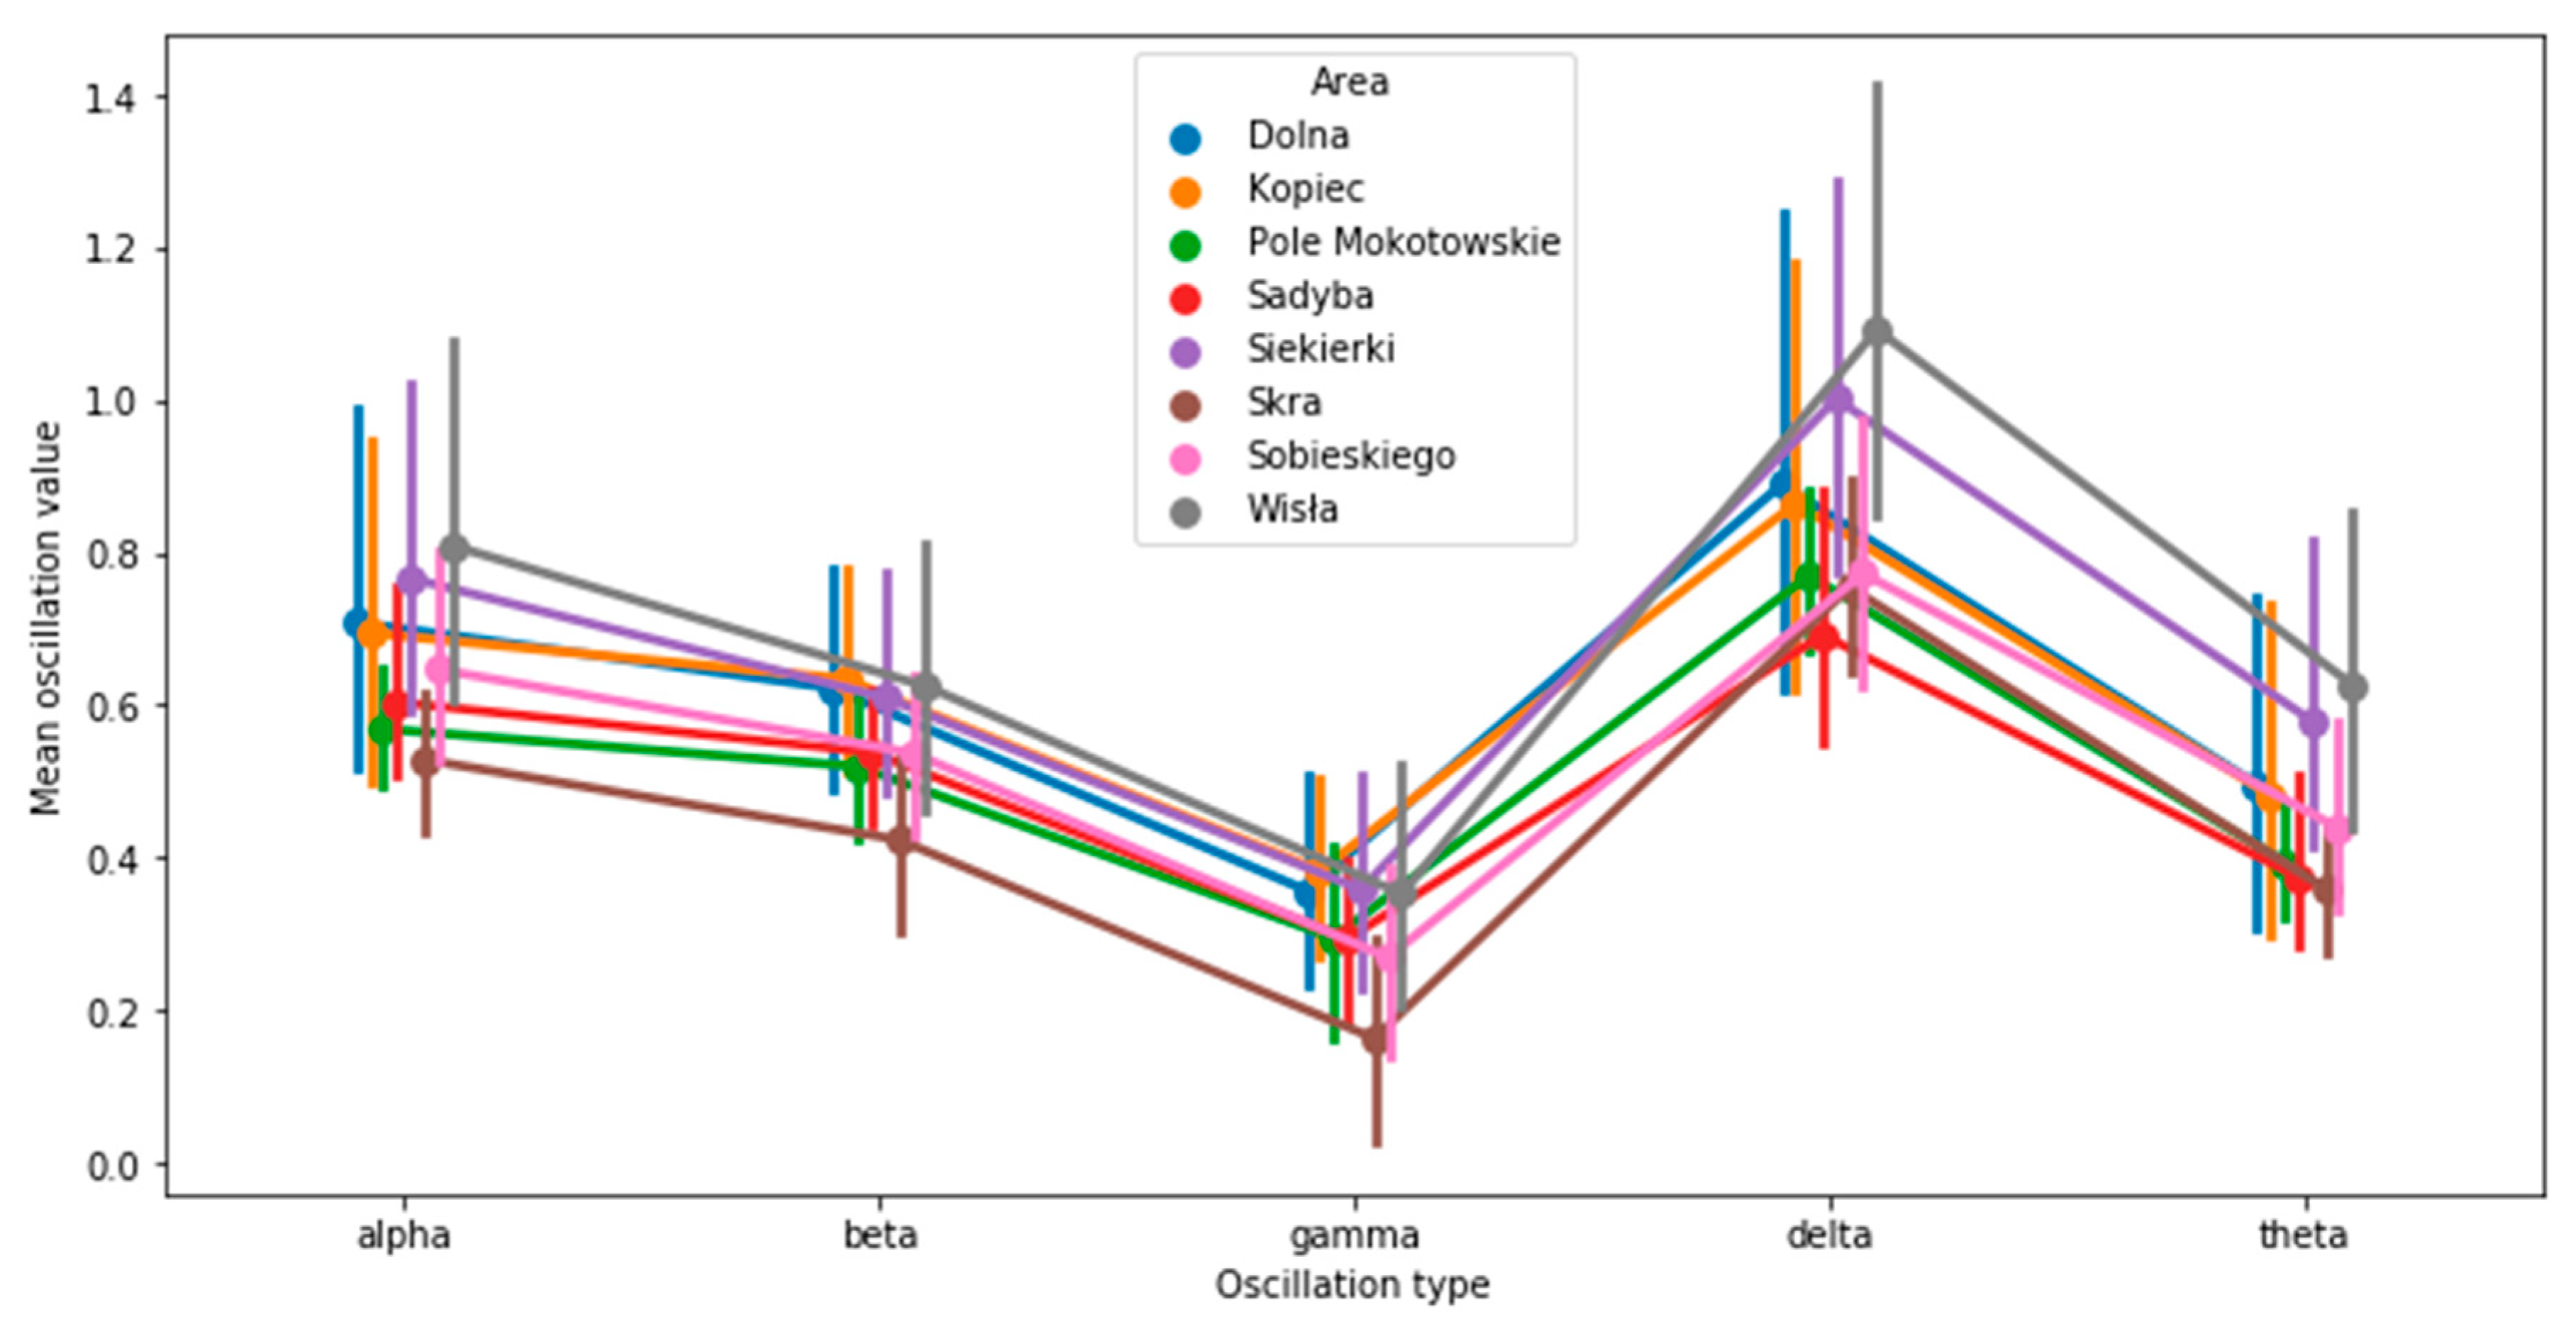
Due to this, we looked into other significant results using a different methodological approach. A data-driven analysis was carried out, this time grouping areas with varying differences between oscillations. We carried out multivariate analyses of variance in the repeated measurement scheme. The compared variables were the power of individual oscillations (alpha, beta, delta, theta) for a given area (Figure 5). First of all, we checked whether there were any significant differences in the oscillations between sexes. There were none—all gender differences in oscillations were on levels of p > 0.05.
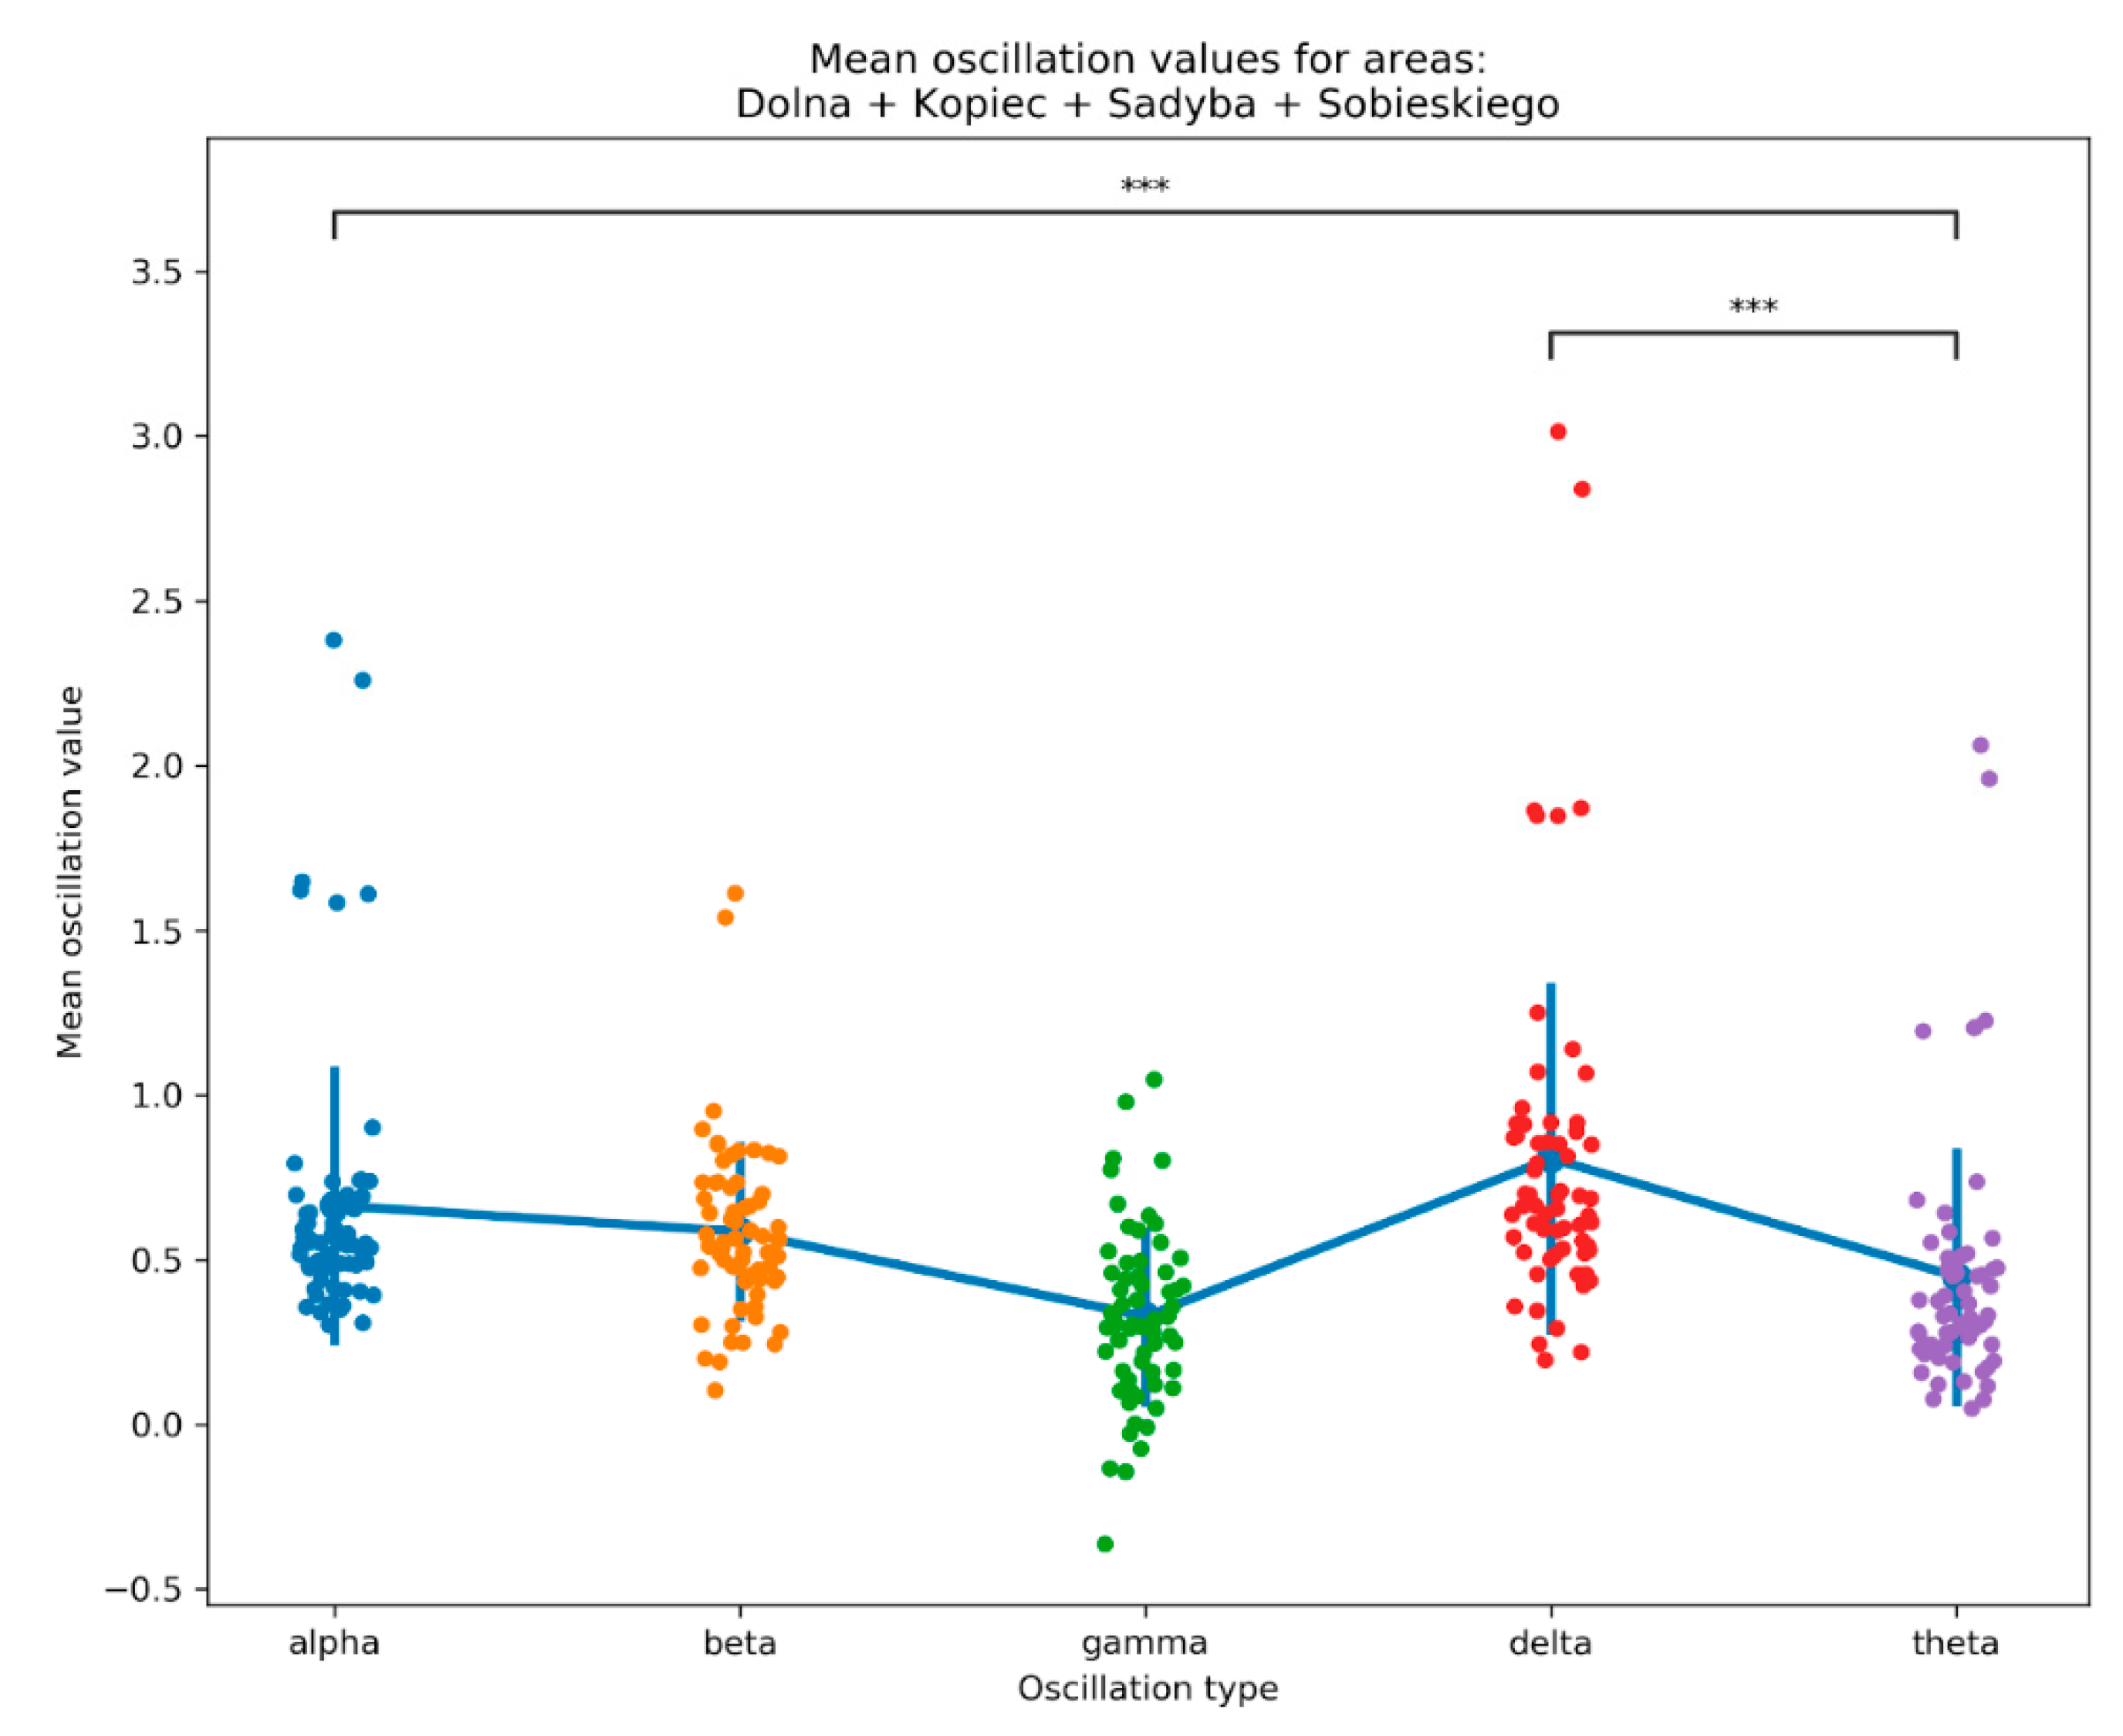
The results of the analyses showed that in “Dolna”, “Kopiec”, “Sadyba” and Sobieskiego Street areas, subjects had statistically significant differences between the alpha and theta oscillations (p < 0.001) and between the delta and theta oscillations (p < 0.001) (Figure 6, Table 3). This may mean that in these environments, subjects remained vigilant but at the same time felt calm. However, the calmness level cannot be compared with that achieved in the state of deep meditation.
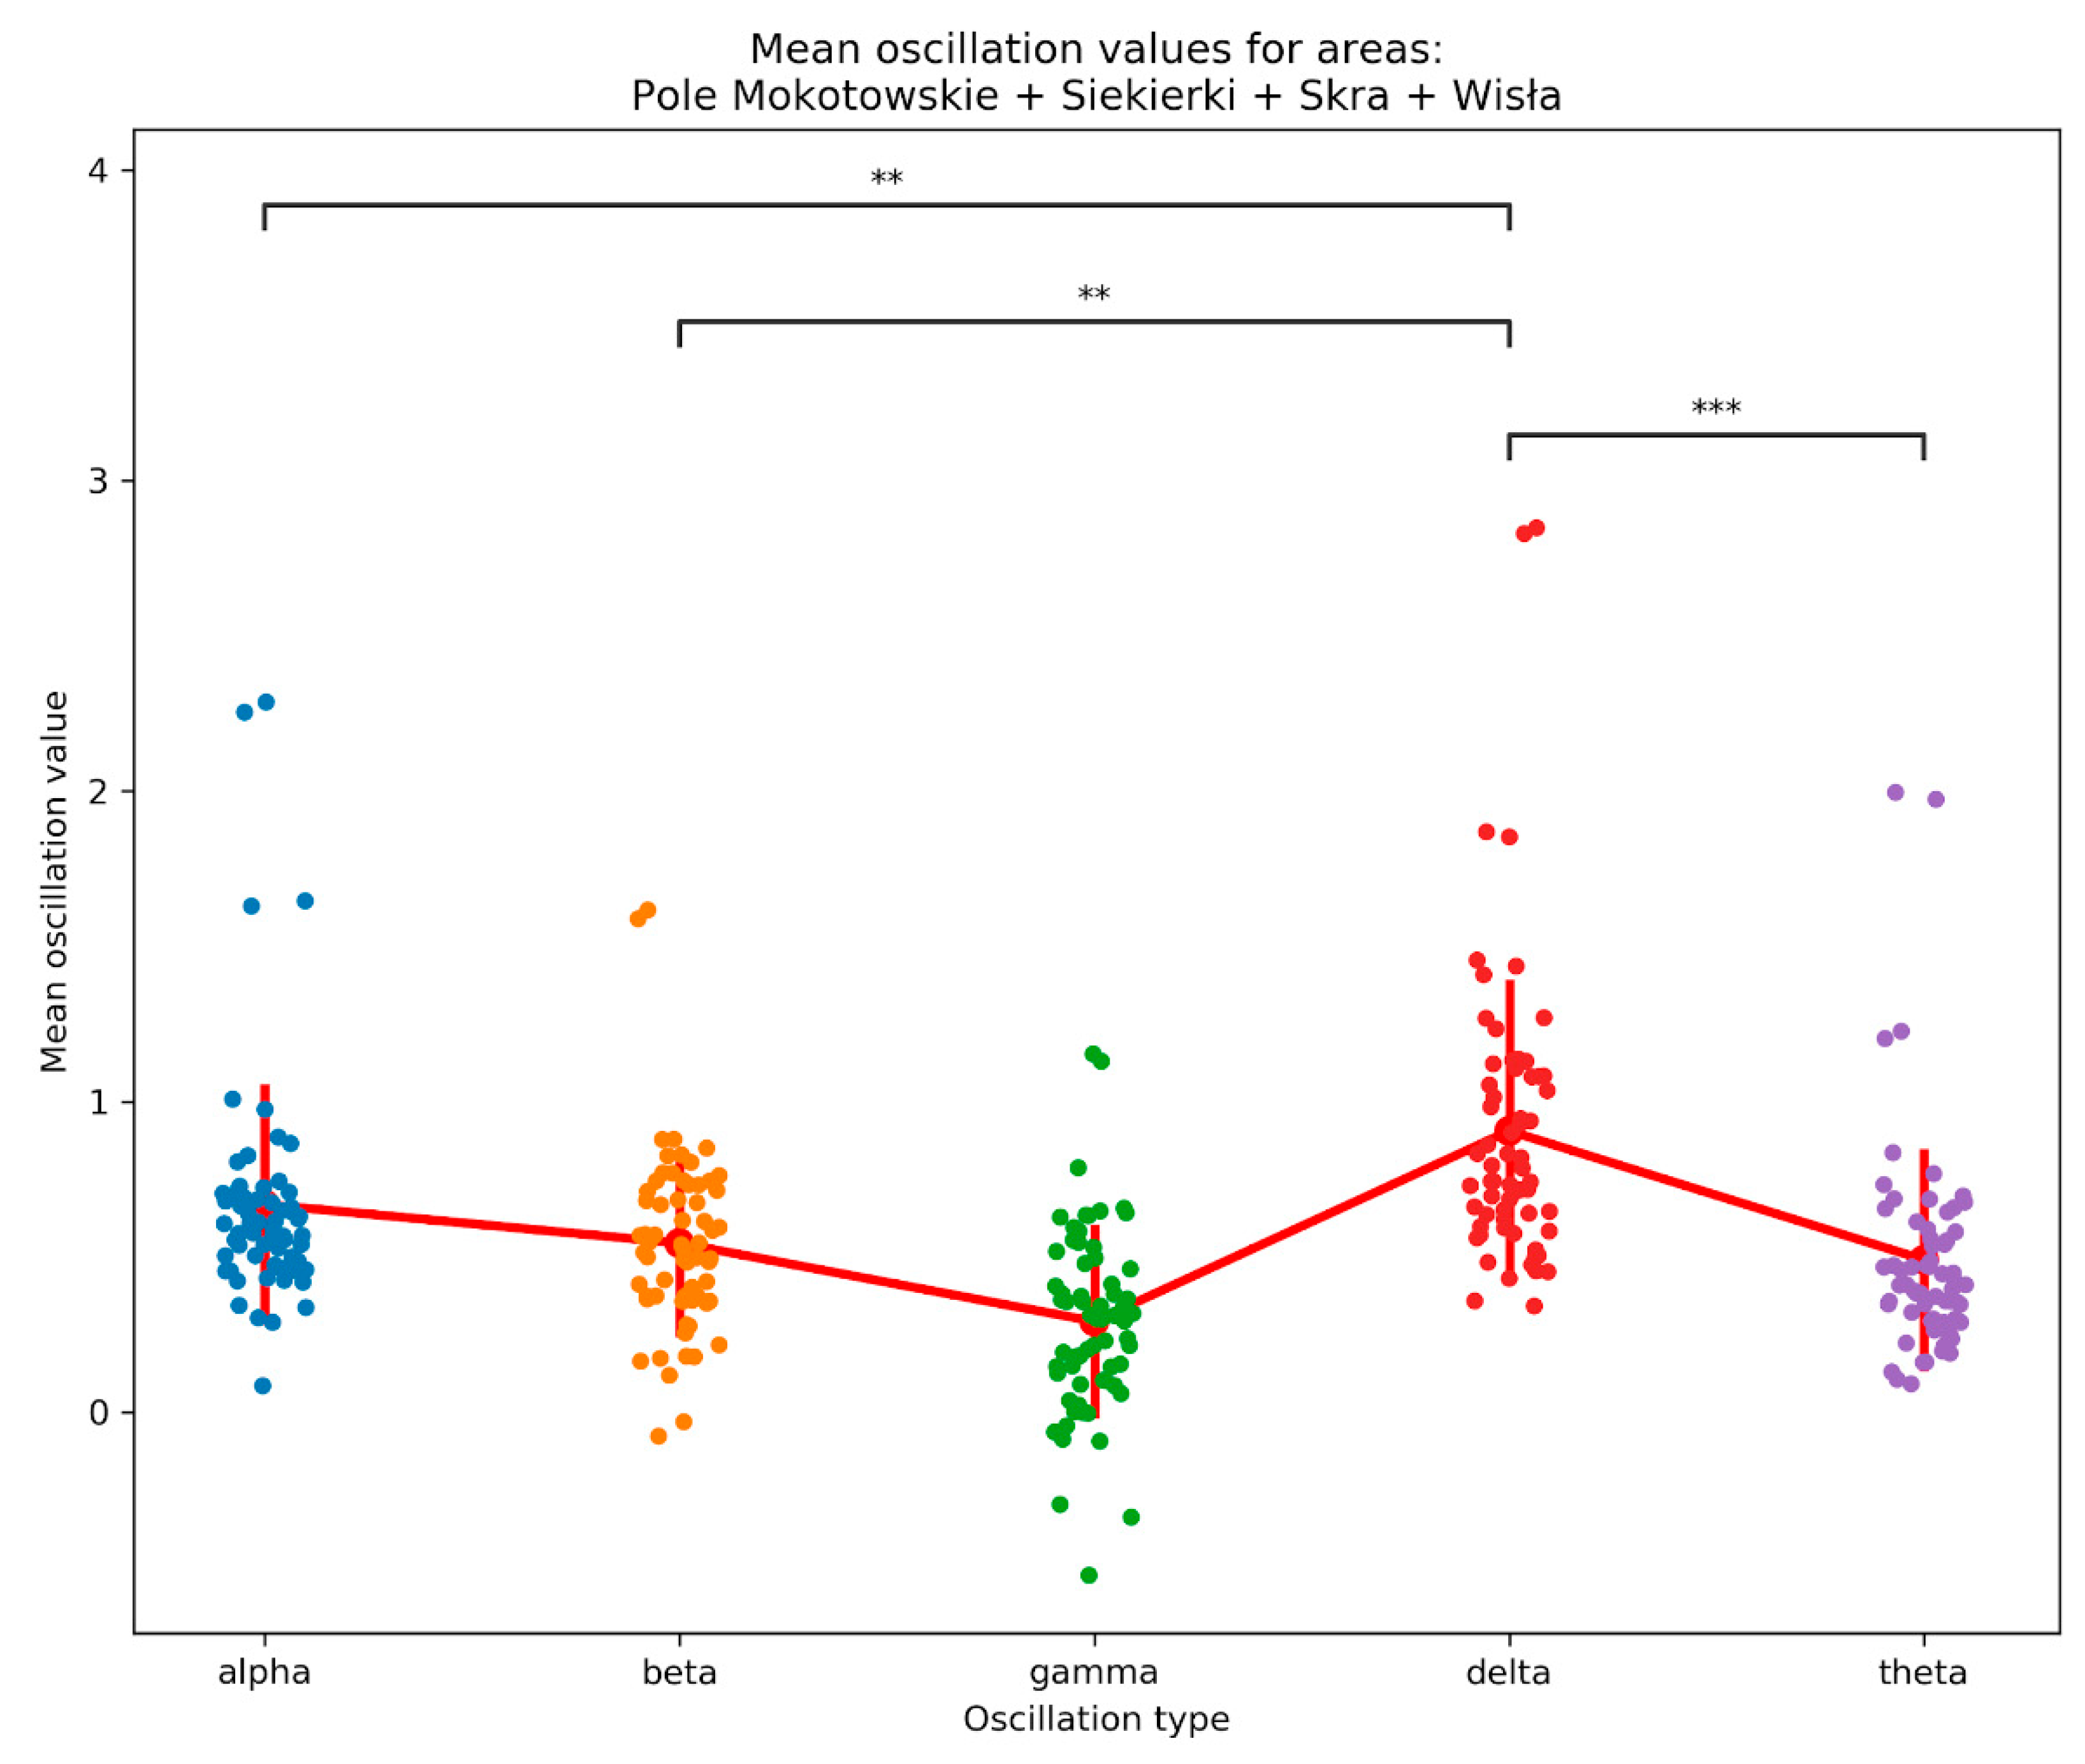
The situation differs slightly in the case of “Pole Mokotowskie”, “Siekierki”, “Skra” and “Wisła” areas. Here, the greatest power was characteristic of the delta oscillations, which differed significantly from alpha (p = 0.005), beta (p = 0.005) and theta (p < 0.001) oscillations. This may indicate that the subjects were much calmer and less alert in these areas (Figure 7, Table 4).

4. Discussion

The results of this experiment bring to attention two possible interpretations. The first interpretation is that there is not much difference between how spending time in informal green space and green space areas, respectively, influences our emotional well-being. The experiment was conducted in both GS and IGS, in a variety of sceneries and IGS types (Table A1 in Appendix A). The results demonstrate that levels of emotions such as calmness and alertness remained essentially similar when considering existing typologies (IGS vs. GS; scenery type; IGS type). However, data-driven analysis showed that there are groups of areas, outside of the literature-derived typologies, that present us with some internal variations in mean oscillation values.
In brief, respondents felt rather calm while resting in both groups of areas. What can be noted as a possible difference is alertness (vigilance) levels. Respondents felt vigilant but calm while roaming areas in Group 1 (Dolna, Kopiec, Sadyba and Sobieskiego Street areas), while staying calm and less alert in Group 2 areas (Pole Mokotowskie GS, Siekierki, Skra and Wisła). There are at least three factors that can provide an explanation for this.
Group 1 areas can be seen as “wilder”, deprived of obvious, visible clues or traces of “desirable” human interference such as paths, benches, artificial light sources etc. Kowarik [12] notes that access to IGSs through such cultural interventions, while paradoxical, helps to gain acceptance of this “urban wilderness”. Meanwhile, areas in Group 2 are generally well equipped with elements of human intervention. Besides the obvious Pole Mokotowskie Park, “Siekierki” IGS looks very much like an urban park with paved surfaces, benches and lanterns; “Skra” is an extension of Pole Mokotowskie Park, a former sports area currently largely in ruin; and “Wisła” has car-wide paths and access to water through small man-made “landings”. Hofmann et al. [65] studied the preferences and perceptions of parks and urban derelict land by landscape planners and residents. This research suggested that residents, although generally preferring more “artificial” green spaces, also accept derelict land, given that a minimum level of maintenance and accessibility is provided.
The second and third factors are the presence of “undesirable” and “desirable” users. In most of the Group 1 areas, the presence of “undesirables” [48] is obvious. In all three of the IGSs “Kopiec”, “Sobieskiego” and “Sadyba”, temporary, makeshift camps or dwellings of the homeless are easily noticeable. This is not the case for any of the four areas in Group 2. In “Dolna” IGS, although it is not unusual for other IGSs, one can easily find indications of excessive alcohol drinking and it is littered with vodka and beer bottles. The presence of undesirables and litter could be a factor in raised vigilance levels in the tests.
On the contrary, the presence of other “desirable” users could be a factor that reaffirms calmness, even combating the “problem” of “undesirables”. Whyte [48] observes that the best way to handle the problem of undesirables is to make a place attractive to everyone else. Having other people around in urban public spaces might ensure safety and reduce the feeling of excessive risk. The presence of “undesirables”, tolerance, inclusion and the idea of “reclaiming of public space” is a separate and broad issue that has had and still has a tremendous impact on urban design strategies [66,67,68].
This sheds some light on the diversity of IGSs. During site visits and discussions with participants, some of the chosen IGSs were identified as spaces that are in between IGS and GS (intermediate). These areas are still described as wastelands in planning documents and were not designed as green spaces but are partially cultivated (e.g., mowed), but have some sparse furnishing and/or are appropriated by local communities for recreational purposes (e.g., dog walking).
The results of this experiment should be considered as part of a larger research project on the role of IGSs and wastelands in the urban fabric, specifically using the case study of Warsaw, Poland [47]. This extended research cooperation provided analyses on the role of urban wastelands in the context of urban planning [69], air pollution [17], vernacular democracy [70], landscape aesthetics [71], reducing inequalities in urban green space availability to children and seniors [15], and user preferences and the potential for recreation [46]. This cloud of interconnected research brings more complex valuation of selected degraded, derelict and polluted green areas in Warsaw presenting the environmental and social potential of Informal Green Spaces.

5. Limitations

The limitations of this research are based on a variety of factors. One factor is the portable EEG technology itself and its limited capacity to accurately depict affective states of study participants, taking into account potential unexpected external noise as well as distorted readings stemming from body movements, head movements and eye movements. Some of such motoric artifacts are filtered out from the data but the filtering is limited by the quality of the used algorithm.
EEG has been used for many years and is definitely considered a safe procedure that causes no discomfort. The electrodes are passive and do not produce any sensations on the users’ side. Reliability and validity of EEG measurements may, however, be questioned in field research (due to, inter alia, effects of time of day, total time of exposure and the influence of physical activity on mental state). Thus, it has been a subject of ongoing academic debate and improvement attempts [72,73]. This applies particularly to the usage of this method in open, noisy spaces, such as green areas [74]. Moreover, a separate set of questions arises from the usage of consumer-grade devices such as the Muse headband. In a previous study, we found that the usefulness in measuring EEG signals of consumer-grade devices such as Muse is somewhat limited in non-laboratory conditions [45]. More generally, problems with the reliability of consumer wearables for monitoring affective states such as stress or calmness have also been underlined by other research works [75,76].
Apart from the technological aspect, other sources of limitations arise. Among them one can include external conditions, such as level of insolation, type of surface that the participants were sitting on as well as presence of others including animals, insects etc. Moreover, we would advise, in future experiments, attempting to control the environment of participants by, e.g., recording the ambient sounds and filtering out the unwanted parts of the EEG signal (distorted by ambulances or motorcycles driving by and potentially startling or annoying participants). Our achieved results might be potentially influenced by such occurrences, even though the number of areas, sectors, measurements and participants contributed to evening out such distortions. As in many other studies, especially field studies implementing precise EEG devices, there are several limitations to our study stemming from the amount of hard-to-account-for variables that could be included in the study protocol. Some of the external variables that we could not include in the analyses, such as formal and informal interactions or slight difficulty in finding study locations, were possible factors contributing to minor changes in the mental state of the participants. Mostly, however, the locations were carefully mapped and the researchers did not engage in informal interactions with the users.
In the future, in order to increase the general reliability and validity of results, this type of interdisciplinary, innovative research could be combined with additional qualitative research.

6. Conclusions

In this experiment, we operated within the novel research area of Informal Green Spaces (often called green wastelands) while exploring emotional well-being with the employment of portable EEG devices. The EEG Muse headband provided an opportunity to analyze states of calmness and alertness in n = 17 participants (initially n = 20, but data from three participants were incomplete) while visiting chosen Informal Green Spaces in Warsaw, Poland. Seven IGS areas, one urban park (GS) and 33 viewpoints (561 total singular device records) presented a variety of IGS types including brownfields, abandoned lots and waterside areas as well as scenery types (grasslands, thickets, forests etc.). Comparative analysis within these existing typologies did not bring any statistically significant differences. Therefore, we could form an assumption that there is no substantial distinction in the users’ levels of emotional states while taking a rest in IGS versus GS. Moreover, data-driven analysis suggests that there might be a connection between the state of alertness and some characteristics of specific areas. Cross-analysis of EEG results and observed qualities of the research areas brought three possible sources of lower alertness to our attention. These were: 1. presence of “desirable” human intervention such as paths and urban furniture; 2. lack of “undesirable” users and signs of their presence; 3. presence of other “desirable” users.
This experiment carries a level of uncertainty (see “Limitations”) and calls for more in-depth research but could be regarded as a precedent in in-situ EEG-aided research on mood and well-being in Informal Green Spaces. The results of this and future research on emotional well-being in IGSs can find practical application as an expansion to existing evidence-based tools [9] for the evaluation of urban landscape quality and ecosystem service provision.
Author Contributions

Conceptualization, field research coordination, choice of research areas, introduction, conclusions—K.H.; data processing, statistical analysis—L.C.; apparatus, psychophysiological indices—A.P.; methods and procedure, results, discussion—K.H., L.C., A.P. All authors have read and agreed to the published version of the manuscript.

Funding

This study was financed by the Department of Greenery in the City Council of Warsaw (through the Operational Program Infrastructure and Environment 2014–2020) as part of a research project entitled “Inventory and valorization of selected degraded and polluted areas in Warsaw—the natural and social potential of wastelands”.

Institutional Review Board Statement

The study was conducted according to the guidelines of the Declaration of Helsinki, and did not require Institutional Review Board Statement at Warsaw University of Life Sciences, Institute of Environmental Enginering.

Informed Consent Statement

Informed consent was obtained from all subjects involved in the study.

Data Availability Statement

The data presented in this study are available on request from the corresponding author. The data are not publicly available due to privacy concerns.

Conflicts of Interest

The authors declare no conflict of interest.

Appendix A

Table A1. Typologies: scenery types, IGS/GS distinction and IGS types.
ViewpointScenery TypeIGS or GSIGS Type
Kopiec PW 1Low thicketsIGSLot
Kopiec PW 2Low thicketsIGSLot
Kopiec PW 3Unmoved grasslandsIGSLot
Kopiec PW 4WildernessIGSLot
Skra 1Sparse tree-cover/roads and pathsIGSBrownfield
Skra 2Unmoved grasslands/ruinsIGSBrownfield
Skra 3Herbaceous monocultureIGSBrownfield
Skra 4RuinsIGSBrownfield
Pole Mokotowskie 1“Savannah”Park (GS)-
Pole Mokotowskie 2Mowed grasslandsPark (GS)-
Pole Mokotowskie 3Roads and pathsPark (GS)-
Pole Mokotowskie 4Light forestPark (GS)-
Pole Mokotowskie 5WaterbodyPark (GS)-
Dolna 1Herbaceous monocultureIGSWaterside
Dolna 2Low thicketsIGSWaterside
Dolna 3“Savannah”IGSWaterside
Dolna 4WaterbodyIGSWaterside
Sadyba 1Light forest/streamIGSWaterside
Sadyba 2Mowed grasslands/streamIGSWaterside
Sadyba 3Low thickets/roads and pathsIGSWaterside
Sadyba 4Mowed grasslands/streamIGSWaterside
Siekierki 1Herbaceous monoculture/waterbodyIGSWaterside
Siekierki 2Herbaceous monoculture/waterbodyIGSWaterside
Siekierki 3Herbaceous monocultureIGSWaterside
Siekierki 4Herbaceous monoculture/waterbodyIGSWaterside
Wisła 1Herbaceous monocultureIGSWaterside
Wisła 2“Savannah”IGSWaterside
Wisła 3Light forest/roads and pathsIGSWaterside
Wisła 4WaterbodyIGSWaterside
Sobieskiego 1Low thickets/roads and pathsIGSLot
Sobieskiego 2Sparse tree-coverIGSLot
Sobieskiego 3Sparse tree-coverIGSLot
Sobieskiego 4Wilderness/streamIGSWaterside

Appendix B

Table A2. Randomization of area visits for n = 17 participants.
WisłaSobieskiegoSkraSiekierkiSadybaPole MokotowskieKopiecDolna
Participant 163854172
Participant 235821746
Participant 351362487
Participant 442751836
Participant 528516437
Participant 687356241
Participant 725834716
Participant 814638527
Participant 951362487
Participant 1052743168
Participant 1175268143
Participant 1252643187
Participant 1337248156
Participant 1463751842
Participant 1564273185
Participant 1617354268
Participant 172--1--34

Appendix C

Table A3. Instruction for participants with the scenario for a field visit.
To Use the Muse Headband, the Experimenters and Test Participants Will Perform the Following Steps:
1. Initial configuration of the “Muse Monitor” application on the smartphone (done only once for the entire examination);
1.1. In the settings, change “Notch Frequency” to “None”;
1.2. Change “Recording Interval” to “Constant”;
2. Walk around the green space along the designated route, as marked in Google Maps. Sit down (on a provided foldable chair) at the first viewpoint for a few minutes of equipment calibration, and for a 3-min landscape viewing session;
3. Switch on the Bluetooth system on the smartphone;
4. Switch on the Muse headband;
5. Establish a Bluetooth connection between the smartphone and Muse;
6. Start the “Muse Monitor” application on the smartphone;
7. Place the Muse headband on your forehead;
8. Establish a connection between the “Muse Monitor” application and the Muse headband by following the directions of electrode visuals on the screen and positioning the band on the head accordingly;
9. Close your eyes for approximately 30 s and relax (baseline session);
10. Set the timer on your smartphone for 3 min;
11. Press the signal registration button in the “Muse Monitor” application;
12. Observe the view of the landscape, looking into the direction described by the Google Maps link;
13. After the alarm is triggered, stop the recording by pressing the button in the “Muse Monitor” application;
14. Turn off the application and remove the Muse headband;
15. Continue walking along the designated route towards next viewpoint.

References

  1. Astell-Burt, T.; Feng, X.; Kolt, G.S. Mental health benefits of neighbourhood green space are stronger among physically active adults in middle-to-older age: Evidence from 260,061 Australians. Prev. Med. 2013, 57, 601–606. [Google Scholar] [CrossRef]
  2. Barton, J.; Pretty, J. What is the best dose of nature and green exercise for improving mental health? A multi-study analysis. Environ. Sci. Technol. 2010, 44, 3947–3955. [Google Scholar] [CrossRef]
  3. Twohig-Bennett, C.; Jones, A. The health benefits of the great outdoors: A systematic review and meta-analysis of greenspace exposure and health outcomes. Environ. Res. 2018, 166, 628–637. [Google Scholar] [CrossRef]
  4. Cherrie, M.P.C.; Shortt, N.K.; Mitchell, R.J.; Taylor, A.M.; Redmond, P.; Thompson, C.W.; Starr, J.M.; Deary, I.J.; Pearce, J.R. Green space and cognitive ageing: A retrospective life course analysis in the Lothian Birth Cohort 1936. Soc. Sci. Med. 2018, 196, 56–65. [Google Scholar] [CrossRef]
  5. Takano, T. Urban residential environments and senior citizens’ longevity in megacity areas: The importance of walkable green spaces. J. Epidemiol. Commun. Health 2002, 56, 913–918. [Google Scholar] [CrossRef] [Green Version]
  6. Vanaken, G.-J.; Danckaerts, M. Impact of Green Space Exposure on Children’s and Adolescents’ Mental Health: A Systematic Review. Int. J. Environ. Res. Public Health 2018, 15, 2668. [Google Scholar] [CrossRef] [PubMed] [Green Version]
  7. Ulrich, R.S. View through a window may influence recovery from surgery. Science 1984, 224, 420–421. [Google Scholar] [CrossRef] [PubMed] [Green Version]
  8. Olszewska-Guizzo, A.; Escoffier, N.; Chan, J.; Puay Yok, T. Window View and the Brain: Effects of Floor Level and Green Cover on the Alpha and Beta Rhythms in a Passive Exposure EEG Experiment. Int. J. Environ. Res. Public Health 2018, 15, 2358. [Google Scholar] [CrossRef] [PubMed] [Green Version]
  9. Olszewska-Guizzo, A. Contemplative Landscapes: Towards Healthier Built Environments. Environ. Soc. Psychol. 2018, 3. [Google Scholar] [CrossRef]
  10. Rupprecht, C.D.D.; Byrne, J.A. Informal urban greenspace: A typology and trilingual systematic review of its role for urban residents and trends in the literature. Urban For. Urban Green. 2014, 13, 597–611. [Google Scholar] [CrossRef] [Green Version]
  11. Kowarik, I. Urban wilderness: Supply, demand, and access. Urban For. Urban Green. 2018, 29, 336–347. [Google Scholar] [CrossRef]
  12. Kowarik, I. Cities and wilderness. A New Perspective. Int. J. Wilderness 2013, 19, 32–36. [Google Scholar]
  13. The Third Landscape. Available online: http://www.gillesclement.com/art-454-tit-The-Third-Landscape (accessed on 13 November 2020).
  14. Castro, D. Codex of the Third Landscape; Victoria University of Wellington: Wellington, New Zealand, 2019. [Google Scholar]
  15. Sikorska, D.; Łaszkiewicz, E.; Krauze, K.; Sikorski, P. The role of informal green spaces in reducing inequalities in urban green space availability to children and seniors. Environ. Sci. Policy 2020, 108, 144–154. [Google Scholar] [CrossRef]
  16. Rupprecht, C.D.D.; Byrne, J.A. Informal urban green-space: Comparison of quantity and characteristics in Brisbane, Australia and Sapporo, Japan. PLoS ONE 2014, 9, e99784. [Google Scholar] [CrossRef] [PubMed] [Green Version]
  17. Przybysz, A.; Wińska-Krysiak, M.; Małecka-Przybysz, M.; Stankiewicz-Kosyl, M.; Skwara, M.; Kłos, A.; Kowalczyk, S.; Jarocka, K.; Sikorski, P. Urban wastelands: On the frontline between air pollution sources and residential areas. Sci. Total Environ. 2020, 721, 137695. [Google Scholar] [CrossRef] [PubMed]
  18. Franck, K.; Stevens, Q. Loose Space: Possibility and Diversity in Urban Life; Routledge: Abingdon, UK, 2006; ISBN 9781135993184. [Google Scholar]
  19. Tilley, S.; Neale, C.; Patuano, A.; Cinderby, S. Older People’s Experiences of Mobility and Mood in an Urban Environment: A Mixed Methods Approach Using Electroencephalography (EEG) and Interviews. Int. J. Environ. Res. Public Health 2017, 14, 151. [Google Scholar] [CrossRef]
  20. Roe, J.J.; Aspinall, P.A.; Mavros, P.; Coyne, R. Engaging the brain: The impact of natural versus urban scenes using novel EEG methods in an experimental setting. Environ. Sci. 2013, 1, 93–104. [Google Scholar] [CrossRef] [Green Version]
  21. Yanru, H.; Masoudi, M.; Chadala, A.; Olszewska-Guizzo, A. Visual Quality Assessment of Urban Scenes with the Contemplative Landscape Model: Evidence from a Compact City Downtown Core. Remote Sens. 2020, 12, 3517. [Google Scholar] [CrossRef]
  22. Olszewska-Guizzo, A.A.; Paiva, T.O.; Barbosa, F. Effects of 3D Contemplative Landscape Videos on Brain Activity in a Passive Exposure EEG Experiment. Front. Psychiatry 2018, 9, 317. [Google Scholar] [CrossRef] [Green Version]
  23. Pratiwi, P.I.; Xiang, Q.; Furuya, K. Physiological and Psychological Effects of Viewing Urban Parks in Different Seasons in Adults. Int. J. Environ. Res. Public Health 2019, 16, 4279. [Google Scholar] [CrossRef] [PubMed] [Green Version]
  24. Daniel, T.C. Measuring Landscape Esthetics: The Scenic Beauty Estimation Method; Department of Agriculture, Forest Service, Rocky Mountain Forest and Range Experiment Station: Fort Collins, CO, USA, 1976. [Google Scholar]
  25. Hull, R.B. Interpreting Scenic Beauty Estimates. Landsc. J. 1989, 8, 24–27. [Google Scholar] [CrossRef]
  26. Jorgensen, A. Beyond the view: Future directions in landscape aesthetics research. Landsc. Urban. Plan. 2011, 100, 353–355. [Google Scholar] [CrossRef]
  27. Olszewska-Guizzo, A.; Sia, A.; Fogel, A.; Ho, R. Can Exposure to Certain Urban Green Spaces Trigger Frontal Alpha Asymmetry in the Brain?—Preliminary Findings from a Passive Task EEG Study. Int. J. Environ. Res. Public Health 2020, 17, 394. [Google Scholar] [CrossRef] [Green Version]
  28. Lutz, A.; Slagter, H.A.; Dunne, J.D.; Davidson, R.J. Attention regulation and monitoring in meditation. Trends Cogn. Sci. 2008, 12, 163–169. [Google Scholar] [CrossRef] [Green Version]
  29. Chiesa, A.; Serretti, A. Mindfulness-based stress reduction for stress management in healthy people: A review and meta-analysis. J. Altern. Complement. Med. 2009, 15, 593–600. [Google Scholar] [CrossRef] [PubMed]
  30. Debener, S.; Minow, F.; Emkes, R.; Gandras, K.; de Vos, M. How about taking a low-cost, small, and wireless EEG for a walk? Psychophysiology 2012, 49, 1617–1621. [Google Scholar] [CrossRef] [PubMed]
  31. Aspinall, P.; Mavros, P.; Coyne, R.; Roe, J. The urban brain: Analysing outdoor physical activity with mobile EEG. Br. J. Sports Med. 2015, 49, 272–276. [Google Scholar] [CrossRef] [Green Version]
  32. Wilkinson, C.M.; Burrell, J.I.; Kuziek, J.W.P.; Thirunavukkarasu, S.; Buck, B.H.; Mathewson, K.E. Predicting stroke severity with a 3-min recording from the Muse portable EEG system for rapid diagnosis of stroke. Sci. Rep. 2020, 10, 18465. [Google Scholar] [CrossRef]
  33. LaRocco, J.; Le, M.D.; Paeng, D.-G. A Systemic Review of Available Low-Cost EEG Headsets Used for Drowsiness Detection. Front. Neuroinform. 2020, 14, 553352. [Google Scholar] [CrossRef]
  34. Bhayee, S.; Tomaszewski, P.; Lee, D.H.; Moffat, G.; Pino, L.; Moreno, S.; Farb, N.A.S. Attentional and affective consequences of technology supported mindfulness training: A randomised, active control, efficacy trial. BMC Psychol. 2016, 4, 60. [Google Scholar] [CrossRef] [PubMed] [Green Version]
  35. Kovacevic, N.; Ritter, P.; Tays, W.; Moreno, S.; McIntosh, A.R. My Virtual Dream: Collective Neurofeedback in an Immersive Art Environment. PLoS ONE 2015, 10, e0130129. [Google Scholar] [CrossRef] [PubMed]
  36. Krigolson, O.E.; Williams, C.C.; Norton, A.; Hassall, C.D.; Colino, F.L. Choosing MUSE: Validation of a Low-Cost, Portable EEG System for ERP Research. Front. Neurosci. 2017, 11. [Google Scholar] [CrossRef] [PubMed] [Green Version]
  37. Milosevic, M.; Milenkovic, A.; Jovanov, E. mHealth@UAH: Computing infrastructure for mobile health and wellness monitoring. XRDS 2013, 20, 43–49. [Google Scholar] [CrossRef]
  38. Neale, C.; Aspinall, P.; Roe, J.; Tilley, S.; Mavros, P.; Cinderby, S.; Coyne, R.; Thin, N.; Bennett, G.; Thompson, C.W. The Aging Urban Brain: Analyzing Outdoor Physical Activity Using the Emotiv Affectiv Suite in Older People. J. Urban. Health 2017, 94, 869–880. [Google Scholar] [CrossRef] [PubMed] [Green Version]
  39. Neale, C.; Aspinall, P.; Roe, J.; Tilley, S.; Mavros, P.; Cinderby, S.; Coyne, R.; Thin, N.; Ward Thompson, C. The impact of walking in different urban environments on brain activity in older people. Cities Health 2020, 4, 94–106. [Google Scholar] [CrossRef] [Green Version]
  40. Adli, M.; Berger, M.; Brakemeier, E.-L.; Engel, L.; Fingerhut, J.; Gomez-Carrillo, A.; Hehl, R.; Heinz, A.; Mayer, H.J.; Mehran, N.; et al. Neurourbanism: Towards a new discipline. Lancet Psychiatry 2017, 4, 183–185. [Google Scholar] [CrossRef]
  41. Schneider, S.; Brümmer, V.; Abel, T.; Askew, C.D.; Strüder, H.K. Changes in brain cortical activity measured by EEG are related to individual exercise preferences. Physiol. Behav. 2009, 98, 447–452. [Google Scholar] [CrossRef] [PubMed]
  42. Mavros, P.; Austwick, M.Z.; Smith, A.H. Geo-EEG: Towards the Use of EEG in the Study of Urban Behaviour. Appl. Spat. Anal. Policy 2016, 9, 191–212. [Google Scholar] [CrossRef] [Green Version]
  43. Arsalan, A.; Majid, M.; Butt, A.R.; Anwar, S.M. Classification of Perceived Mental Stress Using A Commercially Available EEG Headband. IEEE J. Biomed. Health Inform. 2019, 23, 2257–2264. [Google Scholar] [CrossRef] [PubMed]
  44. Krigolson, O.E.; Williams, C.C.; Colino, F.L. Using Portable EEG to Assess Human Visual Attention. In Proceedings of the Augmented Cognition. Neurocognition and Machine Learning; Springer: Cham, Switzerland, 2017; pp. 56–65. [Google Scholar]
  45. Przegalinska, A.; Ciechanowski, L.; Magnuski, M.; Gloor, P. Muse Headband: Measuring Tool or a Collaborative Gadget? In Collaborative Innovation Networks: Building Adaptive and Resilient Organizations; Grippa, F., Leitão, J., Gluesing, J., Riopelle, K., Gloor, P., Eds.; Springer International Publishing: Cham, Switzerland, 2018; pp. 93–101. ISBN 9783319742953. [Google Scholar]
  46. Gawryszewska, B.J.; Wilczyńska, A.; Łepkowski, M.; Nejman, R.; Cziszewska, M. The recreational potential for wastelands as well as users’ preferences for wasteland aesthetics. Case study of Warsaw, Poland. E3S Web Conf. 2018, 45, 00018. [Google Scholar] [CrossRef] [Green Version]
  47. Gawryszewska, B.J.; Sikorski, P.; Wilczyńska, A.; Łepkowski, M.; Dymitryszyn, I.; Przybysz, A.; Schwerk, A.; Wińska-Krysiak, M.; Herman, K.; Jojczyk, A.; et al. Fruitful Wastelands Fact-Sheet. Available online: https://www.researchgate.net/publication/340435267_Fruitful_wastelands_fact-sheet (accessed on 12 February 2021).
  48. Whyte, W.H. The Social Life of Small Urban Spaces; Project for Public Spaces: New York, NY, USA, 1980. [Google Scholar]
  49. Sanei, S.; Chambers, J.A. EEG Signal. Processing; John Wiley & Sons: Hoboken, NJ, USA, 2013; ISBN 9781118691236. [Google Scholar]
  50. Zhao, G.; Zhang, Y.; Ge, Y. Frontal EEG Asymmetry and Middle Line Power Difference in Discrete Emotions. Front. Behav. Neurosci. 2018, 12, 225. [Google Scholar] [CrossRef] [PubMed] [Green Version]
  51. Lutz, A.; Greischar, L.L.; Rawlings, N.B.; Ricard, M.; Davidson, R.J. Long-term meditators self-induce high-amplitude gamma synchrony during mental practice. Proc. Natl. Acad. Sci. USA 2004, 101, 16369–16373. [Google Scholar] [CrossRef] [Green Version]
  52. Muthukumaraswamy, S.D. High-frequency brain activity and muscle artifacts in MEG/EEG: A review and recommendations. Front. Hum. Neurosci. 2013, 7, 138. [Google Scholar] [CrossRef] [PubMed] [Green Version]
  53. Kolodziej, A.; Magnuski, M.; Ruban, A.; Brzezicka, A. Three times NO: No relationship between frontal alpha asymmetry and depressive disorders in a multiverse analysis of three studies. BioRxiv 2020. [Google Scholar] [CrossRef]
  54. Teplan, M. Others Fundamentals of EEG measurement. Meas. Sci. Rev. 2002, 2, 1–11. [Google Scholar]
  55. Al-Shargie, F.; Kiguchi, M.; Badruddin, N.; Dass, S.C.; Hani, A.F.M.; Tang, T.B. Mental stress assessment using simultaneous measurement of EEG and fNIRS. Biomed. Opt. Express 2016, 7, 3882–3898. [Google Scholar] [CrossRef] [Green Version]
  56. Choi, Y.; Kim, M.; Chun, C. Measurement of occupants’ stress based on electroencephalograms (EEG) in twelve combined environments. Build. Environ. 2015, 88, 65–72. [Google Scholar] [CrossRef]
  57. Tamosiunas, A.; Grazuleviciene, R.; Luksiene, D.; Dedele, A.; Reklaitiene, R.; Baceviciene, M.; Vencloviene, J.; Bernotiene, G.; Radisauskas, R.; Malinauskiene, V.; et al. Accessibility and use of urban green spaces, and cardiovascular health: Findings from a Kaunas cohort study. Environ. Health 2014, 13, 20. [Google Scholar] [CrossRef] [Green Version]
  58. Vanitha, L.; Suresh, G.R. Hybrid SVM classification technique to detect mental stress in human beings using ECG signals. In Proceedings of the 2013 International Conference on Advanced Computing and Communication Systems, Rohtak, India, 6–7 April 2013; pp. 1–6. [Google Scholar]
  59. Hedblom, M.; Gunnarsson, B.; Iravani, B.; Knez, I.; Schaefer, M.; Thorsson, P.; Lundström, J.N. Reduction of physiological stress by urban green space in a multisensory virtual experiment. Sci. Rep. 2019, 9, 10113. [Google Scholar] [CrossRef] [Green Version]
  60. Michels, N.; Sioen, I.; Clays, E.; De Buyzere, M.; Ahrens, W.; Huybrechts, I.; Vanaelst, B.; De Henauw, S. Children’s heart rate variability as stress indicator: Association with reported stress and cortisol. Biol. Psychol. 2013, 94, 433–440. [Google Scholar] [CrossRef]
  61. McDuff, D.; Gontarek, S.; Picard, R. Remote measurement of cognitive stress via heart rate variability. In Proceedings of the 2014 36th Annual International Conference of the IEEE Engineering in Medicine and Biology Society, Chicago, IL, USA, 26–30 August 2014; pp. 2957–2960. [Google Scholar]
  62. Hystad, P.; Cusack, L. A Real-World Experimental Study of Physiological Stress Responses to Urban Green Space. Environ. Epidemiol. 2019, 3, 172. [Google Scholar]
  63. Bakker, J.; Pechenizkiy, M.; Sidorova, N. What’s Your Current Stress Level? Detection of Stress Patterns from GSR Sensor Data. In Proceedings of the 2011 IEEE 11th International Conference on Data Mining Workshops, Vancouver, BC, Canada, 11 December 2011; pp. 573–580. [Google Scholar]
  64. Fernandes, A.; Helawar, R.; Lokesh, R.; Tari, T.; Shahapurkar, A.V. Determination of stress using Blood Pressure and Galvanic Skin Response. In Proceedings of the 2014 International Conference on Communication and Network Technologies, Sivakasi, India, 18–19 December 2014; pp. 165–168. [Google Scholar]
  65. Hofmann, M.; Westermann, J.R.; Kowarik, I.; van der Meer, E. Perceptions of parks and urban derelict land by landscape planners and residents. Urban For. Urban Green. 2012, 11, 303–312. [Google Scholar] [CrossRef]
  66. Belina, B. Evicting the undesirables. The idealism of public space and the materialism of the bourgeois State. Belgeo 2003, 47–62. [Google Scholar] [CrossRef] [Green Version]
  67. Ellickson, R.C. Controlling Chronic Misconduct in City Spaces: Of Panhandlers, Skid Rows, and Public-Space Zoning. Yale Law J. 1996, 105, 1165. [Google Scholar] [CrossRef] [Green Version]
  68. Mitchell, D. The annihilation of space by law: The roots and implications of anti-homeless laws in the United States. Antipode 1997, 29, 303–335. [Google Scholar] [CrossRef]
  69. Nejman, R.; Łepkowski, M.; Wilczyńska, A.; Gawryszewska, B.J. The right to wild. Green urban wasteland in the context of urban planning. Urban Dev. Issues 2018, 59, 43–53. [Google Scholar] [CrossRef]
  70. Gawryszewska, B.J.; Łepkowski, M.; Wilczyńska, A. City wastelands: Creating places of vernacular democracy. In Urban Gardening and the Struggle for Social and Spatial Justice; Manchester University Press: Manchester, UK, 2019; ISBN 9781526126092. [Google Scholar]
  71. Gawryszewska, B.; Łepkowski, M. Estetyka nieużytku we współczesnej architekturze krajobrazu miasta. Szt. Filoz. 2016, 49, 17–31. [Google Scholar]
  72. Cicchetti, D.V.; Allison, T. A New Procedure for Assessing Reliability of Scoring EEG Sleep Recordings. Am. J. EEG Technol. 1971, 11, 101–110. [Google Scholar] [CrossRef]
  73. Gudmundsson, S.; Runarsson, T.P.; Sigurdsson, S.; Eiriksdottir, G.; Johnsen, K. Reliability of quantitative EEG features. Clin. Neurophysiol. 2007, 118, 2162–2171. [Google Scholar] [CrossRef]
  74. Casson, A.J. Wearable EEG and beyond. Biomed. Eng. Lett. 2019, 9, 53–71. [Google Scholar] [CrossRef]
  75. Peake, J.M.; Kerr, G.; Sullivan, J.P. A Critical Review of Consumer Wearables, Mobile Applications, and Equipment for Providing Biofeedback, Monitoring Stress, and Sleep in Physically Active Populations. Front. Physiol. 2018, 9, 743. [Google Scholar] [CrossRef] [PubMed]
  76. Balanou, E.; van Gils, M.; Vanhala, T. State-of-the-art of wearable EEG for personalized health applications. Stud. Health Technol. Inform. 2013, 189, 119–124. [Google Scholar] [PubMed]
Figure 1. Identified Informal Green Spaces in Warsaw: seven chosen IGS areas (red); a reference green space (GS) area, Pole Mokotowskie Park (yellow); other identified IGS areas (green).
Sustainability 13 02212 g001
Figure 2. Viewpoints in different research areas: (A) Kopiec PW 2 (Second viewpoint on Warsaw Uprising Mound IGS); (B) Skra 3 (Third viewpoint in Skra IGS); (C) Sadyba 4 (Fourth viewpoint in Sadyba IGS along a ditch); (D) Pole Mokotowskie 5 (fifth viewpoint in Pole Mokotowskie Park GS—reference area).
Sustainability 13 02212 g002
Figure 3. Information on viewpoints as provided to the participants on Google Maps.
Sustainability 13 02212 g003
Figure 4. A participant with a Muse headband on, during a session at viewpoint 2 in “Skra” IGS.
Sustainability 13 02212 g004
Figure 5. Mean oscillation value of 5 types of oscillations for all 8 studied areas.
Sustainability 13 02212 g005
Figure 6. Mean oscillation values for one of the studied groups characterized by the same difference between oscillations. Each colored point refers to one person’s mean oscillation value; the blue vertical lines show oscillation type means and standard deviations of each oscillation type’s mean values. ***: p < 0.001.
Sustainability 13 02212 g006
Figure 7. Mean oscillation values for one of the studied groups characterized by the same difference between oscillations. Each colored point refers to one person’s mean oscillation value; the red vertical lines show oscillation type means and standard deviations of each oscillation type’s mean values. **: p < 0.01; ***: p < 0.001.
Sustainability 13 02212 g007
Table 1. Types of scenery in Warsaw Informal Green Spaces (IGSs) (as identified by Gawryszewska et al.) [46].
Scenery TypeDescriptionNumber of Cases
Low thicketsvery dense shrubs and young trees5
Unmoved grasslandsunmowed grassland with herbaceous plants up to waist height (~100 cm)2
Wildernessundergrowth densely overgrown with trees, dense shrubs and young trees with a lot of fallen branches2
Sparse tree-coverrarely overgrown with tall trees and without undergrowth3
Ruinsremains of constructions or walls2
Herbaceous monocultureone dominating species of herbaceous plants in a large area7
Mowed grasslandsherbaceous plants up to ankle height (~10 cm)3
Roads and pathshardened or unpaved5
Waterbodya river or a pond6
Light forest“clean” undergrowth with low grass (~10) sparsely overgrown by tall trees3
Streamsmall, linear water bodies and canals4
“Savannah”grassland with low/mowed herbaceous plants sparsely overgrown with shrubs and solitary trees3
Table 2. Research design and the phases of the procedures.
Phase 1Preparation for Field Research
Delimitation of areas (7 IGSs and 1GS). Choice based on 3 criteria (Section 2.1) and previous research [46,47]. Site visits by lead researcher, choice of viewpoints (coordinates assigned).
Phase 2Introduction for Participants
Introduction to research goals and equipment—individual instructions for all 20 participants. Presentation of research areas including walking directions and instructions on the use of provided Google Maps links. Test Bluetooth connection—smartphone to Muse EEG device. Test site visit with researchers and 5 out of 20 participants.
Phase 3Field Research
Individual field research following instructions provided (Table A2 in Appendix B). Constant communication (via phone and email) with participants on arising issues (technical, finding viewpoints etc.). Final meeting: returning the equipment and a short interview on general impressions of the study and issues that emerged.
Phase 4Data Curation
Data preparation as described in the “Statistical Analysis” section of this article.
Phase 5Data Analysis
Data analysis as described in the “Results” section of this article.
Table 3. Statistical metrics for “Dolna”, “Kopiec”, “Sadyba” and Sobieskiego Street areas, showing post-hoc analyses with mean differences between alpha and theta, and delta and theta oscillations. All numbers are rounded to 3 decimal places. N = 17.
AreaOscillation xOscillation yMean Difference (x–y)Standard ErrorSignificanceLower Confidence IntervalHigher Confidence IntervalCohen’s d Effect Size
Dolnaalphatheta0.2130.0260.0000.1290.2970.427
deltatheta0.3940.0540.0000.2200.5680.672
Kopiecalphatheta0.2130.0250.0000.1360.2890.436
deltatheta0.3830.0500.0000.2320.5340.695
Sadybaalphatheta0.2290.0190.0000.1710.2880.858
deltatheta0.3170.0350.0000.2120.4231.052
Sobieskiego Streetalphatheta0.2080.0240.0000.1350.2810.744
deltatheta0.3340.0330.0000.2340.4331.056
Table 4. Statistical metrics for “Pole Mokotowskie”, “Siekierki”, “Skra” and “Wisła” areas, showing post-hoc analyses with mean differences between alpha and theta, and delta and theta oscillations. All numbers are rounded to 3 decimal places. N = 17.
AreaOscillation xOscillation yMean Difference (x–y)Standard ErrorSignificanceLower Confidence IntervalHigher Confidence IntervalCohen’s d Effect Size
Pole Mokotowskiedeltaalpha0.2010.0480.0050.0560.3461.038
deltabeta0.2510.0580.0040.0760.4261.173
deltatheta0.3760.0320.0000.2800.4721.977
Siekierkideltaalpha0.2350.0560.0040.0660.4050.445
deltabeta0.3920.0960.0050.1040.6800.836
deltatheta0.4220.0470.0000.2820.5630.824
Skradeltaalpha0.2260.0470.0010.0840.3680.956
deltabeta0.3310.0600.0000.1500.5131.267
deltatheta0.3950.0340.0000.2910.4981.681
Wisładeltaalpha0.2830.0660.0040.0830.4820.505
deltabeta0.4680.0950.0010.1800.7560.928
deltatheta0.4660.0560.0000.2960.6360.861
Publisher’s Note: MDPI stays neutral with regard to jurisdictional claims in published maps and institutional affiliations.