Abstract
In order to conserve the energy used for remediation of harmful metals from aqueous media, an adsorption process was performed. It is efficient and low-cost method with zero carbon emissions as compared to other methods. A hematite-based novel nanomaterial loaded onto biochar was utilized for the remediation of toxic cadmium metal ions from aqueous media. Saccharum munja has been employed as low-cost feedstock to prepare the biochar. Three adsorbents i.e., raw Saccharum munja (SM), Saccharum munja biochar (SMBC) and hematite-loaded Saccharum munja bichar (HLSMBC) were used in batch adsorption tests to study uptake of metal ions by optimizing the experimental parameters. Experimental data and calculated results revealed maximum sorption efficiency of Cd(II) removal was given by HLSMBC (72 ppm) and SMBC (67.73 ppm) as compared with SM (48.7 ppm). Among adsorption isotherms applied on work best fit for Cd(II) adsorption on SM was found for a Freundlich isotherm with high values of correlation coefficient R2 ≥ 0.9 for all sorbents and constant 1/n values between 0–1. Equilibrium results were evaluated using five different types of errors functions. Thermodynamic studies suggested feasible, spontaneous and endothermic nature of adsorption process, while, the ∆H parameter < 80 kJ/mol indicated physiosorption and positive ∆S values promoted randomness of ions with increase in adsorption process. Data fitted into type I of pseudo second order kinetics having R2 ≥ 0.98 and rate constants K2 (0–1). Desorption process was also performed for storage, conservation and reuse of sorbent and sorbate materials.
1. Introduction
Biochar (BC) iss a carbon rich solid formed when heating animal manure, leaves, seed or woody biomass in presence of a limited supply or absence of air in a closed container or muffle furnace at low temperature, i.e., 700 °C. Cellulosic biochar contains elements like oxygen (O), hydrogen (H), carbon (C), sulphur (S), and nitrogen (N) in different proportions in addition to ash. It has a charged ion exchange surface; different functional groups such as carboxyl, hydroxyl, phenolic hydroxyl, and carbonyl groups are present on surface, which make the surface porous [1]. Biomass also consists of lignocellulosic material, which contains 50% cellulose, 25% hemicellulose and 25% lignin, which are linked together to secure flexibility and structural strength. In addition, water, minor amounts of inorganic ash and extractives are also part of biomass composition. To produce biochar, different processes combustion, gasification and pyrolysis occur in sequence, below the traditional earthen kiln layers, but pyrolysis and combustion methods are separated physically by a metal barrier in modern biochar retorts [2]. Under limited supply or absence of oxygen conditions, thermal conversion of feedstock is called pyrolysis. Fast, intermediate and slow pyrolysis are the three types of pyrolysis, depending upon certain process parameters such as residence time, temperature, flow rate of sweeping gas and heating rate [3].
Many practical applications of biochar are dependent on its properties. Pyrolysis produces a microporous carbon skeleton due to thermal decomposition, and gives biochar with a high surface area (500–2000 m2g−1), excellent adsorptive properties and low density. Biomass or its biochar may be modified through physical, chemical or biological methods to improve its properties. These methods include modification with steam, metal oxides, complex organic compounds, clays, acids, base, carbonaceous materials, salts and biofilms. These modification methods increase the surface absorption properties of biomass or biochar, increases its surface area, and embed another material on its surface with beneficial surface adsorption properties. Modified biochar can remove different toxic pollutants from aqueous solutions. Nanotechnology generates new materials with exclusive properties and has attracted great attention due to its wide range of applications [4]. Biochar based nanostructures are produced to change the properties of the biochar surface by loading biochar with metal oxides, clay minerals, carbon-based materials, such as graphene or carbon nanotubes, organic compounds or through impregnation of microorganisms. Here the biochar provides high surface area to support the materials being deposited. Nanostructures involve the formation of entirely new functional groups on biochar or feedstock surfaces, thus, distinguished themselves from chemical activation methods [5]. Biochar properties and functionality are influenced by its preparation conditions and methods of modification. Biochar-based nanocomposites are favorable to remove contaminants from wastewater [6].
Toxic heavy metals such as Pb2+, Cu2+, Cd2+, Cr3+ and Zn2+ are of specific concern due to their great toxicity, persistency in Nature and bioaccumulation tendency. The main source of cadmium is cigarette smoke and it is harmful as a drinking water pollutant. The permissible level of cadmium is set at 0.003 mgL−1 [7]. Toxic metals are removed from industrial effluents by using different popular technologies for reduction of their toxicity. Traditional methods including precipitation, reverse osmosis, ion exchange, coagulation, complexation, solvent extraction, froth flotation, deposition, cementation, membrane filtration and activated carbon adsorption are commonly used for the removal of toxic heavy metals from inorganic industrial effluents, but all these methods have some disadvantages such as high sludge production, complex mechanisms, and being expensive in operation [8].
Adsorption is considered as one of the most feasible methods employed for the removal of organic and inorganic pollutants such as cadmium, lead, arsenic, chromium, carbamazepine, furfural, and trichloroethylene. Adsorption is important when immobilization or rapid removal of pollutants at moderate or low concentrations is required. In adsorption, different adsorbents can be used and they are selected on the basis of their availability and applications. In recent years, the focus is to search such sorbents which have low price, high surface area with high adsorption capacity, easy handling, abundance, good resistance, and ease in regeneration [9]. A material with all these characteristics is difficult to find, but materials which possesses most of these properties are used. Low cost is an important parameter among all other factors and depends on local availability of the material used as adsorbent. Normally, low cost adsorbents are characterized as those which are abundant in Nature or obtained as byproducts from different industrial wastes.
Saccharum munja is a grass which is found along river banks and is commonly known as munja. The green plant is distributed from north and North West India to Pakistan. Other common names are kana, moonja and sarkanda. It belongs to the family Gramineae and is a large tufted grass. It is not used much as a fodder plant for cattle and other animals [10], and is used in making ropes, baskets and variety of handicrafts. Other common uses include chemical extraction, paper making and carbon production. The plant has medicinal value, and is used to treat many diseases. The flowers and stem of the plant are found to have nutrients such as potassium, sodium, calcium, iron, chlorides, magnesium, bicarbonates, sulphates and phosphates, which are responsible for its medicinal importance. There is little knowledge through research, to evaluate the effects of Saccharum munja. Its extracts have many benefits and advantages in the fields of nanotechnology, medicine and biology [11].
Use of different iron oxide nanostructures was reported for wastewater treatment. The work focused on advancement in adsorption process by using nano adsorbents [12]. Biochars modified with chitosan were used to produce low cost sorbents for the removal of Pb2+, Cu2+, and Cd2+ions from solutions [13]. Peanut hull biochar was prepared in temperature range of about 450 to 650 °C, and magnetized with FeCl3 for the removal of Cr(VI) from water. Increase in pyrolysis temperature showed more sorption [14]. Activated biochar modified by chemical methods had been used for removal of copper and zinc from aqueous media with high removal efficiency [15].
The aim of the present study was to prepare biochar nanostructured materials by loading the biochar surface of Saccharum munja biomass with hematite characterized by various structures and morphologies. Use of nanomaterial for remediation of cadmium from aqueous media. Also, to determine sorption equilibrium data, order of reaction through kinetic studies and application of sorption isotherm models for linear and non-linear studies. Furthermore, thermodynamic parameters e.g., free energy change, enthalpy change and entropy change to observe nature of sorption process. Aim was to find reusable properties of the biochar sorbent material to support the possibility of its use on commercial scale.
2. Material and Methods
2.1. Collection and Pretreatment of Biomass Feedstock
Biomass feedstock of Saccharum munja was collected from Khushab district (Punjab, Pakistan). This biomass is considered as waste material in Pakistan and has no useful applications in any industry. These properties make this raw material a low cost and easily available material for adsorption. As initial cost of adsorbent is almost negligible and it requires less chemicals and energy in terms of treatment so we can call it a green and sustainable method for metal removal as compared with other costly techniques of metal remediation like, ion exchange, reverse osmosis and precipitation methods [16,17]. The collected biomass was washed thoroughly with deionized water to remove surface dust and impurities. Wet feedstock was left to be air dried in the sun for three days. After that feedstock was dried in electric oven (Geepas, Model No. GO4458, Guangzhou, China) at 80 °C for 24 h, ground to desired mesh size and stored in an air tight bag until used.
2.2. Preparation of Biochar
The powdered biomass obtained from Saccharum munja was placed in lidded crucibles and pyrolyzed to form biochar through slow pyrolysis process in a heated furnace at 450 °C for 1 h in the presence of a limited supply of oxygen. After that the crucibles were left at room temperature and allowed to cool. The biochar produced were labelled as Saccharum munja biochar (SMBC).
2.3. Synthesis of Hematite Nanoparticles and Loading on Biochar
Hematite nanoparticles were synthesized and loaded on the biochar by chemical reaction following steps of suspension, mixing, agitation, precipitation, filtration and heating. Iron chloride (FeCl3) solution was freshly prepared (1.35 g of iron chloride in 500 mL of distilled water). Biochar was suspended in distilled water, mixed with iron chloride solution and stirred continuously for thorough mixing. After that pH was adjusted to 10–11 by slow addition of 0.1 M NaOH solution. The suspension was agitated on orbital shaker for 1 h and kept for 12 h at room temperature, filtered, washed with distilled water and ethanol during filtration and afterwards, dried in oven at 100 °C for 1 day. This nanomaterial loaded biochar was labelled as hematite-loaded Saccharum munja biochar (HLSMBC).
2.4. Characterization of Sorbent
Raw sorbent i.e., SM, biochar i.e., SMBC and nanomaterial loaded biochar i.e., HLSMBC were characterized to examine structural composition, functional groups and surface morphology of solids. The techniques used were scanning electron microscopy (SEM) and Fourier transform infrared spectroscopy (FTIR).
2.5. Batch Adsorption Experiments
Batch equilibrium adsorption test were performed using 250 mL Erlenmeyer conical flasks. Batch mode was selected due to its simplicity and ease of operation. For Cd(II) study 15, 30, 45, 60, 75 and 90 ppm solutions were prepared from stock solution and 100 mL of each was taken in conical flask with the addition of 1 g of raw SM sorbent in each flask. These flasks were agitated on orbital shaker for 60 min at speed of 150 rpm at room temperature. After agitation each flask of metal solution was filtered with Whatman filter paper, to separate SM sorbent residue and filtrate. Filtrate was then analyzed with atomic absorption spectrophotometer for concentration of remaining cadmium ions. In the same way sorption study was performed with its biochar (SMBC) and nanomaterial HLSMBC (hematite loaded on Saccharum munja biochar) for the removal of Cd(II).
2.6. Adsorption for Isothermal Studies
Isothermal models are used commonly to analyze adsorption data, depending on sorbent, sorbate and type of interactions among them. Adsorption process indicates distribution of sorbate specie among liquid solution and solid sorbent [18].
2.7. Error Function Analysis
For analysis of adsorption experimental data linear isotherm equations are most commonly used due to their simplicity. These equations demonstrate adsorption of adsorbate on the surface of adsorbent and give results of adsorption model, but it has been observed that during linear analysis of adsorption isotherms a large change in error function occurs, causing deviation of results, so non-linear analysis becomes unavoidable when using data in isotherm models [19].
2.8. Kinetic Models
Linear and non-linear forms of kinetic models were studied at changing time (min) parameter. Batch adsorption study was carried out to observe adsorption of metals on adsorbents at room temperature, for 100 mL of 100 ppm solution, with change in time 10, 20, 30, 40, 50, 60, and 70 min. The solutions were agitated on orbital shaker at 150 rpm speed and then filtered with Whatman filter paper and filtrate was examined by atomic absorption spectrophotometry. The adsorption data was then utilized to check its fit to pseudo first order and pseudo second order kinetic models.
2.9. Thermodynamic Studies
Adsorption thermodynamics was studied at different temperatures 20 (293 K), 30 (303 K), 40 (313 K) and 50 °C (328 K) for the adsorption of the three metals cadmium, lead and chromium onto SM, SMBC, and HLSMBC, through batch adsorption experiments. For this purpose 30–120 ppm adsorbate solutions were used with 1 g of adsorbent, at increasing temperature range. At the end of experiment the solutions were filtered to separate adsorbents from solutions. The adsorption values were obtained and these were applied on thermodynamic plots to find out Gibbs free energy change ∆G, enthalpy change ∆H and entropy change ∆S. These parameters describe nature of adsorption process, and adsorbate-adsorbent interactions.
2.10. Desorption Study
For desorption experiments nitric acid (0.5 M) was used and sorption was performed by using 60 ppm metal solution, with 1 g of adsorbent, 150 rpm agitation speed and filtered. Then adsorbent was washed with deionized water again and again and then treated with HNO3 that adsorbent was again used for adsorption of 60 ppm metal solution. The experiment was repeated five times in the same way for desorption of metal and reuse of adsorbent and metal solution. Percentage desorption of metal ion was than calculated by following equation:
% desorption = amount of metal desorbed/amount of metal adsorbed × 100
3. Results and Discussion
3.1. Formation of Biochar and Hematite Loaded Biochar
Raw Saccharum munja was pyrolysed to biochar and that biochar was used to check its removal efficiency for Cd(II) by following the steps of batch sorption experiments. Further, adsorption experiments were performed with nanomaterial prepared by loading hematite on biochar surface. For this purpose, hematite was loaded on Saccharum munja biochar. The nanostructure was used for uptake of Cd(II) metal from aqueous solutions.
3.2. Characterization of Sorbents
For identification of surface functional groups, their location and surface structural properties like pore size, shape and roughness; characterization of biosorbents is an important factor.
3.2.1. SEM Analysis
SEM is used to characterize the nanomaterial and different biosorbents types to determine surface pores, size and shape of nanomaterials. The surface of the sample is scanned at high resolution to provide image with defined sites as shown in Figure 1. Nanomaterials are identified and characterized in terms of the physical properties studied by SEM. These properties include size of these particles and their shape. Furthermore the size distribution and morphology also help to identify nanomaterials. SEM results reveals coating of agrowaste with nanoparticle as obtained in high resolution image of HLSMBC [20]. SEM analysis was performed on all forms of sorbents i.e., raw, biochar and hematite-loaded biochar. Surface morphology and characteristics were studied in this analysis. The SEM micrograph demonstrated pore structure, rough and irregular surface and wide pore area for metal interaction and sorption. The pores in the biochar and hematite-loaded biochar images appear as a channel or tubules having honeycomb-like sites for metal-surface interactions, showing the real characteristics of the biomass material. As a result of these well-defined holes uptake of metals and adsorption on the surface occurs.
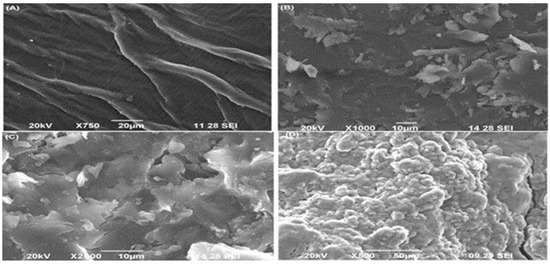
Figure 1.
SEM image of different forms of adsorbent: (A) is image of raw Saccharum munja (SM), (B,D) image of hematite loaded Saccharum munja biochar (HLSMBC), and (C) is image of Saccharum munja biochar (SMBC).
3.2.2. FTIR Analysis
The structural features and surface functional groups of nanomaterials were observed through FTIR analysis and compared with raw sorbents and their biochar. In FTIR spectra, percent transmittance and wavenumber are compared to exhibit location of groups. FTIR spectra are an important tool for the functional group analysis of raw, treated and nanoparticles loaded adsorbent material. FTIR spectra of these adsorbent after adsorption of metal ions was also taken to confirm the removal of metal ions from aqueous media and to study functional groups responsible for the attachment of these metal ions. FTIR spectra revealed a viable change of spectra while comparing raw sorbents and their biochar and hematite nanomaterial forms as shown in Figure 2.
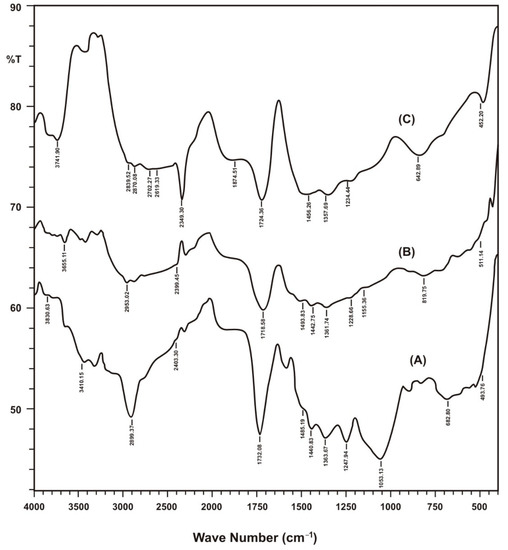
Figure 2.
FTIR spectra of different forms of Saccharum munja biocher. A (SM), B (SMBC), C (HLSMBC).
Results of FTIR spectra with wavenumber value are summarized in Table 1. In raw munja spectra in the range of 3074.53–3410.15 cm−1 –OH stretching vibrations were observed, and in spectra of SMBC –OH stretching peaks coincides to give two broad bands at 3282.84 and 3425.58 cm−1, showing prominent –OH functional groups in munja biochar due to pyrolysis effects. The peaks observed at 1363.67–1440.83 cm−1 for raw munja and its biochar 1357.89–1456.26 cm−1 represent nitro group (O–N=O) stretching vibrations, which also confirms the presence of nitrogen in the biochar structure. In the case of hematite-loaded munja biochar –OH peaks were also visible in the 3273.20–3464.15 cm−1 peak range. In comparing other peaks of HLSMBC, the nitro peak was observed at 1361.74 cm−1, showing a prominent stretching vibration. Cadmium-adsorbed munja biochar and clearly shows reduction in peak heights after the removal of cadmium. Nitro peaks are observed at 1365.60 cm−1, 1355.96–1442.75 cm−1 and 1367.53–1444.68 cm−1.The peaks in the range of 3275.13–3495.01 cm−1 are weak and reveal occupied –OH groups. Very small three peaks were observed at 3302.13–3423.65 cm−1 for lead removal. The reduction in peak height and number of peaks clearly indicated adsorption of metal on biochar surface and occupation of surface functional groups. A curve near to a horizontal line was observed for chromium removal in the range of 3288.63–3487.30 cm−1 for –OH groups, showing good chromium adsorption and utilization of almost all functional groups on the biochar surface. The munja biochar peak at 1724.36 cm−1 shows the presence of carboxyl groups or aldehyde or keto groups. Peaks at 1728.22, 1718.58 and 1724.36 cm−1 for carboxylic group stretch, or the presence of aldehyde or keto groups which participate in metal adsorption on negatively charged sites and show a slight shift of vibration frequency for cadmium and lead adsorption as compared to the IR of munja. To study the aromaticity in Saccharum munja the peaks at 1485.19–1581.63 cm−1 confirms the presence of aromatic groups in raw munja and for its biochar an aromatic peak appears at 1456.26 cm−1. In the three spectra peaks showing aromaticity occurs at 1452.40–1502.55 cm−1, 1477.47 cm−1, 1467.83 cm−1. Peaks shifts and reduction in size also show the involvement of aromatic groups in metal adsorption on the biochar surface. Peaks for the C–N vibrations of amines appear in the range of 1020–1250 cm−1 and occur in all forms of IR spectra at different positions. Peaks in the range of 590–720 cm−1 indicate alcoholic groups with –OH bending vibrations. C–Cl stretching is observed in the 600–800 cm−1 range. C=O bonds are strong and peaks appear between 1650–1850 cm−1.

Table 1.
FTIR spectral peaks obtained for Saccharum munja in different forms before and after metal adsorption [21].
3.3. Adsorption Studies
Adsorption studies were performed by the batch adsorption method for the uptake of cadmium by the three forms of adsorbent. The experimental data was than evaluated further to check adsorption process for metal removal from aqueous media. The results for Cd(II) metal uptake at different metal concentrations are shown in Figure 3. The amount of metal adsorbed per unit mass of adsorbent increased with the increase in initial metal concentration at equilibrium. The maximum adsorption at high concentration was due to the presence of negative charges on the surface of adsorbent, but in the case of raw SM the sorption is decreased at higher concentrations, showing random metal removal efficiency. This may be due to the fact that raw SM possesses more water contents, which inhibits metal uptake at higher concentrations. The surface area is reduced when a volatile molecule (water) is present on sorbent surface. While SMBC and HLSMBC are pyrolysed forms in which moisture contents are reduced due to heating conditions. As all volatile matter is evaporated and surface area is increased with an increase in pore size which increases adsorption [22]. Adsorption of Cd(II) from aqueous media was performed using these waste materials as adsorbent. This process reduces the cost of the method as well as helps conserve the energy utilized by other water treatment techniques like reverse osmosis, ion exchange and chemical precipitation. All these treatment methods need high cost in term of chemicals and electrical energy also utilized to run the process [23]. The current method is cost effective and green in terms of less chemical use and no use of electric supply for the process.
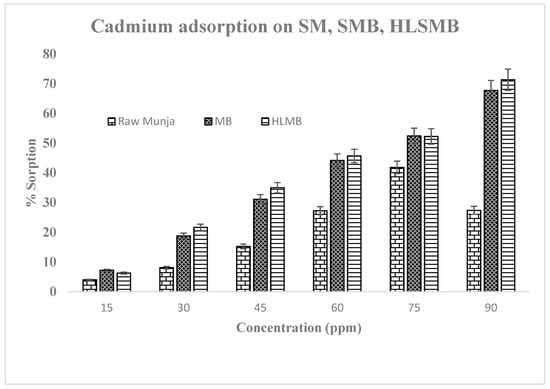
Figure 3.
Adsorption at different concentrations by three forms of adsorbent (raw SM, SMB & HLSMB).
3.4. Modeling of Adsorption Isotherms
The isotherms in our study are linear and non-linear forms of Freundlich, Langmuir, Dubinin, Elovich and Temkin. Maximum adsorption capacity values obtained from adsorption isotherms give information about sorbents’ removal efficiency.
3.4.1. Freundlich Isotherm
The Freundlich isotherm assumes that distribution of heat of adsorption is non-uniform on heterogeneous surfaces. Kf describes adsorbents adsorption capacity in mg/g and n is adsorption intensity which represents energy of adsorption of heterogeneous surfaces, depending on environmental factors [24]. Adsorption data was applied on linear and non-linear forms to obtain results of maximum adsorption and presence of adsorption active sites on sorbents surfaces. Figure 4 shows plot of Freundlich adsorption isotherm for removal of Cd(II) by employing different adsorbents. When adsorption experimental data was applied on Freundlich isotherm for removal of Cd(II), by all forms of sorbents (SM, SMBC, and HLSMBC) than values of R2 obtained are shown in Table 2. High values of R2 near 1 correspond to more sorption of metals in case of all forms of sorbents. All sorbents showed that a Freundlich isotherm is followed in the removal of cadmium. Values of the Freundlich constants Kf and n obtained from slope and intercept are also given in Table 2. A Freundlich constant Kf in adsorption system is used as indicator to check adsorption feasibility. If results of Kf are found in range of 1–20 then adsorption is called feasible. In this study for SM and HLSMBC we found Kf in desired range, so these systems favour adsorption phenomenon more than SMBC adsorbent. Similarly the n value in the Freundlich adsorption isotherm represents adsorption intensity and its value higher than 1 is an indicator of the fitness of adsoption model. It is found in the required range (greater than 1) for SM and HLSMBC. High values of these constants show high adsorption of metals on the adsorbent surface. Experimental data obtained for adsorption of cadmium on all adsorbents was used in the Freundlich isotherm and the plots indicated a maximum R2 value = 0.9879 for HLSMBC.
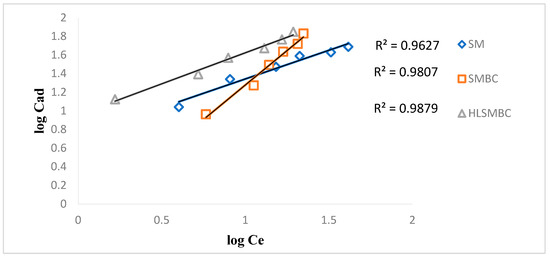
Figure 4.
Freundlich isotherm for removal of cadmium by: (a) SM, (b) SMBC and (c) HLSMBC.
Table 2.
Parameters of the Freundlich isotherm for adsorption of metal ions onto SM, SMBC and HLSMBC.
3.4.2. Langmuir Isotherm
The Langmuir model facilitates monolayer sorption of sorbates on the sorbent surface. This model explains the presence of a homogenous surface and certain forces among surface particles for the attraction of adsorbate atoms or molecules [25]. The Langmuir constant Q0 is the maximum monolayer adsorption capacity it gives the metal uptake per unit mass of the adsorbent (mg/g) and b is the adsorption intensity which is related to the adsorption capacity by depending upon surface area of adsorbent and its pore size and volume. This promotes that adsorption increases with an increase in pore size and surface area of adsorbents. A high value of Q0 is evidence of the good adsorption capacity shown by HLSMBC. R2 value of correlation coefficient obtained from isotherm is listed in Table 3. For most of the results the value of R2 favors adsorption but in comparison with the Freundlich isotherm the R2 value of the Freundlich isotherm supports heterogeneous adsorption better than the monolayer adsorption of the Langmuir isotherm. The Langmuir constant Q0 values are related with the Freundlich constant values of Kf, indicating an increase in the value of Q0 with an increase in adsorption. For removal of cadmium a maximum R2 value of 0.9627 was achieved for the adsorption of raw SM but the other sorbents also showed favorable sorption as shown in Figure 5. SM, SMBC and HLSMBC followed a Langmuir isotherm as indicated by their value of correlation constant and Q0 and b constants.
Table 3.
Parameters of the Langmuir isotherm for adsorption of metal ions onto: SM, SMBC and HLSMBC.
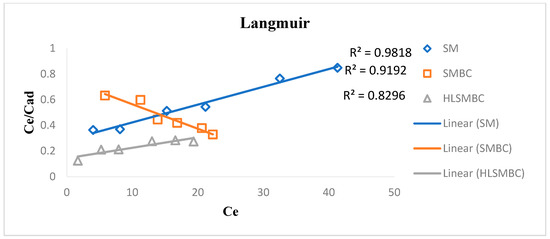
Figure 5.
Langmuir isotherm for removal of cadmium by: (a) SM, (b) SMBC and (c) HLSMBC.
3.4.3. Elovich Isotherm
The Elovich model was first used to study the adsorption of gases on solid surfaces but now it is also applied for solutions and solids. This model supports multilayer adsorption of adsorbate on adsorbent surface as shown in Figure 6. For our cadmium study a linear Elovich form was used to obtain a better fit of the experimental data. The R2 values range from 0.3116–0.9385 and the values of constants Qm and Ke are given in Table 4. The maximum adsorption capacity value is 103.09 for HLSMBC showing the maximum adsorption and Ke, i.e., the adsorption constant values are very low, predicting that Elovich model is not very suitable to explain the adsorption mechanism.
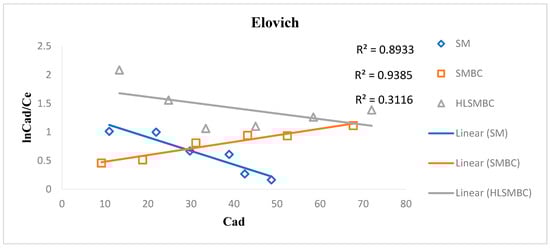
Figure 6.
Elovich isotherm plot for removal of cadmium by: (a) SM, (b) SMBC and (c) HLSMBC.
Table 4.
Parameters of Elovich isotherm for adsorption of metal ions onto SM, SMBC and HLSMBC.
3.4.4. Dubinin–Radushkevich Isotherm
The Dubinin–Radushkevich isotherm was applied to the adsorption experimental data to observe the best model fit as given in Figure 7. This isotherm involves filling of pores through adsorption processes on heterogeneous surfaces, depending on temperature changes. The model mechanism involves physical adsorption through forces acting on multilayer adsorbent surfaces. For the removal of metal ions it also involves physical and chemical adsorption. This model was applied to study Cd(II), removal from aqueous media by the use of the different adsorbents. R2 values for Cd(II) adsorption obtained from the plot ranges from 0.7062–0.929, indicating highest value of R2 for adsorption on SM. The R2 value less than 1 shows better fit to the model, so a value greater than 0.8 shows the best result and less than 0.5 shows a weaker fit to the model. The Dubinin–Radushkevich constant Kads has negative values, which causes less favorable adsorption condition for the linear form of the Dubinin isotherm on multilayer heterogeneous surfaces. Values of qs were calculated to evaluate the adsorption capacity in the range of 37.75–266.08 and followed the order: SMBC > HLSMBC > SM. These values indicate favorable adsorption of all adsorbents for cadmium removal. Results of Dubinin–Radushkevich isotherm are elaborated in Table 5.
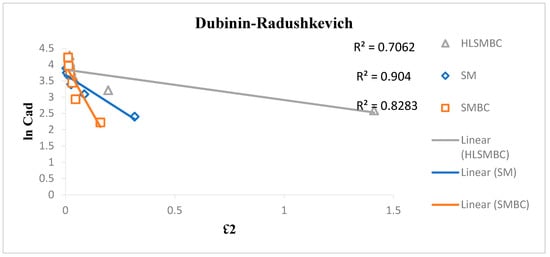
Figure 7.
Dubinin–Radushkevich Isotherm plot for removal of cadmium by: (a) SM, (b) SMBC, (c) HLSMBC.
Table 5.
Parameters of the Dubinin–Radushkevich isotherm for adsorption of metal ions onto SM, SMBC and HLSMBC.
3.4.5. Temkin Isotherm
The Temkin isotherm considers that the adsorption heat of ions and molecules increases with an increase in surface coverage. It also assumes that the adsorption heat is linear as indicated from its plot. The Langmuir constants kt and B are calculated from the slope and intercept of the linear plot between the adsorbed concentration and the equilibrium concentration [26]. Linear and non-linear forms of the Temkin isotherm are given in the equation. R2 = 0.7551 < 0.8647 < 0.989 for HLSMBC < SMBC < SM, indicating better fit for SM with a high value near 1, so the best fit is for SM for the Temkin isotherm as represented in Figure 8. The Temkin constants are shown in Table 6, where Kt is a measure of adsorption rate and a constant representing extent of adsorption. Kt values are 0.18 < 0.48 < 0.86 for SMBC < SM < HLSMBC i.e., between 0–1, indicating a favorable adsorption. B values are a low descriptor of adsorption and are in the range 40.90 > 20.33 > 15.87 for SMBC > HLSMBC > SM. For the non-linear form of the Temkin isotherm constant values are also given in Table 6 and are in the range Kt = 0.76 < 0.995 < 0.998 for HLSMBC < SMBC < SM. The adsorption capacity has small values for the non-linear form as compared to the linear form, and weak descriptors of adsorption i.e., B = 21.44 < 23.54 < 26.43 for SMBC < SM < HLSMBC.
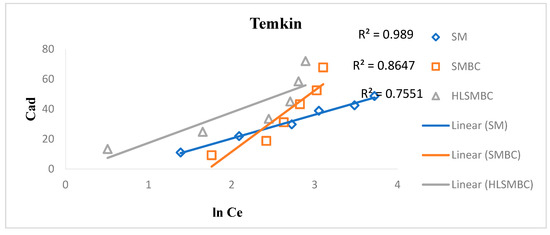
Figure 8.
Temkin Isotherm plot for removal of cadmium by: (a) SM, (b) SMBC, (c) HLSMBC.
Table 6.
Parameters of the Dubinin–Radushkevich isotherm for adsorption of metal ions onto SM, SMBC and HLSMBC.
3.5. Comparison Among Isotherms
For the adsorption of cadmium onto different sorbents, the experimental results were applied on different isotherms and a comparison among correlation coefficients given as follows:
- SM, R2 = Temkin > Langmuir > Dubinin–Radushkevich > Freundlich > Elovich
- SMBC, R2 = Freundlich > Elovich > Langmuir > Temkin > Dubinin–Radushkevich
- HLSMBC, R2 = Freundlich > Langmuir > Temkin > Dubinin–Radushkevich > Elovich
3.6. Error Function Analysis
Linear and non-linear isotherm analysis also gives data of the error functions. Linear error analysis has gained much more importance than non-linear error analysis, owing to the direct comparison from adsorption data for the adsorption of metals on adsorbents. Non-linear error function data is calculated from the model equations and can be minimized among experimental and predicted values as compared to linear error functions. It is mainly related to computer software applications and algorithms. For cadmium modeling error functions were calculated for the linear and non-linear form of adsorbents. Isotherm data was used to calculate errors using Excel spreadheets. For this purpose five error functions were calculated including residual sum of square error (RSS), the sum of absolute error (EABS), chi-square error (Chi-Sq.), average percentage error (APE) and average relative error (ARE).
3.6.1. Error Analysis for SM
For SM adsorbent error values were compared for the linear and non-linear forms of the isotherms, indicating the lowest RSS for Langmuir isotherm and EABS, APE and ARE for Elovich isotherm, chi square was smallest for the Temkin isotherm in the case of the linear approach. For the non-linear form the Freundlich isotherm revealed the highest chi square and APE value and the Langmuir isotherm showed the lowest APE and RSS values, which supports the model data. Error analysis for adsorption of Cd(II) is summarized in Table 7 for all forms of isotherms.
Table 7.
Isotherm error analysis data for adsorption of Cd(II) onto SM.
3.6.2. Error Analysis for SMBC
A comparison of error function data of the different isotherms for the linear and non-linear approaches as given in Table 8, suggests high error values for the linear form of the Elovich isotherm which does not support model validation. Lowest values of EABS, RSS, APE and ARE for seen for the Langmuir, Freundlich, Dubinin–Radushkevich and Temkin isotherms, making them suitable for fitting the adsorption data. For non-linear error functions the lowest values of errors were given by the Temkin and Elovich models, suggesting that non-linear forms are suitable and supporting the model validation for Cd(II) adsorption onto SMBC.
Table 8.
Isotherm error analysis data for adsorption of Cd(II) onto SMBC.
3.6.3. Error Analysis for HLSMBC
In Table 9 error analysis data for adsorption of cadmium by HLSMBC is given. Linear and non-linear error data was analyzed with lowest RSS error data being obtained for the Langmuir model, while the lowest EABS and APE are seen for the Dubinin–Radushkevich and chi square for the Temkin isotherm. This makes all models suitable for our adsorption study in the case of a linear approach of errors. For non-linear forms the Langmuir and Freundlich models showed high errors indicating less favor towards sorption.
Table 9.
Isotherm error analysis data for adsorption of Cd(II) onto HLSMBC.
3.7. Kinetic Models
Pseudo-first order and pseudo-second order models are applied to investigate the reaction rates of metal uptake with time. The plots were developed to observe the sorption kinetics and the kinetic parameters were obtained from slope and intercept of plot, which are given in the tables below.
3.7.1. Kinetic Models for Cd(II) Adsorption onto Raw SM
Kinetic experiments were performed by studying the adsorption of cadmium over the range of 10–70 min for each solution of 100 ppm (Table 10). Sorption of cadmium on raw SM was sharp during the initial time interval but later slowed down with the increase in time due to the presence of occupied sites followed by desorption. The value of the correlation coefficient was small (0.3455) and the value of K1, i.e., the sorption kinetic rate was obtained from the slope of the graph as 0.0085. Four linear forms of the pseudo-second order model were applied to study the adsorption kinetics. Correlation coefficients are given in Table 8 and the values of the rate constants K2, R2 values ranged over 0.6357–0.9719, with the highest value seen for type I pseudo-second order and the equilibrium rate constants K2 had a range of 0.0032–0.0093. Equilibrium adsorption values were calculated to be in the range of 17.04–20.93, with the highest value for a type III pseudo-second order reaction. These models explain the rate of sorption of divalent cadmium ions based on the concentration of SM sorbent in solution and the concentration of metal sorbate on sorbent surface and in solution [27].
Table 10.
Pseudo-first order and pseudo-second order kinetics for removal of Cd(II) by SM.
3.7.2. Kinetic Models for Cd(II) Adsorption onto SMBC
The experimental data revealed an increase in adsorption with the increase in contact time, indicating the availability of more sites on the SMBC surface as compared to raw SM as appeared in Table 11. The R2 value for a pseudo-first order plot was 0.9927, higher than that for the pseudo- second order models, i.e., 0.8381–0.9925. A little difference was found between the correlation coefficients of PFO and PSO type I models, which suggests that both models favor adsorption sites for cadmium uptake on the adsorbent surface. The rate constant K1 is 0.0113 and K2 is 0.0042 < 0.0056 < 0.0069 < 0.0075 for type I < III < IV < II PSO kinetics. Qe has a maximum value of 20.08 for type I of PSO adsorption kinetics, suggesting that the adsorption of cadmium onto SMBC strongly follow a type I PSO model and also follows a linear form of the PFO model.
Table 11.
Pseudo-first order and pseudo-second order kinetics for the removal of Cd(II) by SMBC sorbent.
3.7.3. Kinetic Models for Cd(II) Adsorption onto HLSMBC
The experimental results were plotted for the PFO and PSO models to check the best fit model for high metal uptake and favorable adsorption. In Table 12, R2 with a value 0.983 indicated support for PFO kinetics but this value is lower than the R2 (0.9933) of a type I PSO model, which suggests the PSO model supports uptake of cadmium onto HLSMBC more than a PFO model, but both models favor adsorption of cadmium onto nanomaterial.
Table 12.
Pseudo-first order and pseudo-second order kinetics for the removal of Cd(II) by HLSMBC sorbent.
3.8. Thermodynamic Investigations
The adsorption of cadmium onto SM, SMBC, and HLSMBC increased with an increase in temperature owing to an increase in pore size and availability of surface active functional groups on the sorbent surface. Thermodynamic parameters data is shown in Table 13. The value of ∆G was found negative and decreases with an increase in temperature, which supports spontaneous and favorable adsorption. In the case of raw SM, the difference in energy values is smaller, while in the case of SMBC and HLSMBC, the energy difference is greater. This shows more favorable and spontaneous adsorption as compared to raw SM. ∆G values range from −294.242 to −327.842, −639.032 to −711.132 and −711.01 to −791.51 for SM, SMBC and HLSMBC, respectively, in the temperature range of 293–328 K. The magnitude of free energy values is found to be high for HLSMBC as compared to the other two sorbents. Enthalpy change ∆H values are positive and 37.11 > 35.45 > 12.96 for HLSMBC > SMBC > SM, indicating an endothermic adsorption process [28]. These values are less than 80 kJ/mol, so the heat of adsorption indicates the physical nature of the adsorption process [29]. ∆S values are also positive in the cases of the three sorbents; 2.30 > 2.06 > 0.965 for HLSMBC > SMBC > SM, respectively. Positive values assume more interactions between the adsorbent and metal ions with an increase in metal uptake.
Table 13.
Thermodynamic study for adsorption of Cd(II) on SM, SMBC and HLSMBC.
3.9. Desorption Study of Metals from the Adsorbent Surface
Desorption studies recovers used adsorbent and makes it eligible for reuse and also recovers sorbates from the adsorbent surface. The desorption experiments after repeating for five cycles revealed that the previously adsorbed metal was recovered before the next cycle [30]. For Cd(II), metal desorption experiments for SM, SMBC, and HLSMBC reveal that 90%, 92.5%, and 93%, and the metal was recovered after the first experimental wash. The percent sorption of metal after the 2nd, 3rd, 4th and 5th washes is given in Table 14.
Table 14.
Determination of the percent desorption of Cd(II) from the aqueous filtrate.
The amount of Cd(II) left after desorption is given in Table 15. As indicated in the HLSMBC had small amount of Cd(II) left in solution after desorption in every wash as compared with other sorbents. This small amount of metal left after every wash makes the adsorbent suitable for reuse in the next process of adsorption.
Table 15.
Amount of Cd(II) left (ppm) after the desorption process.
3.10. A Comparison of Different Methods Used for Cadmium (II) Removal
The cadmium removal efficiency of the current research work was compared with reported data to evaluate its importance and cost factor (Figure 9). A comparison among these methods indicated 90% removal of cadmium by adsorption, whereas, 85% (solvent extraction), 72% (ion-exchange method), 70% (precipitation) and 65% (membrane separation technique) was obtained with these other methods [31,32,33]. These results evaluated adsorption as an efficient method for the uptake of cadmium from aqueous media.
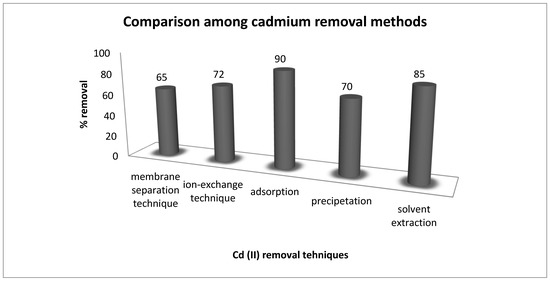
Figure 9.
Comparison of different techniques for removal of cadmium from aqueous media.
A comparison of these methods based on chemicals used, cost and efficiency is also made and given in Table 16.
Table 16.
Comparison among adsorption and other methods for removal of cadmium [34].
Adsorption is environmentally friendly, feasible and simple in technical operation. It has low cost, is easily available, easy to operate, uses wastes as adsorbents and allows the detection of metals at low levels.
3.11. Removal of Cd(II) with Other Biosorbents
In order to compare the adsorption efficiency of Saccharum munja with other biosorbents we carried out experiments with four sorbents (rice husk, China berry leaves, Saccharum munja and Polyalthia longiforia leaves) for the removal of cadmium (II) from aqueous solutions. Screening experiments were performed with a 60 ppm solution of cadmium(II) placed in a 250 mL conical flask, shaken at 150 rpm for 1 h the results obtained for cadmium sorption by all these four sorbents are shown in Figure 10.
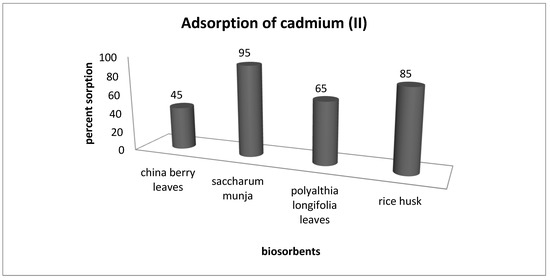
Figure 10.
Comparison of adsorption potential of different adsorbents.
The experimental studies reveal that the adsorption potential of the selected SM adsorbent was found to be the highest, with 95% cadmium (ii) removal as compared with other adsorbents.
4. Conclusions
These studies show the adsorption of cadmium onto SM, SMBC, and HLSMBC adsorbent was an efficient process. Among different sorbent materials, hematite-loaded nanomaterial showed better results than all other sorbents for the removal of Cd. SEM results of these sorbents indicated tubular cylinders with a large pore size for HLSMBC. Also FTIR analysis before and after sorption revealed that carboxyl, aldehyde/ketone and C–H are the major functional groups which cause metal binding to the adsorbent surface. Equilibrium adsorption experiments were investigated for 1 g adsorbent at varying concentrations, time and temperature at an agitation speed of 150 rpm. For initial metal ion concentration, the adsorption increased at high concentration which had a significant effect on the adsorption and the maximum adsorption was attained for HLSMBC. The experimental results were tested further by applying five isotherms, i.e., Langmuir, Freundlich, Dubinin–Radushkevich, Elovich and Temkin. These isotherms indicated favorable results for all the sorbents and metals, of which the best results were demonstrated by the Freundlich isotherm with high values of correlation constant, sorption intensity b and sorption capacity Kf for all the sorbents. For Cd(II) modeling, the highest value of correlation coefficient (R2) was 0.9891 for RHBC. Linear and non-linear error function analysis of the isotherms further validated the adsorption studies by comparing error data and finding the minimum errors for metal adsorption by the adsorbents. The adsorption data supported both pseudo-first order and pseudo-second order kinetics, but the best results were given by a pseudo-second order model for Cd adsorption by all the adsorbents. Thermodynamic investigations revealed spontaneous, endothermic and feasible sorption for metal uptake. Desorption experiments were performed to recover the metal and desorb the adsorbents for their reuse on a commercial and industrial level. Adsorption studies found HLSMBC to be the best adsorbent for the removal of cadmium from aqueous media.
Author Contributions
Conceptualization, S.I.; methodology, S.I.; formal analysis, F.B.; investigation, T.I. and F.B.; resources, M.M.H.I.; writing—original draft preparation, T.I. and F.B.; writing—review and editing, D.T.; visualization, D.T.; supervision, S.I. and F.B. All authors have read and agreed to the published version of the manuscript.
Funding
This work received no external funding.
Institutional Review Board Statement
Not applicable.
Informed Consent Statement
Not applicable.
Data Availability Statement
No new data were created or analyzed in this study. Data sharing is not applicable to this article.
Conflicts of Interest
The authors declare no conflict of interest.
References
- Nartey, O.D.; Zhao, B. Biochar Preparation, Characterization, and Adsorptive Capacity and Its Effect on Bioavailability of Contaminants: An Overview. Adv. Mater. Sci. Eng. 2014, 2014, 1–12. [Google Scholar] [CrossRef]
- Asensio, V.; Vega, F.A.; Andrade, M.L.; Covelo, E.F. Tree vegetation and waste amendments to improve the physical condition of copper mine soils. Chemosphere 2013, 90, 603–610. [Google Scholar] [CrossRef] [PubMed]
- Narzari, R.; Bordoloi, N.; Chutia, R.S.; Borkotoki, B.; Gogoi, N.; Bora, A.; Kataki, R. Biochar: An Overview on its production, properties and potential benefits. Biol. Biotechnol. Sustain. Dev. 2015, 1, 13–40. [Google Scholar]
- Chen, Y.; Fu, K.; Zhu, S.; Luo, W.; Wang, Y.; Li, Y.; Hitz, E.; Yao, Y.; Dai, J.; Wan, J.; et al. Reduced Graphene Oxide Films with Ultrahigh Conductivity as Li-Ion Battery Current Collectors. Nano Lett. 2016, 16, 3616–3623. [Google Scholar] [CrossRef]
- Rosales, E.; Meijide, J.; Pazos, M.; Sanromán, M.A. Challenges and recent advances in biochar as low-cost biosorbent: From batch assays to continuous-flow systems. Bioresour. Technol. 2017, 246, 176–192. [Google Scholar] [CrossRef]
- Ahmed, M.B.; Zhou, J.L.; Ngo, H.H.; Guo, W.; Chen, M. Progress in the preparation and application of modified biochar for improved contaminant removal from water and wastewater. Bioresour. Technol. 2016, 214, 836–851. [Google Scholar] [CrossRef] [PubMed]
- World Health Organization. Cadmium in Drinking-Water; World Health Organization: Geneva, Switzerland, 2012. [Google Scholar]
- Idrees, M.; Batool, S. Enhanced aqueous arsenic absorbing substituted spinel nickel ferrite (NiFe2O4) nano-particles. Adv. Recycl. Waste Manag. 2017, 2, 1–7. [Google Scholar] [CrossRef]
- Crini, G. Non-conventional low-cost adsorbents for dye removal: A review. Bioresour. Technol. 2006, 97, 1061–1085. [Google Scholar] [CrossRef]
- Roopan, S.M.; Rohit; Madhumitha, G.; Rahuman, A.A.; Kamaraj, C.; Bharathi, A.; Surendra, T. Low-cost and eco-friendly phyto-synthesis of silver nanoparticles using Cocos nucifera coir extract and its larvicidal activity. Ind. Crop. Prod. 2013, 43, 631–635. [Google Scholar] [CrossRef]
- Goswami, N.; Chatterjee, S. Assessment of Free Radical Scavenging Potential and Oxidative DNA Damage Preventive Activity ofTrachyspermum ammiL. (Carom) andFoeniculum vulgareMill. (Fennel) Seed Extracts. BioMed Res. Int. 2014, 2014, 1–8. [Google Scholar] [CrossRef]
- Nassar, N.N. Iron oxide nanoadsorbents for removal of various pollutants from wastewater: An overview. In Application of Adsorbents for Water Pollution Control; Bhatnagar, A., Ed.; Bentham Science Publishers: Sharjah, UAE, 2012; pp. 81–118. [Google Scholar]
- Zhou, Y.; Gao, B.; Zimmerman, A.R.; Fang, J.; Sun, Y.; Cao, X. Sorption of heavy metals on chitosan-modified biochars and its biological effects. Chem. Eng. J. 2013, 231, 512–518. [Google Scholar] [CrossRef]
- Han, Y.; Cao, X.; Ouyang, X.; Sohi, S.P.; Chen, J. Adsorption kinetics of magnetic biochar derived from peanut hull on removal of Cr (VI) from aqueous solution: Effects of production conditions and particle size. Chemosphere 2016, 145, 336–341. [Google Scholar] [CrossRef]
- Dao, M.T.; Nguyen, T.T.T.; Du Nguyen, X.; La, D.D.; Nguyen, D.D.; Chang, S.W.; Chung, W.J.; Nguyen, V.K. Toxic Metal Adsorption from Aqueous Solution by Activated Biochars Produced from Macadamia Nutshell Waste. Sustainability 2020, 12, 7909. [Google Scholar] [CrossRef]
- Iftekhar, S.; Ramasamy, D.L.; Srivastava, V.; Asif, M.B.; Sillanpää, M. Understanding the factors affecting the adsorption of Lanthanum using different adsorbents: A critical review. Chemosphere 2018, 204, 413–430. [Google Scholar] [CrossRef]
- Birungi, Z.S.; Chirwa, E.M.N. The kinetics of uptake and recovery of lanthanum using freshwater algae as biosorbents: Comparative analysis. Bioresour. Technol. 2014, 160, 43–51. [Google Scholar] [CrossRef]
- Popoola, L.T. Characterization and adsorptive behaviour of snail shell-rice husk (SS-RH) calcined particles (CPs) towards cationic dye. Heliyon 2019, 5, e01153. [Google Scholar] [CrossRef]
- Kumar, K.V. Comparative analysis of linear and non-linear method of estimating the sorption isotherm parameters for malachite green onto activated carbon. J. Hazard. Mater. 2006, 136, 197–202. [Google Scholar] [CrossRef]
- Silva, V.A.; Andrade, P.L.; Silva, M.P.; Valladares, L.D.; Aguiar, J.A. Synthesis and characterization of Fe3O4 nanoparticles coated with fucan polysaccharides. J. Magn. Magn. Mater. 2013, 343, 138–143. [Google Scholar] [CrossRef]
- Mozgawa, W.; Król, M.; Bajda, T. IR spectra in the studies of anion sorption on natural sorbents. J. Mol. Struct. 2011, 993, 109–114. [Google Scholar] [CrossRef]
- Wafiq, A.; Reichel, D.; Hanafy, M. Pressure influence on pyrolysis product properties of raw and torrefied Miscanthus: Role of particle structure. Fuel 2016, 179, 156–167. [Google Scholar] [CrossRef]
- Fu, F.; Wang, Q. Removal of heavy metal ions from wastewaters: A review. J. Environ. Manag. 2011, 92, 407–418. [Google Scholar] [CrossRef]
- Shukla, S.P.; Kisku, G.C. Linear and non-linear kinetic modeling for adsorption of disperse dye in batch process. Res. J. Environ. Toxicol. 2015, 9, 320–331. [Google Scholar] [CrossRef]
- Chen, X.; Zhang, R.; Zhao, B.; Fan, G.; Li, H.; Xu, X.; Zhang, M. Preparation of Porous Biochars by the Co-Pyrolysis of Municipal Sewage Sludge and Hazelnut Shells and the Mechanism of the Nano-Zinc Oxide Composite and Cu(II) Adsorption Kinetics. Sustainability 2020, 12, 8668. [Google Scholar] [CrossRef]
- Ramachandran, P.; Vairamuthu, R.; Ponnusamy, S. Adsorption isotherms, kinetics, thermodynamics and desorption studies of reactive Orange 16 on activated carbon derived from Ananas comosus (L.) carbon. J. Eng. Appl. Sci. 2011, 6, 15–26. [Google Scholar]
- Vijayakumar, G.; Tamilarasan, R.; Dharmendirakumar, M. Adsorption, Kinetic, Equilibrium and Thermodynamic studies on the removal of basic dye Rhodamine-B from aqueous solution by the use of natural adsorbent perlite. J. Mater. Environ. Sci. 2012, 3, 157–570. [Google Scholar]
- Zhan, X.; Xiao, L.; Liang, B. Removal of Pb(II) from Acid Mine Drainage with Bentonite-Steel Slag Composite Particles. Sustainability 2019, 11, 4476. [Google Scholar] [CrossRef]
- Gupta, V.K. Equilibrium Uptake, Sorption Dynamics, Process Development, and Column Operations for the Removal of Copper and Nickel from Aqueous Solution and Wastewater Using Activated Slag, a Low-Cost Adsorbent. Ind. Eng. Chem. Res. 1998, 37, 192–202. [Google Scholar] [CrossRef]
- Lunge, S.; Singh, S.; Sinha, A. Magnetic iron oxide (Fe3O4) nanoparticles from tea waste for arsenic removal. J. Magn. Magn. Mater. 2014, 356, 21–31. [Google Scholar] [CrossRef]
- Islamoglu, S.; Yilmaz, L.; Ozbelge, H.O. Development of a precipitation based separation scheme for selective removal and recovery of heavy metals from cadmium rich electroplating industry effluents. Sep. Sci. Technol. 2006, 41, 3367–3385. [Google Scholar] [CrossRef]
- Iqbal, M.; Saeed, A.; Zafar, S.I. FTIR spectrophotometry, kinetics and adsorption isotherms modeling, ion exchange, and EDX analysis for understanding the mechanism of Cd2+ and Pb2+ removal by mango peel waste. J. Hazard. Mater. 2009, 164, 161–171. [Google Scholar] [CrossRef] [PubMed]
- Da̧browski, A.; Hubicki, Z.; Podkościelny, P.; Robens, E. Selective removal of the heavy metal ions from waters and industrial wastewaters by ion-exchange method. Chemosphere 2004, 56, 91–106. [Google Scholar] [CrossRef] [PubMed]
- Rao, K.; Mohapatra, M.; Anand, S.; Venkateswarlu, P. Review on cadmium removal from aqueous solutions. Int. J. Eng. Sci. Technol. 2011, 2, 81–103. [Google Scholar] [CrossRef]


Publisher’s Note: MDPI stays neutral with regard to jurisdictional claims in published maps and institutional affiliations. |
© 2021 by the authors. Licensee MDPI, Basel, Switzerland. This article is an open access article distributed under the terms and conditions of the Creative Commons Attribution (CC BY) license (http://creativecommons.org/licenses/by/4.0/).