Article

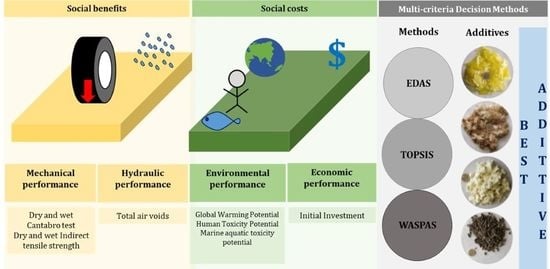
Multi-Criteria Selection of Additives in Porous Asphalt Mixtures Using Mechanical, Hydraulic, Economic, and Environmental Indicators

by
Anik Gupta
1,
Carlos J. Slebi-Acevedo
1,
Esther Lizasoain-Arteaga
1,2,
Jorge Rodriguez-Hernandez
1 and
Daniel Castro-Fresno
1,*
1
GITECO Research Group, University of Cantabria, 39005 Santander, Spain
2
TECNALIA, Basque Research and Technology Alliance (BRTA), Astondo Bidea, Edificio 700, 48160 Derio, Spain
*
Author to whom correspondence should be addressed.
Sustainability 2021, 13(4), 2146; https://doi.org/10.3390/su13042146
Submission received: 15 December 2020 / Revised: 5 February 2021 / Accepted: 10 February 2021 / Published: 17 February 2021

Abstract

:
Porous asphalt (PA) mixtures are more environmentally friendly but have lower durability than dense-graded mixtures. Additives can be incorporated into PA mixtures to enhance their mechanical strength; however, they may compromise the hydraulic characteristics, increase the total cost of pavement, and negatively affect the environment. In this paper, PA mixtures were produced with 5 different types of additives including 4 fibers and 1 filler. Their performances were compared with the reference mixtures containing virgin bitumen and polymer-modified bitumen. The performance of all mixes was assessed using: mechanical, hydraulic, economic, and environmental indicators. Then, the Delphi method was applied to compute the relative weights for the parameters in multi-criteria decision-making methods. Evaluation based on distance from average solution (EDAS), technique for order of the preference by similarity to ideal solution (TOPSIS), and weighted aggregated sum product assessment (WASPAS) were employed to rank the additives. According to the results obtained, aramid pulp displayed comparable and, for some parameters such as abrasion resistance, even better performance than polymer-modified bitumen, whereas cellulose fiber demonstrated the best performance regarding sustainability, due to economic and environmental benefits.

Graphical Abstract

1. Introduction

The idea of sustainability has three essential components: engineering for society, economic development, and respect for the environment [1]. The construction sector causes significant environmental impacts, with a substantial release of emissions into the environment, as well as consuming energy and natural resources [2].
Porous asphalt (PA) is a step forward towards sustainability [3]. However, the additives are additional constituents that can have a significant influence on the environmental and economic impacts. Over the last 30 years, several types of additives, fibers, and fillers have been used in PA mixtures. Additives like nano-silica, warm mix additives, etc.; fibers such as glass fibers, nylon fibers, steel, aramid, etc.; and fillers, such as hydrated lime, diatomite, etc. are added to PA mixtures [4,5,6,7,8,9,10,11].
Fibers exhibit various mechanisms, four of which are explained next. Firstly, the formation of a network as reported by Chen and Lin [12], cellulose fibers increase the viscosity of the bitumen mastic if added at 0.3% fiber content, these fibers create a ‘localized network structure’; and at 0.4% fiber content, they form a continuous network which reinforces the bitumen. Due to the formation of this network, fibers retain bitumen, which assists in the formation of thicker coating around the aggregates without the risk of draindown. Secondly, some fibers such as steel fibers resist the fatigue-induced cracking damage; therefore, the micro-cracks do not transform into macro cracks [13]. In addition to this, steel wool fibers also improve the healing of PA mixtures by induction heating [14]. Thirdly, synthetic fibers carry a proportion of tensile loads and improve the tensile strength of the mixtures [12]. Fourthly, fibers such as glass fibers enhance the performance of asphalt mixtures at high temperatures as they have very high-temperature resistance, and when the softening point of bitumen is exceeded, they support the bitumen and resist binder stripping and drainage [15].
Concerning the fillers, amount and type are decisive when estimating the cohesion among the constituents of PA mixtures [6]. According to Mohd Shukry et al., 2018 [16], fillers work by stiffening and improving the adhesion of the binder-aggregate matrix. Hydrated lime enhances the chemical bonds between aggregates and binders and reduces particle loss and improves moisture resistance so it can be used in rainy areas [17]. Meanwhile, Hu et al., [18] reported that the activated carbon filler has a higher surface area than limestone filler and due to this property, activated carbon retains bitumen that facilitates higher bitumen content.
However, these additives may block a part of the air pockets present in the bitumen-aggregate matrix [19]. They reduce the permeability of the PA mixtures, which may render the PA mixture useless [20]. It is important to consider the impacts of additives on hydraulic, economic, and environmental factors at an early stage by performing a life cycle assessment. In a study by Marzouk et al. [21], the environmental impact of road construction projects was quantified before starting by utilizing Building information modeling (BIM). The study included seven different stages of a road construction project from manufacturing phase to deconstruction phase. Rodriguez-Fernandez, 2020 [22], analyzed the influence of PA mixtures with warm mix additives on the environment and found that warm-mix additives with polymer modified bitumen (PMB) reduce the impacts on human health, ecosystem diversity, and resource availability. In another study [2], ReCiPe indicators were used for life cycle assessment of end-of-life tires and cellulose fiber-reinforced PA mixture. It was concluded that the use of cellulose fibers reduces the impact on human health and the ecosystem; however, the energy consumption of cellulose fibers was 25% higher than end-of-life tire fibers. In another study on the recyclability potential of PA mixtures with steel wool fibers, it was found that the mixtures with 40% recycled material displayed better performance than a control mixture [14].
Therefore, it is vital to find a balance among the mechanical, hydraulic, economic, and environmental constraints to optimize the performance of these mixtures. The same additive that performs well in one aspect may not necessarily perform well in others; therefore, to assess the net influence, multi-criteria analysis can be applied.
In multi-criteria analysis, an alternative is selected according to the criteria which comprise different parameters. These criteria are allotted relative importance which may be based on the expertise of the researchers in the field [23]. However, there are many methods to compute the relative importance of the various criteria. Analytic hierarchy process (AHP) is the most commonly used method in the road construction sector [24,25,26,27,28]. The scores in this method are computed by pairwise comparisons and opinions of experts [29]. Another method of great relevance is the Delphi method. Shrestha and Shrestha 2019 [30] employed the Delphi method to analyze road maintenance routines. In this method, the opinions of experts are asked for more than one time to achieve a general consensus with the aim of minimizing uncertainty and improving accuracy. Although there are methods such as Criteria Importance Through Inter-criteria Correlation (CRITIC) that do not require human intervention, which can be useful to obtain the scores quickly or avoid human errors. Ariza et al. [31], employed multi-criteria analysis for the selection of sustainable urban drainage systems (SUDS) on the basis of environmental, social, and economic aspects using CRITIC.
After the allotment of scores, the multi-criteria decision methodology is applied to select the best alternative. Multi-criteria decision-making methods (MCDMs) that can be utilized include: integrated value model for structural assessment (MIVES), weighted aggregated sum product assessment (WASPAS), elimination et choix traduisant la realité (ELECTRE) (elimination and choice translating reality in original French), technique for order of the preference by similarity to ideal solution (TOPSIS), evaluation based on distance from average solution (EDAS), preference ranking organization method for enrichment evaluation (PROMETHEE). Jato-Espino et al., 2018 [28], employed TOPSIS for the selection of asphalt wearing courses in highly trafficked roads. In another study [32], the optimization of asphalt mixtures incorporating nylon fibers was done using the WASPAS method, where different bitumen and fiber contents were considered for optimization of an open-graded asphalt mixture. However, there was a lack of literature assessing the ‘complete’ performance of additives in PA mixtures in terms of mechanical, hydraulic, economical, and environmental indicators based on multi-criteria analysis.
In this paper, a multi-criteria decision-making method is employed to select the best additive among the six different types of additives in the PA mixtures based on its effect on mechanical, hydraulic, economic, and environmental factors. The hypothesis is that although the additives improve the mechanical performance of PA mixtures, they may not improve other aspects proportionally, this study investigates whether this improvement is in overall performance based on hydraulic, economic, and environmental indicators. Figure 1 shows the structure of the study.
The sections are divided as follows: after this first section dedicated to the introduction, the second section discusses the selected methodology describing the multi-criteria decision-making methods: EDAS, TOPSIS, and WASPAS. Then, materials and alternatives and the properties of the materials used are discussed. Next, the selection of indicators that quantify the performance of the additives are explained: mechanical (dry and wet abrasion loss, dry and wet indirect tensile strength test), hydraulic (air voids), economic (initial investment), and environmental indicators (global warming potential, human toxicity potential, marine aquatic eco-toxicity potential). Finally, the criteria of calculation of relative weights are explained. The third section presents the results and discussion of the multi-criteria decision methods. The final section presents the main conclusions drawn from this study.

2. Methodology

2.1. Multi-Criteria Decision-Making Methods (MCDMs)

The three MCDMs used in the study are the EDAS, TOPSIS, and WASPAS methods. They were selected as their approaches were the most interesting ones for this paper.
WASPAS, developed by Chakraborty and Zavadskas [33], is the combination of two individual MCDMs, namely, the weighted sum method (WSM) and weighted product model (WPM). WSM is based on the simple weighted addition of the criteria, whereas the WPM is an improvement of WPM as its structure eradicates units of measure. It was found that the WASPAS method improves the accuracy of the other two methods [34].
TOPSIS, proposed by Hwang and Yoon, 1981 [35], is among the conventional methods [36,37]. The principle of TOPSIS is based on the assumption that each criterion tends to increase or decrease the utility [38]. TOPSIS ranks the alternatives based on the ideal and nadir hypothetical solutions, respectively. The best alternative is the one that has the least distance from the ideal solution and the greatest from the nadir solution. This method is a ‘compensatory aggregation method’ which indicates that a reduction in one criterion corresponds to an increment in another [28].
Finally, the EDAS method, developed by Mehdi Ghorabaee [39], utilizes the average solution for evaluating all alternatives with regards to their PDA (positive distance from average) and NDA (negative distance from average). This depends on each criterion being beneficial and non-beneficial. In this method, there is no necessity to calculate the ideal and nadir solution as it is based on the distance from the average solution [39].
MCDMs were performed to rank the additives selected for this study based on four criteria: mechanical, hydraulic, environmental, and economic. A short description of each can be seen in Table 1 [33,35,39]. However, as the results could change depending on the method employed, these three methods were selected to compare the results and to evaluate the accuracy and suitability for porous asphalt (PA) pavements.

2.2. Materials and Alternatives

The study aims to compare the performance of novel additives that are used to improve the performance of PA mixtures. A variety of additives were considered, and their performance was assessed based on mechanical, hydraulic, economic, and environmental indicators. The additives used in the study were one filler (hydrated lime) and four fibers (regular aramid fiber, aramid-polyolefin fibers, aramid pulp, and cellulose fibers). Two additional mixtures were prepared without any additive: one with virgin bitumen (penetration 50/70) and another with PMB 45/80-65.
The PA mixtures were designed according to the Spanish guidelines PG-3 for PA mixtures (Table 2) with the 16mm maximum aggregate size, 4.5% bitumen content, 0.05% fiber content, and 20% minimum air void content. The cylindrical specimens were prepared according to European standard EN 12697-30, applying 50 blows per side using Marshall Compactor.
The aggregates were first heated at 170 °C for 6 h after that the fibers along with the aggregates were added by dry process along with the aggregates and mixed for approximately 30 s to obtain a homogeneous mix. Then, the virgin binder was added at 150 °C (whereas PMB at 175 °C) and blended thoroughly in this fiber-aggregate mixture for proper coating. The compaction was done with 50 blows on each face of a Marshall specimen and then the specimens were left for 24 h at room temperature before demolding. The properties of fibers are detailed in Table 3 and those of bitumen and aggregates in Table 4. All the mixtures used in the study are shown in Table 5 and the fibers are shown in Figure 2. The control mixture was prepared with a virgin bitumen content 4.5% and limestone filler without fibers. The gradation, bitumen, and fiber content were kept constant for mixtures with aramid fiber, pulp, and polyolefin fibers to ensure that any variation in the performances is due to the use of additives.
However, mixtures with cellulose fibers were designed with 5% bitumen content and higher fiber content of 0.5% as they are expected to stabilize the binder as they retain a part of the binder [40,41]. For mixtures prepared with HYDLIM additive, the limestone filler was completely replaced by the hydrated lime and no other additive was used.

2.3. Selection of Indicator

2.3.1. Mechanical Indicators

Mechanical resistance of the specimens was evaluated by draindown tests, Cantabro tests, and indirect tensile strength tests. The draindown test of the mixtures was performed according to the European standard EN 12697-18. This test assesses the stabilizing ability of PA mixtures. The mixture design used in the study ensured that the draindown was less than 0.3% as recommended by various researchers [42,43,44,45]. The draindown of the mixture types was well below the limit; in the range of 0.01%. Therefore, the results were not included in the multi-criteria analysis.
The Cantabro test evaluates the ability of the mixture to resist disintegration by impact or abrasion caused by vehicles [46]. The adhesion between the constituents of the PA mixtures is strongly affected by the water and high temperature [47,48]. These tests in dry and wet conditions were performed according to EN 12697-17 and Spanish guidelines NLT-362/92, respectively. In the latter, specimens were submerged in water at 60 °C for 24 h and then kept at 25 °C before testing for one day.
The indirect tensile strength (ITS) is an indicator of the ability of a mixture to absorb energy without fracture. It is the maximum load a specimen can sustain without fracture. The ITS tests were performed to assess the integrity of the mixture against moisture damage, and confirm whether the coating of the binder around the fiber-aggregate mixture is uniform. The tests were done according to European standard EN 12697-23 and EN 12697-12 for dry and wet conditions, respectively.
A total of 98 specimens were manufactured with at least three replicates per test to ensure the accuracy of tests. The percentage reductions in abrasion loss and percentage increments in indirect tensile strength in comparison to reference mixture BITU induced by the incorporation of fibers are shown in Table 6. However, in the case of indirect tensile strength, it indicates the increment in the strength. These were further converted into scores to evaluate the rank of additives.

2.3.2. Hydraulic Indicators

The hydraulic performance of the PA mixtures is highly dependent on the voids present in the structure as they act as a path through which the water flows. However, when the additives are added in the PA mixtures, they block a part of the air voids and, hence, it can be expected that the air voids will reduce due to additives. It is important to design the gradation carefully to not compromise the hydraulic performance of the mixture. Many researchers have recommended that the air voids in PA mixtures should be 20% [49,50,51,52]. The air voids were calculated according to the European standard EN 12697-8.
The percent variation in air void content of the mixture types regarding the control mixture is given in Table 7. As can be observed, the percentage variation among the air void content of all the mixture types was negligible. The highest difference was observed in the case of cellulose fibers (air void content: 19.7%), which makes sense as the binder content (5%) and fiber content (0.5%) were higher in that case. Similar to mechanical performance, the hydraulic performance of fibers was converted in scores to take a multi-criteria decision.

2.3.3. Economic Indicators

The additives were evaluated based on the capital invested at the beginning of the construction of a pavement. The total cost of asphalt (in euro/tonne) was computed for each type of mixture by summation of individual cost of bitumen, aggregates, fillers, and additives. It is worth mentioning here that the PULP fibers used were the waste products obtained from the production of aramid fibers (ARA); therefore, their use can result in additional savings. Furthermore, it was found that the addition of fibers and fillers did not increase the cost of the manufacturing process as they were incorporated by the dry method, i.e., they were added with the aggregates in the mixture. However, the use of PMB implies a higher cost in the manufacturing process since an increment of manufacturing temperature is required to reduce its viscosity. Therefore, an increase of 20 °C (160 °C to 180 °C) requires an increment of 6–9% in total energy, which includes the energy required for heating and drying of aggregates (which also depends on the moisture content). Therefore, a value of 7.5% increment was considered due to the use of PMB bitumen. The economic indicator is shown in Figure 3.

2.3.4. Environmental Indicator

Life cycle assessment is done to calculate the environmental impact of a structure. To analyze the additives from the environmental point of view, a life cycle assessment (LCA) was performed following the standards ISO 14040:2005 and 14044:2006. The environmental analysis is done based on the ReCiPe method and the production of 1 ton for each asphalt mixture was considered as a functional unit. LCA included the production of materials, transportation to the asphalt plant, and production of the asphalt mixture. Only three impact categories were selected as evaluating all the impact categories that are normally included in an LCA would substantially increase the complexity of the MCDM. In a study done by Lizasoain-Arteaga et al., 2019 [53], global warming potential and human toxicity potential received the highest score in the weighting factors, these are also among those recommended by the EPA, BEES, NOGEPA, and BREE [54,55]. Moreover, marine aquatic eco-toxicity potential underwent the greatest variation in a previous study [56] which compared a reference asphalt mixture with no fibers to another containing FortaFi additive (one of the additives also used in this study). Therefore, these three categories were selected as the most relevant parameters to analyze the impacts on the environment: Global Warming Potential (GWP), Human Toxicity Potential (HTP), and Marine Aquatic Eco-toxicity Potential (MAETP). The CML 2001 (January 2016 update) characterization method was selected for the impact calculation since this method is recommended in the standard EN 15804-2012 regarding the Environmental Product Declaration rules for construction products. It should be mentioned that:
  • CELLU fibers contain 90% cellulose fiber and 10% bitumen. According to the provider, cellulose fibers contain recycled waste paper, its percentage varying depending on its quality. For the analysis, waste paper fibers were used as the main raw material.
  • ARA-POL is composed of 13% aramid fiber and 87% polyolefin fiber. As no information regarding the type of polyolefin used was found, polystyrene was assumed for this work.
  • The production process for aramid fiber (ARA) is available in GaBi, but for aramid pulp (PULP) it is not available. As the manufacturer published the manufacturing process and the GWP impact of both materials, the difference among them was solely due to an increase in electricity consumption while manufacturing PULP.
The percentage increase in the impact on GWP, HTP, and MAETP for all additives compared to the control mixture is showing in Figure 4. The use of additives has a higher impact on the environment than using the control mixture with virgin bitumen and no fibers. Cellulose fiber and ARA-POL fibers are among the additives that caused the least increment in global warming potential and are least toxic to human and marine aquatic life.

2.4. Computation of Relative Weights

Once the parameters are chosen, it is crucial to evaluate the relative importance of each of them in the selection of alternatives. The Delphi method was used for this purpose. This method is based on the idea of aggregating the judgments of a group of experts to enhance the accuracy of decision-making without bringing them together physically. In this iterative method, questionnaires are prepared one after the other and each subsequent questionnaire is prepared based on the results obtained during the previous one. The process is stopped when a general consensus or sufficient information is obtained. According to the judgments, the relative weights or scores are computed, indicating the range of importance from high to low. In contrast to other methods, the accuracy of this method is not determined by the number of participants but by their expertise. This method does not necessitate the complexity of pairwise comparison as other methods such as the analytic hierarchy process (AHP). For example, if the scores are allotted as shown in the illustrative example in Figure 5, the different levels of scores can be estimated instead of a comparison between one pair, and consequently, the comparative rating can be added to more than two parameters at the same time. Additionally, in the Delphi method, error due to the human mind is reduced as the experts are given multiple chances to reconsider their answers.
In this study, a group of 5 experts based on their experience chose the criteria that can determine the performance of each additive. Then, a questionnaire with the defined criteria and indicators (sample of questionnaire is provided in Appendix A) was sent to a diverse group of 32 experts in the field of asphalt pavement engineering to provide weights for the parameters based on their expertise. Around 65% of experts are working in the university, 15% in the research centers, and 20% work in construction companies or national road authorities. Many researchers work as senior researchers or scientists in reputed research organizations, while others are working as professors in recognized universities. The experience of more than 90% of the experts are directly related to asphalt pavements and road engineering. In terms of geographical diversity, the experts work in 11 countries including India, Chile, Colombia, Spain, Italy, the United Kingdom, and Switzerland.
The questionnaires were presented in the form of numerical values from 0 to 1 where 0 indicated minimum importance whereas 1 indicated the highest importance (see Figure 5). The experts were asked to fill in their responses on parameters so that the sum was 1 for each indicator. The indicators chosen include mechanical, hydraulic, environmental, and economic parameters.
After the analysis of results obtained in the first questionnaire, a statistical analysis was performed to evaluate the coefficient of variation and confidence interval among the opinions of the experts. In the second questionnaire, the mean and standard deviation for each parameter was also mentioned, so that the experts have the choice to change their answers to minimize the standard deviation about the mean. After the second questionnaire, a consensus was obtained with a significant reduction in the coefficient of variation, suggesting that the two rounds were sufficient. In the second questionnaire, 24 responses were received out of 32; the remaining 8 responses were maintained as they were in the previous round.

2.4.1. The Relative Weight of Mechanical Indicators

The results obtained after the final round are shown in Figure 6a. It was found that relatively higher weights were allotted to the performance in the wet conditions; both for the Cantabro test and indirect tensile strength test. This makes sense as the moisture susceptibility in PA mixtures is a great concern due to the higher porosity that makes the mixture very exposed to aging and oxidation in comparison to dense-graded mixtures. In both dry and wet conditions, the abrasion resistance is given higher priority than the indirect tensile strength test. This can be explained because that the raveling is the biggest concern in PA mixtures due to high air void content in their structure [46,57,58,59]. Moreover, in wet conditions, the test for abrasion resistance is performed under harsher conditions as the samples are submerged at a high temperature of 60 °C (in comparison to 40 °C in ITS test) which may be higher than the softening point of the bitumen resulting in more binder stripping and a higher abrasion loss.

2.4.2. Relative Weights of Environmental Indicators

The relative weights are given in Figure 6b. The results show that the experts consulted assigned a similar weight to all the proposed impacts with the weight of GWP being slightly higher. This may be because nowadays, this impact is considered as the most prominent in environmental analysis and although changing, it is still the main impact referred to in international forums and agreements. Human toxicity received greater weight than aquatic ecotoxicity, which may be the result of the great social concern about diseases such as cancer which can be the result of fumes generated in the construction industry. Economic and hydraulic indicators do not need relative weighting because there is only one indicator per criterion.

2.4.3. Comparison of Indicators

The relative weights for each indicator are shown in Figure 6c. The weights are given in highest to lowest in the order hydraulic > mechanical > environmental > economic. The hydraulic indicator includes the total air void content of the PA mixture. Among mechanical and hydraulic indicator, the latter was given more importance by the experts. It makes sense as the air voids indicate the efficiency in passing the water, absorbing noise, and reducing skid risk. Especially when additives are used in the mixture, the amount of air voids is affected. Therefore, it is important to maintain hydraulic performance along with mechanical performance. The environmental indicator is given higher importance than the economic one as the environmental impact is high; thus, it will overshadow other economic advantages of PA mixtures.

3. Results and Discussion

3.1. Mechanical Indicators

Figure 7 presents the score given for each type of mixtures using the EDAS (appraisal score, ASi), TOPSIS (relative closeness, CCi), and WASPAS (Joint performance score Qi) methods. It can be observed that the three methods have shown very good agreement with each other in the evaluation of the mechanical indicators. For the three MCDMs the ranks of mixture types are as follows from best to worst: PULP > PMB > CELLU > HYDLIM > ARA > BITU > ARA-POL. Using multi-criteria decision-making methodologies, the performance of fiber varied greatly depending on the material of the additive.
The PULP fiber was shown to have the best performance as the AS (EDAS), RC (TOPSIS), Q (WASPAS) were highest for PULP. This is probably because PULP fibers improved the abrasion resistance significantly (+58.82% and +55.04 in dry and wet conditions with respect to BITU), which was selected as the most important mechanical indicator by the experts. The reason for this phenomenon may be the defibrillation of pulp fibers into small-sized fibers (1–1.5 mm), which may strengthen the bitumen-aggregate matrix. It is worth mentioning here that the mechanisms of fibers have been explained by the authors in previous articles [7,60]. The mechanical resistance of the PULP fiber not only matched the performance of PMB but was even found to be better. Moreover, PULP fibers improved the strength in wet conditions.
Other additives CELLU, HYDLIM, and ARA also performed better than the control mixture but worse than PMB, indicating that the additives improve the mechanical resistance of the conventional PA mixture with virgin bitumen, which is confirmed by many researchers [5,61,62,63]. Especially in the case of the ITS and Cantabro tests in wet conditions, the samples were kept at a higher temperature of 40 °C and 60 °C, at which the viscosity of bitumen reduces. However, due to the use of additives the viscosity increases, which helps in maintaining a similar value. However, there is one exception, ARA-POL had the worst performance as the abrasion losses were very high, particularly under wet conditions (−94.7%). This may be because of the unsuitability of polyolefin in improving the viscosity of the binder in the asphalt mixture.

3.2. Hydraulic and Economic Indicators

For the hydraulic indicators, where the air void content was considered, the best additive for this case was the one that displayed the highest air void content. The rank of the additives was based on the hydraulic performance of the additives in the order from highest to lowest: ARA > HYDLIM > PMB > ARA-POL > PULP > CELLU. It is worth mentioning here that the CELLU fibers were prepared with a bitumen content of 5% which was higher than the rest of the mixture types. However, the reduction in the case of CELLU was not proportionate to the increase in the bitumen content, due to the high absorption of bitumen by fibers. The variation in the values was not found to be significant (p-value > 0.05) for all other fibers. Hence, it can be safely said that the additives did not reduce hydraulic performance. The reason for this may be the small quantity of additives and no significant changes in the gradation. If we characterize the mechanical and hydraulic indicators as physical characteristics, the best performance will be of PMB mixtures as it was ranked higher in both indicators.
Based on the economic indicator, the ranks of fibers from best to worst are BITU > HYDLIM > PMB > PULP > CELLU > ARA-POL > ARA. It is obvious that the reference mixture BITU will present the lowest cost as no fibers were added. HYDLIM is next in line as in these mixtures, limestone filler is replaced by hydrated lime that resulted in a minimum increase in the cost. Aramid fibers are the most expensive fiber and even with a fiber content of just 0.05% the cost of these mixtures is the highest.

3.3. Environmental Indicators

The rank according to Figure 8 for the asphalt mixtures is as follows: BITU > CELLU > ARAPOL > PMB > ARA > PULP > HYDLIM. The burning of fossil fuels, drying, and heating the aggregates represent around 85% of the energy consumption of an asphalt plant. In HYDLIM mixtures, the limestone filler was replaced by hydrated lime that led to a very high impact on the environment. Hydrated lime has a very high global warming potential (GWP) which results in its lowest rank. For parameters HTP and MAETP, the impacts of HYDLIM are comparable to other mixtures. Binder is an additional major source of Greenhouse Gases (GHG) emissions during the production of the asphalt mixture. While using the PMB due to higher manufacturing temperature, any increase or decrease in the product temperature has a direct impact on the amount of fuel consumed, and environmental impact [1]. The PMB has a lower rank despite the absence of fibers. It is also important to keep in mind that the recyclability of PMB has been questioned many times by the researchers due to the presence of polymers. A lot of research is ongoing on the replacement of the polymer-modified bitumen without compromising the mechanical performance thanks to the addition of fibers.

3.4. Ranking of Indicators

If all the indicators were given the values as proposed by the group of experts shown in Figure 6c, then the resulting ranking using EDAS, TOPSIS, and WASPAS would be as shown in Figure 9; in order of rank: PMB > PULP > CELLU > BITU > HYDLIM > ARA > ARA-POL. All parameters involved were given a priority by multiplying the relative weights allotted to the indicators and then to the individual parameter. For example, environmental indicators were given a relative weight of 0.24, and for GWP a relative weight of 0.36, then the cumulative weight of GWP will be the multiplication of 0.24 and 0.36, i.e., 0.087 (8.7%). It can be seen that considering the influence of mechanical, hydraulic, economic, and environmental indicators, and their corresponding parameters, PMB and PULP were the best performing mixtures.
EDAS and WASPAS attributed the highest score to PMB, while according to TOPSIS, PULP showed the best performance. Overall, PMB and PULP both improve the mechanical performance of the mixtures without significant differences among them. It is important to note that the CELLU fibers have good mechanical performance and lower impact on the environment which explains their widespread use. In turn, HYDLIM mixtures were among the highest-ranked in terms of hydraulic and economic parameters; however, due to the high impact on the environment and low improvement of mechanical resistance, its use can be questioned.

3.5. Discussion of Multi-Criteria Decision-Making Methods

As an additional contribution of this research, a comparison among the three multi-criteria decision-making methods is illustrated in graphical form, as shown in Figure 10. In the same way, different linear regression models were developed based on the scores attained by each multi-criteria method. Accordingly, EDAS vs. WASPAS displayed the best agreement with an R2 value of 0.94 (See Figure 10b), followed by the EDAS vs. TOPSIS regression model with an R2 value of 0.78. Finally, TOPSIS vs. WASPAS displayed the lowest agreement with an R2 value of 0.59. Regarding the preference rankings, it was observed that EDAS had the largest gaps among the scores whereas, in the WASPAS method, all designs exhibited closer values in the scores. Accordingly, in this research, although the ranking was similar among the three methods, in EDAS the differences in the scores were more noticeable. In any case, PMB and PULP were ranked in the first positions, whereas ARA-POL was in the last position.

4. Conclusions

In this study, a multi-criteria decision-making method was applied to rank the performance of various additives in PA mixtures- three types of fibers: aramid fiber, aramid pulp, and aramid-polyolefin fibers; two types of fillers: limestone (standard) and hydrated lime; and two types of bitumen: virgin bitumen 50/70 and polymer modified bitumen. Their performance was analyzed based on four indicators, namely: mechanical indicators (abrasion resistance in dry conditions and wet conditions and indirect tensile strength in dry conditions and wet conditions); hydraulic indicator (air voids); economic indicator (initial investment), and environmental indicators (global warming potential, human toxicity potential, and marine aquatic eco-toxicity potential). The relative weights were calculated using the Delphi method and the alternatives were ranked using the multi-criteria methods EDAS, TOPSIS, and WASPAS. The following conclusions can be drawn from the study:
  • According to the Delphi method, experts gave the highest relative weights to abrasion loss in wet conditions in mechanical resistance as it poses a serious concern for porous asphalt mixtures due to their open-graded structure. Meanwhile, for the environmental indicator, the highest relative weight was allotted to global warming potential.
  • The additives improved the mechanical performance of the PA mixtures. The highest scores were observed for the porous asphalt mixtures with PULP fibers according to all three methods. Additionally, mixtures with aramid pulp exhibited highest abrasion resistance, whereas with aramid-polyolefin fibers showed the lowest abrasion resistance.
  • The additives did not compromise the hydraulic characteristics of the PA mixtures severely. The scores were given in the order (best to worst): ARA > HYDLIM > PMB > ARA-POL > PULP > CELLU. Although cellulose fiber displayed the lowest air voids content, no significant reduction was observed compared to the reference mixture.
  • Concerning the economic indicator, the highest score was given to mixtures with hydrated lime. This was closely followed by the aramid pulp, which was a waste product during the manufacturing of the aramid fibers, requiring the least initial investment among all the fibers included in the study.
  • The environmental indicator suggested that the additives had a higher impact on the environment. However, the addition of cellulose fiber (the only natural fiber tested) had the least impact on the environment, whereas the hydrated lime had the highest impact on global warming potential.
  • The three multi-criteria decision-making methods used (EDAS, TOPSIS, and WASPAS) have shown very good agreement, especially for the mechanical indicators. EDAS and WASPAS have shown higher agreement compared to EDAS and TOPSIS or TOPSIS and WASPAS.
  • Overall, the use of aramid pulp and cellulose fibers is recommended in PA mixtures based on mechanical, hydraulic, economic, and environmental indicators. On the one hand, aramid pulp (a waste product) had been shown to have enhanced the mechanical characteristics considerably, while on the other hand, cellulose fibers had the lowest impact on the environment.
In the future, the influence of fibers on the rate of aging should be analyzed using short and long-term aging procedures as well as fiber’s behavior in PA mixtures at low and high temperatures. Another interesting line of research could be to evaluate the recyclability of the PA mixtures incorporated with additives. It is also important to assess the impact of the increment in temperature on the environmental indicator by using polymer- modified bitumen. Increase in temperature results in higher emissions, and high environmental impact.

Author Contributions

Conceptualization, A.G., J.R.-H., and C.J.S.-A.; methodology, A.G.; investigation, A.G., C.J.S.-A. and E.L.-A.; writing—original draft preparation, A.G.; review and editing, C.J.S.-A., J.R.-H., D.C.-F., and E.L.-A.; supervision, D.C.-F.; resources, D.C.-F. and J.R.-H. All authors have read and agreed to the published version of the manuscript.

Funding

This work and the APC are funded by SAFERUP! Project, from the European Union’s Horizon 2020 research and innovation program under, the Marie Skłodowska-Curie grant agreement No. 765057.

Institutional Review Board Statement

Not applicable.

Informed Consent Statement

Not applicable.

Data Availability Statement

Not applicable.

Acknowledgments

This work was possible thanks to the research project entitled ‘Resilient and sustainable Permeable Pavements For Urban Flood Mitigation (RePP4FM The authors gratefully acknowledge the support of Teijin Aramid B.V. for their providing the different fibers.

Conflicts of Interest

The authors declare no conflict of interest.

Appendix A

Figure A1. Sample of Questionnaire.
Sustainability 13 02146 g0a1

References

  1. Pouranian, M.R.; Shishehbor, M. Sustainability assessment of green asphalt mixtures: A review. Environments 2019, 6, 73. [Google Scholar] [CrossRef] [Green Version]
  2. Landi, D.; Marconi, M.; Bocci, E.; Germani, M. Comparative life cycle assessment of standard, cellulose-reinforced and end of life tires fiber-reinforced hot mix asphalt mixtures. J. Clean. Prod. 2020, 248, 119295. [Google Scholar] [CrossRef]
  3. David, K.H. Structural and Hydrological Design of Permeable Pavements. In Proceedings of the Annual Conference of Transport Association Canada Halifax, Halifax, NS, Canada, 26–29 September 2010. [Google Scholar]
  4. Slebi-Acevedo, C.J.; Lastra-González, P.; Calzada-Pérez, M.A.; Castro-Fresno, D. Effect of synthetic fibers and hydrated lime in porous asphalt mixture using multi-criteria decision-making techniques. Materials 2020, 13, 675. [Google Scholar] [CrossRef] [PubMed] [Green Version]
  5. Ye, Z.; Jian, L. The Effect of Fiber on the Performance of Open Graded Friction Course (An Environmental Survey). Ekoloji 2019, 28, 4891–4895. [Google Scholar]
  6. Tanzadeh, R.; Tanzadeh, J.; Amid, S. Experimental study on the effect of basalt and glass fibers on behavior of open-graded friction course asphalt modified with nano-silica. Constr. Build. Mater. 2019, 212, 467–475. [Google Scholar] [CrossRef]
  7. Slebi-Acevedo, C.J.; Lastra-González, P.; Indacoechea-Vega, I.; Castro-Fresno, D. Laboratory assessment of porous asphalt mixtures reinforced with synthetic fibers. Constr. Build. Mater. 2020, 234, 117224. [Google Scholar] [CrossRef]
  8. Norgbey, E.; Huang, J.; Hirsch, V.; Liu, W.J.; Wang, M.; Ripke, O.; Li, Y.; Annan, G.E.T.; Ewusi-Mensah, D.; Wang, X.; et al. Unravelling the efficient use of waste lignin as a bitumen modifier for sustainable roads. Constr. Build. Mater. 2020, 230, 116957. [Google Scholar] [CrossRef]
  9. Wurst, J.E.; Putman, B.J. Laboratory Evaluation of Warm-Mix Open Graded Friction Course Mixtures. J. Mater. Civ. Eng. 2013, 25, 403–410. [Google Scholar] [CrossRef] [Green Version]
  10. Senior-Arrieta, V.; Córdoba-Maquilón, J.E. Mechanical characterization of porous asphalt mixes modified with fatty acid amides -FAA-[Caracterización mecánica de mezclas asfálticas porosas modificadas con amidas de ácidos grasos]. Ing. Investig. 2017, 37, 43–48. [Google Scholar]
  11. Renken, L.; Li, T.; Lu, G.; Oeser, M.; Wang, D.; Li, H. Experimental study on the polyurethane-bound pervious mixtures in the application of permeable pavements. Constr. Build. Mater. 2019, 202, 838–850. [Google Scholar] [CrossRef]
  12. Chen, J.-S.; Lin, K.-Y. Mechanism and Behavior of Bitumen Strength Reinforcement Using Fibers. J. Mater. Sci. 2005, 40, 87–95. [Google Scholar] [CrossRef]
  13. Enieb, M.; Diab, A.; Yang, X. Short- and long-term properties of glass fiber reinforced asphalt mixtures. Int. J. Pavement Eng. 2019, 22, 64–76. [Google Scholar] [CrossRef]
  14. Lastra-González, P.; Indacoechea-Vega, I.; Calzada-Pérez, M.A.; Castro-Fresno, D. Recyclability potential of induction-healable porous asphalt mixtures. Sustainability 2020, 12, 9962. [Google Scholar] [CrossRef]
  15. Luo, D.; Khater, A.; Yue, Y.; Abdelsalam, M.; Zhang, Z.; Li, Y.; Li, J.; Iseley, D.T. The performance of asphalt mixtures modified with lignin fiber and glass fiber: A review. Constr. Build. Mater. 2019, 209, 377–387. [Google Scholar] [CrossRef]
  16. Shukry, N.A.M.; Hassan, N.A.; Abdullah, M.E.; Hainin, M.R.; Yusoff, N.I.M.; Jaya, R.P.; Mohamed, A. Effect of various filler types on the properties of porous asphalt mixture. IOP Conf. Ser. Mater. Sci. Eng. 2018, 342, 012036. [Google Scholar] [CrossRef]
  17. Ma, X.; Li, Q.; Cui, Y.C.; Ni, A.Q. Performance of porous asphalt mixture with various additives. Int. J. Pavement Eng. 2018, 19, 355–361. [Google Scholar] [CrossRef]
  18. Hu, X.; Dai, K.; Pan, P. Investigation of engineering properties and filtration characteristics of porous asphalt concrete containing activated carbon. J. Clean. Prod. 2019, 209, 1484–1493. [Google Scholar] [CrossRef]
  19. Chen, J.S.; Sun, Y.C.; Liao, M.C.; Huang, C.C.; Tsou, K.W. Evaluation of permeable friction course mixes with various binders and additives. J. Mater. Civ. Eng. 2013, 25, 573–579. [Google Scholar] [CrossRef]
  20. Andrés-Valeri, V.C.; Marchioni, M.; Sañudo-Fontaneda, L.A.; Giustozzi, F.; Becciu, G. Laboratory assessment of the infiltration capacity reduction in clogged porous mixture surfaces. Sustainability 2016, 8, 751. [Google Scholar] [CrossRef] [Green Version]
  21. Marzouk, M.; Elzayat, M.; Aboushady, A. Assessing environmental impact indicators in road construction projects in developing countries. Sustainability 2017, 9, 843. [Google Scholar] [CrossRef] [Green Version]
  22. Rodríguez-Fernández, I.; Lizasoain-Arteaga, E.; Lastra-González, P.; Castro-Fresno, D. Mechanical, environmental and economic feasibility of highly sustainable porous asphalt mixtures. Constr. Build. Mater. 2020, 251. [Google Scholar] [CrossRef]
  23. Eghtesadifard, M.; Afkhami, P.; Bazyar, A. An integrated approach to the selection of municipal solid waste landfills through GIS, K-Means and multi-criteria decision analysis. Environ. Res. 2020, 185, 109348. [Google Scholar] [CrossRef]
  24. Cao, W.; Wang, A.; Yu, D.; Liu, S.; Hou, W. Establishment and implementation of an asphalt pavement recycling decision system based on the analytic hierarchy process. Resour. Conserv. Recycl. 2019, 149, 738–749. [Google Scholar] [CrossRef]
  25. Torres-Machi, C.; Nasir, F.; Achebe, J.; Saari, R.; Tighe, S.L. Sustainability Evaluation of Pavement Technologies through Multicriteria Decision Techniques. J. Infrastruct. Syst. 2019, 25, 1–10. [Google Scholar] [CrossRef]
  26. Loc, H.H.; Duyen, P.M.; Ballatore, T.J.; Lan, N.H.M.; Gupta, A.D. Applicability of sustainable urban drainage systems: An evaluation by multi-criteria analysis. Environ. Syst. Decis. 2017, 37, 332–343. [Google Scholar] [CrossRef]
  27. Jato-Espino, D.; Yiwo, E.; Rodriguez-Hernandez, J.; Canteras-Jordana, J.C. Design and application of a Sustainable Urban Surface Rating System (SURSIST). Ecol. Indic. 2018, 93, 1253–1263. [Google Scholar] [CrossRef]
  28. Jato-Espino, D.; Indacoechea-Vega, I.; Gáspár, L.; Castro-Fresno, D. Decision Support Model for the Selection of Asphalt Wearing Courses in Highly Trafficked Roads. Soft Comput. 2018, 22, 7407–7421. [Google Scholar] [CrossRef] [Green Version]
  29. Saaty, R.W. The analytic hierarchy process-what it is and how it is used. Math. Model. 1987, 9, 161–176. [Google Scholar] [CrossRef] [Green Version]
  30. Shrestha, K.K.; Shrestha, P.P. Change Orders on Road Maintenance Contracts: Causes and Preventive Measures. J. Leg. Aff. Disput. Resolut. Eng. Constr. 2019, 11, 1–11. [Google Scholar] [CrossRef]
  31. Jiménez Ariza, S.L.; Martínez, J.A.; Muñoz, A.F.; Quijano, J.P.; Rodríguez, J.P.; Camacho, L.A.; Díaz-Granados, M. A multicriteria planning framework to locate and select sustainable urban drainage systems (SUDS) in consolidated urban areas. Sustainability 2019, 11, 2312. [Google Scholar] [CrossRef] [Green Version]
  32. Slebi-Acevedo, C.J.; Pascual-Muñoz, P.; Lastra-González, P.; Castro-Fresno, D. A multi-criteria decision-making analysis for the selection of fibres aimed at reinforcing asphalt concrete mixtures. Int. J. Pavement Eng. 2019, 1–17. [Google Scholar] [CrossRef]
  33. Zavadskas, E.K.; Turskis, Z.; Antucheviciene, J.; Zakarevicius, A. Optimization of Weighted Aggregated Sum Product Assessment. Elektron. Elektrotech. 2012, 122, 3–6. [Google Scholar] [CrossRef]
  34. Badalpur, M.; Nurbakhsh, E. An application of WASPAS method in risk qualitative analysis: A case study of a road construction project in Iran. Int. J. Constr. Manag. 2019, 1–9. [Google Scholar] [CrossRef]
  35. Hwang, C.L.; Yoon, K. Multiple Attribute Decision Making: Methods and Applications; Springer: Berlin/Heidelberg, Germany, 1981; Available online: https://www.springer.com/gp/book/9783540105589 (accessed on 14 August 2020).
  36. Zavadskas, E.K.; Kalibatas, D.; Kalibatiene, D. A multi-attribute assessment using WASPAS for choosing an optimal indoor environment. Arch. Civ. Mech. Eng. 2016, 16, 76–85. [Google Scholar] [CrossRef]
  37. Toosi, E.S.; Tousi, S.G.; Ghassemi, A.; Cheshomi, A.; Alaghmand, S. A multi-criteria decision analysis approach towards efficient rainwater harvesting. J. Hydrol. 2020, 582, 124501. [Google Scholar] [CrossRef]
  38. Vilutienė, T.; Zavadskas, E.K. The application of multi-criteria analysis to decision support for the facility management of a residential district. J. Civ. Eng. Manag. 2003, 9, 241–252. [Google Scholar] [CrossRef]
  39. Ghorabaee, M.K.; Zavadskas, E.K.; Olfat, L.; Turskis, Z. Multi-Criteria Inventory Classification Using a New Method of Evaluation Based on Distance from Average Solution (EDAS). Inf. Neth. 2015, 26, 435–451. [Google Scholar] [CrossRef]
  40. Wu, S.P.; Gang, L.I.; Mo, L.T.; Zheng, C.H.; Ye, Q.S. Influence of Fiber Types on Relevant Properties of Porous Asphalt. Wuhan Ligong Daxue Xuebao J. Wuhan Univ. Technol. 2006, 28, 50–52. [Google Scholar] [CrossRef]
  41. Afonso, M.L.; Dinis-Almeida, M.; Fael, C.S. Study of the porous asphalt performance with cellulosic fibres. Constr. Build. Mater. 2017, 135, 104–111. [Google Scholar] [CrossRef] [Green Version]
  42. Lyons, K.R.; Putman, B.J. Laboratory evaluation of stabilizing methods for porous asphalt mixtures. Constr. Build. Mater. 2013, 49, 772–780. [Google Scholar] [CrossRef]
  43. Chen, M.J.; Wong, Y.D. Porous Asphalt Mixture with a Combination of Solid Waste Aggregates. J. Mater. Civ. Eng. 2014, 27, 04014194. [Google Scholar] [CrossRef]
  44. Chen, J.-S.; Sun, Y.-C.; Liao, M.-C.; Huang, C.-C. Effect of Binder Types on Engineering Properties and Performance of Porous Asphalt Concrete. Transp. Res. Rec. 2012, 2293, 55–62. [Google Scholar] [CrossRef]
  45. Zhen, L.; Xiong, Y. Multiscale Chemico-Thermo-Hydro-Mechanical Modeling of Early-Stage Hydration and Shrinkage of Cement Compounds. J. Mater. Civ. Eng. 2013, 25, 1239–1247. [Google Scholar] [CrossRef]
  46. Massahi, H.A.; Koohifar, F.; Baqersad, M. Investigation of pavement raveling performance using smartphone. Int. J. Pavement Res. Technol. 2018, 11, 553–563. [Google Scholar] [CrossRef]
  47. Arrieta, V.S.; Maquilón, J.E.C. Resistance to Degradation or Cohesion Loss in Cantabro Test on Specimens of Porous Asphalt Friction Courses. Procedia Soc. Behav. Sci. 2014, 162, 290–299. [Google Scholar] [CrossRef]
  48. Frigio, F.; Stimilli, A.; Virgili, A.; Canestrari, F. Performance Assessment of Plant-Produced Warm Recycled Mixtures for Open-Graded Wearing Courses. Transp. Res. Rec. 2017, 2633, 16–24. [Google Scholar] [CrossRef]
  49. Liu, Q.; Yu, W.; Schlangen, E.; van Bochove, G. Unravelling porous asphalt concrete with induction heating. Constr. Build. Mater. 2014, 71, 152–157. [Google Scholar] [CrossRef]
  50. Mahmud, M.Z.H.; Hassan, N.A.; Hainin, M.R.; Ismail, C.R. Microstructural Investigation on Air Void Properties of Porous Asphalt Using Virtual Cut Section. Constr. Build. Mater. 2017, 155, 485–494. [Google Scholar] [CrossRef]
  51. Yu, T.; Zhang, H.; Wang, Y. Interaction of asphalt and water between porous asphalt pavement voids with different aging stage and its significance to drainage. Constr. Build. Mater. 2020, 252, 119085. [Google Scholar] [CrossRef]
  52. Rasool, R.t.; Hongru, Y.; Hassan, A.; Wang, S.; Zhang, H. In-field aging process of high content SBS modified asphalt in porous pavement. Polym. Degrad. Stab. 2018, 155, 220–229. [Google Scholar] [CrossRef]
  53. Lizasoain-Arteaga, E.; Indacoechea-Vega, I.; Pascual-Muñoz, P.; Castro-Fresno, D. Environmental impact assessment of induction-healed asphalt mixtures. J. Clean. Prod. 2019, 208, 1546–1556. [Google Scholar] [CrossRef]
  54. Abbe, O.; Hamilton, L. BRE Global Environmental Weighting for Construction Products Using Selected Parameters from EN 15804; BRE Global Ltd.: Hertfordshire, UK, 2017. [Google Scholar]
  55. Huppes, G.; van Oers, L. Evaluation of Weighting Methods for Measuring the EU-27 Overall Environmental Impact; Institute for Environment and Sustainability: Luxembourg, 2011. [Google Scholar]
  56. Lizasoain-Arteaga, E.; Castro-Fresno, D.; Flintsch, G.W. Effect of durability on fiber-reinforced asphalt mixtures sustainability. In Pavement, Roadway, and Bridge Life Cycle Assessment 2020, Proceedings of the International Symposium on Pavement. Roadway, and Bridge Life Cycle Assessment 2020 (LCA 2020), Sacramento, CA, USA, 3–6 June 2020; CRC Press: Boca Raton, FL, USA, 2020. [Google Scholar] [CrossRef]
  57. Rodriguez-Hernandez, J.; Andrés-Valeri, V.C.; Calzada-Pérez, M.A.; Vega-Zamanillo, Á.; Castro-Fresno, D. Study of the Raveling Resistance of Porous Asphalt Pavements Used in Sustainable Drainage Systems Affected by Hydrocarbon Spills. Sustainability 2015, 7, 16226–16236. [Google Scholar] [CrossRef] [Green Version]
  58. Opara, K.R.; Skakuj, M.; Stöckner, M. Factors affecting raveling of motorway pavements—A field experiment with new additives to the deicing brine. Constr. Build. Mater. 2016, 113, 174–187. [Google Scholar] [CrossRef]
  59. Tang, G.; Gao, L.; Ji, T.; Xie, J. Study on the Resistance of Raveling for Porous Asphalt Pavement. In Proceedings of the 2018 International Conference on Transportation Infrastructure and Materials (ICTIM 2017), Tianjin, China, 1–4 June 2018; ISBN 978-1-60595-442-4. Available online: https://www.mdpi.com/2071-1050/7/12/15812 (accessed on 8 May 2019).
  60. Gupta, A.; Castro-Fresno, D.; Lastra-Gonzalez, P.; Rodriguez-Hernandez, J. Selection of fibers to improve porous asphalt mixtures using multi-criteria analysis. Constr. Build. Mater. 2020, 266, 121198. [Google Scholar] [CrossRef]
  61. Gupta, A.; Rodriguez-Hernandez, J.; Castro-Fresno, D. Incorporation of additives and fibers in porous asphalt mixtures: A review. Materials 2019, 12, 3156. [Google Scholar] [CrossRef] [PubMed] [Green Version]
  62. Gupta, A.; Rodriguez-Hernandez, J.; Slebi, C.; Castro-Fresno, D. Improving porous asphalt mixes by incorporation of additives. Transp. Res. Arena 2020. [Google Scholar] [CrossRef]
  63. Tholibon, D.A.; Ariffin, J.; Abdullah, J.; Idrus, J. Experimental Evaluation of Anti-Stripping Additives on Porous Asphalt Mixtures. J. Teknol. 2016, 3, 1–6. Available online: https://journals.utm.my/index.php/jurnalteknologi/article/view/9502 (accessed on 15 May 2019).
Figure 1. Structure of the study.
Sustainability 13 02146 g001
Figure 2. Fibers used in the study: (a) Aramid fiber (ARA); (b) Aramid-Polyolefin fiber (ARA-POL); (c) Aramid Pulp (PULP); (d) Cellulose fiber (CELLU).
Sustainability 13 02146 g002
Figure 3. Cost of the asphalt mixtures (euro/tonne).
Sustainability 13 02146 g003
Figure 4. The percentage increment in impact on environment with respect to control mixture (BITU).
Sustainability 13 02146 g004
Figure 5. Explanation of the scoring system.
Sustainability 13 02146 g005
Figure 6. Relative weights according to Delphi method for (a) mechanical indicator; (b) environmental indicator; (c) indicators.
Sustainability 13 02146 g006
Figure 7. Mechanical indicators: relative scores AS (EDAS), CC (TOPSIS), Q (WASPAS). The dotted line indicates the average of the AS, CC, Q.
Sustainability 13 02146 g007
Figure 8. Environmental indicator: AS, CC, and JPS scores using EDAS, TOPSIS, and WASPAS methods, respectively. The dotted line indicates the average of the ASi, CCi, Qi.
Sustainability 13 02146 g008
Figure 9. Mechanical, hydraulic, and economic and environmental indicators: AS, CC, and JPS scores using EDAS, TOPSIS, and WASPAS methods, respectively. The dotted line indicates the average of the ASi, CCi, Qi.
Sustainability 13 02146 g009
Figure 10. Comparison of multi-criteria methods (a) TOPSIS Vs. WASPAS (b) TOPSIS Vs. EDAS (c) WASPAS Vs. EDAS.
Sustainability 13 02146 g010
Table 1. Evaluation based on distance from average solution (EDAS), technique for order of the preference by similarity to ideal solution (TOPSIS), weighted aggregated sum product assessment (WASPAS) methods.
EDASTOPSISWASPAS
Full form
Evaluation Distance from Average SolutionTechnique for Order Preference by Similarity to Ideal SolutionWeighted aggregated sum product assessment
1. Construct the decision-making matrix
X = [xij]mxn = [ x 11 x 12 x 1 n x 21 x 22 x 2 n x m 1 x m 2 x mn ]    (i = 1, 2, 3, …, m and j = 1, 2, 3, …, n)
Xij gives the performance of the ith alternative with respect to the jth criterion
2. PDA and NDA2. Normalize the decision matrix
Beneficial criteria
The positive distance from average (PDAij) and negative distance from average (NDAij) is calculated as:
PDA ij   =   max ( 0 ,   ( x ij   AV j ) ) AV j ,
NDA ij   =   max ( 0 ,   ( AV j x ij   ) ) AV j
x ¯ ij = x ij i = 1 m x ij 2 Beneficial criteria
x ¯ ij = x ij Max i ( x ij )
Non-beneficial criteria
PDA ij   =   max ( 0 ,   ( AV j x ij   ) ) AV j ,
NDA ij   =   max ( 0 ,   ( x ij   AV j ) ) AV j
AV j is the average solution according to all criteria j.
Sustainability 13 02146 i001
Non-beneficial criteria
x ¯ ij = Min i   ( xij ) x ij
3. Weighted normalized decision matrix
SP i = i = 1 n w j   PDA ij ,
SN i = i = 1 n w j PDA ij
Q i = i = 1 n w j     x ¯ ij
Where w j refers to the weight of jth criterion.
WASPAS is a combination of two methods Weighted Sum Model (WSM) and Weighted Product Model (WPM)
For   WSM For   WPM Q i 1 = i = 1 n w j x ¯ ij Q i 2 = j = 1 n x i j w j
4. Normalize the Matrix4. Positive and negative ideal solutions
NSP i   =   SP i max   ( SP i )
NSNi = 1 − SN i max   ( SN i )
Positive ideal solutions (Q+)
Q +   =   ( Q 1 + ,   Q 2 + ,   Q 3 + Q n + ) =   { ( max   v ij |   j     I ) , ( min   v ij |   j   J)}
Negative ideal solutions (Q)
Q   =   ( Q 1 ,   Q 2 ,   Q 3 , Q n ) =   { ( min   v ij |   j     I ) , ( max   v ij |   j   J)}
Where I relates to beneficial criteria; I = 1, 2, 3, …, m and J related to non-beneficial criteria j = 1, 2, 3, …, n.
Positive solutions ( d i + ) and negative solutions distance
d i + = j = 1 n ( Q ij Q j + ) 2
d i = j = 1 n ( Q ij Q j ) 2
5. Calculate the relative scores
Appraisal score (ASi)
AS i   =   1 2 (NSPi + NSNi)
Where 0 ≤ ASi
Relative closeness (CCi)
CC i   =   d i d i + +   d i
Joint Performance score (Qi)
Q i   =   λ Q i 1 +   ( 1     λ ) Q i 2
Where, λ   =   σ 2   ( Q i 2 ) σ 2 ( Q i 1 ) +   σ 2 ( Q i 2 )
Table 2. PA mixture gradation (PG-3).
Scheme 22.221684210.50.250.063
Passing (%)10010054.519.014.110.37.86.35.0
Table 3. Physical properties of the fibers.
FiberAramid-Polyolefin FiberAramid PulpAramid FiberCellulose
AramidPolyolefin
FormMonofilamentSerrated
ColorYellowYellowYellowYellowBrown
Density (g/cm3)1.440.911.441.390.48
Length (mm)19191–1.561.1
Tensile Strength (MPa)2758483 3200
Decomposition temperature (°C)>450157>450500
Acid/Alkali ResistanceInertInert
Table 4. Properties of materials used for the preparation of the sample.
PropertiesStandardsValueSpecification
Bitumen
Virgin bitumenPMB
Penetration (0.1 mm)EN-1426575550–70
Softening Point (°C)EN-142751.674.146–54
Frass Point (°C)EN-12593−13 ≤−8
Specific Weight (g/cc)EN-153261.0351.028
Coarse aggregates
Specific Weight (g/cm3)EN 1097-62.7878/4
Los Angeles (%)EN 1097-21514/10≤15%
Flakiness Index (%)EN 933-31212/6≤20%
Flakiness Index (%)EN 933-42018/12
Fine aggregates
Specific Weight (g./cm3)EN 1097-62.705
Sand equivalent (%)EN 933-878 >55
Hydrated Lime
Density (g/cm3) 1.959
CaO content (%) ≥90
MgO content (%) ≤5
CO2 content (%) ≤4
Remained on sieve 0.2 mm (%) ≤2
Table 5. Mixture types.
Mixture typesBITUPMBHYDLIMARA-POLPULPARACELLU
Type of Bitumen; Bitumen
Content (%)
Virgin bitumen; 4.5%PMB bitumen; 4.5%Virgin bitumen; 4.5%Virgin
bitumen;
4.5%
Virgin bitumen; 4.5%Virgin bitumen; 4.5%Virgin bitumen; 5%
Fiber; fiber
Content (%)
NoneNoneNoneAramid-Polyolefin fiber; 0.05%Aramid Pulp; 0.05%Aramid fiber; 0.05%Cellulose fiber; 0.5%
FillerLimestoneLimestoneHydrated limeLimestoneLimestoneLimestoneLimestone
Table 6. Parameters considered for mechanical indicator.
Mixtures/CriteriaCELLUARA-POLPMBHYDLIMARAPULP
PL—dry (% reduction)➚18.73➚10.65➚24.56➘6.46➚0.69➚58.82
PL—wet (% reduction)➚38.05➘94.68➚47.17➚30.21➚24.84➚55.04
ITS—dry (% rise)➚6.58➚10.52➚8.27➚18.98➚10.32➚0.87
ITS—wet (% rise)➚27.32➚21.71➚27.03➚11.41➘7.27➚13.39
Note: ➚ indicates the improvement in abrasion resistance (or reduction in particle loss) due to additives and ➘ the contrary. PL-dry and PL-wet refer to particle loss in dry and wet conditions; ITS-dry and ITS-wet refer to the indirect tensile strength test in dry and wet conditions. For reference mixture BITU, the values for PL-dry and PL-wet were 14% and 20.5%, respectively; for ITS-dry and ITS-wet, there were 982.2 kPa and 771.1 kPa.
Table 7. The hydraulic performance indicator for alternatives.
Mixtures/Criteria CELLUARA-POLPMBHYDLIMARAPULP
Percentage variation (%) ➘8.19➘1.64➘0.09➚0.16➚0.51➘4.92
Note: ➚ indicates the improvement in air voids due to additives and ➘ the contrary. The air void content of the reference mixture BITU = 21.4%.
Publisher’s Note: MDPI stays neutral with regard to jurisdictional claims in published maps and institutional affiliations.

