1. Introduction
It is a matter of fact that, during economic downturns, surviving enterprises are the ones, which tend to be stronger, more innovative, flexible, and productive than their competitors. However, the dramatic economic downturn caused by COVID-19 is very different to a classical economic crisis, with economic activity being in decline and affecting all economic sectors. The implementations of the lockdowns seen across the globe to prevent virus spread do not affect all economic sectors equally [
1,
2].
Modern economics, being at the advanced development stage in which so many processes and operational activities do not require a human presence, does not navigate through the crisis in a homogeneous way [
3] and the dogma about the survival of the strongest is no longer true. Weak companies continue to operate in such resilient sectors as e-commerce or software manufacturing—like, for instance, the indebted losing positions of IBM—while in sectors where the demand virtually went into a non-existent mode, even the strongest face major obstacles to maintain their positions during the drawdown (e.g., the largest energy company ExxonMobile reported operating losses every quarter in 2020 and its total debt increased by 50%). Furthermore, governments significantly distort crisis outcomes by instituting unseen measures to support businesses and individuals and, therefore, limit the number of bankruptcies and deepen the asymmetric crisis consequences. For instance, in the first half of 2020, the number of bankruptcies declined as compared to the previous year in USA, Germany, and France [
4]. However, it is clear that the COVID-19-induced crisis is leading to a significantly elevated insolvency risk, which is forecasted to increase by 25% in 2021 [
5].
In the conditions of the economic recession, the most valuable qualities of corporate management are the flexibility and the speed of business strategy adaptation [
6], which is the only sustainable way for companies to continue operations or even thrive and acquire competitors at lower prices. For an outsider, whether it is a tax authority, an investor, or a supplier, it is usually hard to judge the quality of corporate management and its ability to take the company through critical times due to the asymmetric nature of information [
7]. Ready-to-use financial statements can provide more information on the company’s financial soundness and potential crisis resilience. They help by providing a certain screenshot of the company’s stance before the crisis hit.
The analysis and assessment of Latvian companies’ financial health and their crisis resilience abilities are the main goals of the present paper. The background of this research concerns the need to obtain a broad understanding of the differences in the financial strength and sustainability of Latvian enterprises based on the industry, their location, and their size. Additionally, we put the findings into a global perspective by comparing the average levels of the financial ratios of Latvian and European companies, thus helping to understand how competitive Latvian businesses are and their riskiness level in the pan-European arena. The findings of this research aid in the detection of current problems for Latvian businesses and the recent trends applicable to the financial positions of Latvian firms, thus informing the formulation of recommendations for state policy to stimulate enterprise development in Latvia.
We assessed the sustainability of companies and their dynamics over five years (2015–2019) based on a number of indicators, such as equity ratio, liquidity position, margins, operating leverage, and others. With regard to financial soundness, high importance was assigned to liquidity management, debt burden, and fixed and variable cost management evaluation through operating leverage, which has been unfairly forgotten in the literature but which can provide hints about the riskiness of the business model and reveal exposures to fixed costs. Margins were also included in the evaluation, so the strength of pricing of Latvian companies was further assessed to better understand their competitiveness. The assessment was done at the levels of both industry and company. Additionally, we considered regional locations to determine whether there were significant differences between companies located in different regions and whether companies located in Riga looked more attractive thanks to operating in a more favorable environment.
Additionally, we studied whether Latvian companies had learned the painful lesson induced by the financial crisis of 2008. The crisis heavily affected the economy, with GDP declining by 14% in 2009, and caused a wave of corporate bankruptcies, of which the number in 2009–2010 exceeded the number in 2011–2015 by threefold [
8]. We analyzed whether there was any tendency to decrease leverage ratio to reduce reliance on external financing.
The present research paper provides an insight into previous studies on firms’ crisis resilience characteristics and on financial management in crisis conditions, focusing on financial ratios. Additionally, we reviewed available studies on the estimation of corporate bankruptcies during the COVID-19 pandemic, as well as studies that have investigated the factors, which are imperative for a company to survive in a critical environment. The review of previous research is followed by a section on methodology and a discussion providing an overview of Latvian companies’ resilience and an evaluation of the development of financial conditions. The findings of the research are summarized in the conclusion, which is followed by recommendations.
2. Enterprise Resilience Concept
The concept of resilience is mainly referred to the organizational ability to create and preserve competitiveness. This is the main distinctive feature between the long-term success and survival as contrasted to the failing ones [
9,
10]. Looking deeper at the ‘competitiveness’ concept, one can turn to its comprehensive explanation, which includes three dimensions: competitive performance, competitive potential, and firm capabilities relevant to competitiveness [
11]. The latter two involve primarily subjective evaluation, but the performance dimension includes features that allow for the precise measurement: market share, export share, profit margin, return on capital, survival, growth, and productivity. Corporate growth, profit margins, and capital returns are readily available in financial reporting, which we consider also within the scope of the present research. Particularly, we focus on the pricing power of the enterprise as the main result of the competitive advantage [
12]: in case the provided product or service is having a competitive advantage, the company is a price-giver, charging premium prices, which translates into the above average profit margins.
Naturally, the competitive advantage should be constantly defended as the business niches with high margins soon become very crowded, unless the monopolistic position cannot be shaken given extremely high entry barriers. Thus, the company’s management should constantly think of innovations, launching new services or products, to be able to continue with premium pricing. Alternatively, it can go to process innovation to become the cost leader, which would again translate into higher margins. It is worth noticing that the indirect effect of innovation on the firm’s profitability is even higher as compared to the direct impact [
13].
To judge whether the innovations are part of the corporate strategy, it would be necessary to evaluate if the company invests in research and development process (R&D) and if it carries intangibles assets on its balance sheet [
14,
15]. For consumer products or services company, marketing expenses also play a great role in building a brand and, therefore, competitive advantage.
Then, attention should be also given to the company’s liquidity position as well as to the company’s dependence on external financing, as this would be an indication if the company has a sufficient ability to finance its innovation and brand building to be able to operate sustainably. High corporate leverage undermines the corporate financial stability position, increasing debt servicing and bankruptcy risk. Additionally, companies tend to finance R&D costs with their internal capital [
16], so there should be enough funds ensured to leverage on R&D and create competitive products. On the other hand, in case the company is overcapitalized, then it may restrain its growth pace [
17]. Thus, the optimal capital structure for a particular company in a particular business niche and life cycle should be determined by the company’s management.
Short-term resilience concept is tightly connected with the firm’s cyclicality, i.e., its exposure and sensitivity to economic shocks. According to Petersen and Strongin [
18], durable goods industries are three times more cyclical than non-durable goods industries influenced by labor, hoarding, and market concentration, among other factors.
3. Resilience during Demand Crisis
Above average margins and investments in R&D obviously are the primary indicators to consider when you want to find the most resilient and sustainable companies in the long-term. However, the competitive advantage comes from the background, when the demand slides to basically non-existent mode under the pressure of external factors, which was the case during the lockdowns imposed due to the pandemic spread. In this case, the front role is given to the share of fixed costs in total costs and the degree of the company’s operating leverage. Additionally, soft factors, such as speed of business model adaptation and flexibility of operations, become crucial for the company’s survival even in the short term [
6]. Thus, the imperative role in successfully navigating crises is assigned to the corporate management. Interestingly enough, according to the findings of Deloitte research [
19], only half of corporate managers consider the necessary preparations for the crisis, even if they are warned about it in advance. One of the explanations of this phenomenon is management’s biased optimism, when they think that the crisis will not happen to them, while it happens to their peers, and additionally, there are clear alerts popping up. Short-termism in corporate management’s thinking is a widespread problem rooted for a long time, which does not stimulate the management to be prepared for tail events, which are of low probability but have a massive effect, often being fatal for the enterprise [
20]. Jüttner and Maklan [
21] and Ponomarov and Holcomb [
22] point out that the success of the organization is determined by the readiness and response to crisis events. The response quality and, therefore, further recovery depends on the company’s business “health”, which is determined by its operation flexibility, long-term thinking, and developed growth strategy [
23].
Although not much time passed since COVID outbreak, there appeared a number of studies dedicated to the assessment of the liquidity and solvency of enterprises and particularly within the SME sector, which is less resilient to external shocks due to lower liquidity buffers and weaker ability to get financing. It is concluded in studies that it does not matter how efficient or innovative the company is, if it operates in the most affected sector, the chance for survival diminishes regardless of how often the management appears in the media to announce that they will emerge even more competitive after the crisis [
24]. Guerini et al. [
25] simulate that the number of insolvencies will increase by 80% from the usual 1.8 to 3.2%, noting that the most significant problems will be experienced by hotels and restaurants, household services, and construction services. Wholesale and retail trade, as well as manufacturing firms, will be also affected, but the scale of problems will be relatively limited. Bosio et al. [
26] made a simulation on 7000 companies in several countries with regard to their survival time: under the assumption that firms have no incoming revenues and cover only fixed costs, the median survival time across industries ranges within 8 to 19 weeks, while on average, firms have liquidity to survive between 12 and 38 weeks.
The figures look dramatic, but they could increase even higher in case the economic recovery would be slower than expected. However, McKinsey [
27] believes that corporate focus on certain aspects would help companies to survive during crises and emerge even stronger. The most crucial is the focus on the employees by launching a high-speed skilling programs with major emphasis on digital, higher cognitive, social and emotional, and adaptability and resilience. Gulati et al. [
28] analyzed the 4700 companies that experienced three major global recessions, saying that only 9% companies are poised to win. These were not the ones who have cut costs faster than competitors, or the ones who have invested heavily in gaining market share. However, the ones that successfully combine offensive and defensive moves are those who have reexamined every aspect of their business and improved operational efficiency.
4. Research Design
4.1. Data Sample
Based on the data provided by the information service company Firmas.lv, we have built a database consisting of the data for 27,500 companies with the turnover exceeding EUR 145,000 to be able to judge on the quality of Latvian enterprises’ financial health on their competitiveness potential. The selected period included the maximum period available and spanned over 5 years starting with 2015 until 2019. The analysis has been done on several dimensions:
(1) Based on industries to detect differences in resilience and in the quality of financial conditions.
(2) Based on the size of companies, as large companies usually have better access to resources than the smaller ones and, therefore, tend to be more productive. Size of the company was determined based on European Commission definition [
29], splitting the companies into size clusters based on the number of employees and on the amount of revenue.
(3) Based on the region the company operates in, as location of the headquarters also has its relevance to the operating results, predominantly because of two factors: access to talent and access to financing. Additionally, location might influence logistics processes, access to the consumer market, and other important aspects of the firm’s activity.
The turnover threshold of EUR 145,000 was selected to exclude the smaller companies with low number of employees and low turnover, as they have a negligible influence on the national economy. Thus, the selected companies provide a representation of more than 94% of the aggregate turnover of companies in Latvia.
To have a longer history of data and to be able to compare the financial stability of the companies prior to the crisis of 2008/09, we have also used the Amadeus database to complement our data sample.
4.2. Methodology
We have considered classical ratios used to determine the financial stability of the enterprise, such as equity ratio, interest coverage, long-term debt, share in total debt, and liquidity ratios. Additionally, less widespread, but of no lesser importance, three more ratios have been considered. One of them is the net debt to earnings before interest and tax (EBIT), which allows us to assess how large a company’s total debt less cash is versus the operating profit of the company.
In the context of this ratio analysis, we have also calculated the share of companies having negative net debt and the share of companies having operating loss, which were also put in the historical perspective to evaluate the dynamics of these debt burden and operating failure indicators.
The second ratio taken was equity capital sufficiency, which indicates if the business entity is financed in a way that ensures its sustainable development. The ratio was developed taking into account asset financing rules: long-term capital should take responsibility for less liquid assets [
30]. Sufficient equity index for the present research purposes was calculated according to the following formula
The interpretation of the obtained results was done according to the following logics: if it is significantly above 1, it should be considered that the company has too low debt, which needs to be increased to raise the shareholder’s value. In case the index tends to be substantially below 1, then the balance sheet might be considered highly levered, and the management should think about decreasing its total debt in the capital structure. Within the present research, the deviation of 0.2 from the value of 1 was an acceptable level to be considered that the company has sufficient equity financing.
Evaluation of the financial conditions, soundness, its liquidity position, and ability to cover short-term debt are the key aspects of the company to understand how resilient it could be during the next economic slowdown. However, a company’s operating leverage would be even more important to consider. It could provide a hint of how fast the profitability of the company will deteriorate in case of revenue decline, as the main focus of this ratio is the burden of fixed costs: in case they are responsible for the high share in total costs, the company may get into trouble when it faces a drop in sales. Operating leverage should always be in the center of corporate management attention given the fact that high fixed costs and the inability to cut them down can be critical for business survival during an economic downturn. Degree of operating leverage is calculated by dividing the operating earnings growth by sales growth. We have taken a 2-year growth in turnover and in net profit to smoothen the effect of non-recurring earnings, which might appear on the company’s profit and loss statement.
Degree of operating leverage should be considered in the context of a company’s cyclicality, that is, its dependence on the economic cycle; defensive companies, although having high operating leverage, will not be significantly affected by the ultimate economic slowdown.
Competitive advantage of the company is by far the most important indicator if the company’s sustainability in the long-term. Thus, we have also included gross and operating margin calculations in the methodology to see how significant the purchasing power is, which is a proxy of competitive advantage of Latvian companies and how did it change within the past years. Innovations also contribute to the corporate competitive advantage, and therefore, we have looked at companies based on this dimension as well to determine how many companies and within which industries tend to invest in intangible assets.
Certain ratios calculated within the scope of the research have been compared with the respective ratios of European companies, which are constituents of European stock index Stoxx 600. For this purposes, the data on Stoxx 600 included companies were extracted from Bloomberg terminal. It should be noted although that there is a certain limitation with respect to the comparison methodology, and data availability as a broad sample of Latvian companies was compared to large exchange-traded European companies. Although this is not a completely objective comparison, it might provide a general understanding of the difference in the levels of certain ratios. Median levels of European companies’ ratios are presented in
Appendix J.
We have applied benchmarking as one of the methods in the analytical process as well as quartile analysis, which allows to see the dispersion among the companies.
5. Results and Discussion
5.1. Competitive Advantage and Crisis Resilience
5.1.1. Margins
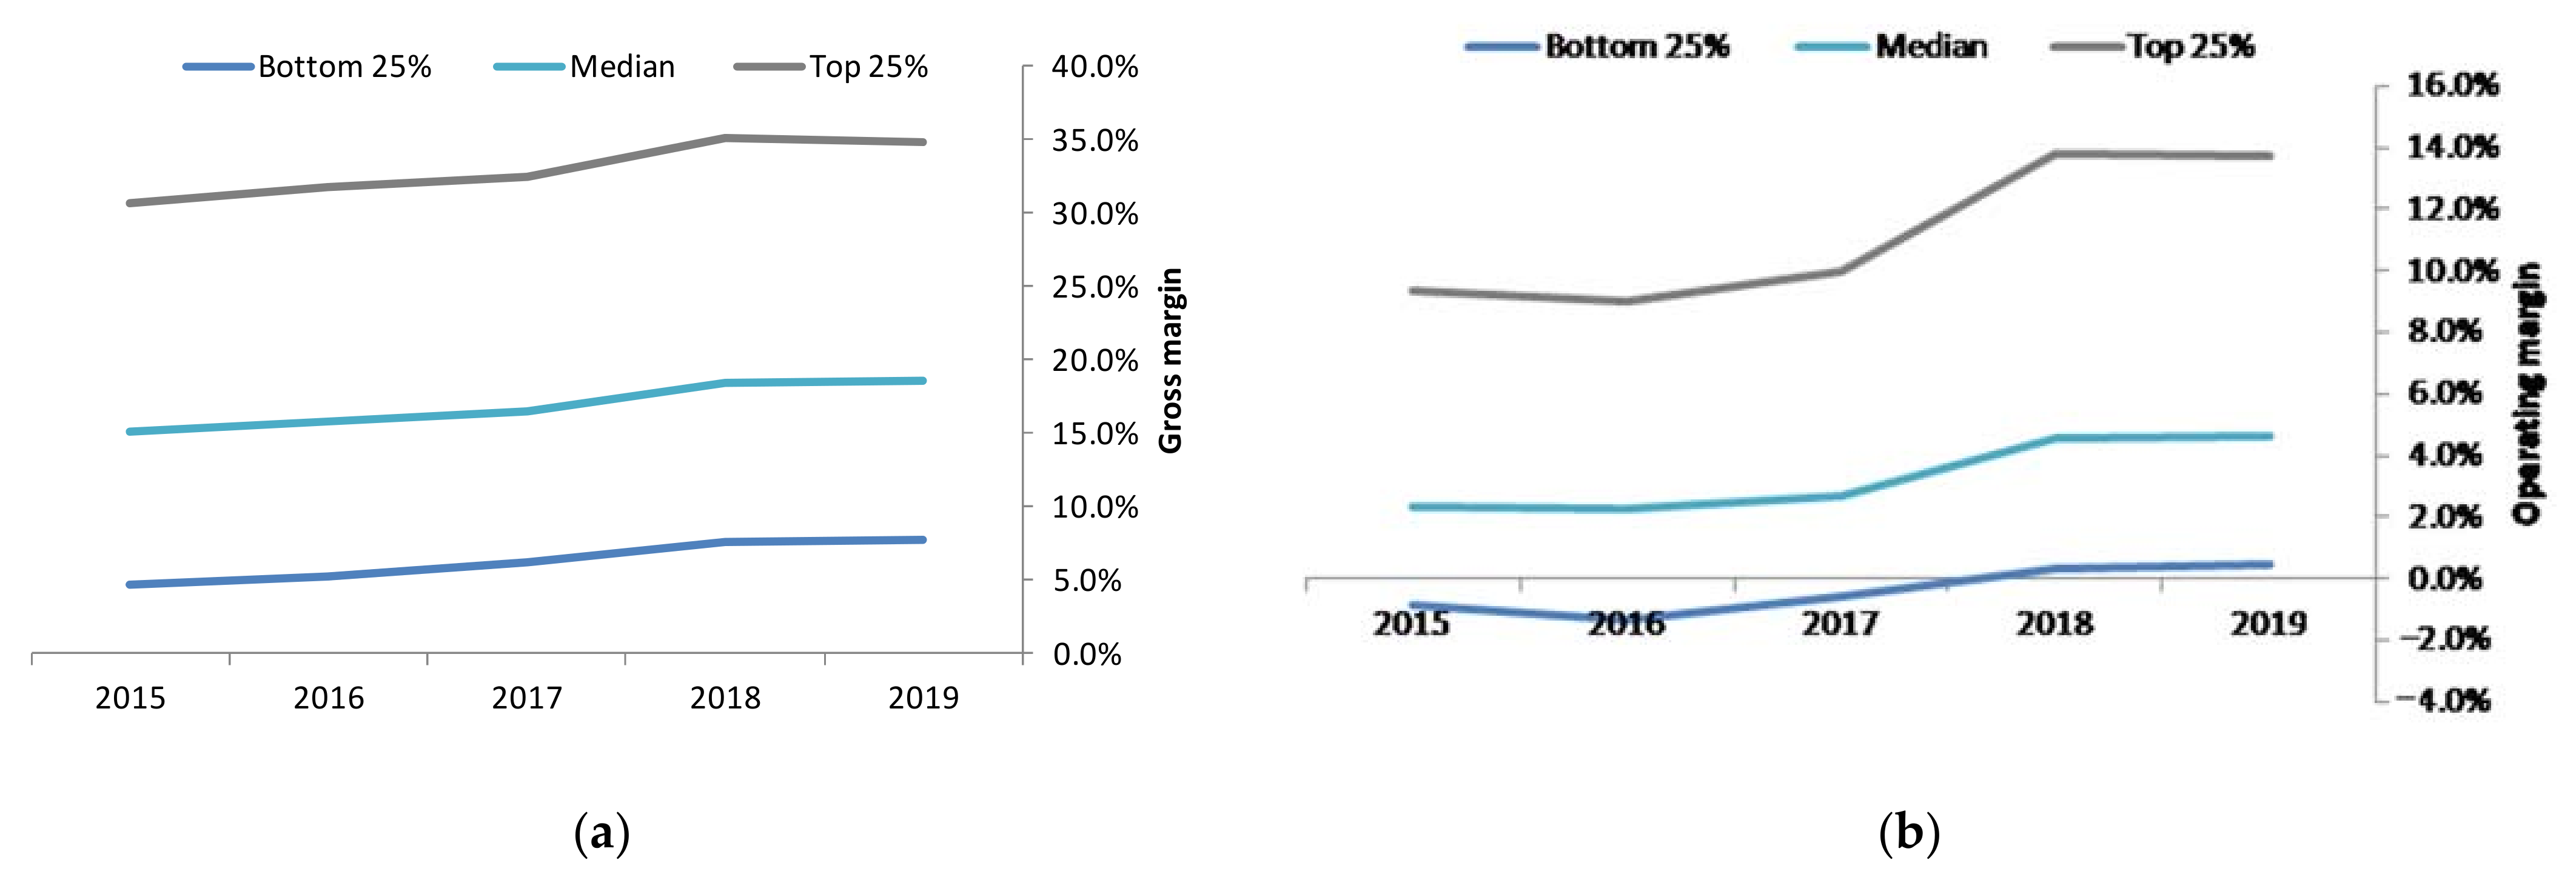
In general, we see a positive trend with regard to the margin improvement attributable to all levels (
Figure 1). Particularly, steep improvement in the profit margin is well seen in the period of 2018–2019, encouraged by the tax legislation. The diversity in margin levels among sample companies is significant: most profitable companies have a net profit margin above 14%, while the median sample level is slightly above 4%. It is worth noticing that the difference between operating margin and net profit margin levels is negligible for all quartiles, indicating that the majority of companies have relatively low interest expense and income tax expenses. The margins of Latvian companies sit on a very low level, being almost three times lower than the average level of European companies’ margins. To compare, the gross margins of European companies are 43%, while the operating and profit margins are 13 and 10%, respectively. A two- and even three-fold difference in profitability indicates a substantial gap in the competitiveness of the business models.
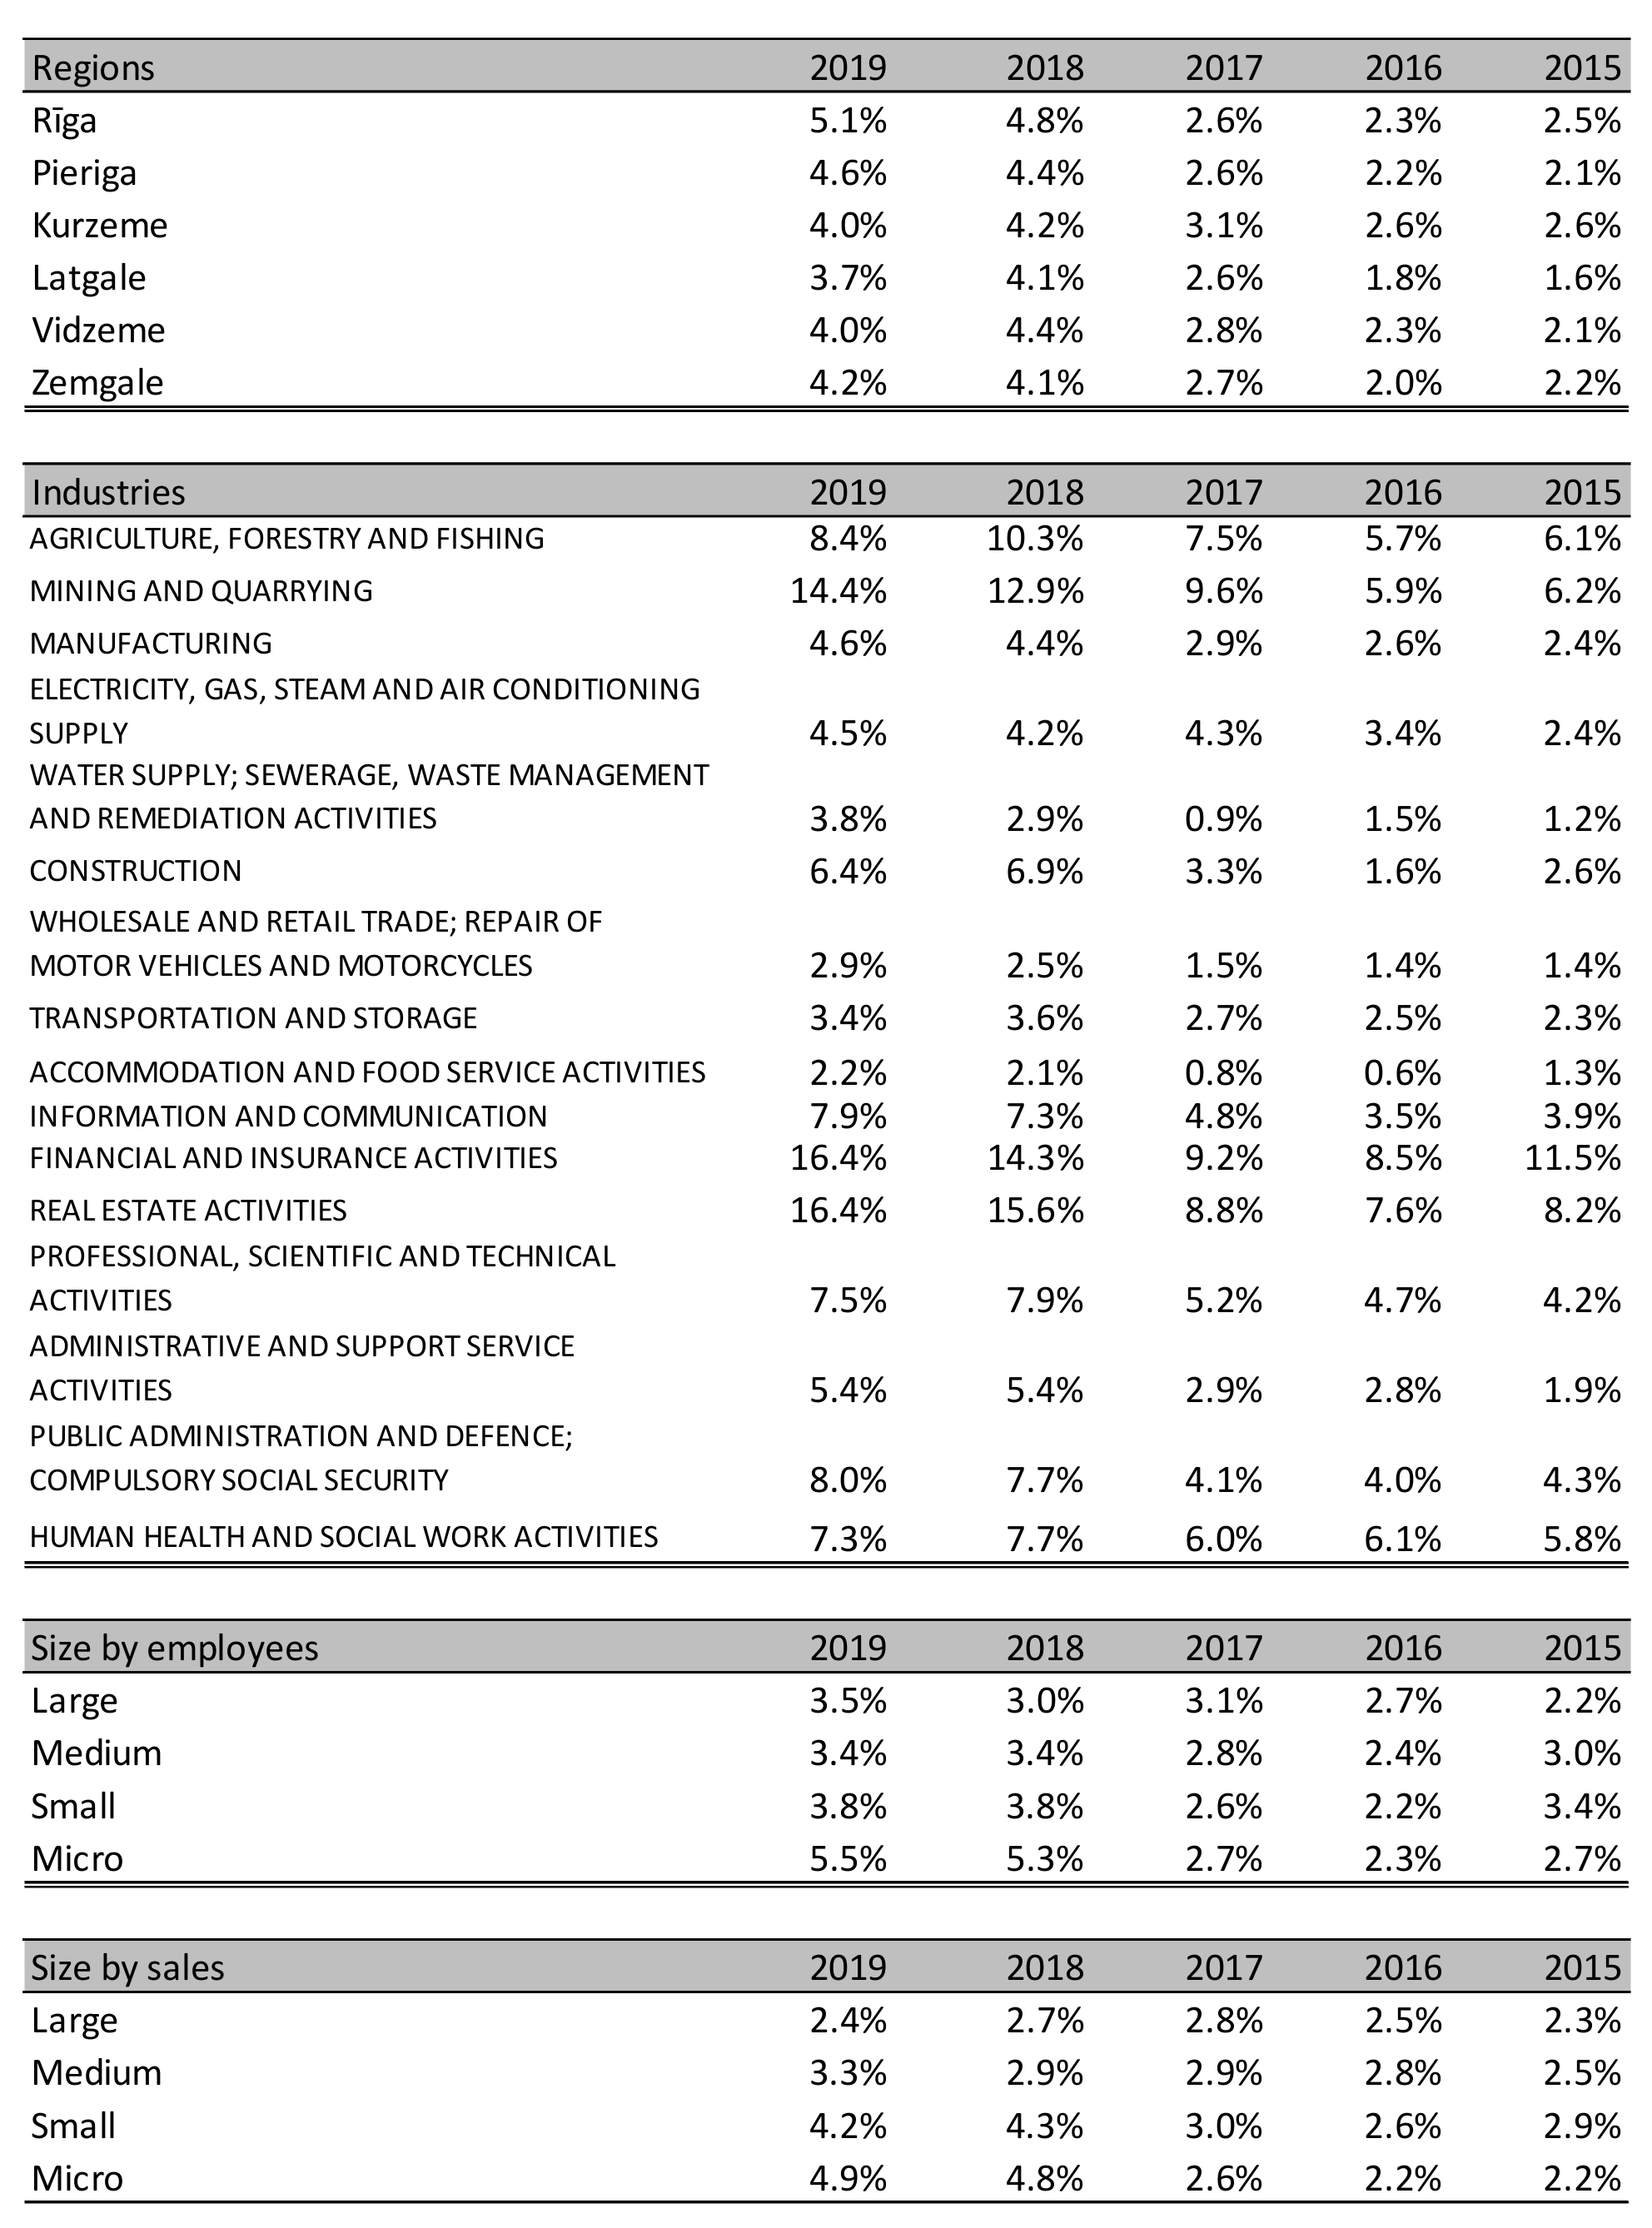
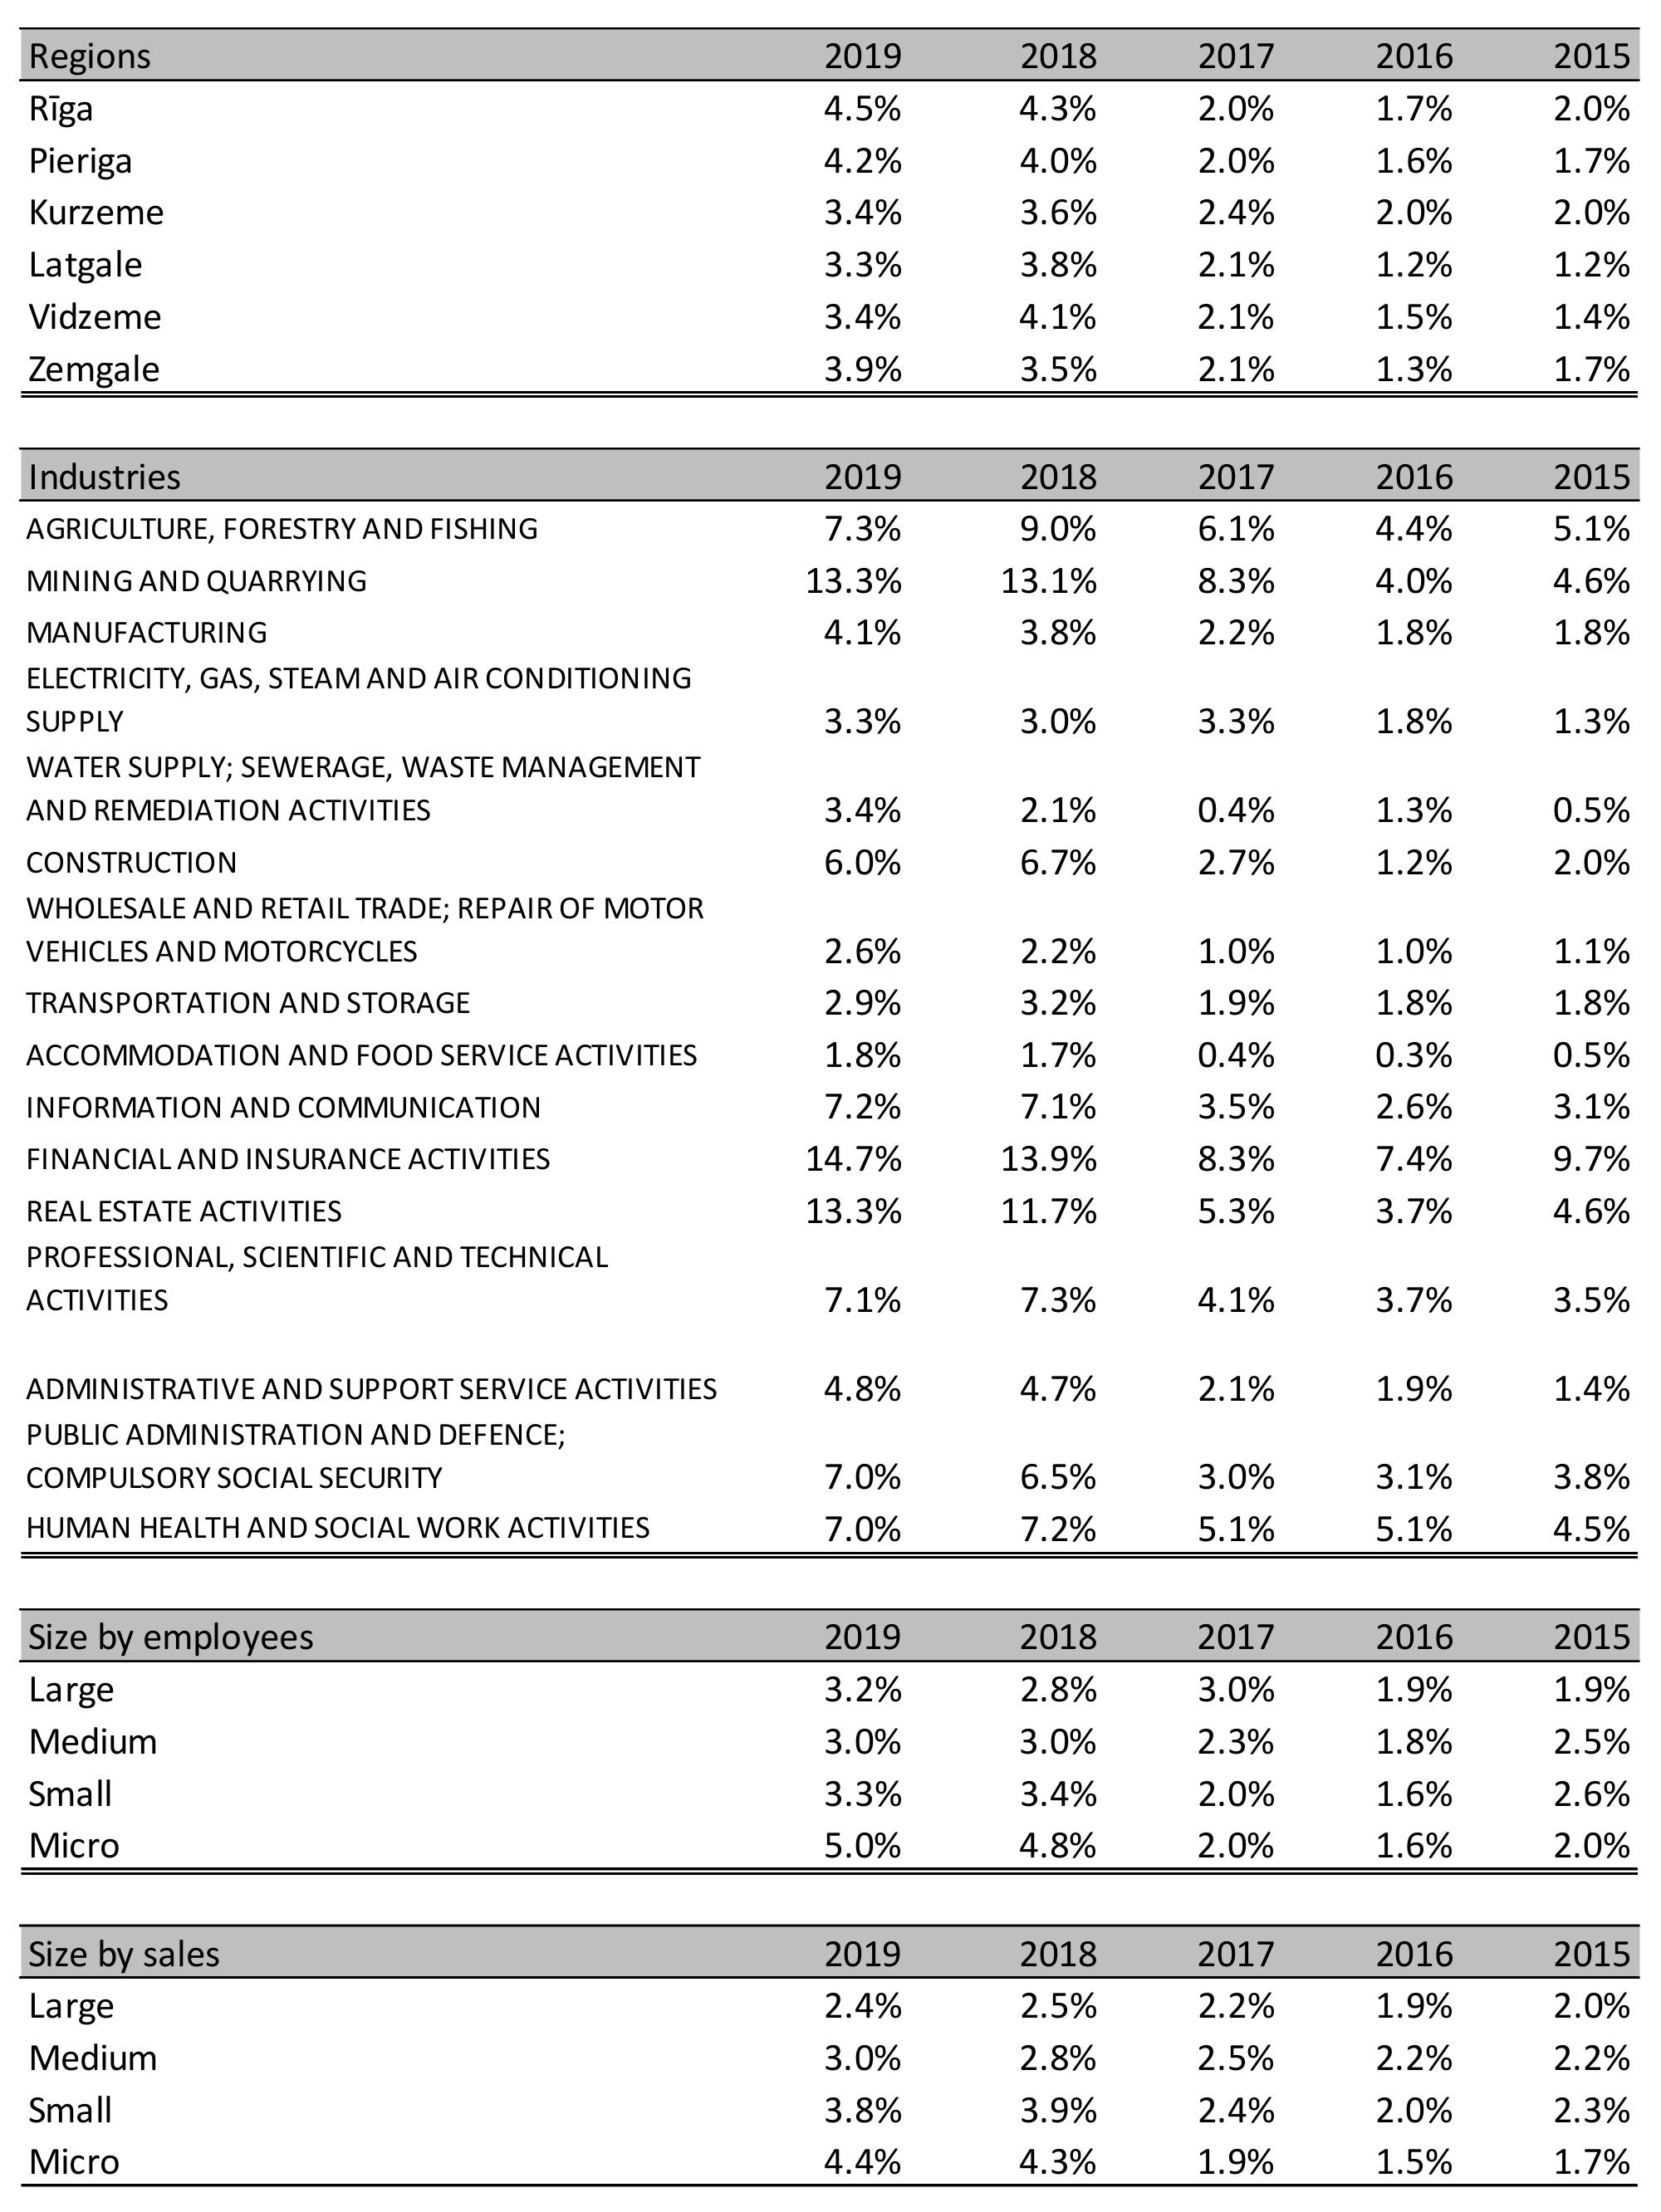
Highest operating profit margin is observed in three industries: mining/quarrying, financials, and real estate. They are followed by the agricultural industry, IT, and professional service providers. The lowest margins are produced by the accommodation and food service companies, transportation industry, and wholesale and retail industry. It is very typical, however, for the latter to have low margin business [
31]. For instance, in Europe, the margins in retail are 2–3%. Low margins usually indicate very high competition in the industry and, therefore, a lack of competitive advantage.
On the regional dimension, we see that the highest margins are generated by the companies located in Riga, while the lowest ones are earned by the companies located in Latgale. Micro-companies, according to the obtained research results, have the highest earnings margins compared to the larger companies (
Appendix A).
5.1.2. Intellectual Property and Intangibles
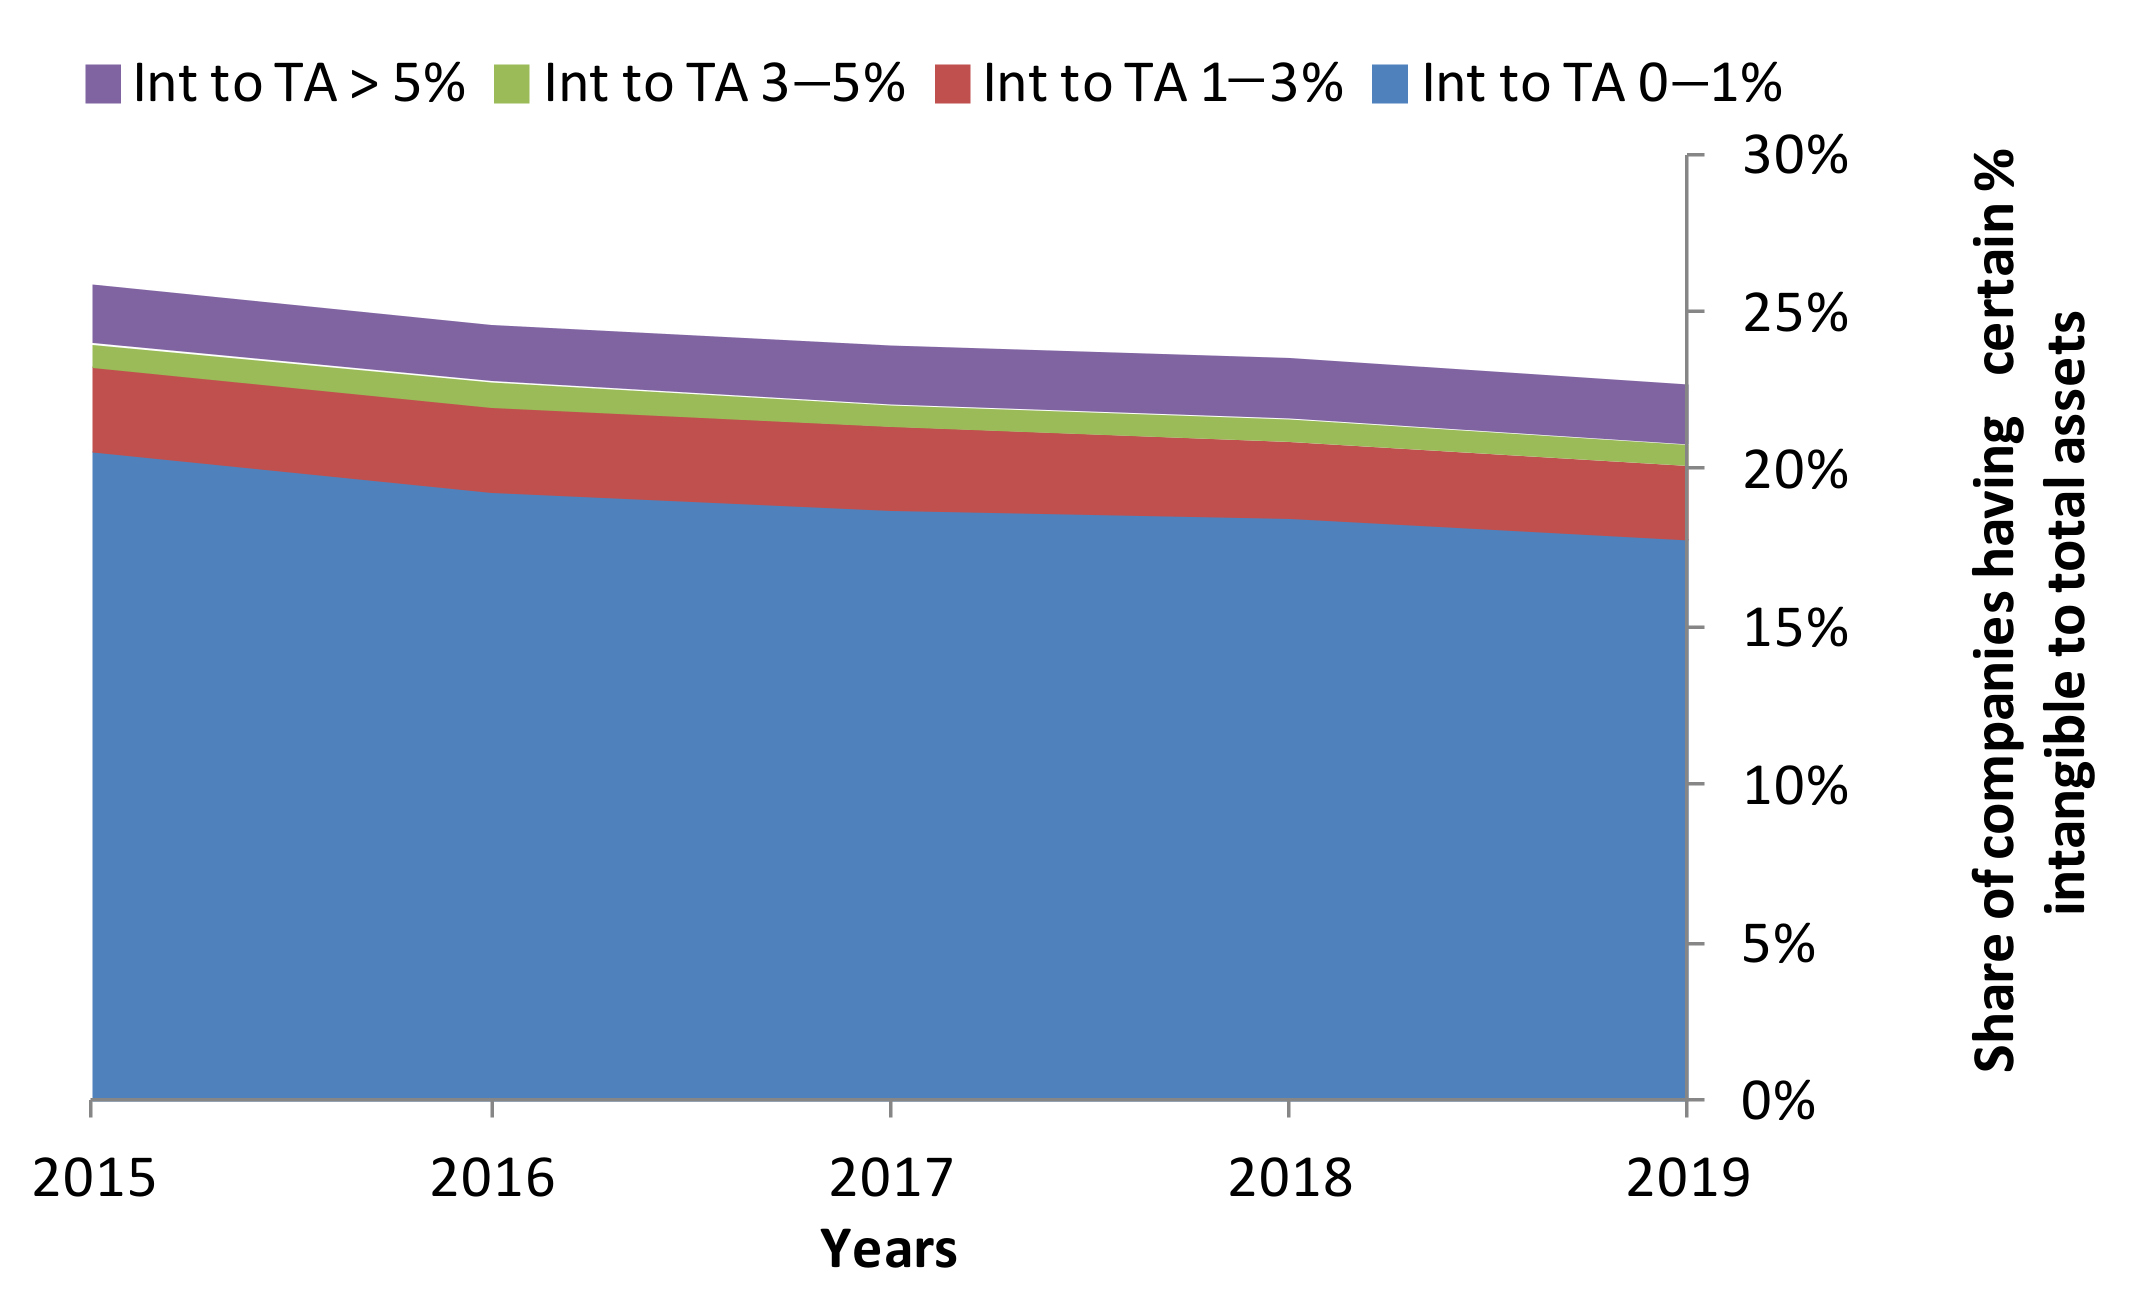
Continuing on the competitiveness potential of the entities, we have examined the importance of intangibles assets for Latvian companies, which are considered one of the determinants of enterprise innovativeness potential. The obtained results appear to be quite pessimistic as since 2015 there has been a declining trend in the number of companies reporting intangible assets (
Figure 2). In 2019, intangibles were reported by 5072 companies, which is 22.7% of the sample. The majority of those, which invest in intangible assets, have a very minor share of them versus total assets, not exceeding 1%. The highest intangibles are more likely to be found on the balance sheets of the companies located in Riga and on the balance sheet of the companies operating in the trade, IT, professional services, and manufacturing industries.
Putting the development of Latvian companies with regard to the intangible assets in the context of European business landscape, it can be clearly seen that Latvian firms are just in the beginning of their journey. Stoxx 600 companies in average have 17% of intangibles to total assets, while only a sixth of the sample has intangible assets of less than 1%.
5.1.3. Capital Returns
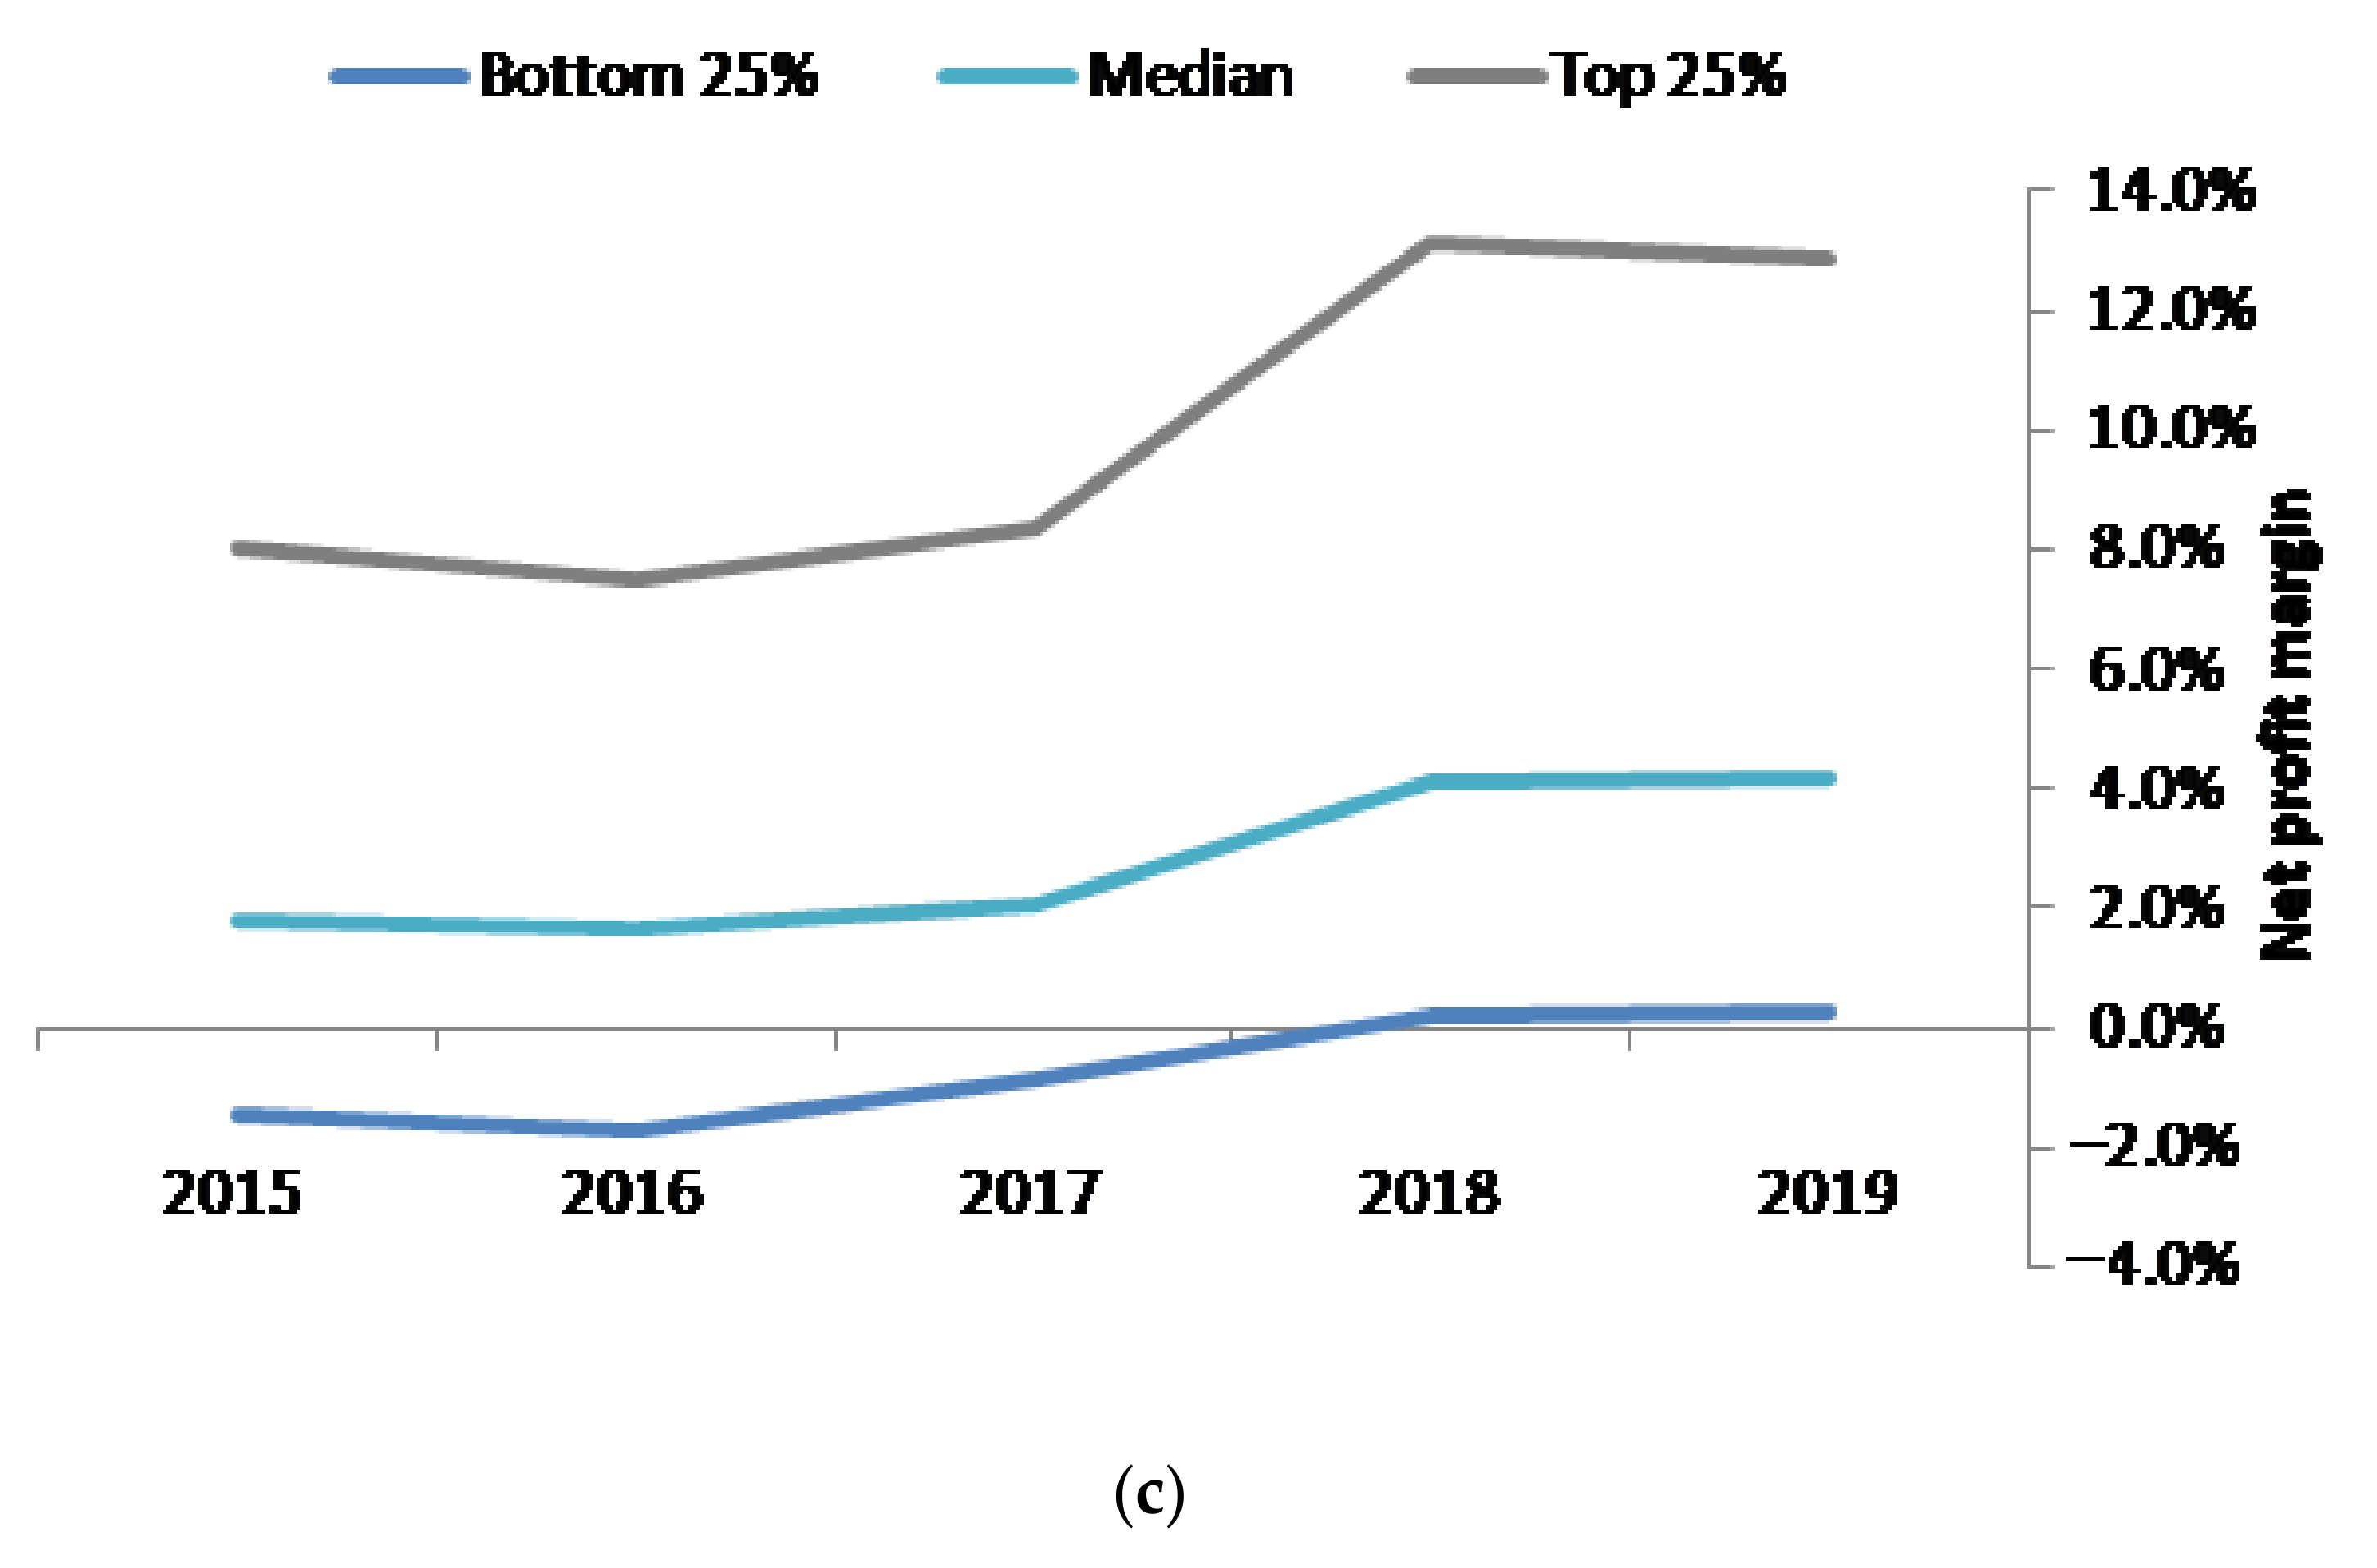
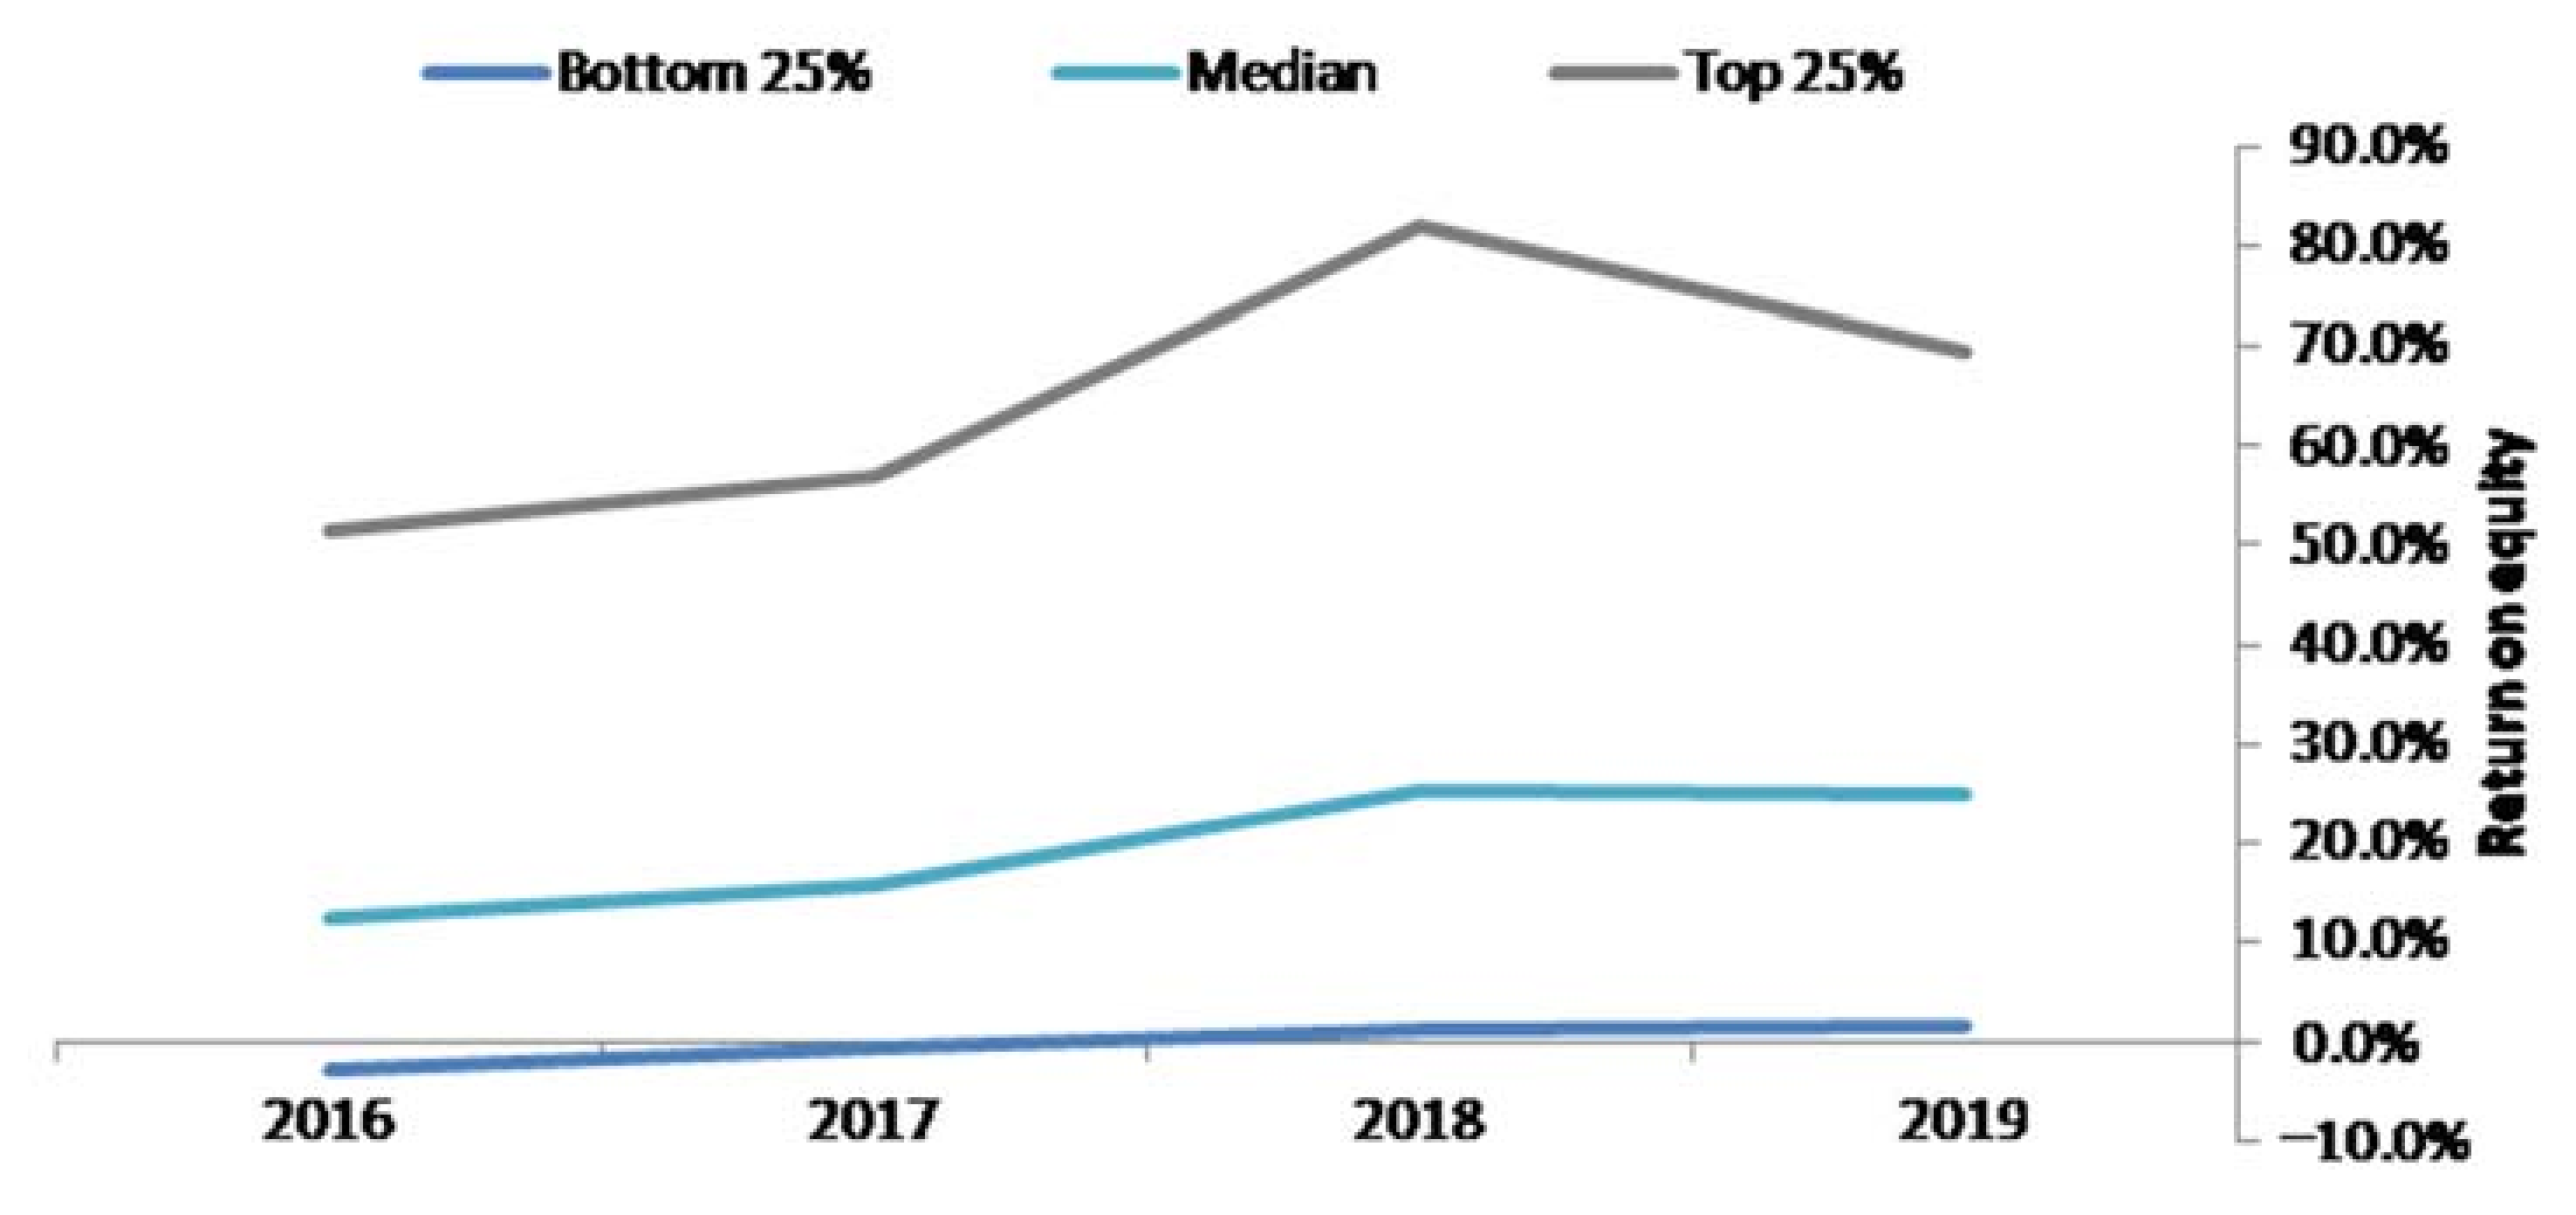
Throughout the selected research period, a clear upward trend in equity capital returns was seen until 2019 (
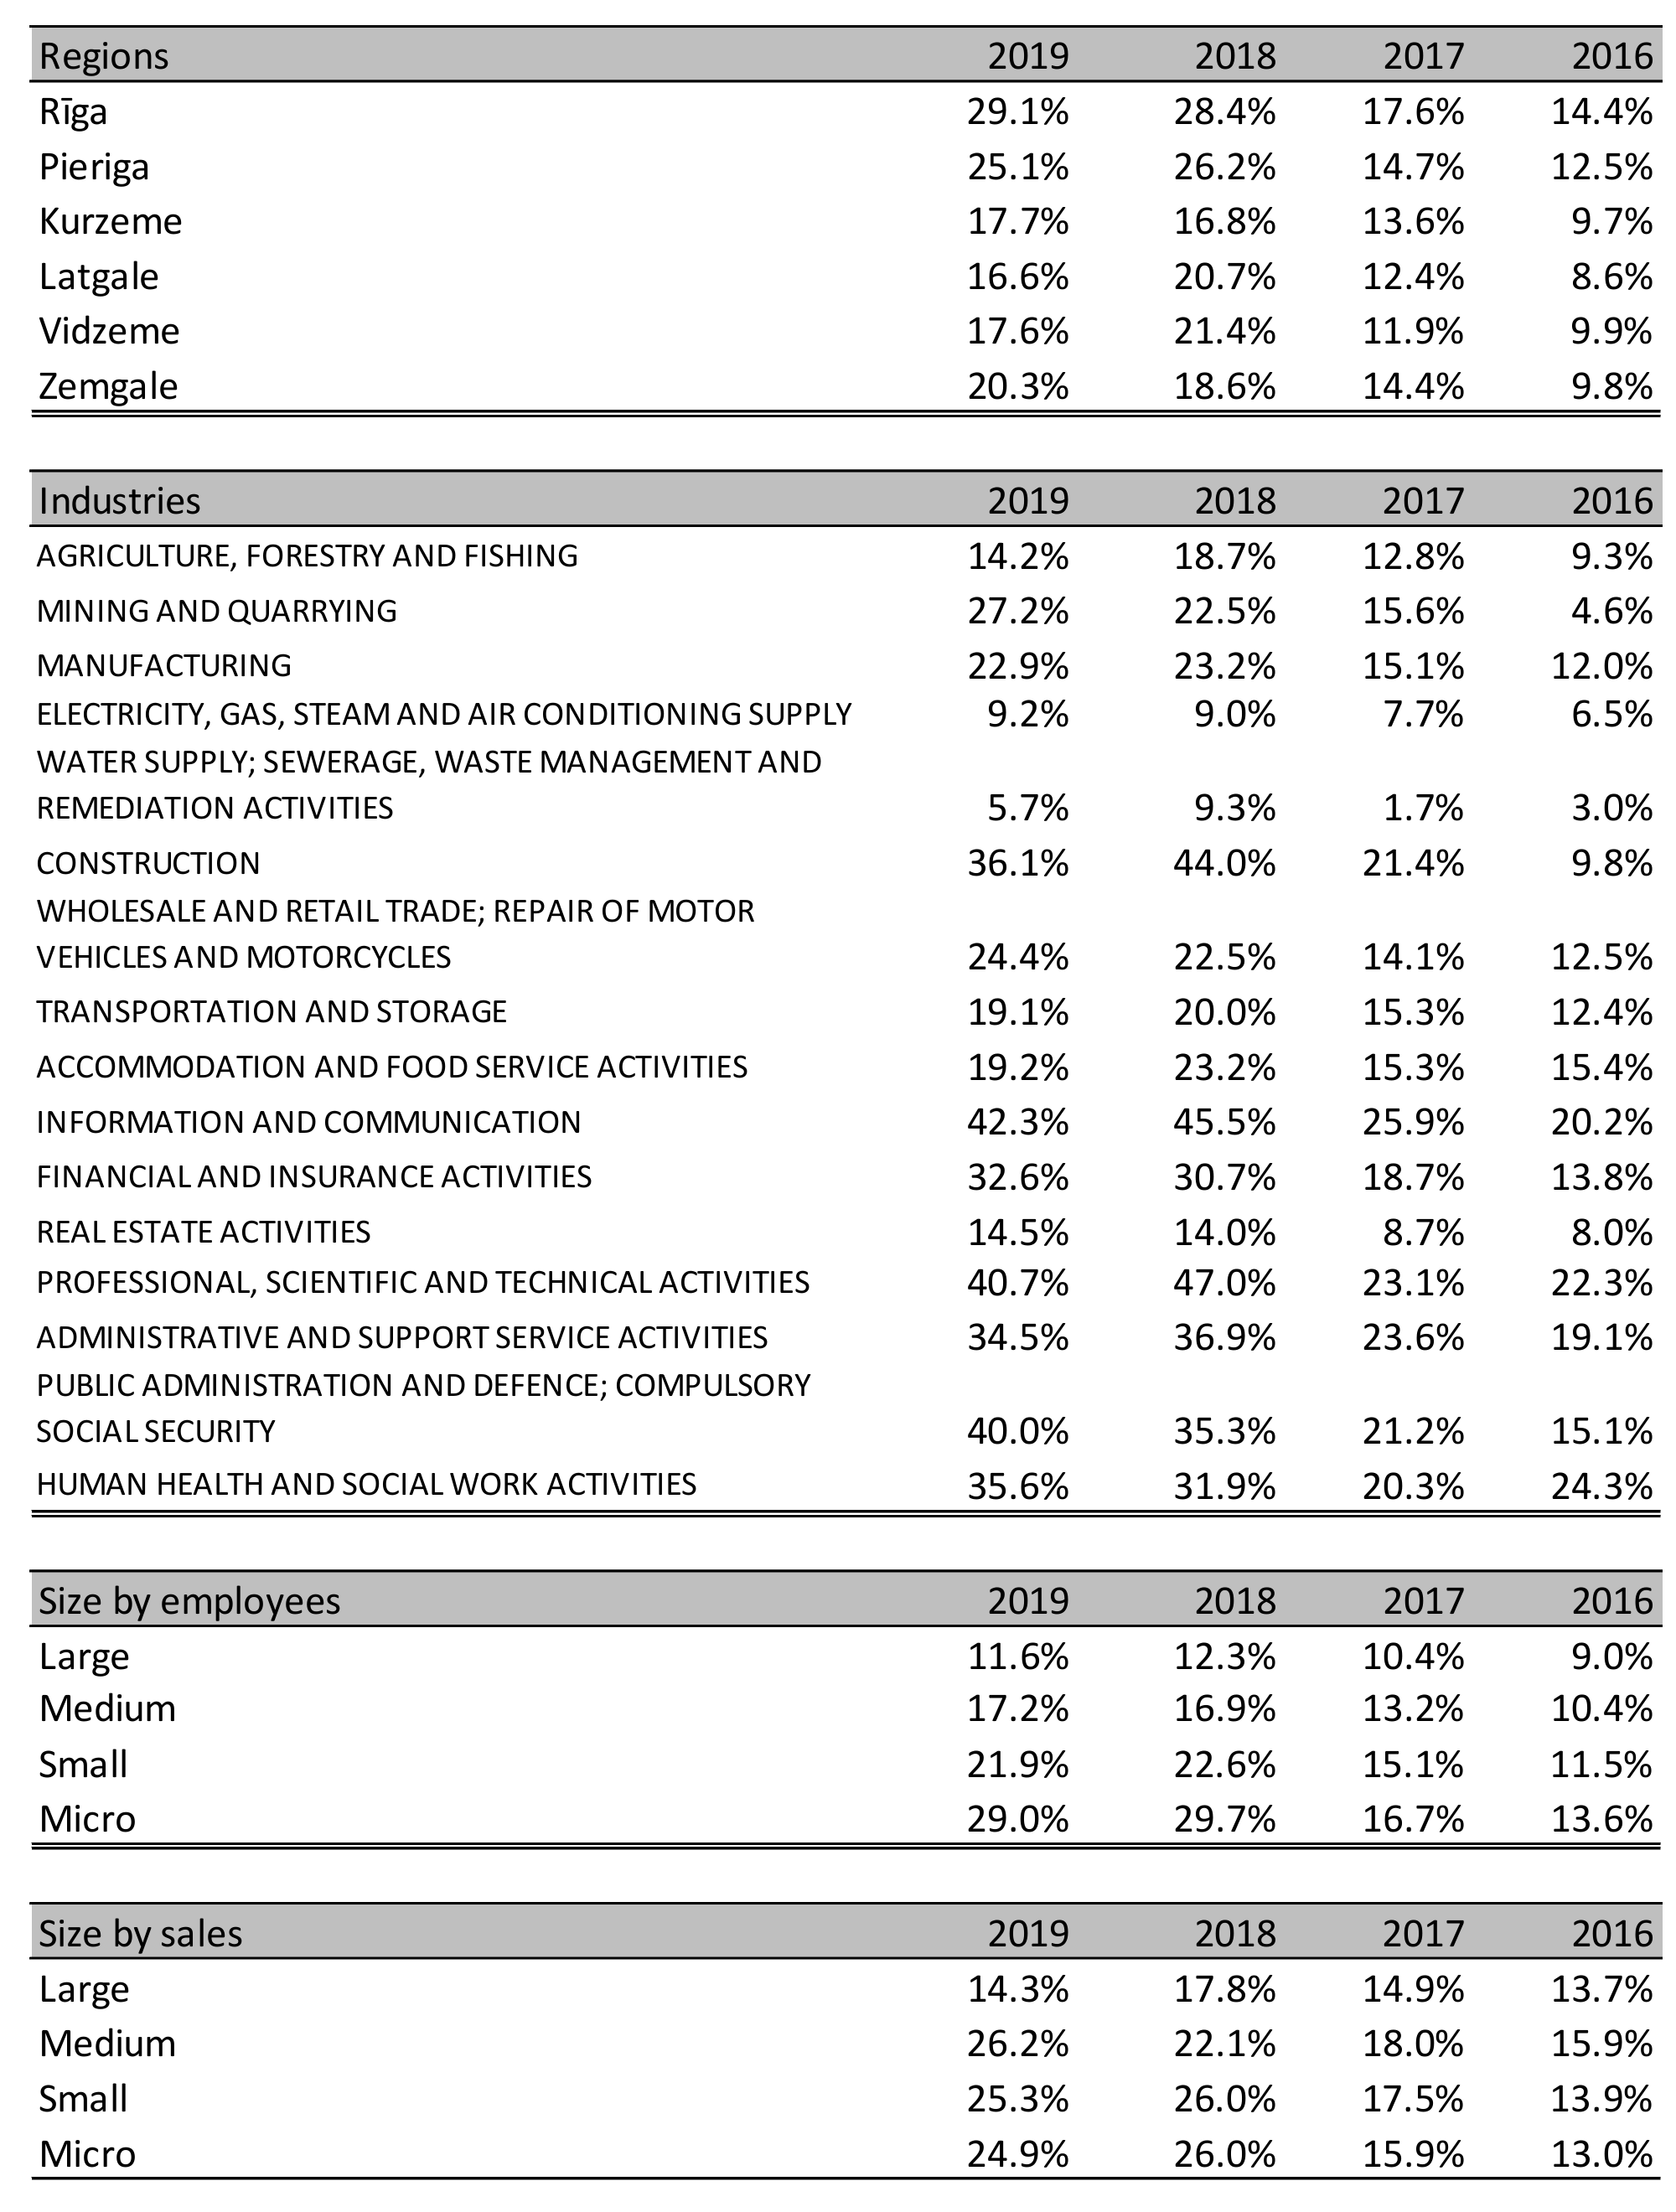
Figure 3). The data sample companies seemingly increased their efficiency in terms of business model management, which has been also supported by external factors, such as fiscal policy and favorable macroeconomic development. Return on equity (ROE) median level sits on a decent level being close to 25%, which is two times higher than the average ROE level of European firms.
Clearly, the highest levels are seen among Riga-based and Riga-district-based companies, while lower levels are observed in Latgale. Evident heterogeneity is observed among the industries with IT companies having the highest capital returns of over 40%. The lowest levels are seen in water supply and waste management services, which is partially explained by the significant capital intensity of the business model specifics. The size of the company has a negative correlation with the levels of ROE: the smaller the company is, the more efficiently in terms of returns on the capital it is being managed (
Appendix B).
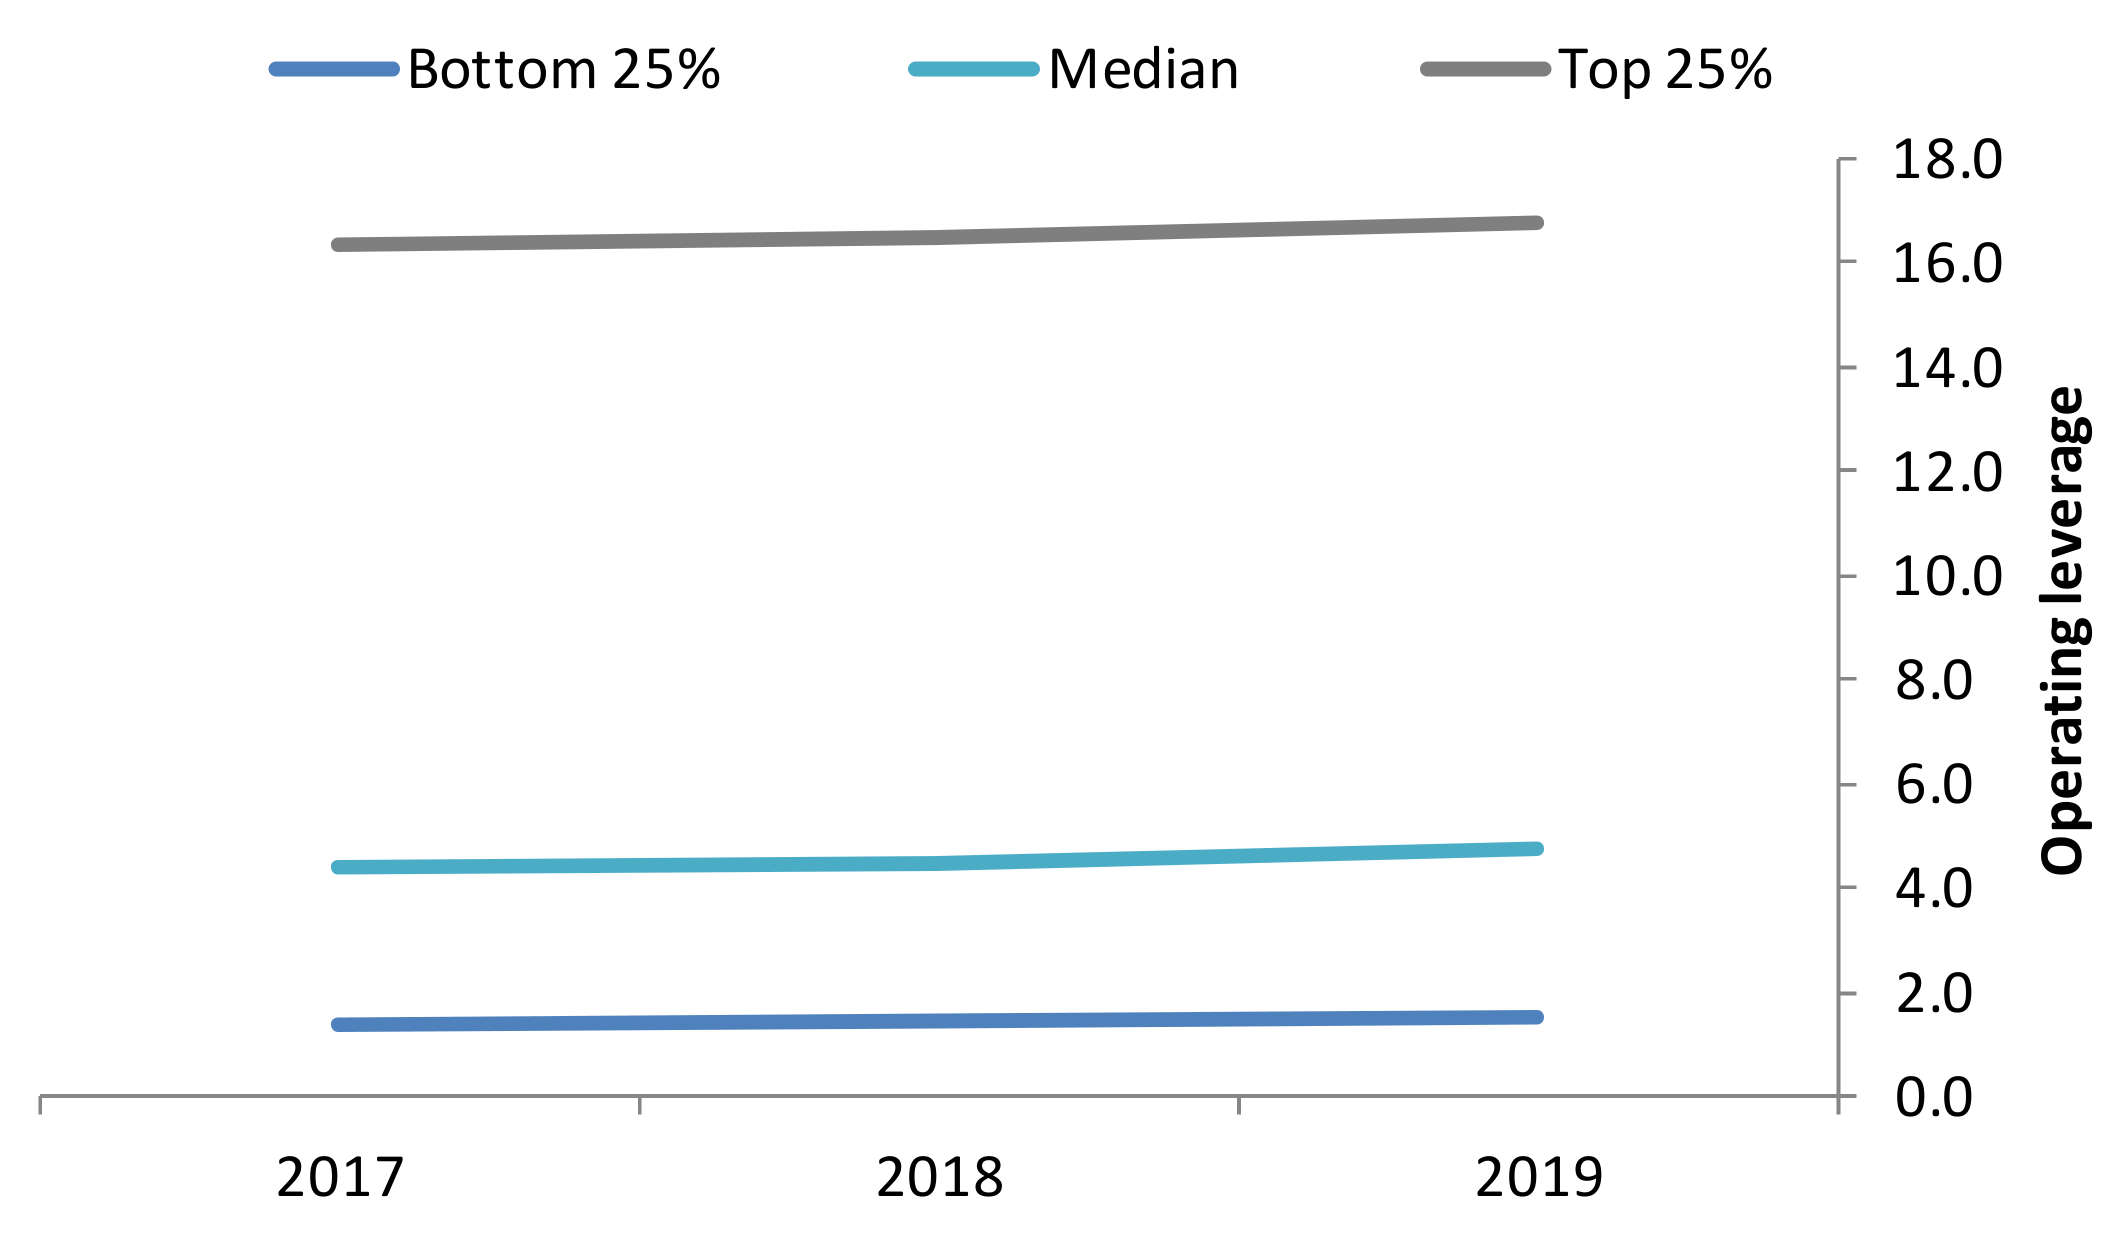
5.1.4. Operating Leverages
The degree of operating leverage is a proxy to the company’s riskiness level in its good and bad sense: if the sales base is expanding, the company is able to grow its income at an even higher pace; if revenues are shrinking, the company experiences an even faster decline of net income (
Figure 4). The key purpose of defining a company’s leverage level is the amount of fixed costs; the higher they are, the higher the operating leverage is. This is more relevant to the cyclical companies, which experience the steepest declines.
It can be stated that the overall median level of Latvian companies riskiness is stable and is on a high level exceeding the neutral level of 1 by almost five times, which surely is very good in case of favorable economic conditions but becomes critical in case the aggregate demand is under pressure.
The highest level of riskiness on the industry dimension is seen among the utility companies and accommodation and food service companies. Low operating leverage is a typical feature within the IT and financial industries. The lowest level of corporate operating riskiness is seen among Riga-based companies and companies of a large size, which is partially explained by the concentration of low-risk industries in Riga and within the large size cluster (
Appendix C).
5.2. Strength of the Balance Sheets
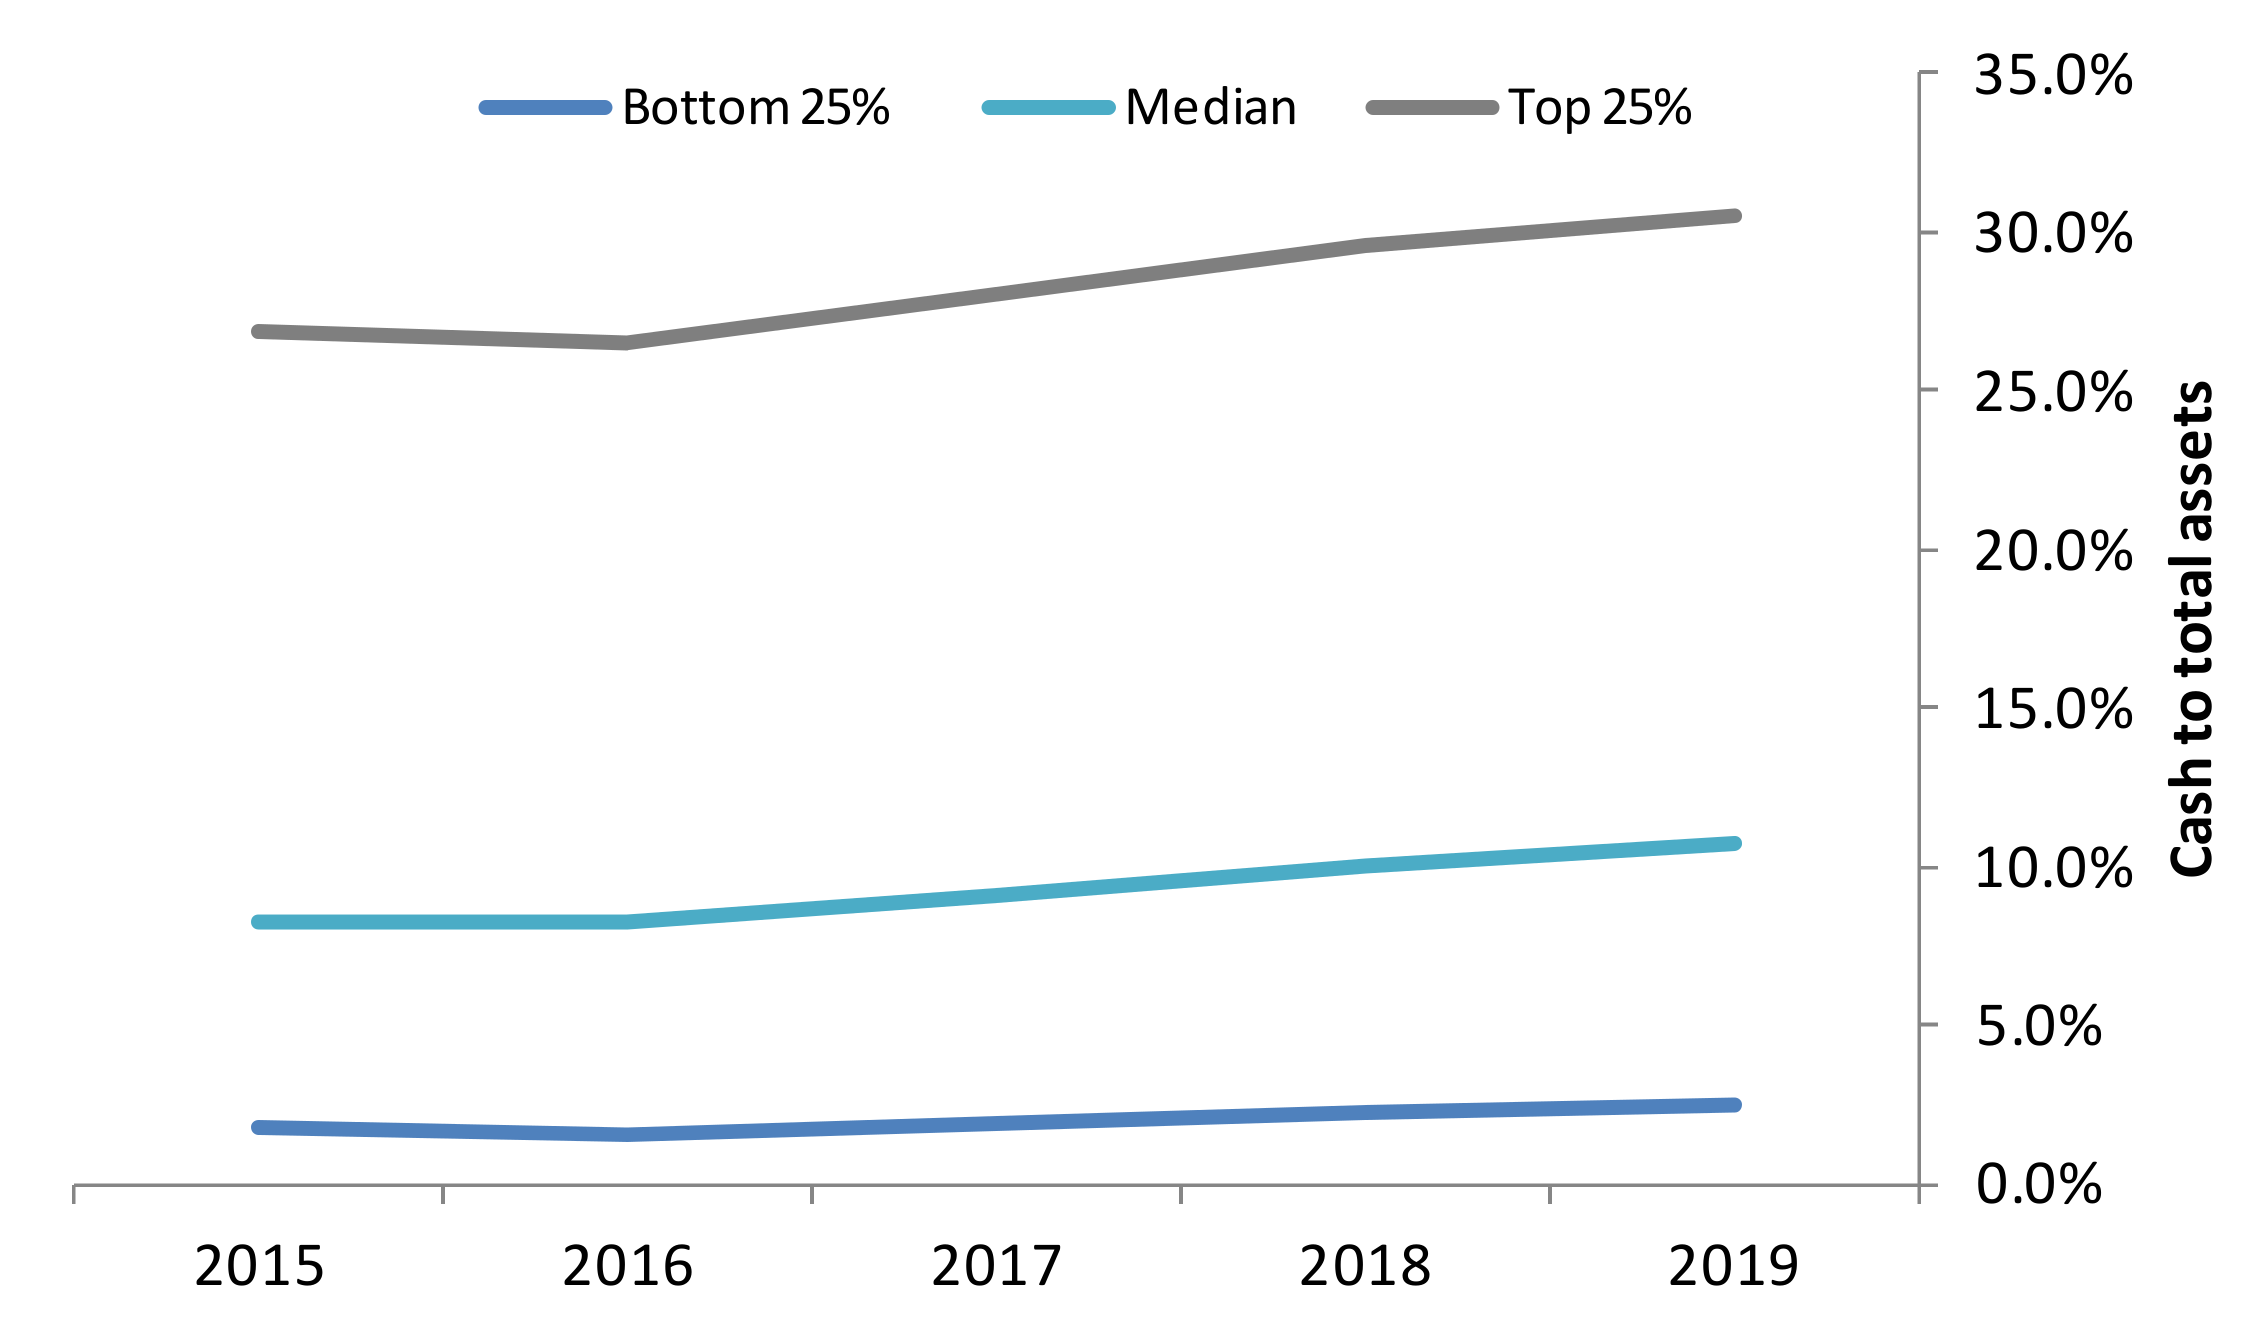
5.2.1. Liquidity I—Cash to Assets
First, our intention was to see how cash-rich companies were at the end of 2019 and how the cash ratio has changed in recent years. The chart below (
Figure 5) exhibits a slightly positive trend of accumulating more cash on the balance sheets and, therefore, about improving the liquidity position of the firm and providing them with more freedom of choice to enhance business further. It is also noticeable that there is a significant gap in cash holdings between very cash-rich companies and the rest of the sample as the level of cash assets of the companies being classified into the 4th quartile is on a very high level. European companies have this ratio on a lower level, as on average, cash represents 6.7% of total assets. The discrepancy in cash levels is particularly well seen on the industry level: IT companies, hotel and food service companies, health and professional service companies in average have 20% cash to total assets, while the sample median is 10%.
Regional patterns came as expected: higher cash holdings are associated with the Riga-located companies, which might be explained by better access to multiple financing sources. Interestingly enough, more cash in relative terms stays with companies of a smaller size, while larger entities have fewer cash holdings (
Appendix D).
5.2.2. Liquidity II—Absolute Liquidity
Calculating the absolute liquidity ratio, we see that the median liquidity level of Latvian companies is on a pretty low level, and again, the gap between the very cash-rich companies and the average firm is very wide (
Figure 6). The level of cash relative to the company’s current liabilities remains rather stable throughout the period of 2015–2017 with increases in 2018 and 2019, when also a very steep increase is seen within the top quartile companies.
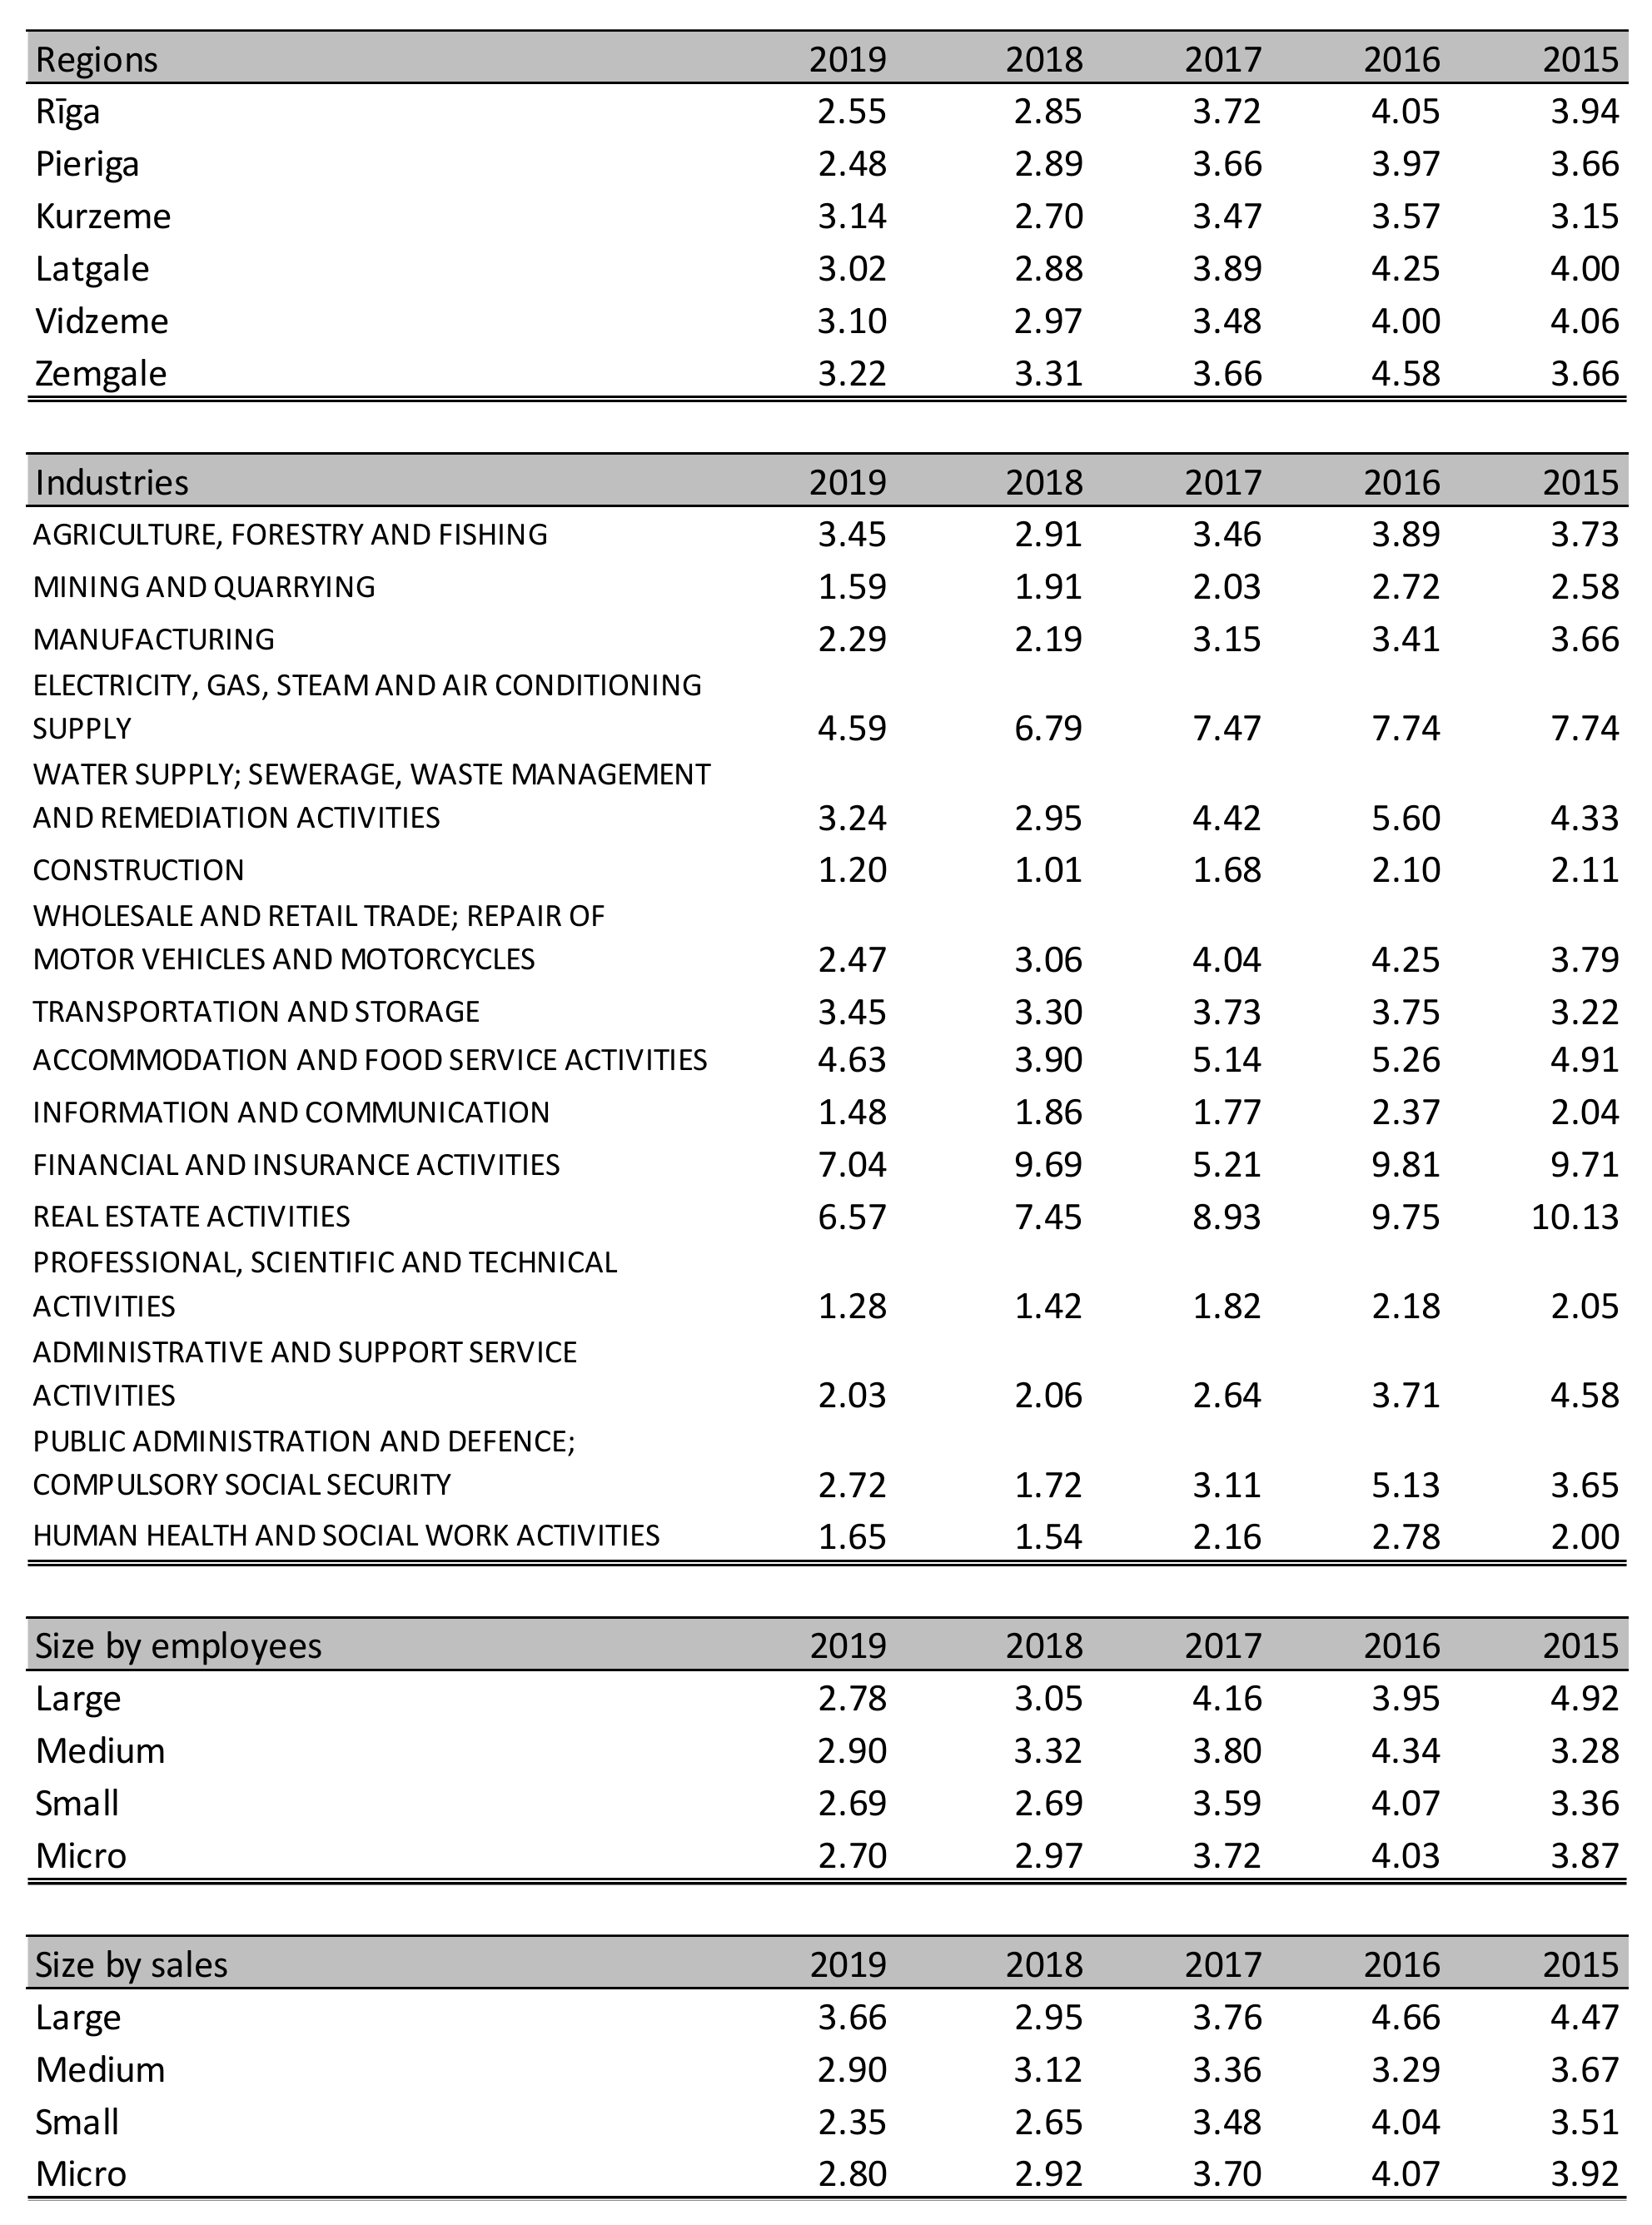
It is noteworthy that according to the cash to assets ratio, Latvian companies look rather good compared to the European companies. Absolute liquidity ratios for Latvian and European companies sit on the same level of 27–28%. Therefore, it can be concluded that Latvian companies have significant piles of current liabilities, which to a great extent, are formed by the payables and not by the debt as judged from the low interest coverage ratio that is discussed below. To compare, the current liabilities of European companies make 24% of the total assets, while the same ratio for Latvian companies results into 38%.
Industries, which can boast of high cash piles, are IT, financials, professional services, public administration, and human health. The major difficulties in covering short-term liabilities might be experienced by the manufacturing, transportation, and trading industries. There is no substantial difference in absolute liquidity ratios according to the region, but still, the highest cash holdings are ensured by Riga-based companies. Large and micro-companies have a better ability to cover short-term liabilities compared to companies of medium and small size (
Appendix E).
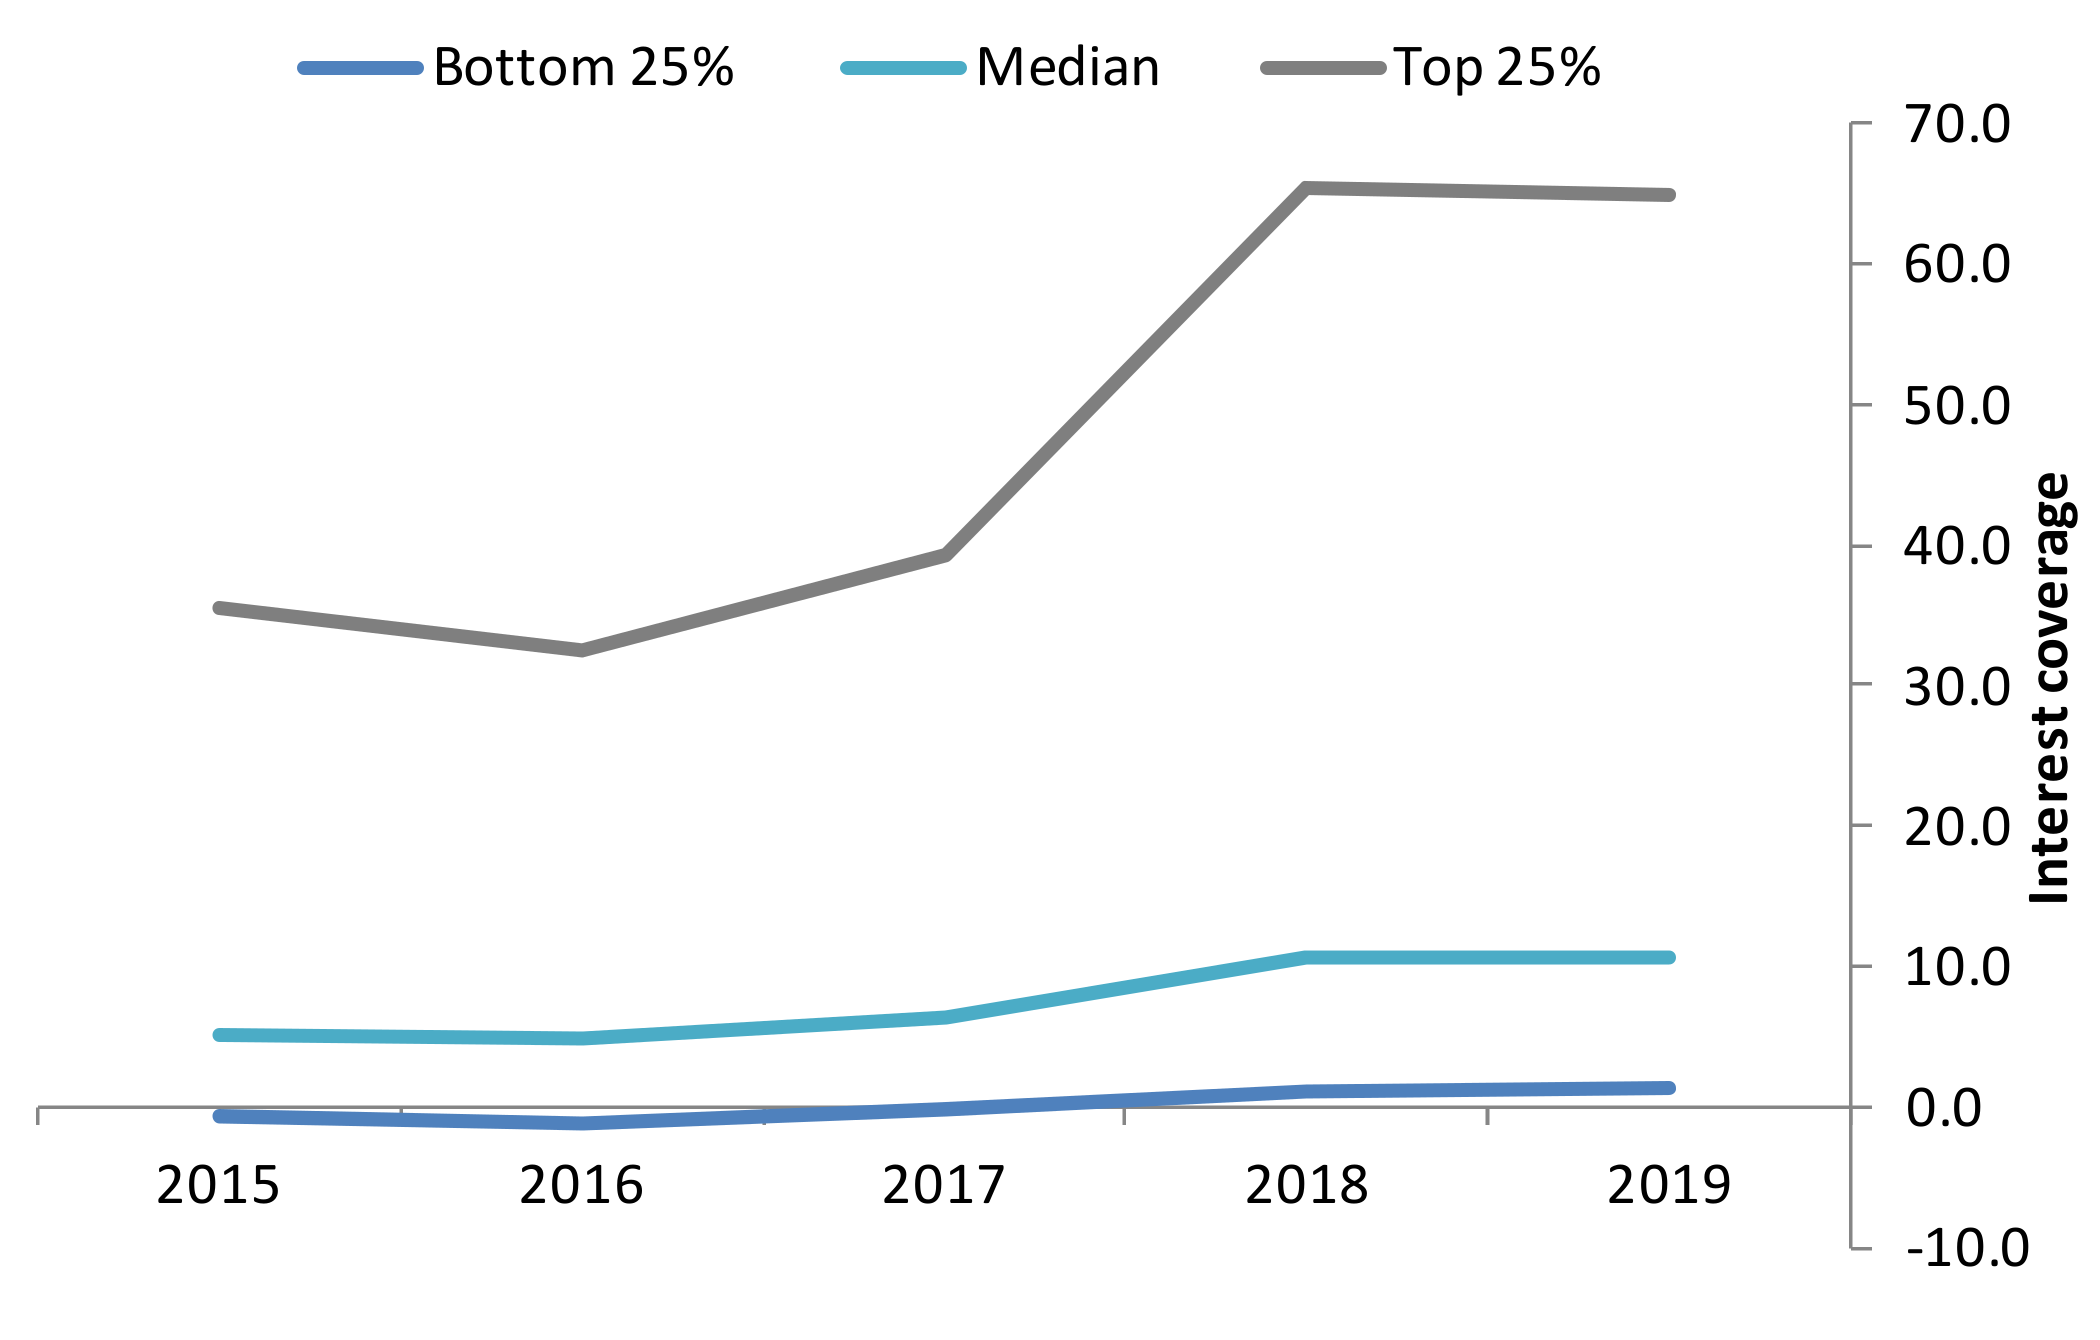
5.2.3. Interest Coverage
Interest coverage ratio deserves lots of attention now when the interest rates are low and, therefore, allows for sustaining operations of zombie firms [
32]. The research results show that 7% of the broad sample is classified as zombie companies—ones that cannot systematically sustain their operations without the injection of borrowed capital. It should be noted that recently the situation has improved, and 25% of companies with the lowest interest coverage have had this ratio in the positive zone since 2018 (
Figure 7). The gap between the companies with very high interest coverage and the sample median is large, resembling similar cases with other ratios.
Median interest coverage of Latvian companies is 10.6, which is very close to the level of 11.1—the average interest coverage of European companies, indicating that the vast majority of the sample companies do not have any difficulties in covering their interest expenses.
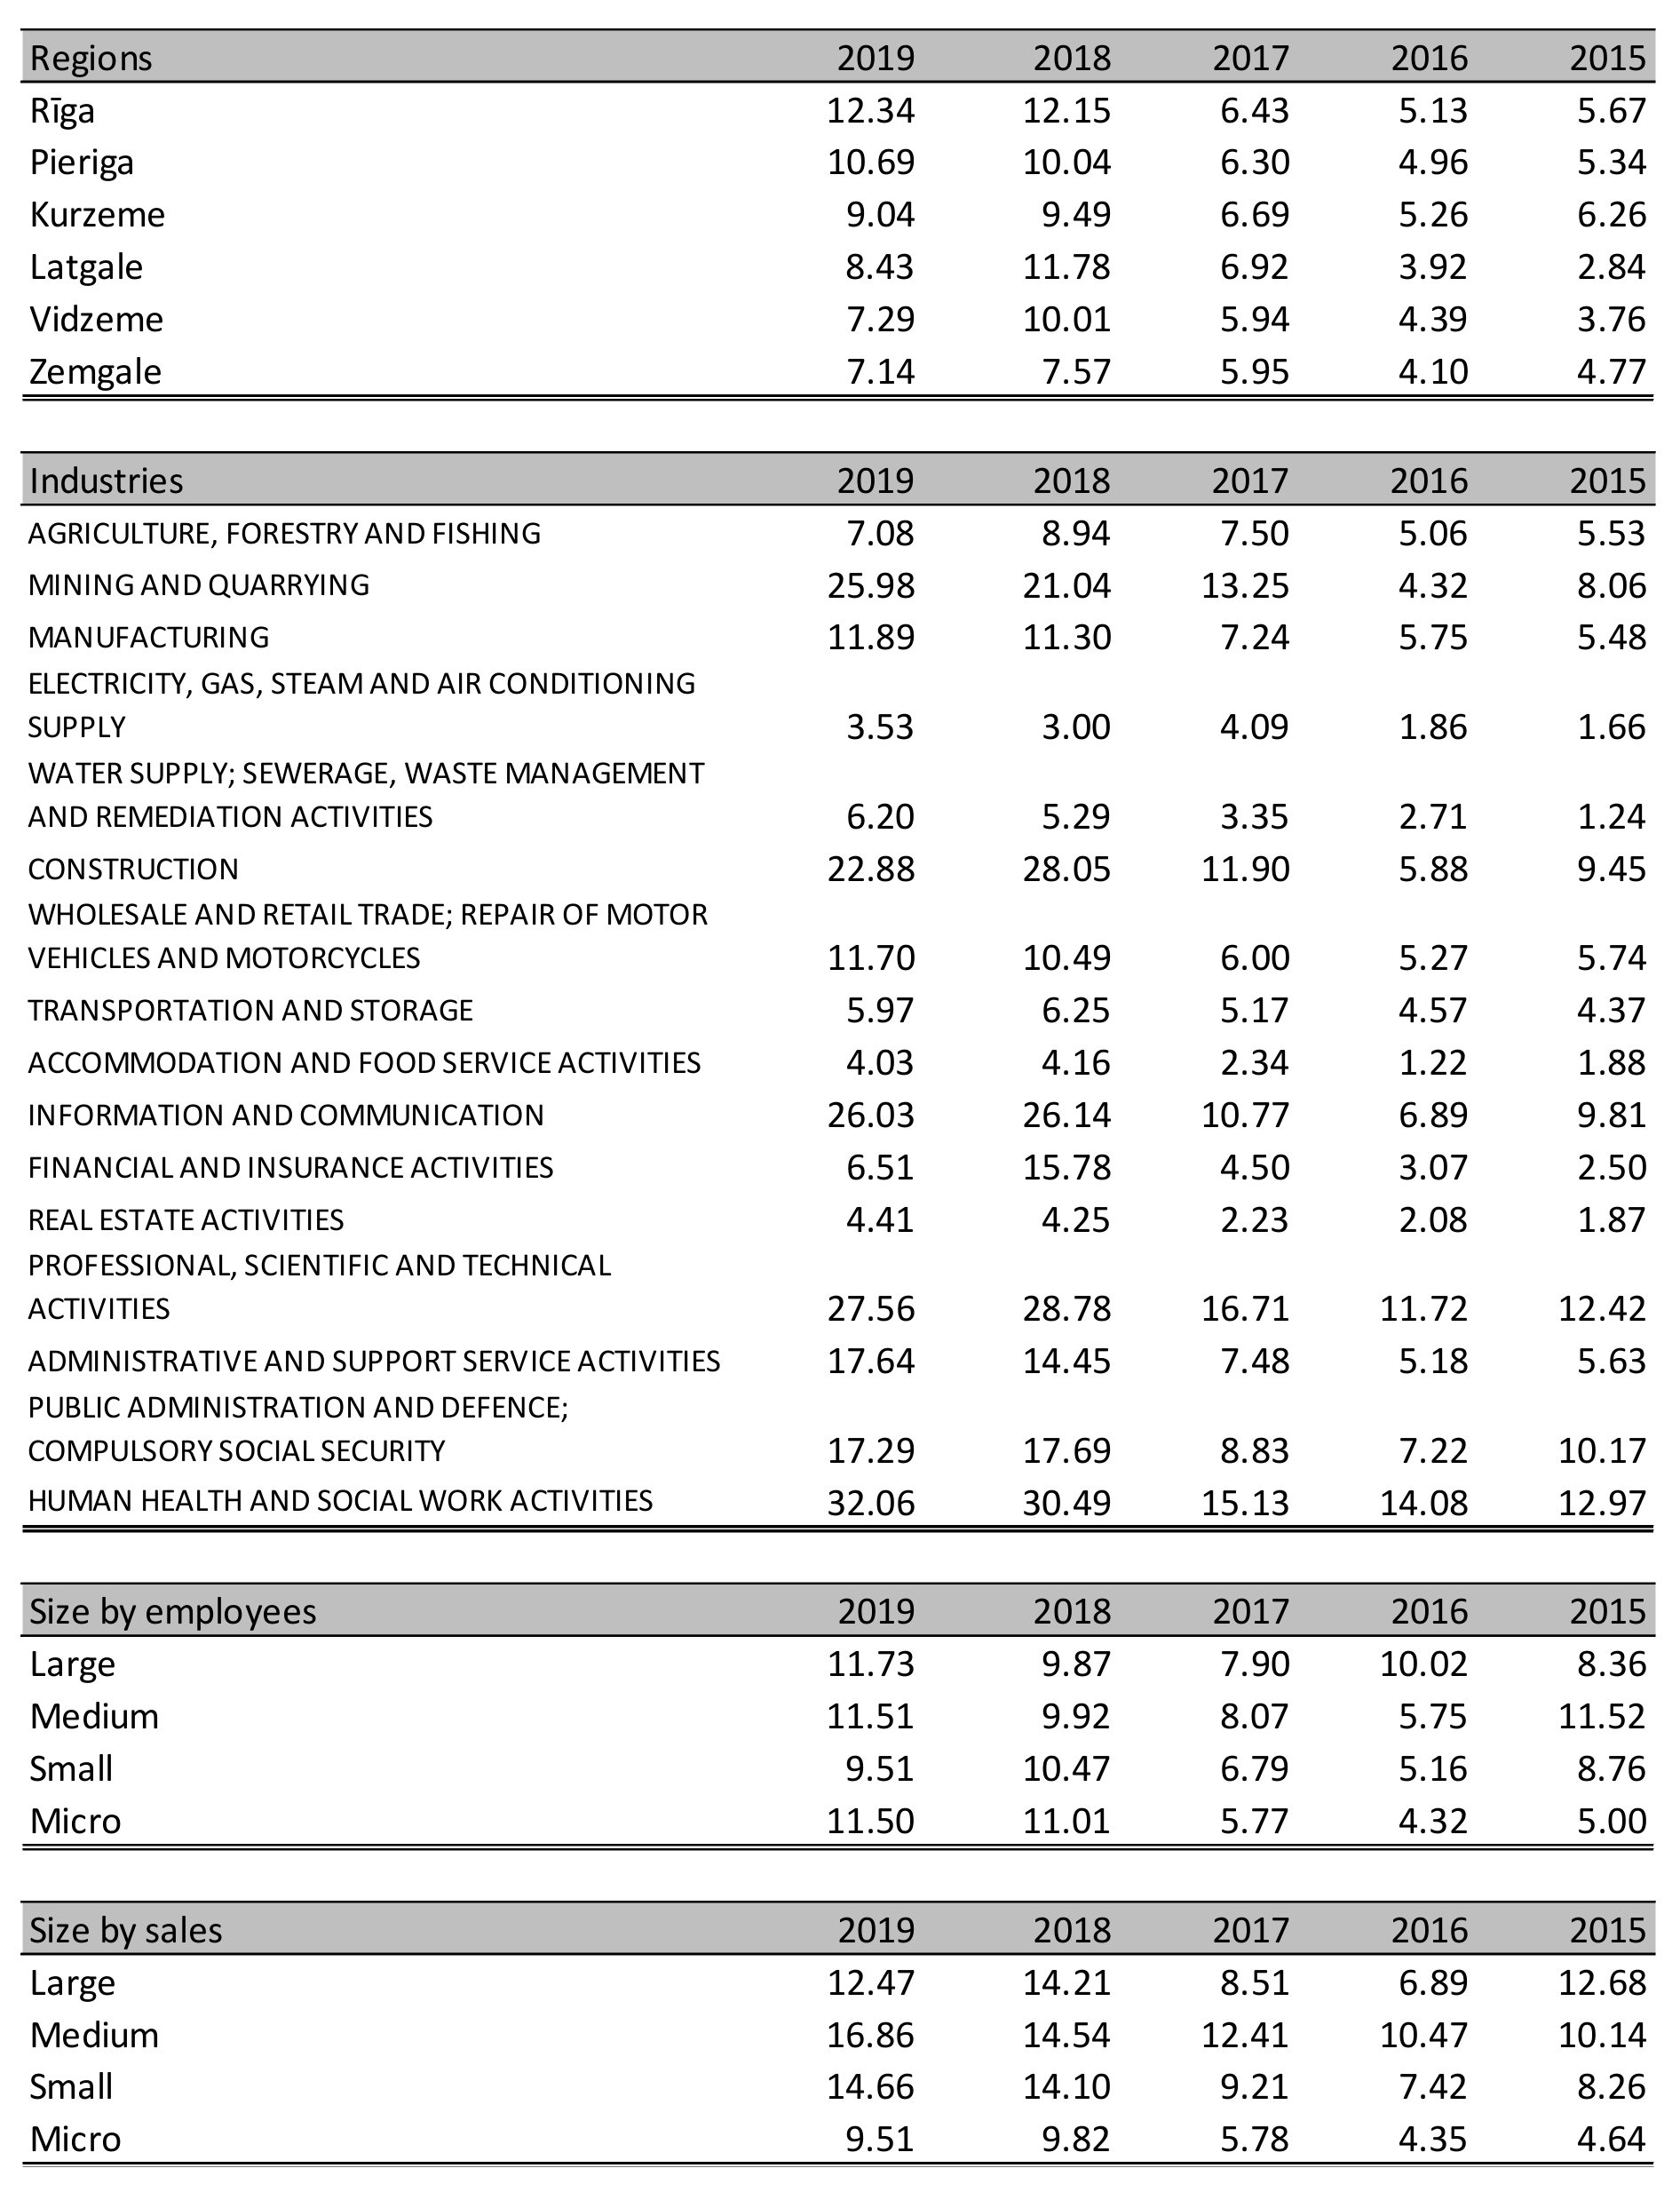
Highest interest coverage ratios are demonstrated by IT industry representatives as well as health and professional service companies. It is also seen that the companies with headquarters in Riga and its suburbs are able to generate the highest operating income versus their interest expenses. The lowest interest coverage ratio is seen among the small companies (
Appendix F).
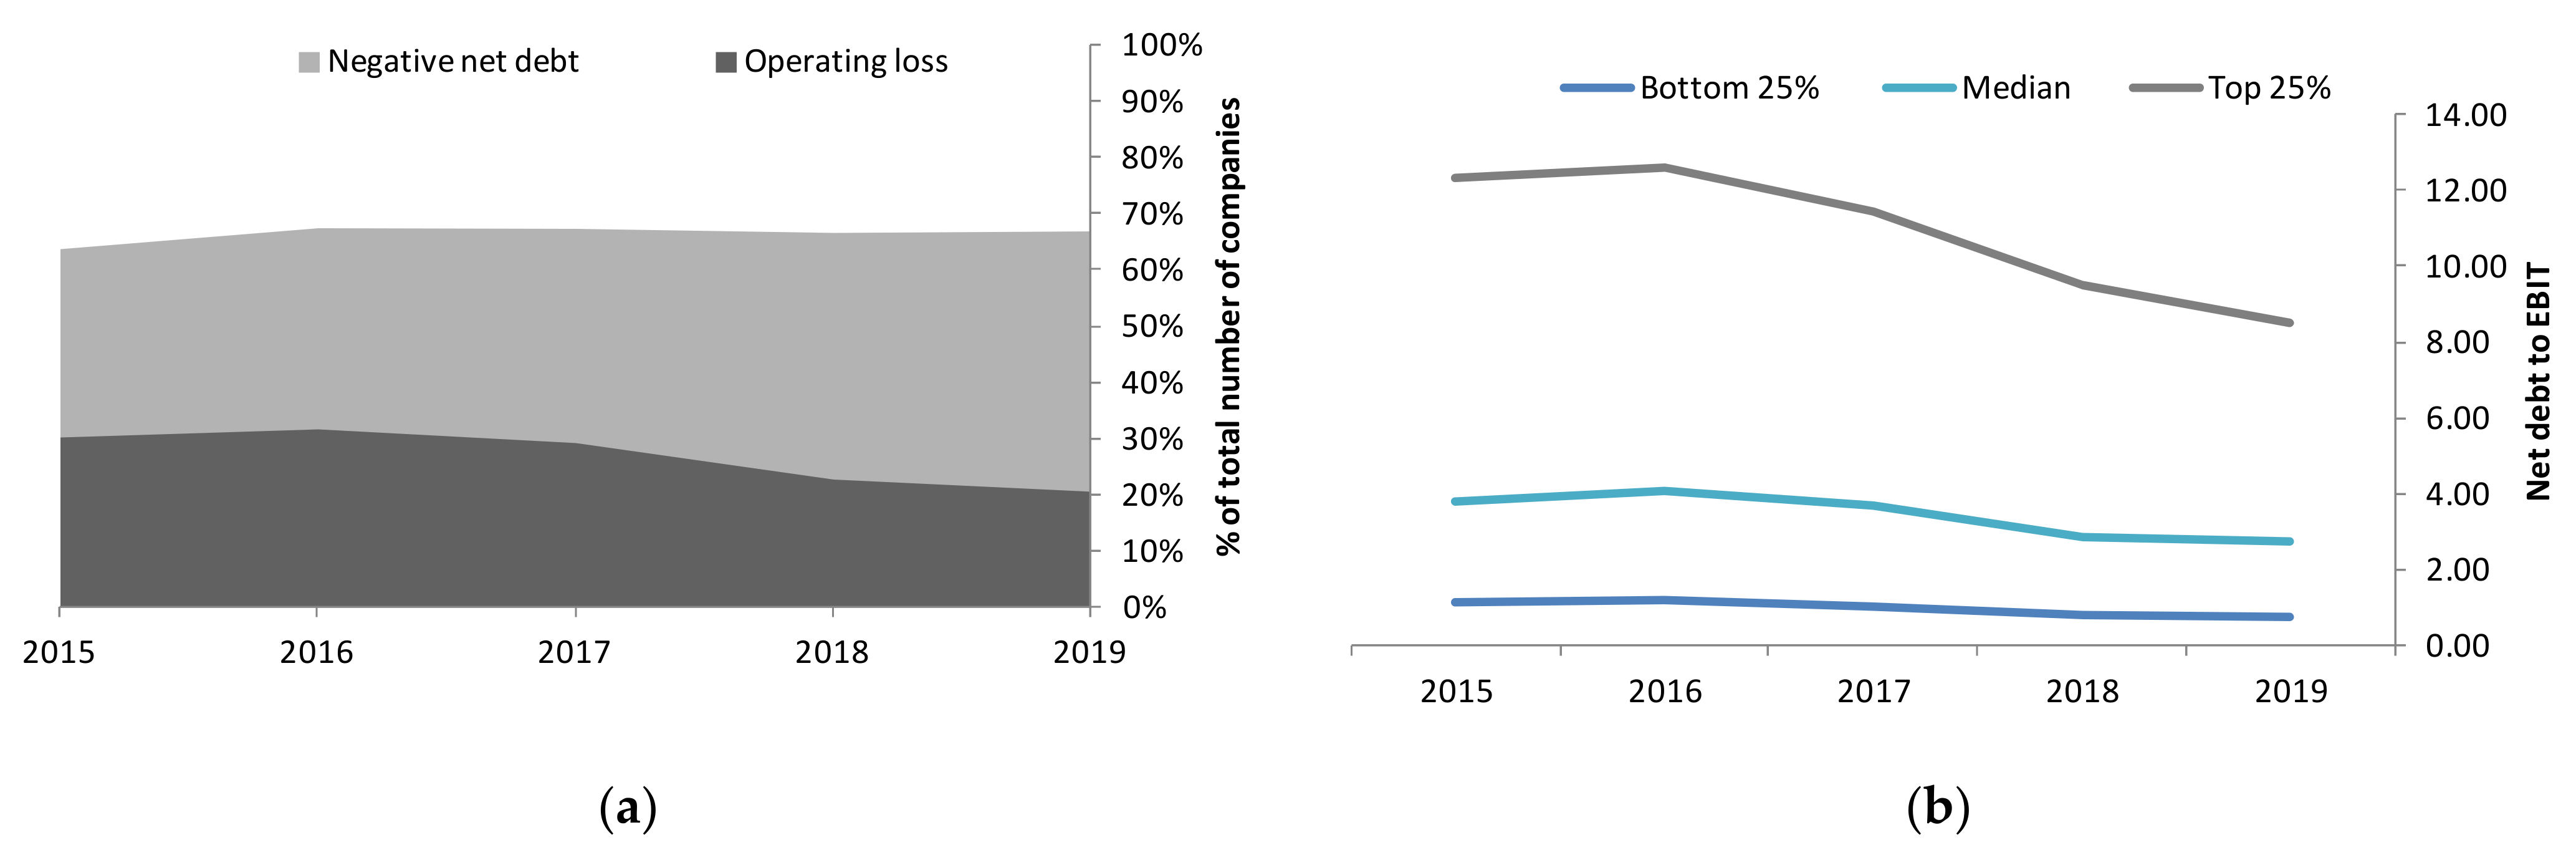
5.2.4. Amount of Debt vs. Earnings
To check how significant the corporate debt burden cash is versus their one-year operating earnings, we considered the net debt-to-EBIT ratio, also paying attention to the amount of companies having operating losses and to the ones, which have negative net debt. Almost half of the data sample companies have negative net debt, and there has also been seen a favorable trend when the number of companies having their cash cushion exceeding the debt amount has expanded: from 33% in 2015 to 46% in 2019 of the total sample (
Figure 8a). This is an indication of companies’ financial condition improvements, which either have lower debt amounts or more cash on the balance sheet, or both. At the same time, the share of firms making operating losses declined: from 32% in 2016 to 20% in 2019.
Excluding the companies that neither have operating losses nor negative net debt, we see that starting with 2016, there is a strong improvement in the net debt to EBIT ratio, indicating that the balance sheets and earnings ability of companies become stronger (
Figure 8b).
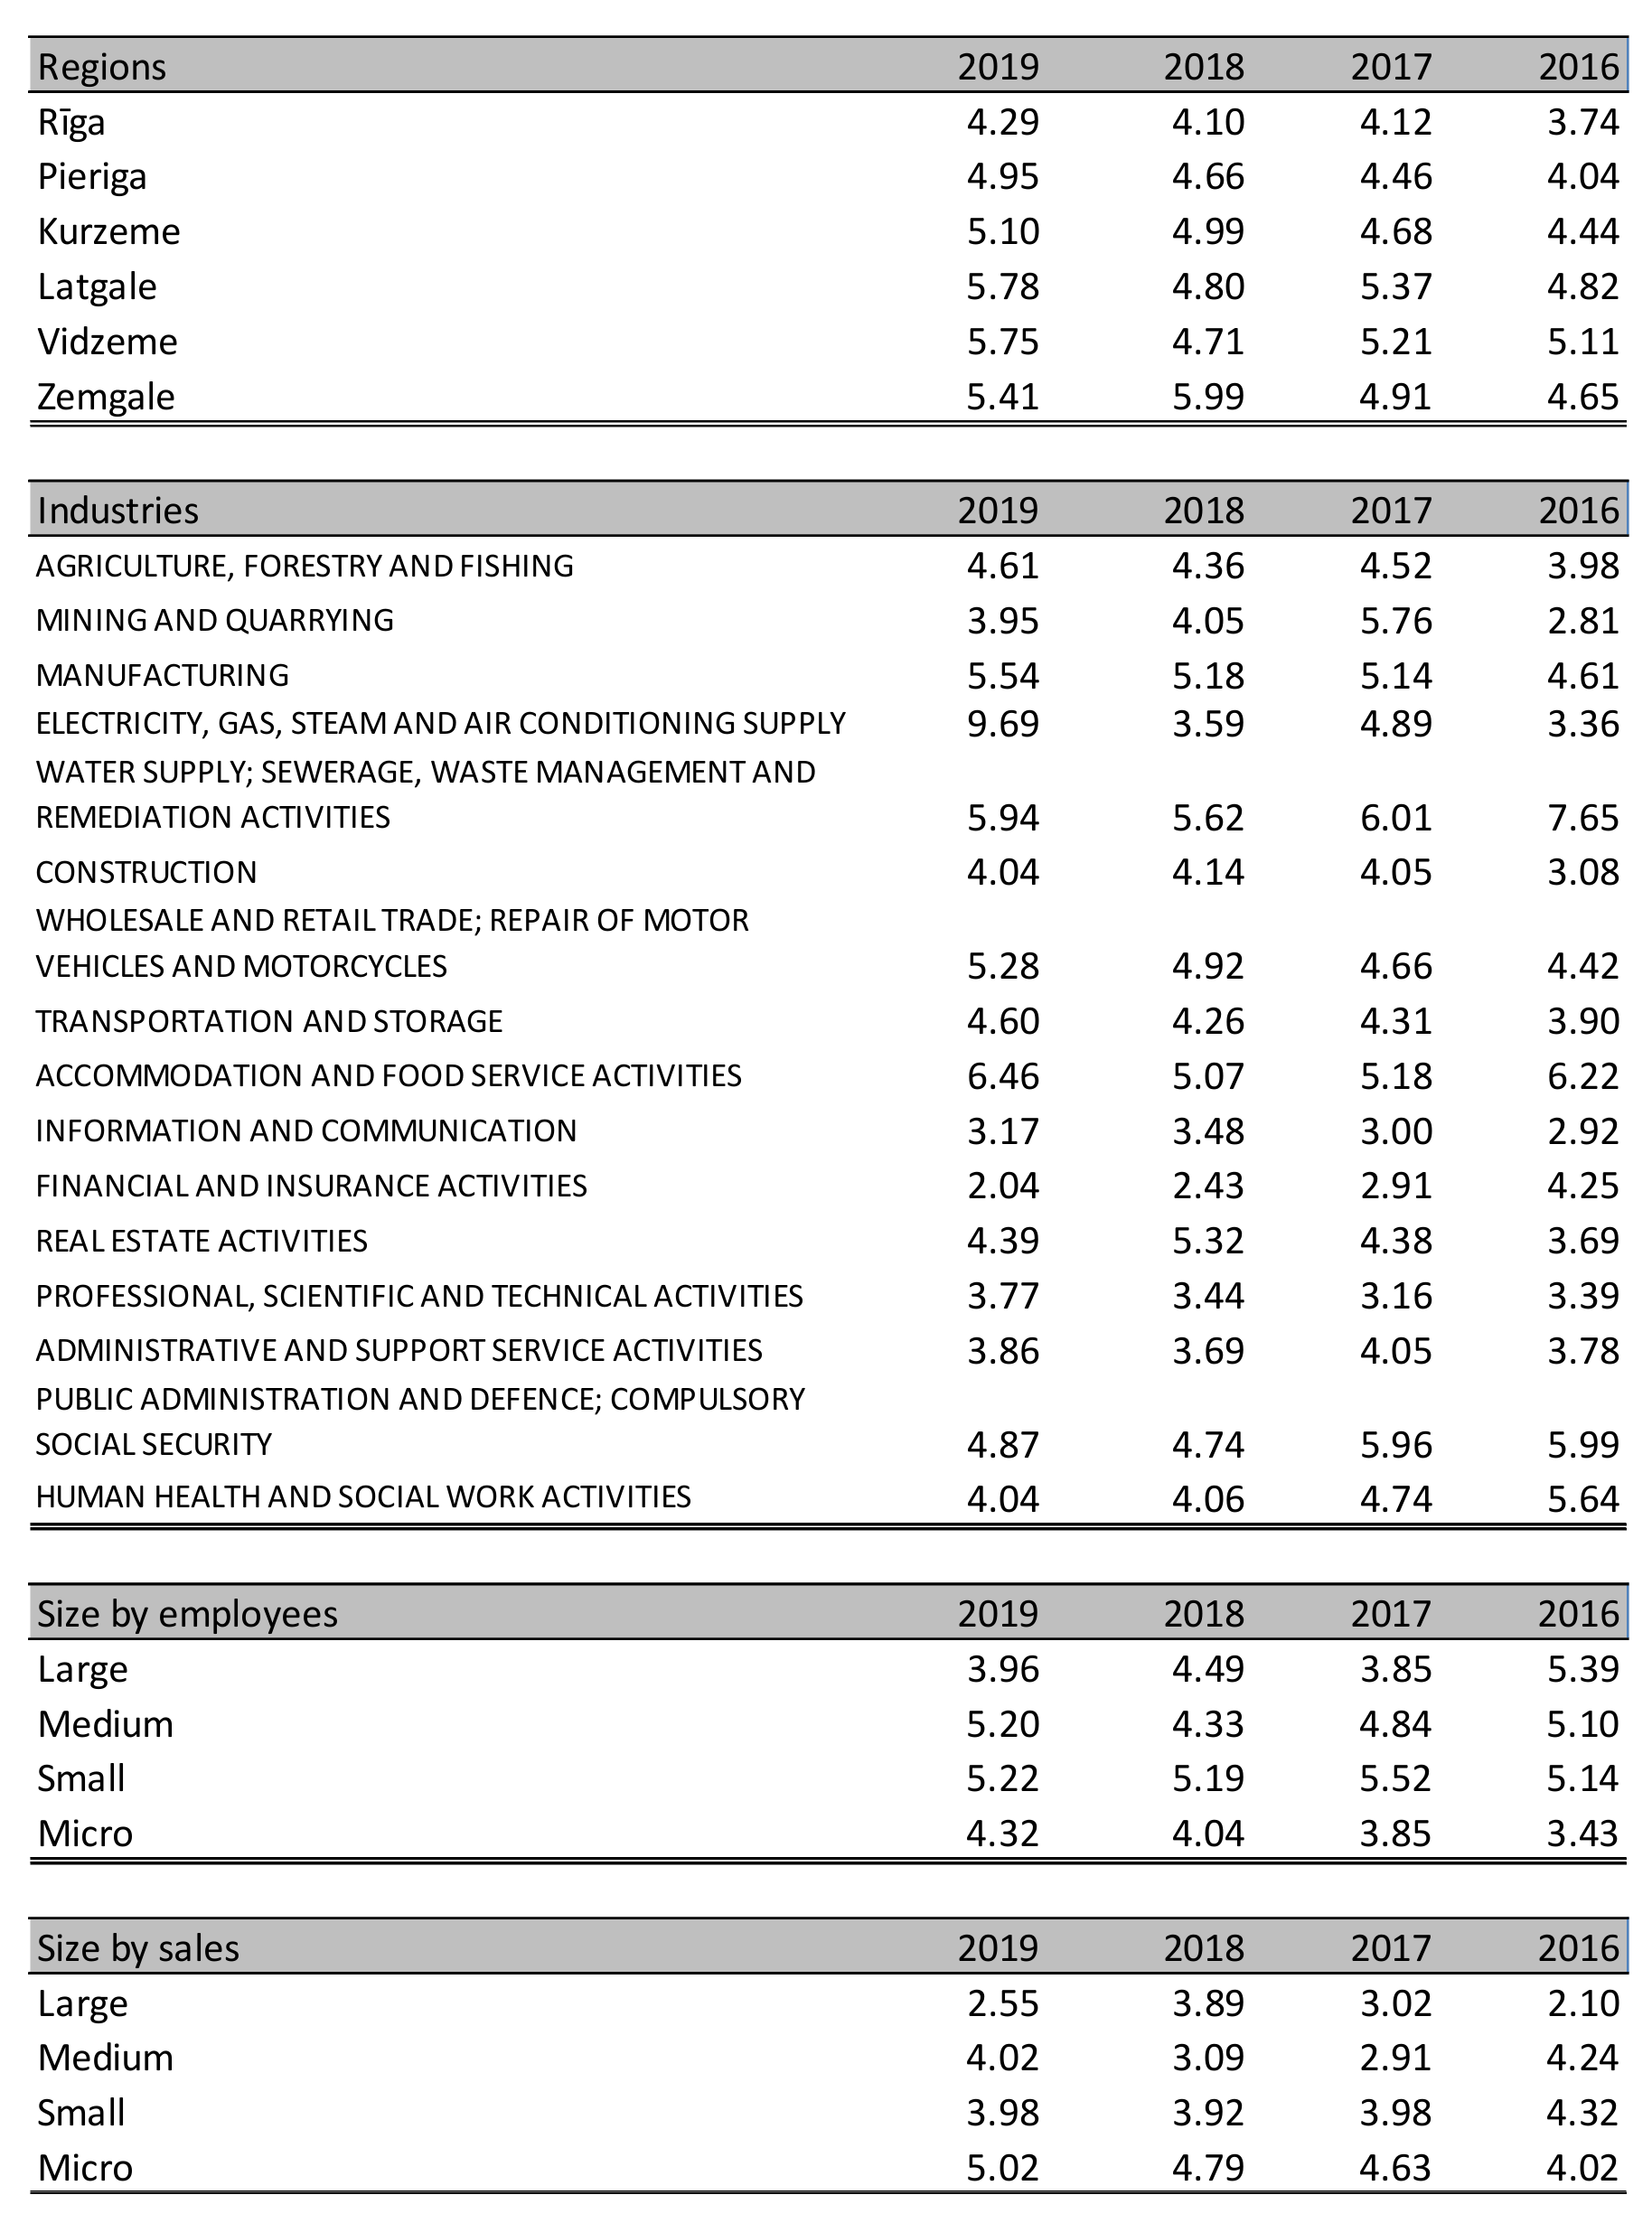
Strongest debt-to-earnings ratios are demonstrated by the companies with headquarters in Riga and Riga district. On the industry dimension, the pattern is not homogeneous, and the calculated ratio greatly varies from industry to industry. The highest ratios unsurprisingly are found among the real estate and financial companies, while the most attractive levels are demonstrated by IT, construction, and professional services.
Micro-companies on average seem to generate decent earnings levels vs. their debt amount, therefore leading to the healthiest levels of net debt-to-earnings ratio. They are followed by companies of small and large size, but mid-sized companies have this ratio at a substantially higher levels, making them look less sustainable compared to firms of different sizes (
Appendix G).
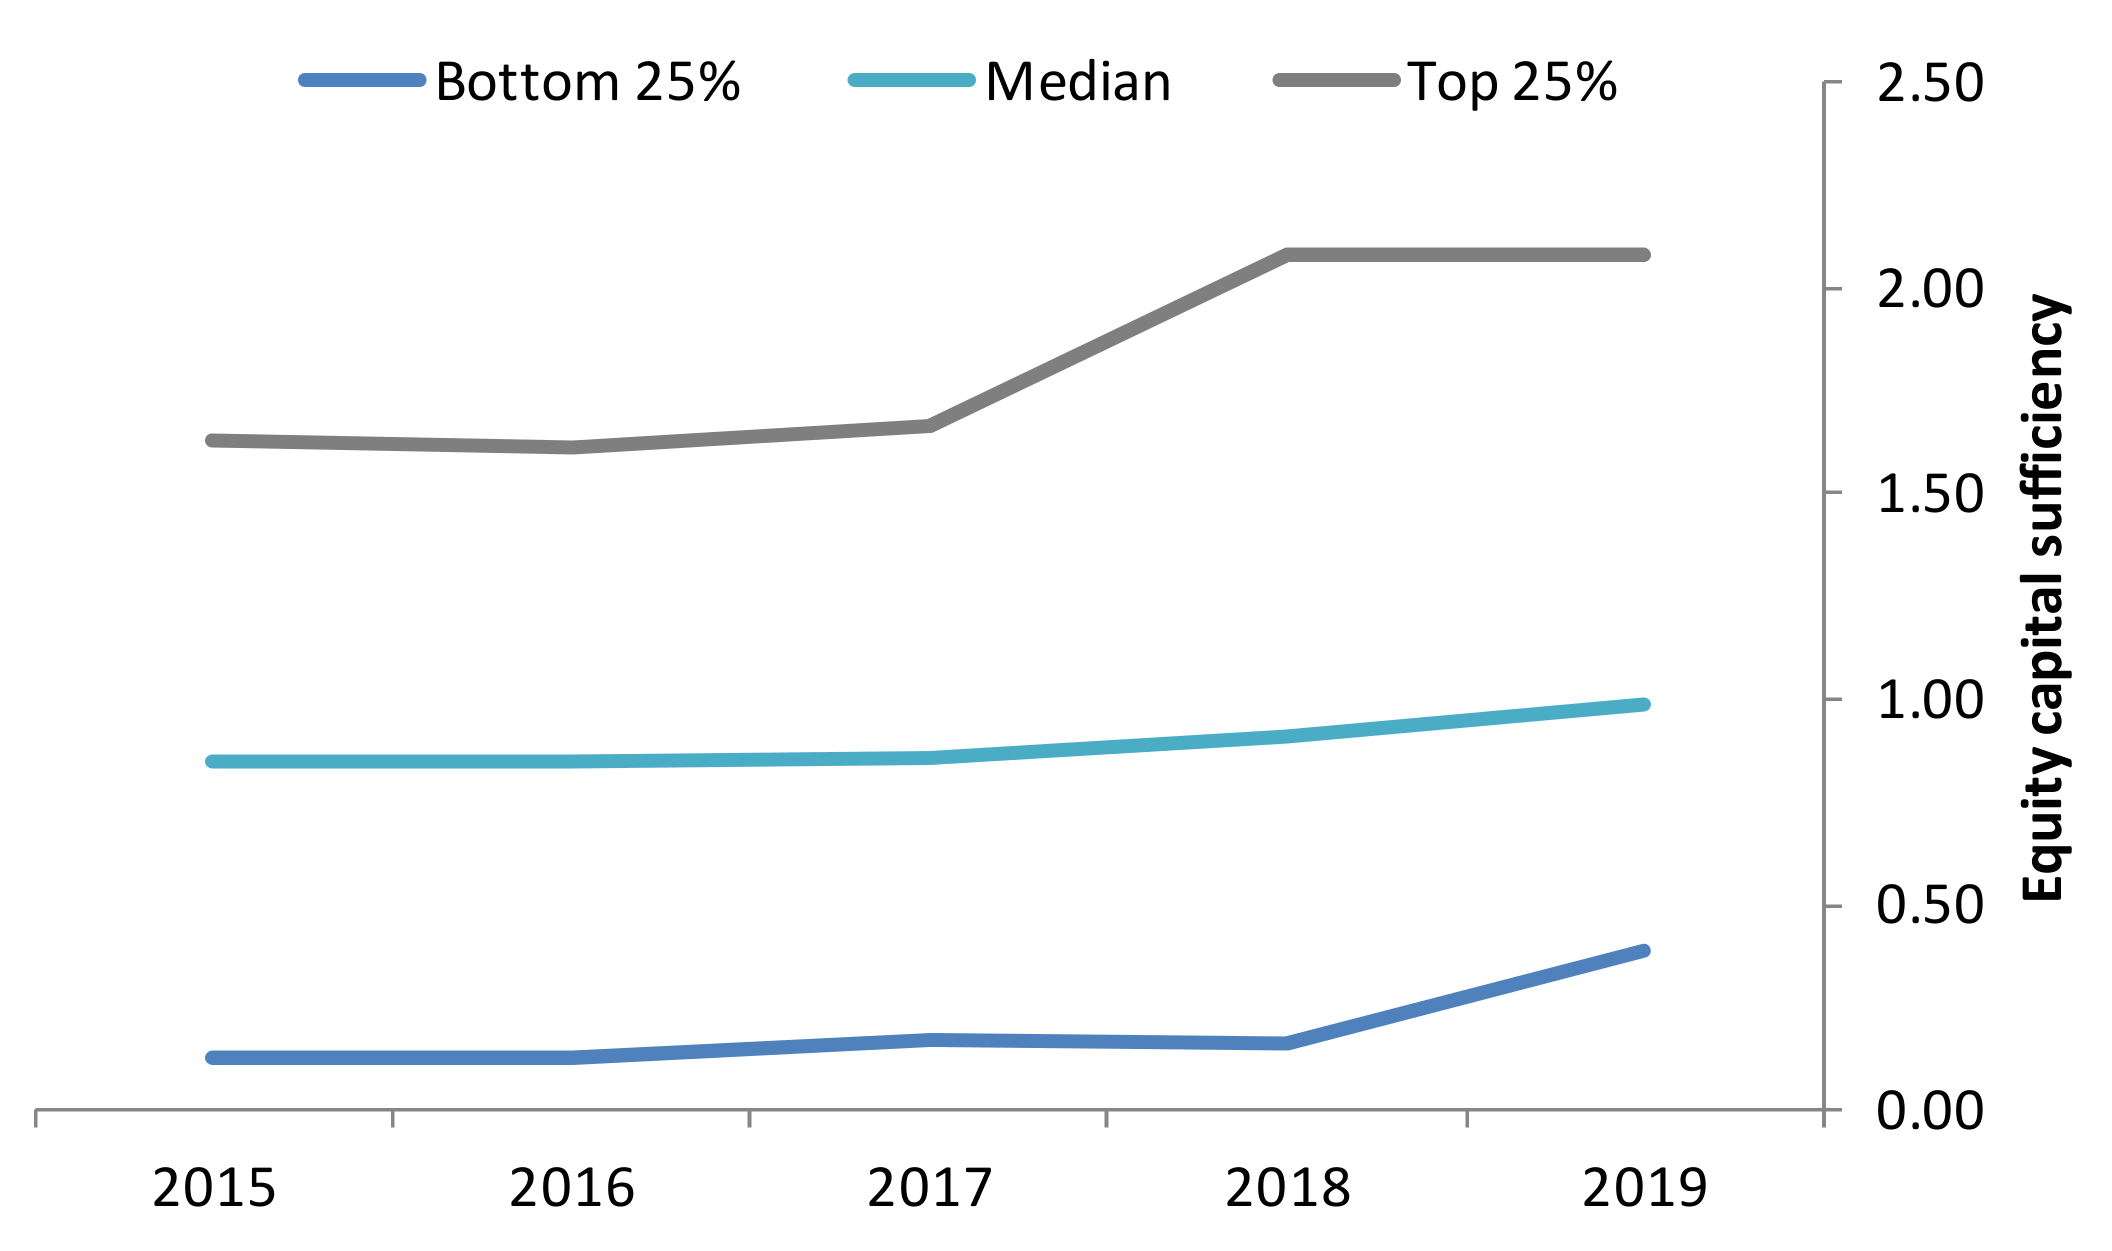
5.2.5. Equity Sufficiency
The median level of equity capital sufficiency remains rather stable with a slight increase seen in the last two years, which allowed the sample companies to reach the optimal level of equity financing. The discrepancy in equity capital sufficiency level is significant—the bottom 25% of companies can hardly finance their long-term assets with equity capital, while the top 25% of companies could be considered even overfinanced as equity sufficiency ratios exceed the neutral level of 1 more than two-fold (
Figure 9). The year 2019 was very successful for the firms with weak equity financing, which have demonstrated a significant jump in equity capital sufficiency ratio, while 2018 brought a significant increase in equity capital sufficiency ratio to the companies with already very strong balance sheets.
Enterprises with the most well-backed equity capital are primarily found in Riga, while in Vidzeme, equity capital sufficiency is the weakest. Analysis on the industry dimension demonstrates that three industries are much better financed in terms of equity financing compared to their peers: construction, IT, and professional services.
Equity sufficiency remains relatively stable for companies of mid and small sizes but varies greatly with time for large and micro-companies (
Appendix H).
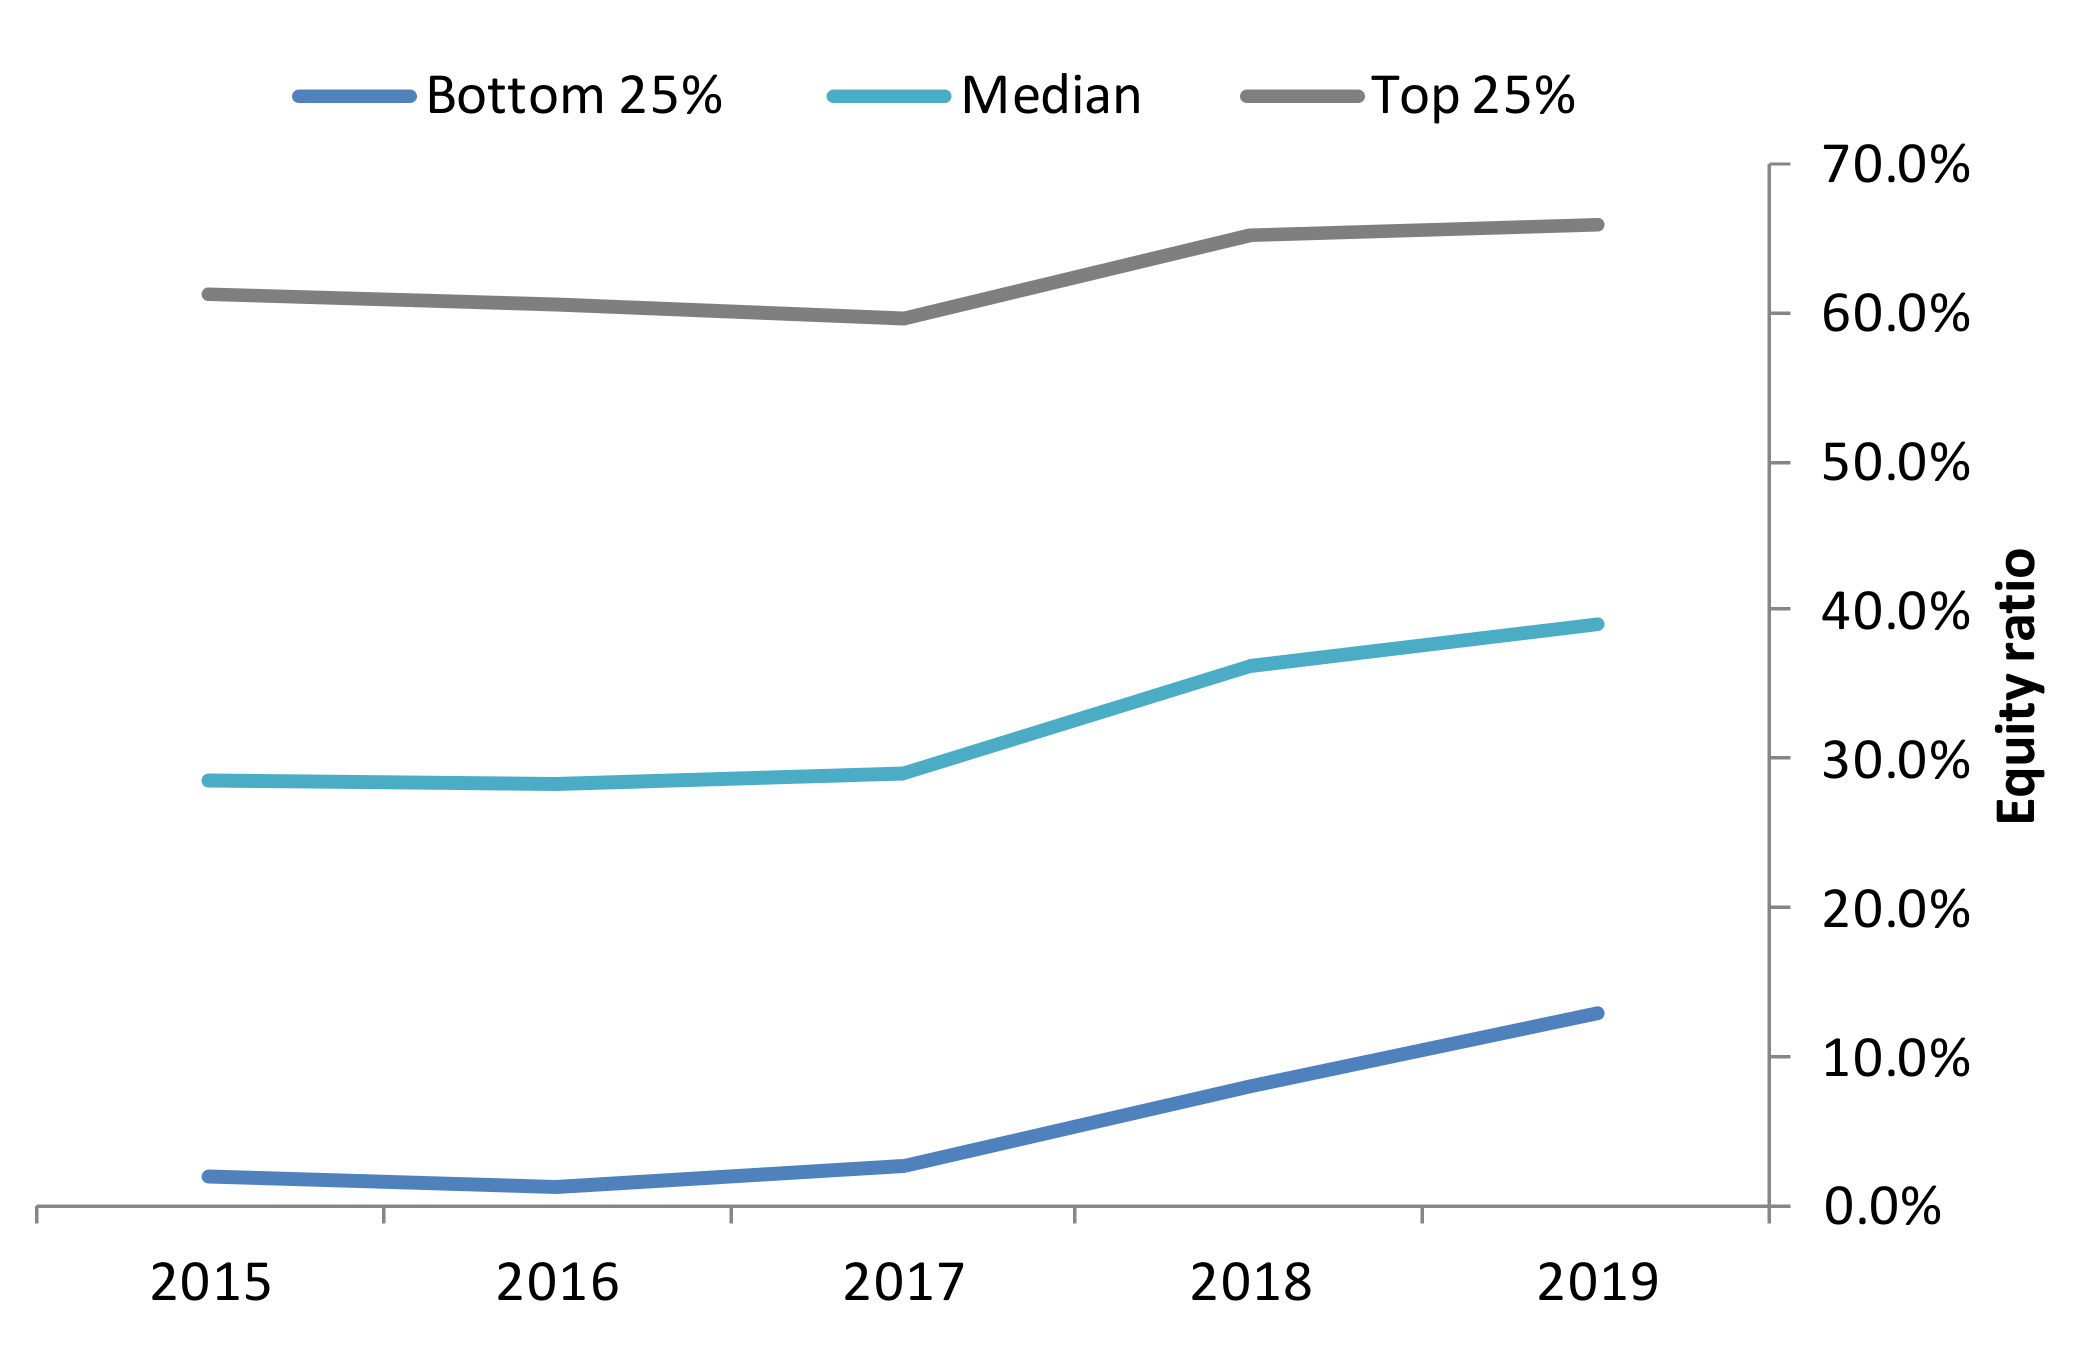
5.2.6. Financial Stability
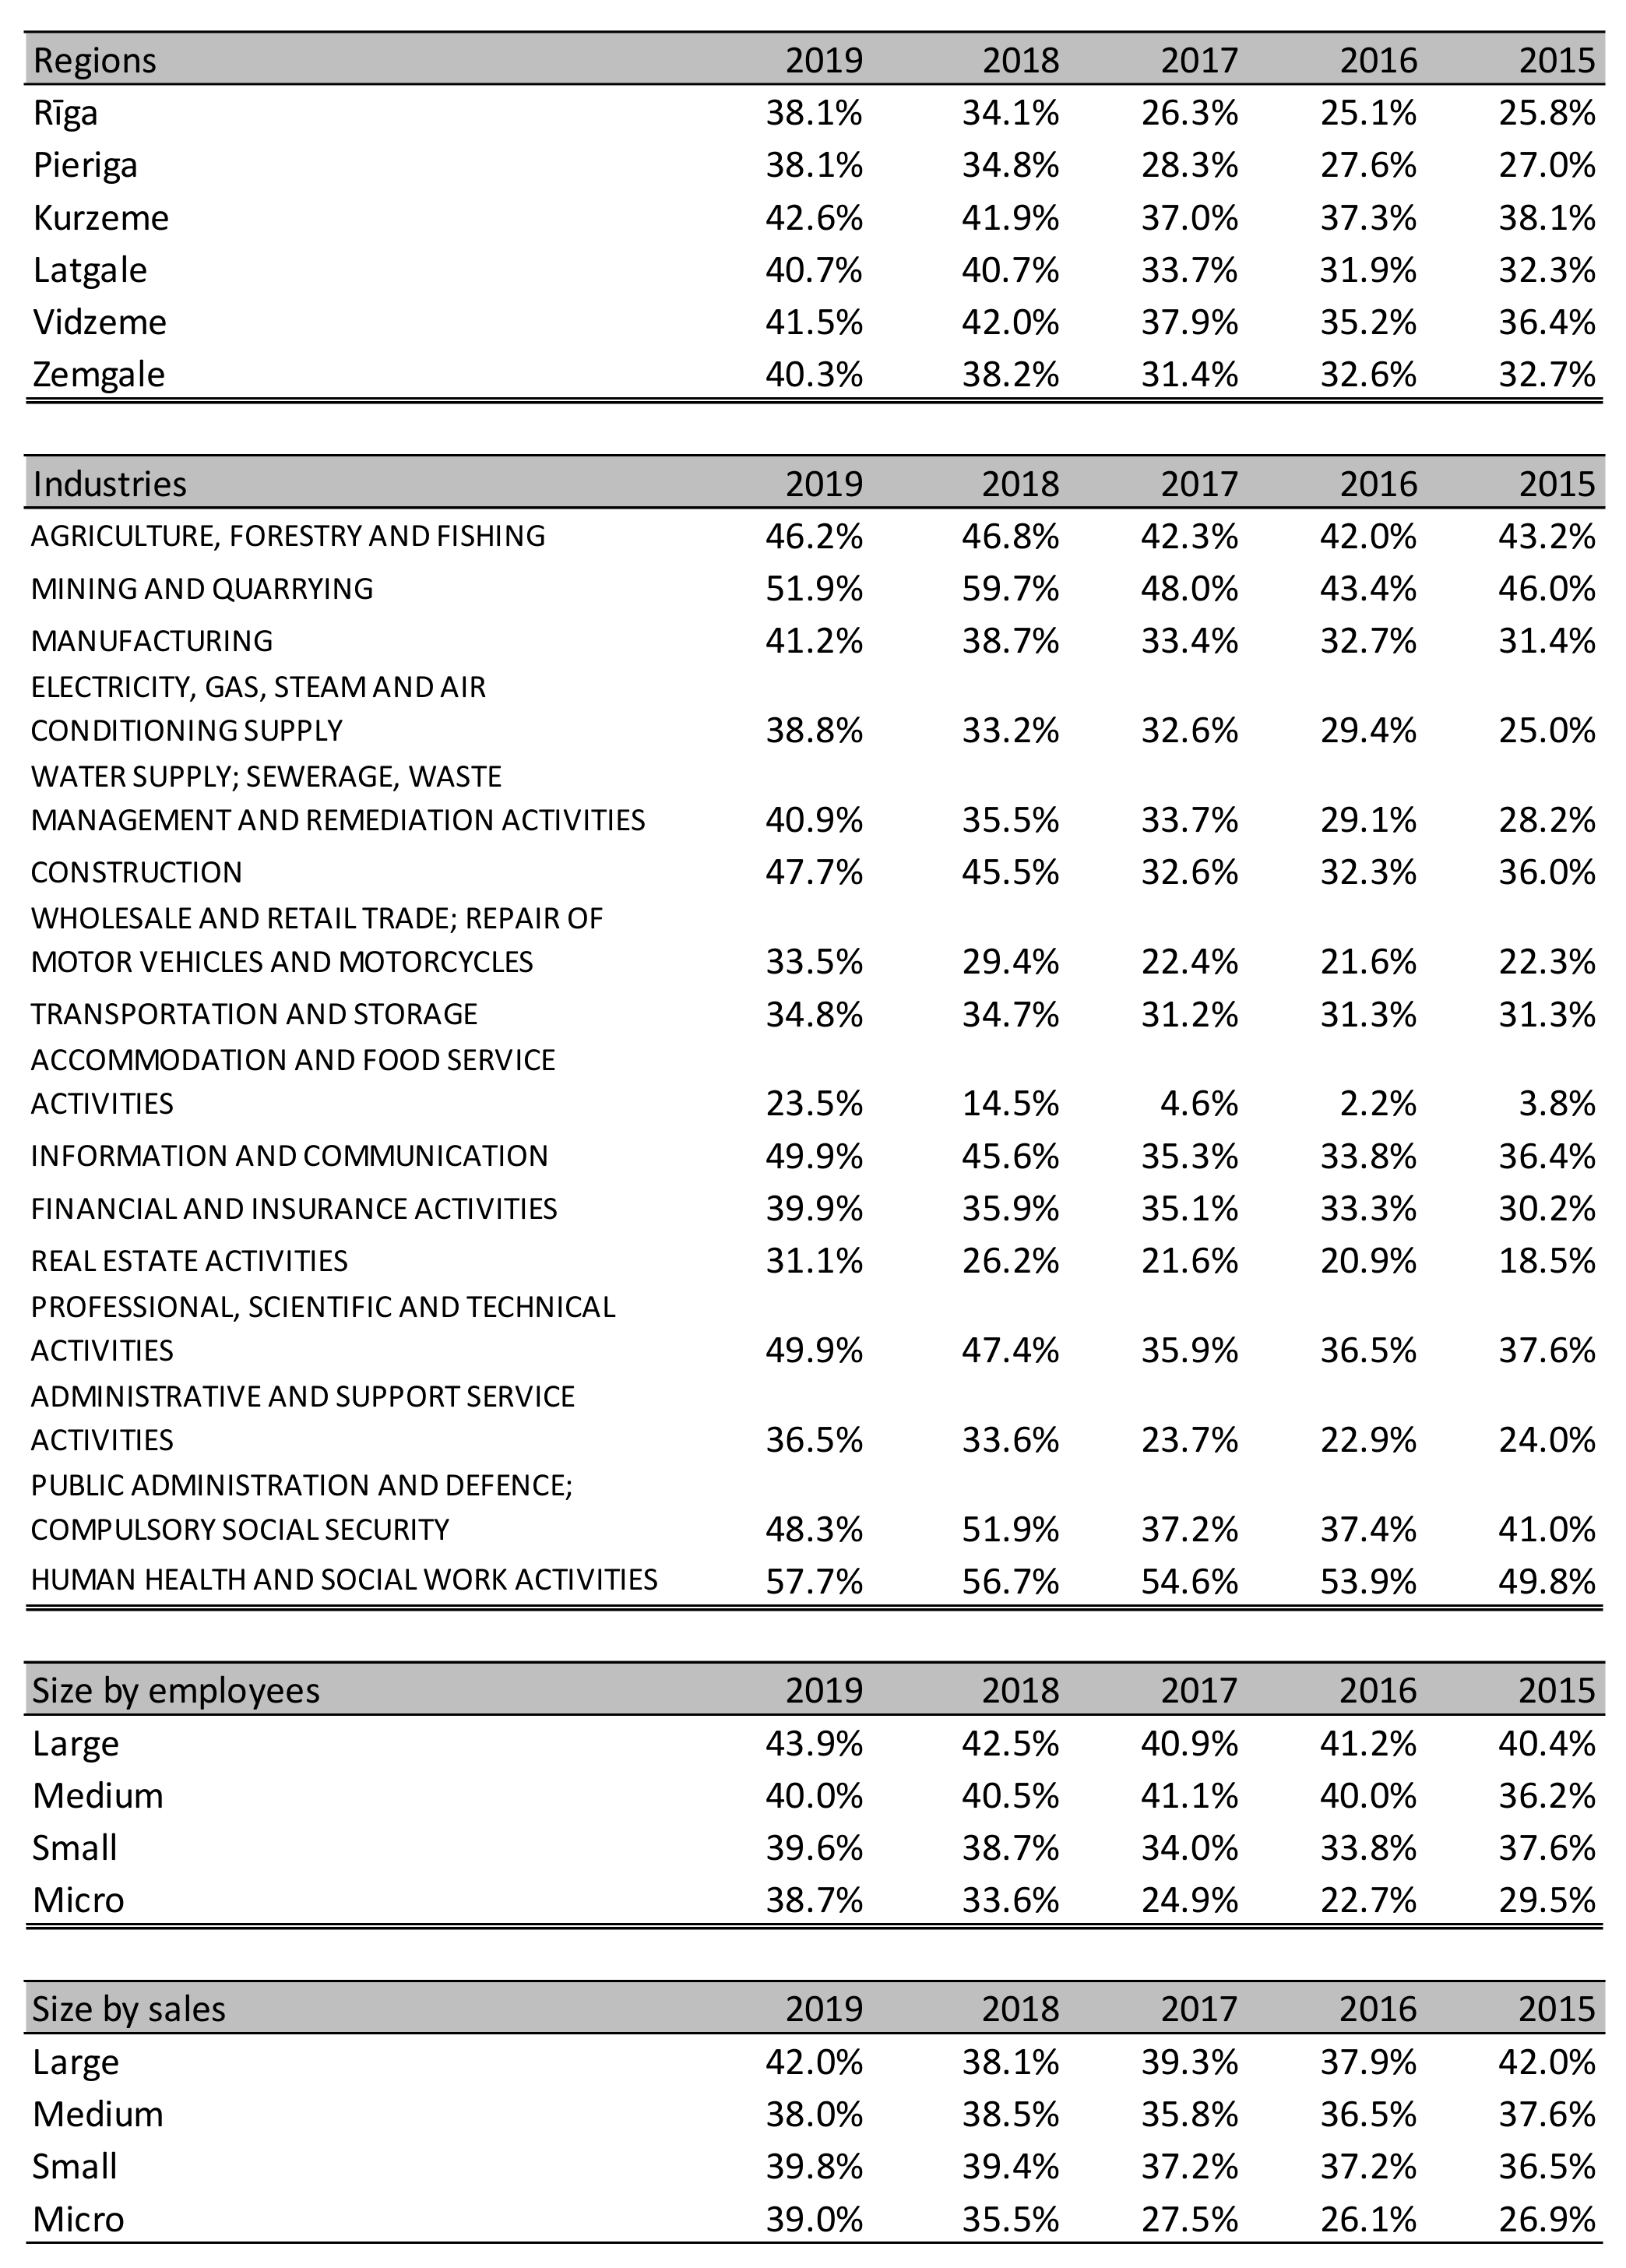
Clearly, a positive trend in equity ratio is seen starting with 2018, which was most probably spurred by the tax reform, which imposes 0% income tax rate on the reinvested earnings, stimulating companies to retain a larger share of earnings to have more stable balance sheets and to be able to expand operations further. The median equity ratio level as of 2019 was 39%, which corresponds to the average level of European companies that have an equity ratio of 41% (
Figure 10). However, it is also interesting that there are quite a lot of companies having over 60% equity capital on total assets, which might hint about very conservative enterprise management and lack of intention to risk growing the company further.
The differences in equity capital by industry are not very significant with few exceptions such as accommodation and food service companies—the balance sheets of which are poorly financed with equity capital—or health services, which vice versa, are very well-financed.
Classifying the companies by region, we could not state there is a significance difference based on headquarters’ location. However, considering the size of the company, it is seen that large companies have more conservative balance sheets as have a larger share of equity capital compared to small companies, therefore appearing to be more conservative, which provides them with better access to capital in terms of the amount and interest rates (
Appendix I).
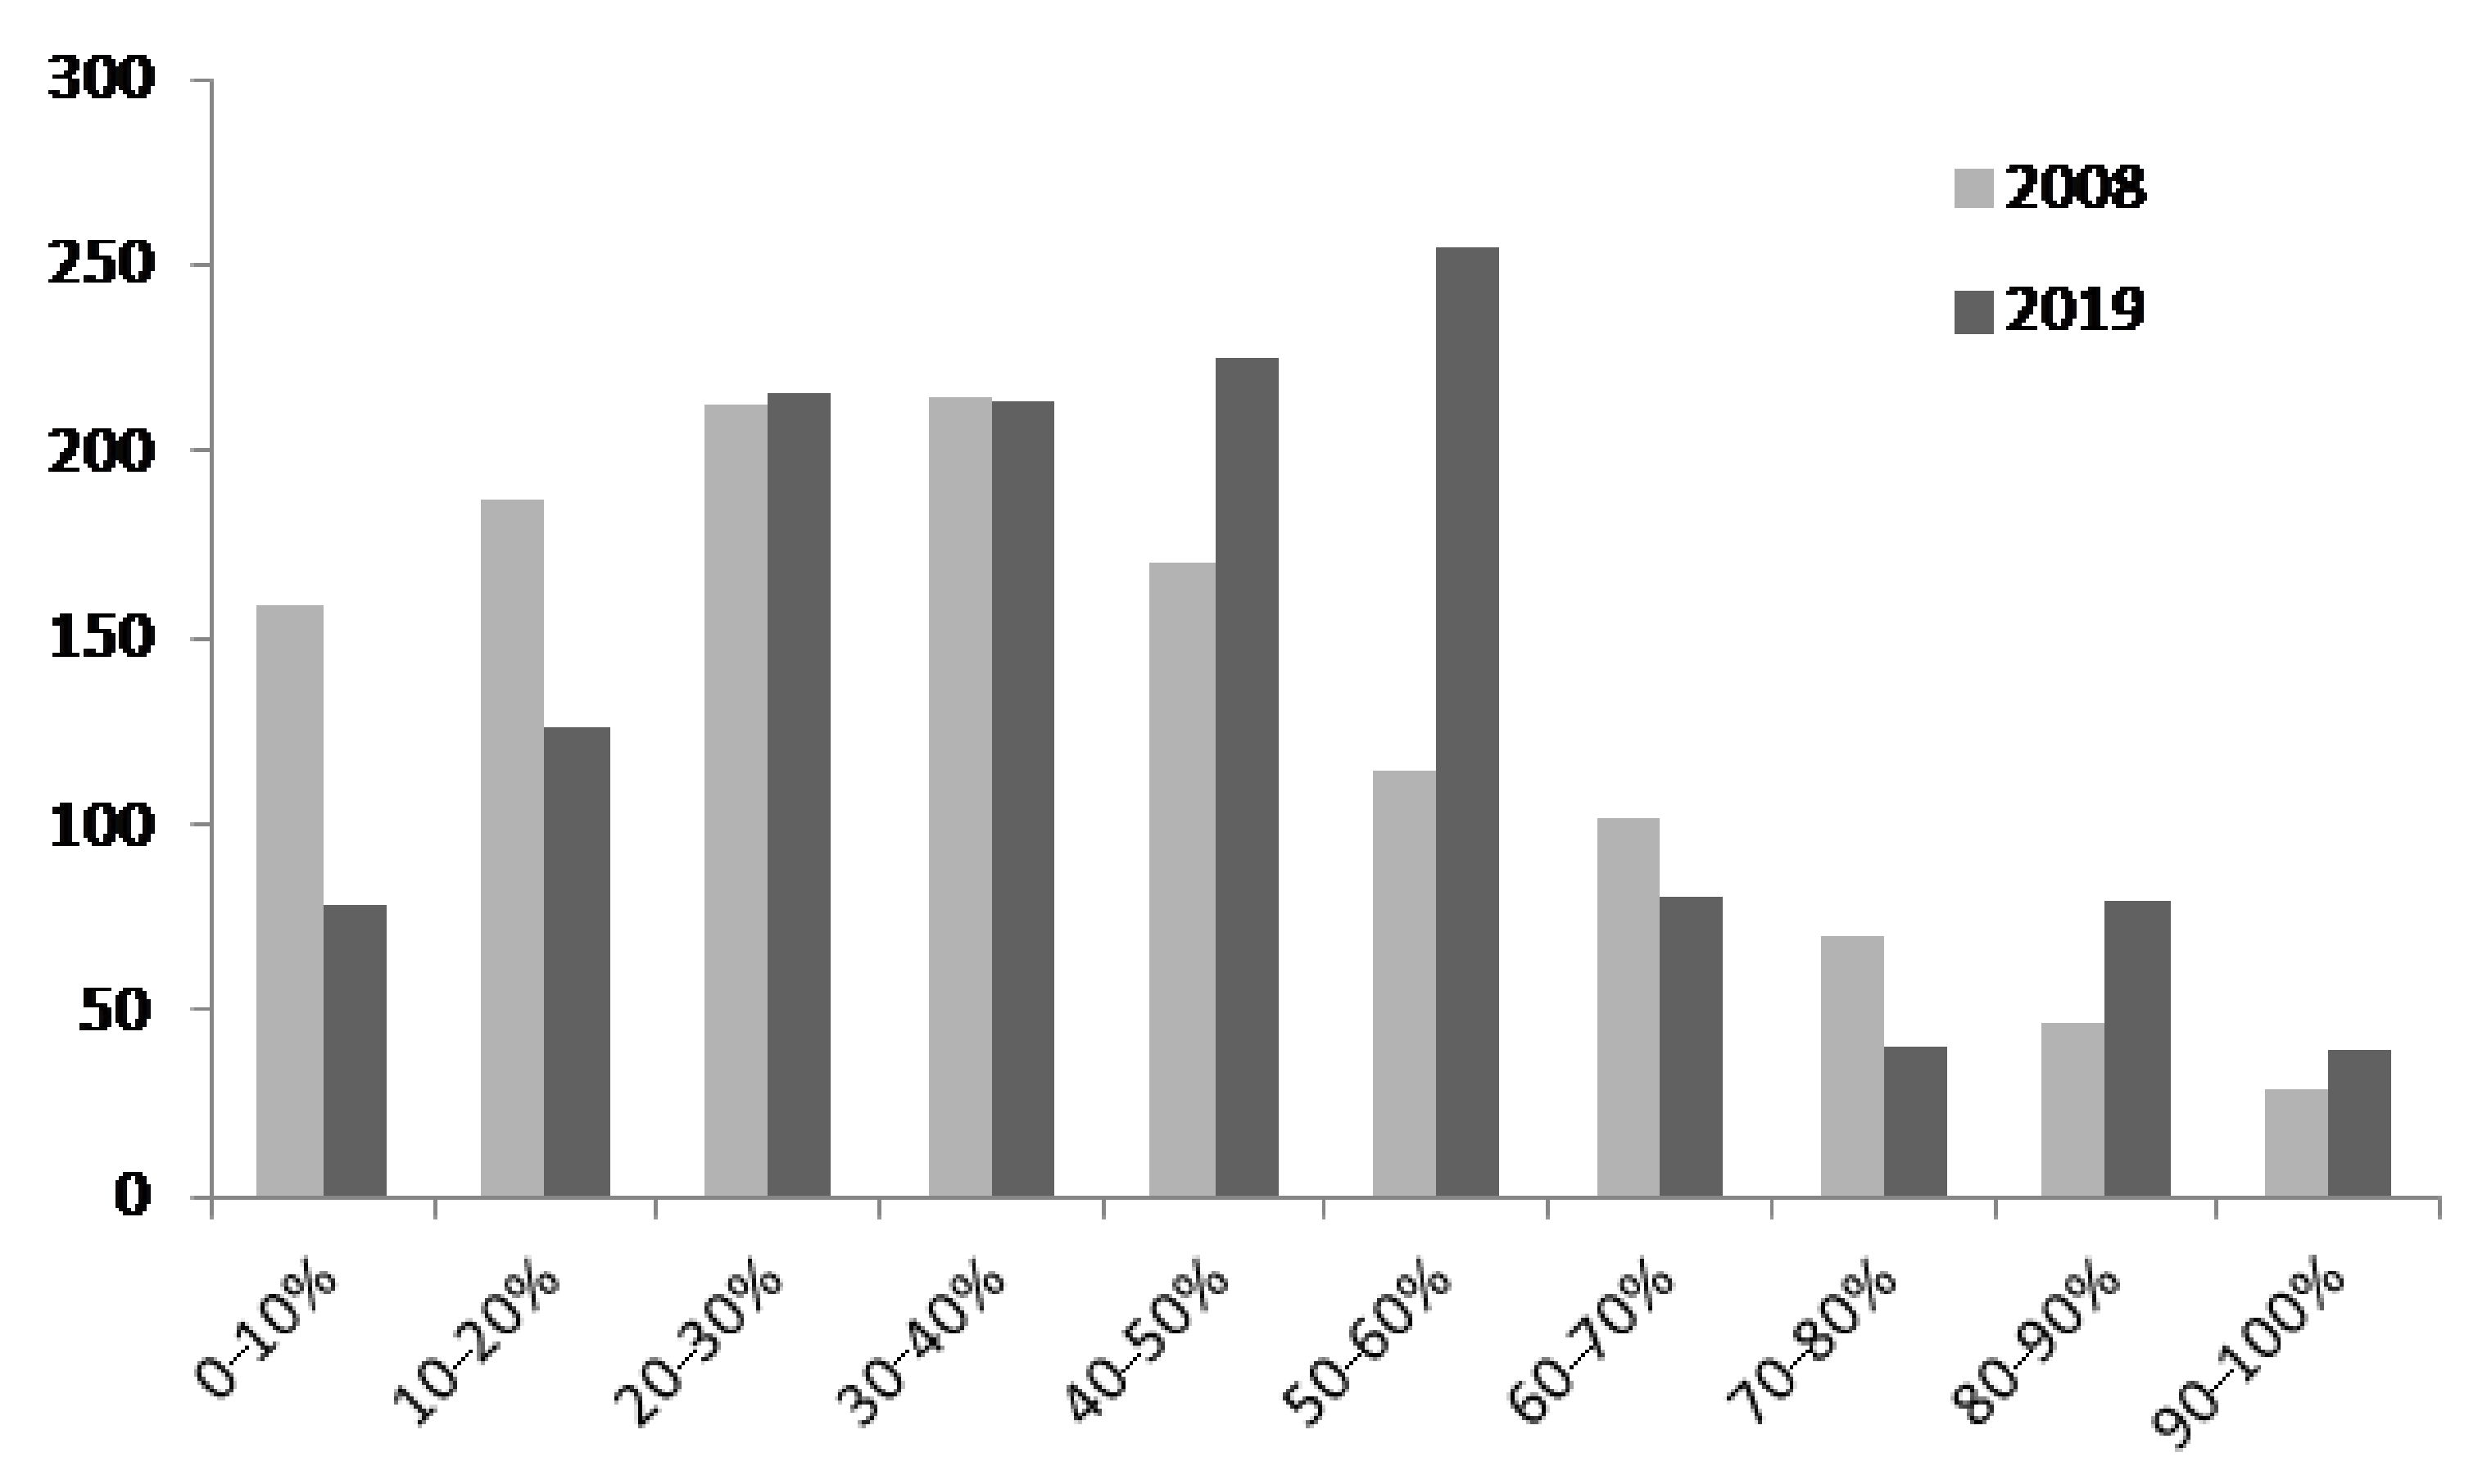
5.3. Lessons Learned during the Past Crisis?
It was imperative for us to look at the behavior of the companies after the financial crisis of 2008, whether the lesson on the business sustainability has been learned, and whether the companies made certain adjustments with regard to their capital structure management. To do that, we have selected a constant sample of companies with turnover not less than EUR 150,000, which have been uninterruptedly operating throughout the period from 2008 to 2019 and which had complete data on equity and total assets, and analyzed companies’ approach towards capital structure. For this type of data extraction, Amadeus database was used, as it covers a longer timeline.
The obtained results lead to an obvious conclusion that the management acts more responsible by having higher exposure to own funds, being less dependent on financing via borrowing. The companies with negative equity capital reduced almost two times—from 7.5% of the whole sample to 4%. Sixty percent of the companies in the data sample experience an increased equity ratio. The median equity ratio grew from 32 to 40%.
When splitting the companies into equity ratio buckets with 10% intervals, we see that the number of companies significantly decreases in the buckets with very low equity ratio of less than 20%, while the major addition is seen in the interval of 40–60%, which might be considered as an optimal company structure, which is an important factor in reaching a decent crisis-resistance level. Interestingly, the number of firms having a very high equity ratio of >80% has also increased during the analyzed period (
Figure 11).
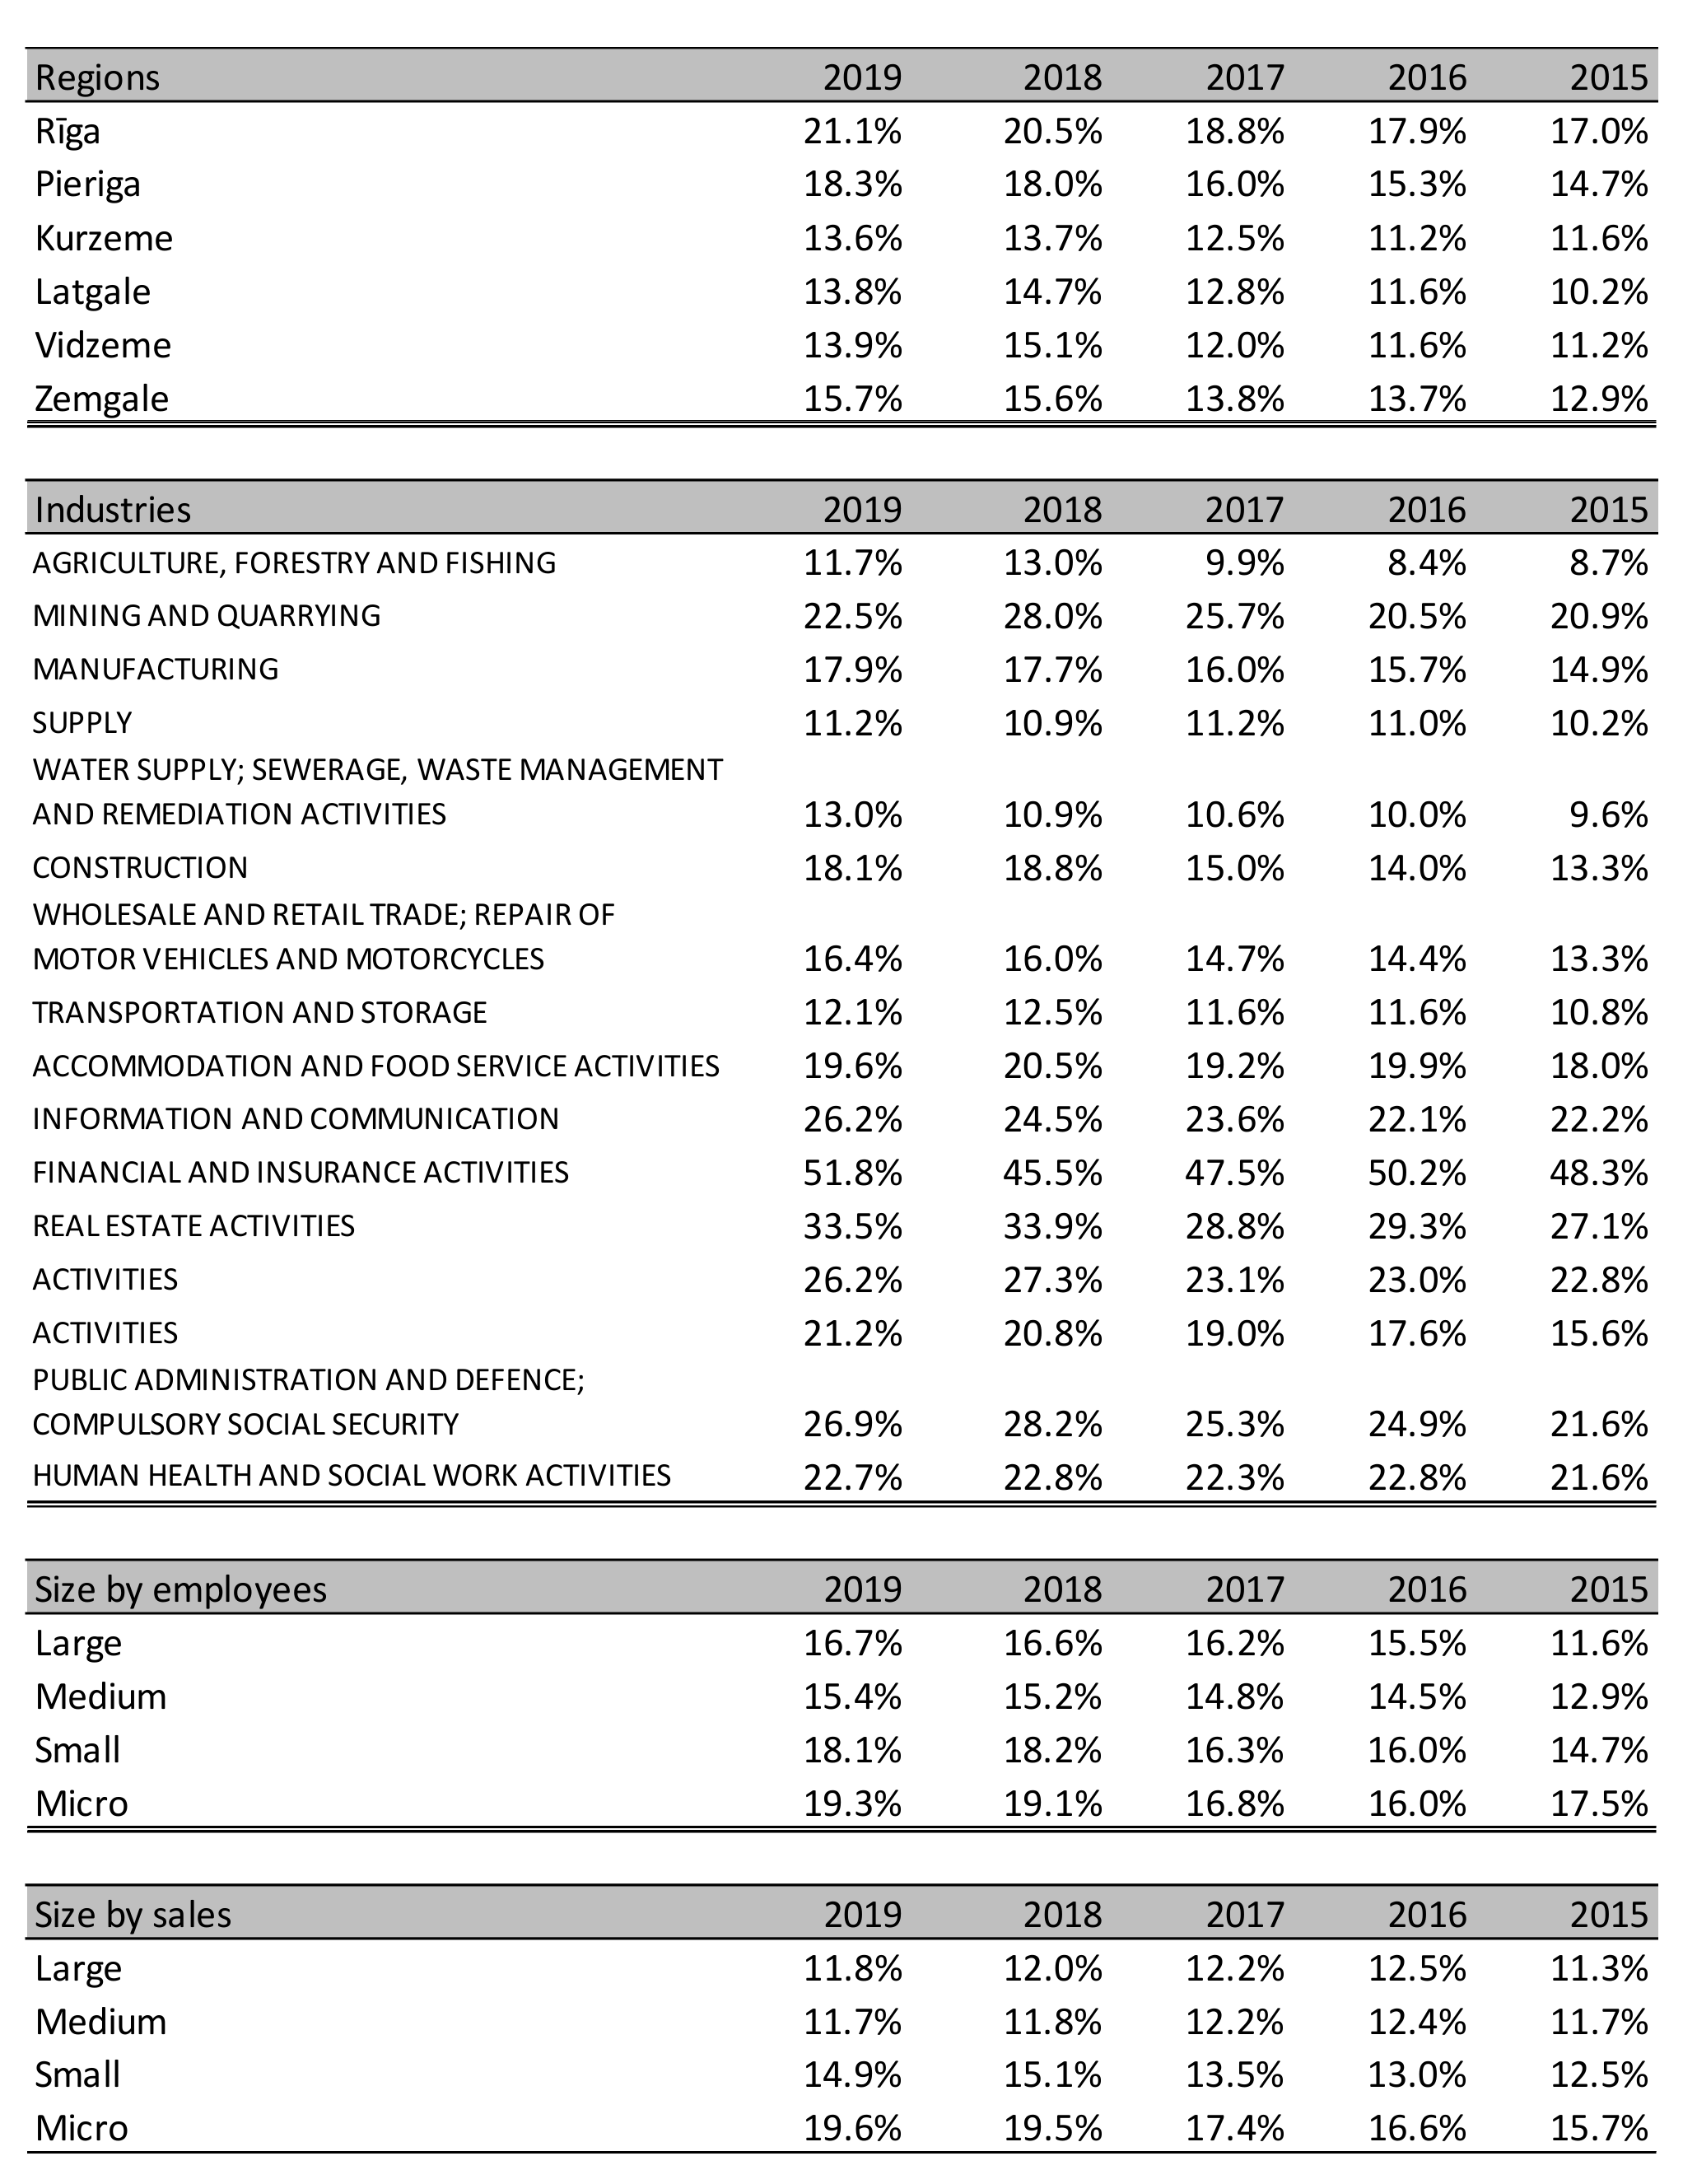
The most encouraging fact is that the fastest improvement in terms of reliance on equity capital is seen among the group with the riskiest balance sheets, i.e., with the lowest equity ratio (
Table 1).
This effect can be partially attributed to the changed tax legislation, which assumes 0% tax rate in case of retained earnings that allowed the companies to strengthen their balance sheets, therefore increasing their balance sheet robustness appearing more attractive for loan issuers.
5.4. Crisis-Resilience Assessment
The overall crisis-resilience of an average Latvian enterprise can be determined at the moderate level. It is being positively influenced by rather limited dependence on the borrowed capital, low debt servicing expenses relative to the earnings ability, and decent efficiency of capital management. On the negative side, cash reserves are quite low and can be easily depleted if the crisis strikes. Additionally, the profit margin, which is an indication of the enterprises’ competitive advantage and pricing power, is generally on a low level, therefore making the companies more vulnerable in case of economic downturn. The risk of failure is significantly reinforced in case of high operating leverage. Operating leverage, being at a high level, as in the case of Latvian companies, hints about a high fixed cost amount, which can send the company, affected by economic cycles, in trouble at worsening economic conditions or by demand absence common during the lockdowns. On the industry level, we see that the most affected industry is accommodation and food service companies, which are not only characterized by the cyclical nature, but also have poor financial conditions. Most robust companies are the ones operating in the information technology industry and the ones providing professional, technical, and scientific services.
6. Conclusions
The present article provides an insight into the evaluation of Latvian companies’ crisis-resilience and competitiveness based on financial analysis. The obtained findings allowed us to make a conclusion on the corporate financial sustainability, which has significantly increased during the analyzed period, primarily giving credit to the improved balance sheet quality.
Considering the financial conditions of Latvian companies at the end of financial year 2019 and the major trends, we can state that there were major improvement trends on all financial dimensions, which are particularly well seen during the last two years, when the companies received a tailwind from the fiscal reform regarding the reinvested profit coupled with favorable economic development. However, there is a large gap between the companies of good and poor quality applied to the majority of analyzed ratios. The difference in the quality of financial conditions is well seen among the industries: IT medical and professional services lead the crowd having the highest profitability ratios and the strongest balance sheets, while the companies operating in trade, in accommodation and food services, and in transportation industries struggle the most. It is worth noticing that the agricultural industry, which is well subsidized, does not belong to the critical industries, rather the opposite: it has earned top positions according to the profitability assessment. Study results on the regional dimension did not come as a surprise: the strongest companies are located in Riga, where they operate in a well-developed business environment and have better access to financing and management talents, while the weakest ones are located in Vidzeme and Latgale. Detected regional difference is less than it was expected, and it is not significant if applied to all ratios.
We find that Latvian companies’ crisis preparedness sits on a moderate level thanks to the efficient capital management and relatively modest debt servicing cost, but at the same time, the companies have relatively low margin levels at high fixed costs.
There are several limitations applied to this research. First, a company’s crisis resilience and competitiveness are assessed only based on the financial ratios, while qualitative factors are not included in the evaluation. Second, the research scope is limited by the country and by the period. The latter is limited by the data availability, while the limitation of the former is done intentionally to be able to make a broad assessment within one country. Third, the study is based on the data, the latest observation point of which is the financial year 2019, and therefore, the pandemic-caused economic recession and state support measures are not reflected in the results.
7. Recommendations and Proposals for Further Studies
There are several directions the state policy could be developed to support the building of the resilience of the national economy on the microeconomic level. Surely, the overall competitiveness of Latvian enterprises is on a low level, which can be explained by the inability and/or unwillingness to invest in innovative products, services, and processes as often R&D investments are associated with great uncertainty. Thus, these types of investment should be supported by the state institutions, probably backed by the academic sector.
Additionally, we see a significant gap between good and poor companies, so additional research should be undertaken to understand what drives this inequality—unfair competition, unequal access to funding and to management talents, or other factors. Based on the findings, the state policy should be developed or the legislation should be altered.
The average quality of companies depending on the industry they operate in varies greatly, and some industries look much more beneficial compared to others. The most critical are obviously accommodation and food services as well as the gas and electricity sector. Further research could concentrate on both of these industries to detect the reasons for them to be so inefficient and weak according to a number of ratios. Then, certain support measures could be undertaken such as tax rebates or other stimuli.
It seems that the problem with working capital management is not new among Latvian companies [
33,
34], and it is still present according to the research results. The absolute liquidity ratio is on the suboptimal level, indicating the inability to cover short-term liabilities, which do not appear to be bank borrowing, but rather payables to the stakeholders. This finding deserves additional attention to detect the reasons behind these problems and to determine whether it is the shortage of bank lending or lack of skills in working capital management or there exists another trigger of this problem.
Further research should be undertaken to put the quality of Latvian firms’ financial conditions in a detailed context with their European counterparts with particular focus on neighboring Lithuania and Estonia, which tend to compete with Latvia for talents and capital on a global arena.
Author Contributions
Conceptualization, J.B., N.L. and L.K.; methodology, J.B. and N.L.; software, J.B.; validation, N.L. and L.K.; formal analysis, J.B.; investigation, J.B. and N.L.; resources, L.K.; data curation, J.B. and L.K.; writing—original draft preparation, J.B.; writing—review and editing, J.B., N.L. and L.K.; visualization, J.B.; supervision, N.L.; project administration, N.L.; funding acquisition, N.L. All authors have read and agreed to the published version of the manuscript.
Funding
This research is funded by the Department of Corporate Finance and Economics of Riga Technical University.
Institutional Review Board Statement
Not applicable.
Informed Consent Statement
Not applicable.
Data Availability Statement
Restrictions apply to the availability of these data. Raw data was obtained from Firmas.lv and are available at
https://www.firmas.lv/ with the permission of the company Firmas.lv.
Acknowledgments
We are very grateful to Firmas.lv company, which provided raw data to form a comprehensive database on financial data of Latvian companies for the period from 2015 to 2019. The paper was elaborated within the National Research Program (NRP) Economic, Political, and Legal Framework for Preserving Latvia’s Economic Potential and Promoting Competitiveness after the Pandemic Crisis (reCOVery-LV) (VPP-COVID-2020/1-0010).
Conflicts of Interest
The funders had no role in the design of the study; in the collection, analyses, or interpretation of data; in the writing of the manuscript, or in the decision to publish the results.
Appendix A. Profit Margins by Region, Industry, Company Size
Figure A1.
Gross profit margin.
Figure A1.
Gross profit margin.
Figure A2.
Operating profit margin.
Figure A2.
Operating profit margin.
Figure A3.
Net profit margin.
Figure A3.
Net profit margin.
Appendix B. Return on Equity by Region, Industry, Company Size
Figure A4.
Return on equity.
Figure A4.
Return on equity.
Appendix C. Operating Leverage by Region, Industry, Company Size
Figure A5.
Operating leverage.
Figure A5.
Operating leverage.
Appendix D. Cash to Assets Ratio by Region, Industry, Company Size
Figure A6.
Cash to assets.
Figure A6.
Cash to assets.
Appendix E. Absolute Liquidity Ratio by Region, Industry, Company Size
Figure A7.
Absolute liquidity.
Figure A7.
Absolute liquidity.
Appendix F. Interest Coverage Ratio by Region, Industry, Company Size
Figure A8.
Interest coverage ratio.
Figure A8.
Interest coverage ratio.
Appendix G. Net Debt to EBIT Ratio by Region, Industry, Company Size
Figure A9.
Net debt to EBIT.
Figure A9.
Net debt to EBIT.
Appendix H. Equity Sufficiency by Region, Industry, Company Size
Figure A10.
Equity capital sufficiency.
Figure A10.
Equity capital sufficiency.
Appendix I. Equity Ratio by Region, Industry, Company Size
Figure A11.
Equity ratio.
Figure A11.
Equity ratio.
Appendix J. Median Financial Ratios of European Companies, Constituents of Stoxx 600
Table A1.
Financial ratios of Stoxx 60 companies
Table A1.
Financial ratios of Stoxx 60 companies
| Financial Ratios | Median, as of 31 December 2019 |
|---|
| Gross profit margin | 42.8% |
| Operating profit margin | 13.0% |
| Net profit margin | 10.3% |
| ROE | 13.3% |
| Cash to total assets | 6.7% |
| Cash to current liabilities | 27.1% |
| Intangible to total assets | 17.1% |
| Equity ratio | 41.1% |
| Interest coverage ratio | 11.11 |
References
- Stephany, F.; Stoehr, N.; Darius, P.; Neuhäuser, L.; Teutloff, O.; Braesemann, F. Which industries are most severely affected by the COVID-19 pandemic? A data-mining approach to identify industry-specific risks in real-time. arXiv 2020, arXiv:2003.12432 2020. [Google Scholar]
- Dua, A.; Ellingrud, K.; Mahajan, D.; Silberg, J. McKinsey. Which Small Businesses Are Most Vulnerable to COVID-19—and When. 2020. Available online: https://www.mckinsey.com/~/media/McKinsey/Featured%20Insights/Americas/Which%20small%20businesses%20are%20most%20vulnerable%20to%20COVID%2019%20and%20when/Which-small-businesses-are-most-vulnerable-to-COVID-19-and-when-final.pdf (accessed on 10 November 2020).
- OECD. The Territorial Impact of COVID-19: Managing the Crisis Across Levels of Government. 2020. Available online: http://www.oecd.org/coronavirus/policy-responses/the-territorial-impact-of-covid-19-managing-the-crisis-across-levels-of-government-d3e314e1/ (accessed on 10 November 2020).
- Djankov, S. What Governments Are Doing to Increase Firms’ Chances of Survival During COVID-19. Brink. Available online: https://www.brinknews.com/what-governments-are-doing-to-increase-firms-chances-of-survival-during-covid-19/ (accessed on 10 November 2020).
- Smid, T.; Ciobica, I. 2020 Insolvencies Forecast to Jump Due to Covid-19. Atradius. Available online: https://group.atradius.com/publications/economic-research/2020-insolvencies-forecast-to-jump-due-to-covid-19.html (accessed on 10 November 2020).
- Reeves, M.; Deimler, M. Adaptability: The New Competitive Advantage; Harvard Business Review: Brighton, WI, USA, 2011. [Google Scholar]
- Mioduchowska-Jaroszewicz, E. Information Asymmetry and Financial Statement (Asymetria Informacji a Sprawozdanie Finansowe); Research Reports; University of Warsaw, Faculty of Management: Warsaw, Poland, 2018; Volume 1, pp. 45–53. [Google Scholar]
- OECD. Corporate Governance in Latvia; OECD: Paris, France, 2016. [Google Scholar]
- Stoltz, P.G. Building Resilience for Uncertain Times; Wiley: Hoboken, NJ, USA, 2004. [Google Scholar]
- Hamel, G.; Valikangas, L. The Quest for Resilience; Harvard Business Review: Brighton, WI, USA, 2003; Volume 81, pp. 52–65. [Google Scholar]
- Peneder, M.; Rammer, C. Measuring Competitiveness; Ref. Ares(2018)1159686-01/03/2018; Centre for European Economic Research (CEER): Mannheim, Germany; Austrian Institute of Economic Research (AIER): Wien, Austria, 2018; Available online: https://www.econstor.eu/bitstream/10419/181906/1/1029368589.pdf (accessed on 10 November 2020).
- Carricano, M. Who Are the Pricing Power Leaders?—Pricing Power as a Sustainable Competitive Advantage. 2016. Available online: https://www.aaltoee.com/aalto-leaders-insight/2016/who-are-the-pricing-power-leaders-pricing-power-as-a-sustainable-competitive-advantage (accessed on 28 November 2020).
- Geroski, P.; Machin, S.; Van Reenen, J. The Profitability of Innovating Firms. RAND J. Econ. 1993, 24, 198–211. [Google Scholar] [CrossRef]
- Elnasri, A.; Fox, K.J. R&D, Innovation and Productivity: The Role of Public Support. KDI J. Econ. Policy 2015, 37, 73–96. [Google Scholar]
- Haskel, J.; Wallis, G. Public Support For Innovation, Intangible Investment And Productivity Growth In The UK Market Sector; Working Papers 5280; Imperial College, Imperial College Business School: London, UK, 2013; Available online: http://ftp.iza.org/dp4772.pdf (accessed on 10 November 2020).
- Hall, B.H.; Lerner, J. The Financing of R&D and Innovation. In Handbook of the Economics of Innovation, 1st ed.; North Holland: Amsterdam, The Netherlands, 2010; pp. 609–639. [Google Scholar]
- Ando, K.; Matsumoto, K.; Matsumoto, Y. Business Performance of Firms Using Debt. Public Policy Rev. 2017, 13, 167–182. [Google Scholar]
- Petersen, B.; Strongin, S. Why Are Some Industries More Cyclical than Others? J. Bus. Econ. Stat. 1996, 14, 189–198. [Google Scholar]
- Deloitte. Standing up through the Storm—Make Your Organisation Crisis Resilient. 2018. Available online: https://www2.deloitte.com/content/dam/Deloitte/uk/Documents/risk/deloitte-uk-make-your-organisation-crisis-resilience.pdf (accessed on 10 November 2020).
- Brochet, F.; Loumioti, M.; Serafeim, G. Speaking of the Short-Term: Disclosure Horizon and Managerial Myopia. Rev. Account. Stud. 2015, 20, 1122–1163. [Google Scholar] [CrossRef]
- Jüttner, U.; Maklan, S. Supply chain resilience in the global financial crisis—An empirical study. Supply Chain Manag. Int. J. 2011, 16, 246–259. [Google Scholar]
- Ponomarov, S.; Holcomb, M. Understanding the concept of supply chain resilience. Int. J. Logist. Manag. 2009, 20, 124–143. [Google Scholar] [CrossRef]
- Rudrajeet, P.; Andersson, R.; Torstensson, H. Organisational resilience through crisis strategic planning: A study of Swedish textile SMEs in financial crises of 2007–2011. Int. J. Decis. Sci. Risk Manag. 2012, 4.3, 314–341. [Google Scholar]
- Leta. Gauss: «airBaltic» No Krīzes Izies Ļoti Spēcīga. 3 September 2020. Available online: https://www.lsm.lv/raksts/zinas/ekonomika/gauss-airbaltic-no-krizes-izies-loti-speciga.a372889/ (accessed on 23 December 2020).
- Guerini, M.; Nesta, L.; Ragot, X.; Schiavo, S. Firm Liquidity and Solvency under the Covid-19 Lockdown in France. OFCE Policy Brief, 6 July 2020; Volume 76. [Google Scholar]
- Bosio, E.; Djankov, S.; Jolevski, F.; Ramalho, R. Survival of Firms during Economic Crisis; World Bank Policy Research Working Paper No. 9239; The World Bank: Washington, DC, USA, 2020. [Google Scholar]
- Agrawal, S.; De Smet, A.; Lacroix, S.; Reich, A. McKinsey. To Emerge Stronger from the COVID-19 Crisis, Companies Should Start Reskilling Their Workforces Now. 2020. Available online: https://www.mckinsey.com/~/media/McKinsey/Business%20Functions/Organization/Our%20Insights/To%20emerge%20stronger%20from%20the%20COVID%2019%20crisis%20companies%20should%20start%20reskilling%20their%20workforces%20now/To-emerge-stronger-from-the-COVID-19-crisis.pdf (accessed on 10 November 2020).
- Gulati, R.; Nohria, N.; Wohlegezogen, F. Roaring Out of Recession; Harvard Business Review: Brighton, WI, USA, 2010. [Google Scholar]
- European Commission. User Guide to the SME Definition. 2020. Available online: https://ec.europa.eu/growth/smes/sme-definition_en (accessed on 10 November 2020).
- Lace, N.; Sundukova, Z. Company’s standards for financial soundness indicators. In Proceedings of the 6th International Scientific Conference Business and Management, Vilnius, Lithuania, 13–14 May 2010; pp. 112–117. [Google Scholar]
- Deloitte. A Brave New World—The Retail Profitability Challenge. March 2017. Available online: https://www2.deloitte.com/content/dam/Deloitte/uk/Documents/ConsumerIndustrialProducts/deloitte-uk-a-brave-new-world.pdf (accessed on 10 November 2020).
- Banerje, R.; Hofmann, B. The Rise of Zombie Firms: Causes and Consequences. BIS Quarterly Review. 2018. Available online: https://www.bis.org/publ/qtrpdf/r_qt1809g.pdf (accessed on 15 December 2020).
- Arbidane, I.; Ignatjeva, S. The Relationship between Working Capital Management and Profitability: A Latvian Case. In Proceedings of the European Business Research Conference, Rome, Italy, 27–28 August 2012. [Google Scholar]
- Analītisko pētījumu un stratēģiju laboratorija, Par Latvijas uzņēmumu prioritātēm un galvenajām problēmām ārējā ekonomiskajā darbībā, eksporta veicināšanu un ārējās konkurētspējas paaugstināšanu. Pēc LR Ekonomikas ministrijas pasūtījuma. 2007–2008. Available online: http://www.knl.lv/raksti_data/749/EksportaPetijums.doc (accessed on 23 December 2020).
| Publisher’s Note: MDPI stays neutral with regard to jurisdictional claims in published maps and institutional affiliations. |
© 2021 by the authors. Licensee MDPI, Basel, Switzerland. This article is an open access article distributed under the terms and conditions of the Creative Commons Attribution (CC BY) license (http://creativecommons.org/licenses/by/4.0/).


