Abstract
Urbanization involves expansion of the amount of land covered by urban uses. Rural to urban land conversion (RULC) can satisfy demand for the additional space that growing cities require. However, there can be negative consequences, such as the loss of productive agricultural land and/or the destruction of natural habitats. Considerable interest therefore exists among policy makers and researchers regarding how the efficiency of RULC can be maximized. We used the Gini index and a data envelopment analysis to quantify the relationship between RULC and economic development for 17 metropolitan areas in China. We did this from two perspectives: (i) coordination; and (ii) efficiency. We found that economic agglomeration fosters the coordination of the amount of rural land that is allocated to be converted to urban uses. Similarly, economic agglomeration increases the efficiency of RULC in terms of the processes of socio-economic production. Through production technology innovation and readjustment in the scale of input factors, the productive efficiency of RULC can be promoted. Our findings suggest a need to strictly limit the amount of RULC, design differential land management policies according to location and development level, and adjust RULC allocation between different cities. Further, in harnessing the potential of intensive urban land use and restructuring, production factors, including land, can be enhanced through technological innovation. Research presented in this paper provides insights for areas of the world which are yet to undergo the rapid urbanization that China has experienced, but where it is projected to occur over the coming decades.
1. Introduction
The world is becoming increasingly urbanized across both developed and developing nations. Highly densely urbanized areas like southern England’s metropolitan area around London [1,2], the Northeastern Atlantic city cluster, the Great Lakes urban agglomeration [3], and the urban agglomeration in Northwest Europe [2,4,5] have all become nodes of global economic growth. Growth to date has been fastest in Asia, especially in Japan’s Pacific Coastal city group [6], with African nations set to experience similarly rapid urban expansion in the near future [7].
Urbanization is a particularly important driver of economic growth, and economic growth, in turn, promotes urbanization. However, city expansion often encroaches onto farmland [8,9]. Rural to urban land conversion (RULC) refers to the process through which agricultural land in the rural-urban fringe is converted into land that can be built upon, by economic or political means, in order to meet a city’s demand for land [10]. RULC is therefore a key process through which the demand is met for the additional space that growing cities in rural areas require, but can also lead to the loss of valuable and productive agricultural plots and associated losses of livelihood activities for those formerly living in those areas [11,12]. Moreover, RULC has substantial impacts on ecosystems and the environment, causing problems such as loss of habitat for biodiversity, functional degradation of soil and water bodies, deterioration of air quality, high CO2 emissions, and urban heat island effects [13,14].
Densifying urbanization while sparing land offers many benefits, such as reduced RULC [15], lower resource demands, and lower carbon emissions [16]. Metropolitan areas have become major geographic units for promoting the densification of urbanization due to their capability to gather together people and industry and build economic strength [17]. This phenomenon is particularly significant in emerging and developing countries like China [18]. China is in a critical period in which its economic structure is being readjusted and development patterns are changing. However, economic development is unbalanced, both between different cities and between rural and urban areas [19]. Metropolitan areas are intended to play a leading role in addressing this problem and have increasingly been the subject of debate among policy makers [20].
A metropolitan area can be defined as a system of cities in a district comprising a considerable number of differently sized cities with different characteristics and hierarchies [21]. The 2010 China Metropolitan Area Development Report defined metropolitan areas as regions >20,000 km2, with a population of at least 20 million, comprising a minimum of three cities. The GDP of the core cities must account for more than 45% of the region’s total, with their urbanization level at >50% and economic density over 5 million yuan per km2 [22]. Based on natural interactions, a modern infrastructure network and a highly developed information network, and with one or two super-or extra-large cities as an economic core, the cities develop relationships and together constitute a relatively comprehensive urban system [23,24,25]. Metropolitan areas have varying demographic, structural and spatial characteristics, but share the following features: (i) formation and development of a metropolitan area generally follows a dynamic process of self-organization; (ii) metropolitan areas create a spatial network comprising cities within a given geographic area; and (iii) cities within metropolitan areas collect and disperse or redistribute resources to other cities [26,27,28].
The development of metropolitan areas in China has experienced the processes described above [29]. Before 1978, China’s urbanization rate was relatively low (17.9%). To some extent the household registration system which divides households into urban and rural types constrained people, reducing their ability to move from rural to urban areas, hindering urbanization. Since reform and opening in 1978, economic development zones have vigorously established in many of the country’s coastal cities. Urban land markets opened in 1987 that promoted the flow of urban land resources [30]. Comparative advantages in terms of low cost land and plentiful cheap labour attracted foreign direct investment. This accelerated the development of the Yangtze River Delta, Pearl River Delta, and Beijing-Tianjin-Hebei metropolitan areas. The coastal priority development strategy strengthened the above-mentioned east coast metropolitan areas. A T-shaped strategy [31] along the east coast area and Yangtze river in the late 1980s not only promoted the development of coastal metropolitan areas, but also stimulated Wanjiang, Changsha-Zhuzhou-Xiangtan, Wuhan, and Chengyu metropolitan areas. To cope with unbalanced regional development, China’s central government launched a series of regional co-development strategies, such as The Great Western Development Strategy [32], Strategy of Rejuvenating the Old North-eastern Industrial Base [33], and Rise of Central China Plan [34]. Under these approaches, the Urumqi, Lanzhou-Xining, Guanzhong Dianzhong, Beibu Gulf, Chengyu, Mid-southern Liaoning, and Haerbin-Changchun metropolitan areas grew steadily. Similar to what has been seen in Europe and the US, these metropolitan areas have become poles for China’s economic growth [18], with the development of metropolitan areas becoming embedded in national development strategies since 2005.
The development of China’s metropolitan areas is nevertheless highly reliant upon RULC [35,36], which may have negative impacts on ecosystems and the environment. For the purpose of healthy and sustainable development of metropolitan areas, China’s government implemented a resource-economical and environmentally-friendly metropolitan development policy, with Wuhan and Changsha-Zhuzhou-Xiangtan metropolitan areas listed in pilots in 2007 [37]. Nevertheless the global financial crisis in 2008 constrained fiscal and monetary macro-readjustment and altered the land supply control policy. Capital and land inputs into production strengthened the economic links between different metropolitan areas and the cities’ inner metropolitan areas [38], but at the same time, excess RULC led to inefficiency in land use. This problem gained the attention of the government.
National strategies of metropolitan development have been continually enhanced since 2011 as a consequence. China’s first territorial spatial planning approach, Major Function Oriented Zoning [39], which presents the major functions of different regions and territorial development patterns, places heavy reliance on metropolitan areas and core cities to promote the development of regional economies. In the Outline of China’s 12th Five-Year Plan for Economic and Social Development [40], the government put forward the strategic layout of urbanization, with a focus on the metropolitan areas along with “two horizontal and three longitudinal transport arteries”. The State Plan for New-type Urbanization 2014–2020 centered on improving the quality of eastern metropolitan areas so that they become internationally competitive; while in central and western China, new metropolitan areas should be fostered in key regions where the urban systems are relatively complete, the economy is well developed, and the core cities drive regional development [41].
Economic agglomeration and RULC happen simultaneously in metropolitan areas. Illuminating the nexus between economic agglomeration and optimal RULC can provide a clearer picture of patterns of urban development. Studies associated with economic agglomeration and RULC of metropolitan area generally focus on three aspects: (i) urban sprawl and intensive urban land use in metropolitan areas [8,42,43,44,45,46,47,48,49]; (ii) the relationship between economic development and RULC at administrative scales [50,51,52,53,54,55]; and (iii) RULC efficiency measurement in metropolitan areas [56,57,58,59].
In response to urban sprawl and sparse land use in metropolitan areas, around the world (e.g., USA (Detroit) [42], southern Europe (Athens), Atlantic Europe (Liverpool), central Europe (Leipzig-Halle), and northern Europe (Stockholm)), a mixture of macro measures (e.g., planning, regulation, advocacy and fiscal policies), meso measures (e.g., organizational structure changes, capacity and spending regulations) and micro measures (affecting consumption tastes and preferences) were taken [8]. Unlike urban sprawl in North America and Europe however, metropolitan development in China is happening much faster. Associated complications have been causing environmental degradation and inefficient land use, which means the ratio of inputs to outputs is not maximized in the process of land resources use. Empirical results from Wang et al. (2010) indicated that land use was not intensive in 32 cities in the Yangtze River Delta, Pearl River Delta, and Beijing-Tianjin-Hebei metropolitan areas [43]. Similarly, Shi et al. (2013) found that the average land use efficiency of 16 metropolitan areas in China could only be classified as “medium” (there are five levels: high, medium high, medium, medium low, and low) and that there was spatial variation from the coast to the hinterland [44]. Spatial econometric analysis of Bai et al. (2018) reveals that with the improvement of urbanization, urban eco-efficiency first increases, then declines, and then increases again (N-shaped) [45]. Although Wang (2013) and Tan (2017) tried to explore the uneven growth of urban clusters and set up a logic mechanism framework to optimize metropolitan land use, which included structures based on the features of industrial evolution and land capital agglomeration, the issues surrounding metropolitan land use are much more complicated [46,47].
Economic development induces RULC in given administrative areas [60,61]. Although increasing attention is being paid to the economic development of metropolitan areas [50,51], research on the use of land as a resource in China’s metropolitan areas remains inadequate and requires further investigation to identify how efficiency can be improved. The efficiency of RULC can be defined as the input-output ratio under the established technical level in the process of social economic production with RULC participating. In response to this gap, input-output models have started to be used in RULC efficiency measurement in metropolitan areas. For example, Fang and Guan (2013) measured the efficiency of 23 urban agglomerations in China [56]; Zhang et al. (2013) evaluated the RULC efficiency of the Wuhan metropolitan area [57]; and Huang et al. (2014) quantified the RULC efficiency of 17 metropolitan areas in China [58]. All of the above mentioned assessments concluded that efficiency was relatively poor.
In China, land resources have not been used intensively in most cities, which results in excessive land factor inputs in social economic production. For a given output, the input of land resources is not minimized, so the land use is economically inefficient. This is not surprising given a paucity of theory concerning the impact of metropolitan area development on the efficiency of RULC. Understanding of the relationships between RULC and economic growth in practice is needed, meaning issues like land use efficiency and RULC caused by urban expansion of metropolitan areas require urgent, in-depth study. A gap remains regarding understanding of how efficiently land is used and the pace and extent of RULC driven by urban expansion of metropolitan areas.
In the context of the urbanization patterns and processes outlined above, and tackling the research need that has been identified, this paper aims to shed light on the relationship between economic agglomeration and RULC efficiency in metropolitan areas, assessing whether economic agglomeration leads to the efficiency of RULC. To do this, we examine the coordination degree of RULC allocation and economic development, and measure the productive efficiency of RULC. Through these analyses we identify temporal and spatial differences in the relationships between RULC and the economic development of metropolitan areas in China. Our study helps to address knowledge gaps on efficient metropolitan development and optimal RULC decision-making, both in theory and practice, providing insights from China that may also be relevant to other rapidly urbanizing cities across Asia and Africa.
2. Methodology
2.1. Study Area
To understand the impact of policies on the efficiency of RULC in China, we chose metropolitan areas as our study object. Based on their definition and characteristics, we selected 17 metropolitan areas (which include 131 cities) as the focus for our analyses (Figure 1 and Table 1). The selected metropolitan areas have received the bulk of policy and research attention in China [62,63,64], and have the best data availability.
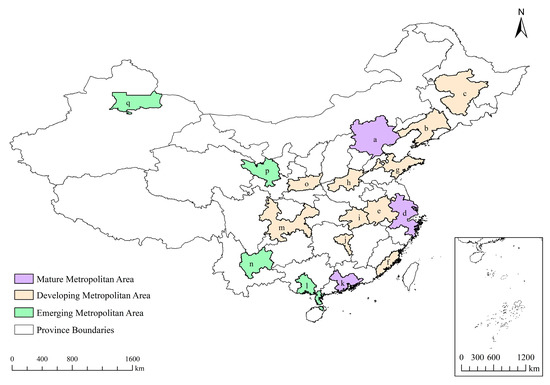
Figure 1.
The 17 metropolitan areas in China comprising the study area.

Table 1.
Chinese metropolitan areas included in this study, showing their region, developmental stage, and number of constituent cities.
To analyze spatial differences in the relationships between RULC and economic development, we considered land and economic policies of different regions (eastern, central and western China) [65] over the period 1999–2016. To examine temporal changes in the relationships between RULC and economic development, we classified metropolitan areas according to their developmental stages. Developmental stages of the metropolitan areas were identified by employing an economic index. Zhang (2013) discerned the developmental stages of metropolitan areas using an evaluation score, based on the scale of the cities in metropolitan areas (population and number of cities), core cities’ development quality (the percentage of GDP which the core cities accounted for), links between constituent cities (highway density and connection intensity of cities), and economic development level (urbanization ratio, per capita GDP, and economic density) [66]. Developmental stages of the 24 metropolitan areas in China were divided into three categories: mature, developing, and emerging. Drawing on Zhang’s results, we classified our 17 metropolitan areas according to their developmental stages (Figure 1 and Table 1).
2.2. Characterizing the Relationship between RULC and Economic Development
2.2.1. Gini Index
In economics, the Gini index (GI) is a measure of statistical dispersion intended to represent the income or wealth distribution of a nation’s residents, and is the most commonly used measurement of inequality [67]. The Gini index is widely used in fields as diverse as sociology, economics, health science, ecology, engineering, and agriculture, and has been adapted to examine the relationship between city size and degree of economic diversification in urban systems [68]. For the kth metropolitan area including n cities, the basic equation of Gini index is as follows:
When the Sk, Tki, Tkj in Equation (1) are represented by the total economic output of the kth metropolitan area, the economic output of the ith city and the jth city respectively, the GIk is the economic Gini index (EGI), EGIk. To obtain the EGI we use the GDP of each city to represent economic outcomes. The value of the EGIk ranges from 0 to 1 and reflects the degree of economic agglomeration of one metropolitan area. When EGIk is 0, there is perfect equality (the economic output of every city in the kth metropolitan area is the same), that is to say, there is no economic agglomeration in this metropolitan area. When EGIk equals 1, there is maximal inequality among values (e.g., for all the cities in the kth metropolitan area, if only one city has all the economic output, and all others have none, the EGIk will be very nearly one). This can be interpreted as meaning that economic development is highly agglomerated into a single city.
When Sk, Tki, Tkj in Equation (1) are represented by the total area of the land converted from rural to urban in the kth metropolitan area, and the area of land converted from rural to urban of the ith city and jth city respectively, the GIk is the RULC scale Gini index (RSGI), RSGIk. RSGIk also ranges from 0 to 1, with a value of 0 indicating perfectly balanced allocation of RULC among cities within a metropolitan area.
The above EGIk and RSGIk are calculated using MatLab software.
2.2.2. Coordination Index
Dividing the EGIk by RSGIk gives the Gini quotient index (GQI), which can be used to compare the economic agglomeration and inequality of RULC allocation in the kth metropolitan area. If the value of GQI is greater than 1, it means that the degree of economic agglomeration is greater than the inequality of RULC allocation; if the value of GQI is lower than 1, it means that inequality of RULC allocation is greater than the degree of economic agglomeration; if the value of GQI is 1, it means the economic agglomeration perfectly matches the inequality of RULC allocation. GQIk is the GQI of the kth metropolitan area and can be represented as:
To measure the degree of coordination between economic agglomeration and RULC allocation, the coordination index (CI) is used, and can be represented as:
The smaller the CIk is the greater the coordination of RULC allocation and economic agglomeration. This would reflect RULC allocation being rational and in accordance with the regional economic development situation in the kth metropolitan area.
The above GQIk and CIk is calculated using Excel.
2.2.3. Data Envelopment Analysis Model
To calculate the RULC efficiency, which can be defined as the input-output ratio, the inputs and output must be confirmed. Inputs are the production factors and the output is the economic outcomes. In this study, we assumed that there are L (L = 3) kinds of inputs (capital, labor force, land converted from rural to urban) and M (M = 1) kinds of outputs (economic outcomes) in each metropolitan area. Capital incorporates the funds and assets put into production; labor force is the labor that participates in production; the area of the land converted from rural to urban is the RULC scale, used as an input factor in production; and economic outcomes are the outcomes of production that can be given economic values.
Data envelopment analysis (DEA) allowed us to obtain the value of the input-output ratio [69], i.e., the RULC efficiency. DEA uses linear programming to construct a non-parametric piecewise surface (or frontier) over the data in order to calculate relative efficiencies within a decision making unit [70]. In this study, the decision making units are the metropolitan areas, and we chose an input-orientated constant return to scale model:
where xlk is the lth input of the kth metropolitan area, ymk is the mth input of the kth metropolitan area. The linear programming problem must be solved K times, once for each decision making unit. The value of θk obtained (ranging from 0 to 1) is the efficiency of the kth DMU; λk is the weight coefficient; S−k is the input slack; S+k is the output slack; where EL and EM are L-dimensional and M-dimensional unit vectors, respectively. When the constraint condition “the sum of λk equals 1“ is added to Equation (4), the model changes to a variable returns to scale model:
The software MaxDEA is used for data envelopment analysis and to calculate θk.
The value of θk obtained from the constant return to scale model (Equation (4)) is the comprehensive efficiency (CE) of the kth decision making unit, and the value of θk obtained from the variable returns to scale model (Equation (5)) is the pure technical efficiency (PTE) of the kth decision making unit [71]. CE can be divided into pure technical efficiency and scale efficiency (SE):
Comprehensive efficiency refers to the production efficiency of RULC, and can reflect the condition of the resource allocation, utilization and operations management in the process of social economic production with RULC participating. Pure technical efficiency is the production efficiency of RULC regarding management and technical use; Scale efficiency is the production efficiency of RULC regarding the scale of RULC. To calculate the efficiency of RULC, we used capital, labor force, and RULC scale as the inputs, and economic outcomes as the outputs. When the value of θk obtained is 1, it means optimal efficiency is reached, so all the production factors are allocated (including land altered through RULC) and used rationally so that production reaches Pareto optimality [69]. When the production is at Pareto optimum, there is no need for further improvement.
2.3. Data
To carry out our analyses, we used economic data and land use data, both of which are statistical data. The most recent statistical data available is from 2016. We restricted our analyses to after 1999 as the allocation and use of land converted from rural to urban purposes are managed by national laws and policies which changed significantly in 1999 with the introduction of the amended Land Management Law [72]. The amended Land Management Law emphasizes the protection of cultivated land and the control of the aggregate amount of land available for construction purposes, representing a significant change in how government policies regulated land management use.
As RULC plays a driving role in the process of urban development, especially for secondary and tertiary industries, we use the GDP of secondary and tertiary industries of each city to represent economic outcomes. Capital is represented by the volume of investment in fixed assets in each city. Labor force is represented by the number of employees in secondary and tertiary industries of each city. GDP and fixed-asset investment data are from the China Regional Economic Statistical Yearbook, while the number of employees in secondary and tertiary industries is taken from the China City Statistical Yearbook. To eliminate price as a factor, we use a GDP deflator and fixed-asset investment deflator to amend the value of GDP and fixed-asset investment respectively. This means the values of GDP and fixed-asset investment are calculated at constant prices of 1999.
According to the Land Management Law, land expropriation is the only legal way to change land ownership and convert rural land to urban land in China. Although illegal land conversion does occur, data on its extent are unreliable. We therefore only use data on land expropriation to represent the scale of RULC, i.e., the area of RULC in Equation (1). Equation (4) uses the data released by Chinese government from 1999 to 2016 (China Urban Construction Statistical Yearbook).
3. Results
3.1. Coordination Degree of RULC Allocation and Economic Development
The RULC scale Gini index of the Beijing-Tianjin-Hebei metropolitan area is the highest (0.10 above average), and Mid-Southern Liaoning and Wuhan metropolitan areas are lower in the RULC scale Gini index by only 0.02 compared to Beijing-Tianjin-Hebei, which indicates that there is big difference in the allocation of RULC between their constituent cities (Table 2). With rapid urbanization, Beijing, Tianjin, Shenyang, and Wuhan are continuously expanding, and the area of land converted from rural to urban areas is much larger than in other cities in the metropolitan areas. The RULC scale Gini index of the Shandong Peninsula metropolitan area is the lowest, at 0.45. Every city in the Shandong Peninsula metropolitan area has a similar pattern of development and the demand for land to be converted from rural to urban use is similar.
Table 2.
The coordination of rural to urban land conversion (RULC) and economic development and RULC efficiency of the 17 metropolitan areas in China.
The highest economic Gini indexes were found in three metropolitan areas (Urumqi, Wuhan, and Lanzho-xining), with that for Urumqi beinng 0.31 above average. Economic development is unbalanced within these three metropolitan areas because the level of the core cities is much higher than that of the peripheral cities, while the peripheral cities in each of these metropolitan areas have similar and relatively low economic development levels. In these cases, although core cities play an important role in gathering industry and in economic radiation, if the means of production are gathered too much towards the core cities, the development of peripheral cities can be negatively affected [73]. Conversely, the lowest economic Gini index (0.21 below average) was calculated for the Shandong peninsula, followed by Haerbin-Changchun, the West Side of the Taiwan Straits and Zhongyuan. In these metropolitan areas, the core cities only drive development to a limited extent, so patterns of economic development are almost the same across their constituent cities. In addition, division and cooperation among industries is lacking, so the efficiencies of economic agglomeration are low.
As to the coordination index values distribution (Figure 2), we found that the coordination degree of RULC allocation and economic development of the 17 metropolitan areas is generally high. This is especially the case in Lanzhou-Xining, Wuhan, and Chengyu. Coordination degrees of RULC allocation and economic development of the Haerbin-Changchun, West Side of the Taiwan Straits, Beibu Gulf and Zhongyuan metropolitan areas are at low levels, probably because the quota of RULC is not well allocated and does not match the economic development.
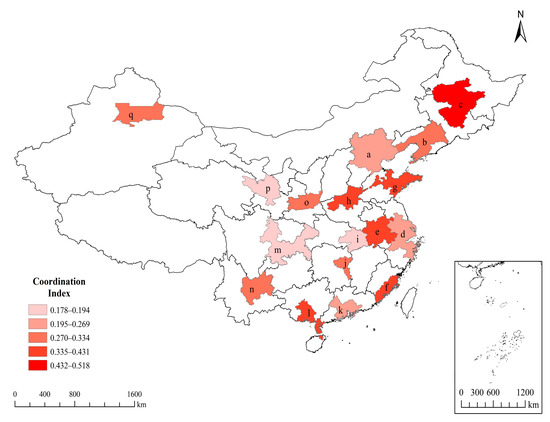
Figure 2.
Coordination index of the 17 metropolitan areas in China.
3.2. Productive Efficiency of RULC
The comprehensive efficiency of RULC of metropolitan areas varies (Table 2), ranging from 0.63 to 1. The Pearl River Delta, the Yangtze River Delta, and the Shandong Peninsula are the three metropolitan areas with the highest efficiency (Figure 3). Three metropolitan areas (Yangtze River Delta, Pearl River Delta, and Urumqi) have a pure technical efficiency of 1. The Yangtze River Delta and Pearl River Delta metropolitan areas developed early and have access to more advanced technology for development, which means they use the means of production, including land, more efficiently than other metropolitan areas. However, the result might not indicate that the Urumqi metropolitan area is also in the process of obtaining more advanced technology. The economic development of the Urumqi metropolitan area mainly relies on energy processing and mineral resource exploitation [66]. Its high pure technical efficiency value probably results from high investment in means of production like energy and mineral resources rather than capital, labor, and land.
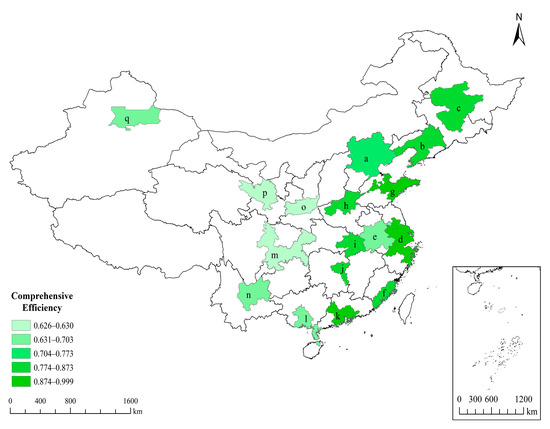
Figure 3.
Comprehensive efficiency of the 17 metropolitan areas in China.
The average scale efficiency of RULC of metropolitan areas in China is higher than comprehensive efficiency and pure technical efficiency, reaching 90% of optimum levels. The utilization degree of inputs is relatively high in metropolitan areas such as the Pearl River Delta, Shandong Peninsula, Yangtze River Delta, and the Mid-southern Liaoning, which are located in coastal or north-eastern China. The key factor which improves the development of these metropolitan areas is the level of current technical innovation. The scale efficiency of metropolitan areas in Western China such as Urumqi, Lanzhou-Xining, Dianzhong, and the Beibu Gulf are below average. By increasing the amount of RULC, the economic outputs of these metropolitan areas could be rapidly improved.
3.3. Temporal and Spatial Differences in the Relationship between RULC and the Economic Development of Metropolitan Areas in China
3.3.1. Temporal Trends in the Relationship between RULC and Economic Development
With China’s macroeconomic situation changing, the corresponding land management policy and metropolitan area development strategy were revised, and the relationship between RULC and economic development changed from 1999 to 2016 (Figure 4). By comparing the values of coordination index and comprehensive efficiency in Figure 4, we found that their changing trends are roughly in the opposite direction. As the coordination index value is inversely correlated with coordination degree, we can say the coordination of RULC allocation and economic growth positively relate to RULC efficiency.
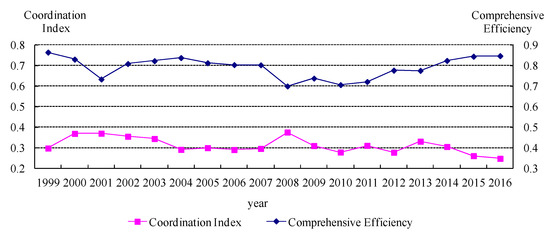
Figure 4.
Average values of the coordination index and comprehensive efficiency of the 17 metropolitan areas in China from 1999 to 2016.
From 1999 to 2002, the coordination index in Figure 4 increased, which means the coordination degree of RULC allocation and economic development dropped; and the comprehensive efficiency of RULC decreased. This suggests that the implementation of the amended Land Management Law inhibited over-conversion of land from rural to urban areas and restricted urban sprawl. In every metropolitan area, the proportion of production input factors had been adjusted so as to reach the optimal proportion which can lead to efficient land use. This may have an influence on coordination degree and RULC efficiency.
Between 2003 and 2007, the coordination index in Figure 4 decreased, and the comprehensive efficiency of RULC stayed at around 81% of optimum efficiency. The economy of metropolitan areas was growing in this period, and exhibited the characteristics of a land-regulated economy as the coordination degree of RULC allocation and economic development increased and the productive efficiency of RULC remained high. To prevent poor quality investment decisions and construction of unrequired developments, local governments closely monitored the approval of land use conversion and prohibited land from being provided to projects that failed to meet the requirements of the state’s industrial policies [74]. Consequently, RULC allocation was lower and more in line with the demand for land from different industries, and the factors of production (including land) worked more effectively.
After 2008, the global financial crisis affected the economy of metropolitan areas in China [75]. The coordination degree of RULC allocation and economic development decreased along with the productive efficiency of RULC. Economic output became “weak” with input levels the same as they had been in the past. To cope with the international financial crisis, from 2009, China’s land policy shifted from “controlling” which was to prevent “overheated” economic growth to “protecting”. Local governments lowered the price of construction land in cities, especially in the center, to attract developers and thereby sustain economic recovery [76]. This stimulated RULC efficiency and the degree to which RULC allocation was coordinated, thereby resulting in increased economic development. In 2011, when the Outline of China’s 12th Five-Year Plan for Economic and Social Development was issued, the government suggested that metropolitan areas are the geographical units that hold the key to economic development in China. In recent years from 2013–2016, a series of central conferences and policies like the State Plan for New-type Urbanization (2014–2020) upgraded the status of metropolitan areas. Metropolitan areas are now regarded as a key urbanization platform. With metropolitan areas at the center of policy, the amount of land converted from rural to urban use increased year on year, the coordination degree of RULC allocation and economic development improved, and the productive efficiency of RULC increased rapidly.
3.3.2. The Relationship between RULC and Economic Development of Metropolitan Areas in Different Development Stages
By calculating the average values of the coordination index and comprehensive efficiency for the type of development stages of the metropolitan areas, results are produced as shown in Figure 5 and Figure 6.
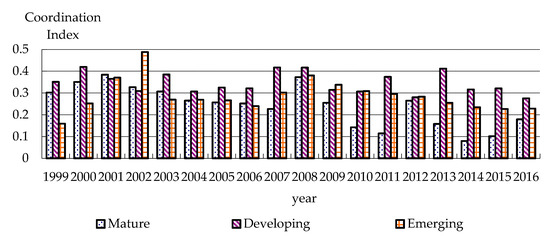
Figure 5.
Coordination index of the metropolitan areas in different development stages.
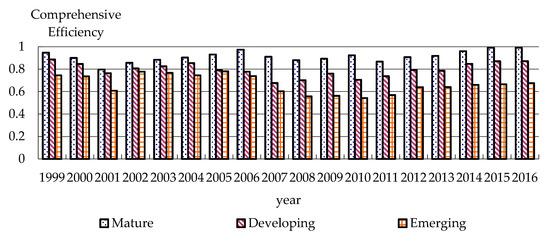
Figure 6.
Comprehensive efficiency of the metropolitan areas in different development stages.
The three mature metropolitan areas are in the east of China. They have formed good urban infrastructure and industrial systems, owing to local and national priority development strategies. From 1999–2004, we see a large difference between RULC associated with the core cities when compared to the peripheral cities in mature metropolitan areas. Resource factors are too strongly concentrated and there is no active exchange of production factors [56]; consequently, RULC allocation does not match industrial development well. After 2007, the coordination degree of RULC allocation and the RULC productive efficiency are both higher in mature metropolitan areas than developing or emerging metropolitan areas (Figure 5 and Figure 6).
The developing metropolitan areas are mostly in the central region of China. The central region is rich in resources, connects the east and west with convenient transportation, and has a strong foundation in industry and agriculture. Covering about 11% of the country’s land, the central region directly support about 27% of the country’s population, and creates about 22% of the country’s GDP [66]. Agricultural populations are currently moving to the cities in the central region at a rapid rate, with cities expanding sharply in developing metropolitan areas, resulting in the conversion of large areas of rural land. In some parts of developing metropolitan areas, local governments compete with each other to apply to the central government to increase their quotas of land that can be converted. This can result in cities expanding with little or no planning or design. The developing metropolitan areas’ coordination indexes from 1999 to 2016 are mostly high compared with those of mature metropolitan areas and emerging metropolitan areas (Figure 5). As the higher the coordination index, the worse the coordination of RULC allocation and economic agglomeration, the degree of RULC allocation is relatively low, and the developing metropolitan areas’ productive efficiency of RULC is increasing slowly (Figure 6). Differential land management policies, and energy-saving and environmental protection technologies are needed urgently, so as to strengthen the rationality of land resource utilization and allocation in developing metropolitan areas [77].
Emerging metropolitan areas are observed in China’s border and western regions. They are generally small in size and lagging behind in development, but play an important role in bridging the economic development gap between the regions [78]. As such, policy support from central government is generally needed to promote development. Dependent on scarce mineral resources, energy and relevant preferential policies, emerging metropolitan areas have seen fast development, rapid urbanization, and continuous productive efficiency improvement of RULC since 2008 (Figure 6).
4. Discussion
Economic agglomeration fosters the coordination of RULC allocation and economic development. Our results indicate that coordination degree of RULC allocation and economic development is relatively high and that RULC allocation coordinates well with economic development in the majority of Chinese metropolitan areas. In China, the pattern of urbanization in the future should still give priority to concentrated development [79], and economic development is likely to be supported by land converted from rural to urban areas for a long period of time.
Economic agglomeration can lead to RULC efficiency. Our results indicate that the average productive efficiency of RULC is generally high in Chinese metropolitan areas, but the average trends mask some substantial regional variations. To improve the efficiency of RULC requires land conversion to be managed in order to promote pure technical efficiency and scale efficiency. The pure technical efficiency of RULC can be raised by encouraging innovation in urban land use, and prioritizing industries that need less land, are energy-efficient and low polluters. The scale efficiency of RULC can be raised by adjusting the amount and structure of the production factors, including land, in the process of social production. Central government can, therefore, promote further efficiency and give consideration to equity by adjusting RULC allocation quotas between different metropolitan areas in different regions. This could be done through a system of financial payments so that the allocation of RULC can better match economic development and promote the productive efficiency of RULC [77]. Local government must strictly control the amount of RULC and attach great importance to achieving the potential of intensive urban land use.
The spatial distribution characteristics of the RULC productive efficiency of metropolitan areas in China are similar to the regional economic structure, except for the Urumqi metropolitan area. The productive efficiency of RULC and the coordination degree of RULC allocation and economic development of the eastern metropolitan areas (which are mostly at a developing or mature stage) are both higher than that of the central and western metropolitan areas (which are mostly at an emerging stage), which is consistent with [56,80]. For the Urumqi metropolitan area, its high RULC productive efficiency probably results from the high investment in means of production like energy and mineral resources, which are not the case for other metropolitan areas we studied. Hence Urumqi metropolitan area is an exception. For eastern metropolitan areas which have an excellent location, government should take precautions against over-conversion of the land from rural to urban use, to ensure food security and preserve the ecological environment. Central and western metropolitan areas, which are developing and emerging rapidly and have huge potential, should explore their own development paths based on their unique locations and resource endowments. Governments can adopt differentiated land management policies to allow RULC to match industrial development more effectively, in order to fully exploit agglomeration and radiation effects.
To help limit losses of natural environments and agricultural land, one challenge for the Chinese government’s policies is the prevention of over-conversion of land in cities [81]. The challenges faced by China and the strengths and shortcomings of the policy regimes in place to govern that expansion could offer examples of both good practices to follow, and bad practices for other areas of the world to avoid. Countries in sub-Saharan Africa and south-east Asia which are expected to become significantly more urbanized by 2050 [7] are where the lessons from China’s experiences in trying to guide city expansion through government control and policy could be most usefully applied.
Our results indicate that to achieve efficient and intensive use of urban land in China, strict government control over the amount of RULC is needed. However, in many other countries the level of control required might prove impossible to exert as either land is not owned by, or city expansion not controlled by, the government. In these cases, RULC depends more on landowner and market behavior than government intervention. Although the efficiencies of RULC are relatively high in the majority of metropolitan areas in China, which illustrates that economic agglomeration can lead to efficient RULC, this assertion and related policy implications would need to be carefully adapted when applied to countries with different land tenure, especially where governments have less influence in controlling RULC. In transitional economies, like in Southeast and Central Asian countries, the central governments could learn from China’s construction quota allocation policy to help them to curb over-conversion of rural land. However, in the market economy, such as in North American and Western European countries, the rural-urban land conversion controls could prioritize efficiency by using market mechanisms.
We reiterate that when measuring the productive efficiency of RULC, the input of land converted from rural to urban areas did not include land converted in illegal ways, while the output did not consider the economic negative external effects brought by RULC. Such effects include ecosystem destruction and environmental pollution. This means inputs may be underestimated and the output may be overestimated, and therefore the efficiency of RULC may be even higher. This limitation highlights important new avenues for further investigation.
5. Conclusions
Cities are important drivers of development and poverty reduction, as they concentrate much of the national economic activity, government, commerce, and transportation, and provide crucial links with rural areas. However, rapid and unplanned urban growth threatens sustainable development when land is not used intensively and too much rural land is converted into urban land. This paper has shown that in a situation where land conversion rates are determined by government and guided by policy, economic agglomeration does lead to efficient rural-urban land conversion. Where countries have yet to undergo the sort of rapid urbanization that China has experienced, efficient RULC can be achieved by: placing strict limits on the amount of land that can be converted; designing differential land management policies according to location and development level; and adjusting RULC allocation between different cities. By doing these things, the potential of intensive urban land use to restructure production factors (including land) through technology innovation can be maximized. Further testing of the wider applicability of our findings is recommended in contexts of less centralized governance.
Author Contributions
K.H. and A.Z. conceived and designed this study; T.Z. analyzed the data; K.H. wrote the paper; A.Z., M.D. and L.C.S. provided advice on the paper structure and presentation; K.H., M.D. and L.C.S. revised the manuscript. All authors have read and agreed to the published version of the manuscript.
Funding
This research was funded by the National Natural Science Foundation of China (Grant No. 71904178, No. 71873053, No. 72004084), the Major Project of National Social Science Foundation of China (Grant No. 18ZDA054), and Fundamental Research Funds for the Central Universities (Grant No. CUGW180808).
Institutional Review Board Statement
Not applicable.
Informed Consent Statement
Not applicable.
Data Availability Statement
The data presented in this study are available on request from the corresponding author.
Conflicts of Interest
The authors declare no conflict of interest.
References
- McGregor, D.; Simon, D.; Thompson, D. The Peri-Urban Interface: Approaches to Sustainable Natural and Human Resource Use; Earthscan: London, UK, 2006. [Google Scholar]
- Phelps, N.A.; Parsons, N.; Ballas, D.; Dowling, A. Planning and Politics at the Margins of Europe’s Capital Cities; Palgrave: Basingstoke, UK, 2006. [Google Scholar]
- Bruegmann, R. Sprawl: A Compact History; University of Chicago Press: Chicago, IL, USA, 2005. [Google Scholar]
- Newman, P.; Thornley, A. Urban Planning in Europe: International Competition, National Systems and Planning Projects; Routledge: London, UK, 1996. [Google Scholar]
- Couch, C.; Karecha, J.; Nuissl, H.; Rink, D. Decline and sprawl: An evolving type of urban development-observed in Liverpool and Leipzig. Eur. Plan. Stud. 2005, 13, 117–136. [Google Scholar] [CrossRef]
- Marcotullio, P.J. Why the Asian Urbanization Experience Should Make Us Think Differently About Planning Approaches in towards Sustainable Cities; Routledge: London, UK, 2017. [Google Scholar]
- United Nations. Available online: https://population.un.org/wpp/ (accessed on 12 January 2021).
- Couch, C.; Leontidou, L.; Petschel-Held, G. Urban. Sprawl in Europe: Landscapes, Land-Use Change & Policy; Blackwell: Oxford, UK, 2007. [Google Scholar]
- Seto, K.C.; Fragkias, M.; Güneralp, B.; Reilly, M.K. A meta-analysis of global urban land expansion. PLoS ONE 2011, 6, e23777. [Google Scholar] [CrossRef] [PubMed]
- Zhang, A.L.; Mao, H. The Conversion of Rural Land into Urban Land: Channels, Patterns and Characteristics. Geogr. Territ. Res. 2000, 16, 17–22. (In Chinese) [Google Scholar]
- Abramson, D.B. The Dialectics of Urban Planning in China. In China’s Emerging cIties: The Making of New Urbanism; Routledge: London, UK, 2008; pp. 66–86. [Google Scholar]
- Güneralp, B.; Perlstein, A.S.; Seto, K.C. Balancing urban growth and ecological conservation: A challenge for planning and governance in China. Ambio 2015, 44, 532–543. [Google Scholar]
- Grimm, N.B.; Faeth, S.H.; Golubiewski, N.E.; Redman, C.L.; Wu, J.; Bai, X.; Briggs, J.M. Global change and the ecology of cities. Science 2008, 319, 756–760. [Google Scholar] [CrossRef]
- Hahs, A.K.; McDonnell, M.J.; McCarthy, M.A.; Vesk, P.A.; Corlett, R.T.; Norton, B.A.; Clemants, S.E.; Duncan, R.P.; Thompson, K.; Schwartz, M.W.; et al. A global synthesis of plant extinction rates in urban areas. Ecol. Lett. 2009, 12, 1165–1173. [Google Scholar] [CrossRef]
- Zhao, X.; Liu, X.P.; Xue, S. Research on Urban Land Saving and Intensive Utilization of Hunan Province under the Background of Two-Oriented Society. Urban. Dev. Stud. 2010, 17, 102–107. (In Chinese) [Google Scholar]
- Lin, B.B.; Fuller, R.A. FORUM: Sharing or sparing? How should we grow the world’s cities? J. Appl. Ecol. 2013, 50, 1161–1168. [Google Scholar] [CrossRef]
- Pauchard, A.; Aguayo, M.; Peña, E.; Urrutia, R. Multiple effects of urbanization on the biodiversity of developing countries: The case of a fast-growing metropolitan area (Concepción, Chile). Biol. Conserv. 2006, 127, 272–281. [Google Scholar] [CrossRef]
- Chauvin, J.P.; Glaeser, E.; Ma, Y.; Tobio, K. What is different about urbanization in rich and poor countries? Cities in Brazil, China, India and the United States. J. Urban. Econ. 2017, 98, 17–49. [Google Scholar] [CrossRef]
- Kenneth Keng, C.W. China’s unbalanced economic growth. J. Contemp. China. 2006, 15, 183–214. [Google Scholar] [CrossRef]
- Gu, C.L. Study on metropolitan: Progress and prospects. Geogr. Res. 2011, 23, 771–784. (In Chinese) [Google Scholar]
- Gu, C.L.; Hu, L.Q.; Ian, G.C. China’s Urbanization in 1949–2015: Processes and Driving Forces. Chin. Geogr. Sci. 2017, 27, 847–859. [Google Scholar] [CrossRef]
- Fang, C.L.; Yao, S.M.; Liu, S.H. 2010 China Metropolitan Development Report; Science Press: Beijing, China, 2010. (In Chinese) [Google Scholar]
- Fulton, W.B.; Pendall, R. Who Sprawls Most? How Growth Patterns Differ. Across the US; Brookings Institution, Center on Urban and Metropolitan Policy: Washington, DC, USA, 2001. [Google Scholar]
- Cutsinger, J.; Galster, G. There is no sprawl syndrome: A new typology of metropolitan land use patterns. Urban. Geogr. 2006, 27, 228–252. [Google Scholar] [CrossRef]
- Aguilera, F.; Valenzuela, L.M.; Botequilha-Leitão, A. Landscape metrics in the analysis of urban land use patterns: A case study in a Spanish metropolitan area. Landsc. Urban. Plan. 2011, 99, 226–238. [Google Scholar] [CrossRef]
- Carruthers, J.I. Growth at the fringe: The influence of political fragmentation in United States metropolitan areas. Pap. Reg. Sci. 2003, 82, 475–499. [Google Scholar] [CrossRef]
- Jantz, C.A.; Goetz, S.J.; Shelley, M.K. Using the SLEUTH urban growth model to simulate the impacts of future policy scenarios on urban land use in the Baltimore-Washington metropolitan area. Environ. Plan. B 2004, 31, 251–272. [Google Scholar] [CrossRef]
- Paül, V.; Tonts, M. Containing urban sprawl: Trends in land use and spatial planning in the metropolitan region of Barcelona. J. Environ. Plan. Manag. 2005, 48, 7–35. [Google Scholar] [CrossRef]
- Wu, Y.; Luo, J.; Zhang, X.; Skitmore, M. Urban growth dilemmas and solutions in China: Looking forward to 2030. Habitat Int. 2016, 56, 42–51. [Google Scholar] [CrossRef]
- Zhang, Z.X.; Wen, Q.K.; Liu, F.; Zhao, X.L.; Liu, B.; Xu, J.Y.; Yi, L.; Hu, S.G.; Wang, X.; Zuo, L.J.; et al. Urban expansionin in China and its effect on cultivated land before and after initiating “Reform and Open Policy”. Sci. China-Earth Sci. 2016, 59, 1930–1945. [Google Scholar] [CrossRef]
- Lu, D.D. The macro strategy of regional development in China. Acta Geogr. Sin. 1987, 42, 97–105. (In Chinese) [Google Scholar]
- The State Council of the People’s Republic of China. Available online: http://www.gov.cn/gongbao/content/2001/content_60854.htm (accessed on 6 February 2021).
- The State Council of the People’s Republic of China. Available online: http://www.gov.cn/zwgk/2009-09/11/content_1415572.htm (accessed on 6 February 2021).
- The State Council of the People’s Republic of China. Available online: http://www.gov.cn/zwgk/2012-08/31/content_2214579.htm (accessed on 6 February 2021).
- Seto, K.C.; Güneralp, B.; Hutyra, L.R. Global forecasts of urban expansion to 2030 and direct impacts on biodiversity and carbon pools. Proc. Natl. Acad. Sci. USA 2012, 109, 16083–16088. [Google Scholar] [CrossRef] [PubMed]
- Huang, K.; Chen, Z.; Zhang, A.L. Rural-to-Urban Land Transfer Efficiency: A Frontier Analysis of Wuhan Metropolitan Area. China Land Sci. 2014, 28, 24–30. (In Chinese) [Google Scholar]
- CCTV. Available online: http://news.cctv.com/china/20071208/100330.shtml (accessed on 6 February 2021).
- Deng, X.; Huang, J.; Rozelle, S.; Uchida, E. Growth, population and industrialization, and urban land expansion of China. J. Urban. Econ. 2008, 63, 96–115. (In Chinese) [Google Scholar] [CrossRef]
- The State Council of the People’s Republic of China. Available online: http://www.gov.cn/zhengce/content/2011-06/08/content_1441.htm (accessed on 6 February 2021).
- The State Council of the People’s Republic of China. Available online: http://www.gov.cn/2011lh/content_1825838.htm (accessed on 6 February 2021).
- People. Available online: http://politics.people.com.cn/n/2014/0317/c1001-24649809.html (accessed on 6 February 2021).
- Duany, A.; Plater-Zyberk, E.; Speck, J. Suburban Nation: The Rise of Sprawl and the Decline of the American Dream; North Point Press: New York, NY, USA, 2000. [Google Scholar]
- Wang, Z.Y.; Fu, L.P.; Chen, W.D. Empirical study on land intensive use of Chinese cities: Based on Yangtze River Delta, Pearl River Delta and Beijing-Tianjin-Hebei metropolitan. Inq. Econ. Issues 2010, 1, 95–99. (In Chinese) [Google Scholar]
- Shi, J.; Huang, Z.J.; He, C.F.; Wang, W.K. A comprehensive measurement of the utility of land use of 16 city-regions in China. Econ. Geogr. 2013, 33, 76–81. (In Chinese) [Google Scholar]
- Bai, Y.; Deng, X.; Jiang, S.; Zhang, Q.; Wang, Z. Exploring the relationship between urbanization and urban eco-efficiency: Evidence from prefecture-level cities in China. J. Clean Prod. 2018, 195, 1487–1496. [Google Scholar] [CrossRef]
- Wang, D.Q. Study on the optimization of industrials land-use structure in the urbanization agglomeration: A logical mechanism framework. Urban. Dev. Stud. 2013, 20, 78–83. (In Chinese) [Google Scholar]
- Tan, M. Uneven growth of urban clusters in megaregions and its policy implications for new urbanization in China. Land Use Policy. 2017, 66, 72–79. [Google Scholar] [CrossRef]
- Zhao, X.; Zhang, M.; Li, Y.; Huang, X.; Wang, B.; Zhang, L. Urban residential land expansion and agglomeration in China: A spatial analysis approach. Environ. Dev. Sustain. 2019, 87, 1–19. [Google Scholar] [CrossRef]
- Lan, F.; Da, H.; Wen, H.; Wang, Y. Spatial Structure Evolution of Urban Agglomerations and Its Driving Factors in Mainland China: From the Monocentric to the Polycentric Dimension. Sustainability 2019, 11, 610. [Google Scholar] [CrossRef]
- Zeng, C.; Zhang, A.; Liu, L.; Liu, Y. Administrative restructuring and land-use intensity—A spatial explicit perspective. Land Use Policy. 2017, 67, 190–199. [Google Scholar] [CrossRef]
- Xie, H.; Chen, Q.; Lu, F.; Wu, Q.; Wang, W. Spatial-temporal disparities, saving potential and influential factors of industrial land use efficiency: A case study in urban agglomeration in the middle reaches of the Yangtze River. Land Use Policy 2018, 75, 518–529. [Google Scholar] [CrossRef]
- Li, G.D.; Li, F. Urban sprawl in China: Differences and socioeconomic drivers. Sci. Total Environ. 2019, 673, 367–377. [Google Scholar] [CrossRef] [PubMed]
- Chen, B.; Wu, C.; Huang, X.; Yang, X. Examining the Relationship between Urban Land Expansion and Economic Linkage Using Coupling Analysis: A Case Study of the Yangtze River Economic Belt, China. Sustainability 2020, 12, 1227. [Google Scholar] [CrossRef]
- Zhong, Y.; Lin, A.; He, L.; Zhou, Z.; Yuan, M. Spatiotemporal Dynamics and Driving Forces of Urban Land-Use Expansion: A Case Study of the Yangtze River Economic Belt, China. Remote Sens. 2020, 12, 287. [Google Scholar] [CrossRef]
- Wu, W.J.; Zhao, S.Q.; Henebry, G.M. Drivers of urban expansion over the past three decades: A comparative study of Beijing, Tianjin, and Shijiazhuang. Environ. Monit. Assess. 2019, 191, 1–15. [Google Scholar] [CrossRef] [PubMed]
- Fang, C.L.; Guan, X.L. Input-output Efficiency of Urban Agglomeration in China: An Application of Data Envelopment Analysis (DEA). Urban. Stud. 2013, 50, 2766–2790. [Google Scholar] [CrossRef]
- Zhang, X.; Zhang, A.L. Evaluating the efficiency of rural-urban land conversion in the urban agglomeration of Wuhan. China Land Sci. 2013, 10, 69–75. (In Chinese) [Google Scholar]
- Huang, K.; Zhang, A.L.; Zhang, X. A study of rural-urban land conversion efficiency of urban agglomerations in China—An empirical analysis based on three-stage DEA model and Tobit model. Econ. Geogr. 2014, 34, 74–80. (In Chinese) [Google Scholar]
- Jin, G.; Deng, X.Z.; Zhao, X.D.; Guo, B.S.; Yang, J. Spatiotemporal patterns in urbanization efficiency within the Yangtze River Economic Belt between 2005 and 2014. J. Geogr. Sci. 2018, 28, 1113–1126. [Google Scholar] [CrossRef]
- Min, J.; Zhang, A.L.; Gao, W. Coupling relationship between RULC and economic development phases in the Jianghan plain. Geogr. Geoinf. Sci. 2007, 23, 64–67. (In Chinese) [Google Scholar]
- Gao, W.; Min, J.; Zhang, A.L. Dynamic Econometric Analysis of the Relationships between RULC and Growth of Urbanization and Economic in Hubei Province. Resour. Sci. 2010, 32, 564–572. (In Chinese) [Google Scholar]
- Yao, S.M.; Chen, Z.G.; Zhu, Y.M. The Metropolitans of China; China Science and Technology University Press: Hefei, China, 2006. (In Chinese) [Google Scholar]
- Ni, P.F. China Urban. Competitiveness Report; Social Sciences Academic Press: Beijing, China, 2010. (In Chinese) [Google Scholar]
- Xiao, J.H. Let Metropolitan Carry Urbanization. China Investig. 2013, 1, 37–39. (In Chinese) [Google Scholar]
- National Bureau of Statistics of China (NBSC). China Statistical Yearbook; China Statistics Press: Beijing, China, 2011.
- Zhang, X.L. 2013 China Regional Economy Development Report: Rise and Coordinated Development of Metropolitans in China; People’s Publishing House: Beijing, China, 2013. (In Chinese) [Google Scholar]
- Dagum, C. A new approach to the decomposition of the Gini income inequality ratio. Empir. Econ. 1997, 22, 515–531. [Google Scholar] [CrossRef]
- Marshall, J.U. City size, economic diversity, and functional type: The Canadian case. Econ. Geogr. 1975, 51, 37–49. [Google Scholar] [CrossRef]
- Charnes, A.; Cooper, W.W.; Rhodes, E. Measuring the efficiency of decision making units. Eur. J. Oper. Res. 1978, 6, 429–444. [Google Scholar] [CrossRef]
- Meeusen, W.; Van, D.B.J. Efficiency Estimation from Cobb-Douglas Production Function with Composed Error. Int. Econ. Rev. 1977, 18, 435–444. [Google Scholar] [CrossRef]
- Fried, H.O.; Lovell, C.A.K.; Schmidt, S.S.; Yaisawarng, S. Accounting for environmental effects and statistical noise in data envelopment analysis. J. Prod. Anal. 2002, 17, 157–174. [Google Scholar] [CrossRef]
- The State Council of the People’s Republic of China. Available online: http://www.gov.cn/zhengce/2020-12/26/content_5574287.htm (accessed on 6 February 2021).
- Rosenthal, S.S.; Strange, W.C. The determinants of agglomeration. J. Urban. Econ. 2001, 50, 191–229. [Google Scholar] [CrossRef]
- Huang, X. The important role of land management in macroeconomic regulation and control. Econ. Res. 2004, 6, 11–14. (In Chinese) [Google Scholar]
- Fidrmuc, J.; Korhonen, I. The impact of the global financial crisis on business cycles in Asian emerging economies. J. Asian Econ. 2010, 21, 293–303. [Google Scholar] [CrossRef]
- Wu, R. The core of land macro-control is “quantity”- situation analysis of land management in macroeconomic regulation and control. China Land 2011, 2, 55–56. (In Chinese) [Google Scholar]
- Long, H. Land use policy in China: Introduction. Land Use Policy 2014, 40, 1–5. [Google Scholar] [CrossRef]
- Wang, X.L. The economic analysis on the path of Chinese urbanization and urban scale. Econ. Res. J. 2010, 10, 20–32. (In Chinese) [Google Scholar]
- Gu, C.L.; Guan, W.H.; Liu, H.L. Chinese urbanization 2050: SD modeling and process simulation. Sci. China-Earth Sci. 2017, 60, 1067–1082. [Google Scholar] [CrossRef]
- Fang, C.L.; Guan, X.L. Comprehensive Measurement and Spatial Distinction of Input-output Efficiency of Metropolitans in China. Acta Geogr. Sin. 2011, 66, 1011–1022. (In Chinese) [Google Scholar]
- Güneralp, B.; Seto, K.C. Futures of global urban expansion: Uncertainties and implications for biodiversity conservation. Environ. Res. Lett. 2013, 8, 014025. [Google Scholar] [CrossRef]


Publisher’s Note: MDPI stays neutral with regard to jurisdictional claims in published maps and institutional affiliations. |
© 2021 by the authors. Licensee MDPI, Basel, Switzerland. This article is an open access article distributed under the terms and conditions of the Creative Commons Attribution (CC BY) license (http://creativecommons.org/licenses/by/4.0/).