
An SEM Approach for the Barrier Analysis in Lean Implementation in Manufacturing Industries

 ,
,  ,
,  and
and 
Abstract
1. Introduction
2. Literature Review
3. Methods
3.1. Specifying the Appropriateness of the Second-Order Construct in PLS-SEM
3.2. Evaluating the PLS-SEM Models
4. Results
4.1. Sample Size
4.2. Assessment of the Measurement Model
4.3. Assessment of the Structural Model
5. Discussion
5.1. Positive Perception of Lean
5.2. Culture and Human Attitudinal Barriers
5.3. Knowledge Barriers
5.4. Resources Barriers
5.5. Proposed Activities to Overcome the Barriers
6. Conclusion and Recommendations
Author Contributions
Funding
Institutional Review Board Statement
Informed Consent Statement
Data Availability Statement
Acknowledgments
Conflicts of Interest
References
- Rymaszewska, A.D. The challenges of lean manufacturing implementation in SMEs. Benchmarking Int. J. 2014, 21, 987–1002. [Google Scholar] [CrossRef]
- Gholami, H.; Jamil, N.; Zakuan, N.; Saman, M.Z.M.; Sharif, S.; Awang, S.R.; Sulaiman, Z. Social Value Stream Mapping (Socio-VSM): Methodology to Societal Sustainability Visualization and Assessment in the Manufacturing System. IEEE Access 2019, 7, 131638–131648. [Google Scholar] [CrossRef]
- Grove, A.L.; Meredith, J.O.; MacIntyre, M.; Angelis, J.; Neailey, K. UK health visiting: Challenges faced during lean implementation. Leadersh. Health Serv. 2010, 23, 204–218. [Google Scholar] [CrossRef]
- Singh, C.; Singh, D.; Khamba, J.S. Analyzing barriers of Green Lean practices in manufacturing industries by DEMATEL approach. J. Manuf. Technol. Manag. 2021, 32, 176–198. [Google Scholar] [CrossRef]
- Abolhassani, A.; Layfield, K.; Gopalakrishnan, B. Lean and US manufacturing industry: Popularity of practices and implementation barriers. Int. J. Product. Perform. Manag. 2016, 65, 875–897. [Google Scholar] [CrossRef]
- Pearce, A.; Pons, D.; Neitzert, T. Implementing lean—Outcomes from SME case studies. Oper. Res. Perspect. 2018, 5, 94–104. [Google Scholar] [CrossRef]
- Sahoo, S.; Yadav, S. Lean implementation in small and medium sized enterprises. Benchmarking Int. J. 2018, 25, 1121–1147. [Google Scholar] [CrossRef]
- Gaikwad, S.K.; Paul, A.; Moktadir, M.A.; Paul, S.K.; Chowdhury, P. Analyzing barriers and strategies for implementing Lean Six Sigma in the context of Indian SMEs. Benchmarking Int. J. Bus. Res. 2020, 27, 2365–2399. [Google Scholar] [CrossRef]
- Jamil, N.; Gholami, H.; Saman, M.Z.M.; Streimikiene, D.; Sharif, S.; Zakwan, N. DMAIC-based approach to sustainable value stream mapping: Towards a sustainable manufacturing system. Econ. Res. Ekon. Istraživanja 2020, 33, 331–360. [Google Scholar] [CrossRef]
- Gholami, H.; Jamil, N.; Mat Saman, M.Z.; Streimikiene, D.; Sharif, S.; Zakuan, N. The application of Green Lean Six Sigma. Bus. Strategy Environ. 2021, 1–19. [Google Scholar] [CrossRef]
- Abu, F.; Gholami, H.; Saman, M.Z.M.; Zakuan, N.; Streimikiene, D. The implementation of lean manufacturing in the furniture industry: A review and analysis on the motives, barriers, challenges, and the applications. J. Clean. Prod. 2019, 234, 660–680. [Google Scholar] [CrossRef]
- D’Amato, D.; Veijonaho, S.; Toppinen, A. Towards Sustainability? Forest-based Circular Bioeconomy Business Models in Finnish SMEs. For. Policy Econ. 2020, 110, 101848. [Google Scholar] [CrossRef]
- Abu, F.; Gholami, H.; Zakuan, N.; Saman, M.Z.M.; Streimikiene, D.; Streimikis, J. The influence of contextual factors on the implementation of lean practices: An analysis of furniture industries. Amfiteatru Econ. 2020, 22, 867–881. [Google Scholar] [CrossRef]
- Panwar, A.; Jain, R.; Rathore, A.P.S. Lean implementation in Indian process industries—Some empirical evidence. J. Manuf. Technol. Manag. 2015, 26, 131–160. [Google Scholar] [CrossRef]
- Kumar, D.S.; Vinodh, S. TISM for analysis of barriers affecting the adoption of lean concepts to electronics component manufacture. Int. J. Lean Six Sigma 2020, 11, 1141–1173. [Google Scholar]
- Gaspar, F.; Leal, F. A methodology for applying the shop floor management method for sustaining lean manufacturing tools and philosophies: A study of an automotive company in Brazil. Int. J. Lean Six Sigma 2020, 11, 1233–1252. [Google Scholar] [CrossRef]
- Thanki, S.J.; Thakkar, J. Status of lean manufacturing practices in Indian industries and government initiatives: A pilot study. J. Manuf. Technol. Manag. 2014, 25, 655–675. [Google Scholar] [CrossRef]
- Bajjou, M.S.; Chafi, A. Lean construction implementation in the Moroccan construction industry: Awareness, benefits and barriers. J. Eng. Design Technol. 2018, 16, 533–556. [Google Scholar]
- Chaple, A.P.; Narkhede, B.E.; Akarte, M.M.; Raut, R. Modeling the lean barriers for successful lean implementation: TISM approach. Int. J. Lean Six Sigma 2018. [Google Scholar] [CrossRef]
- Coetzee, R.; Dyk, L.V.; Merwe, K.R.V.D. Towards addressing respect for people during lean implementation. Int. J. Lean Six Sigma 2018, 27, 79–91. [Google Scholar] [CrossRef]
- Escuder, M.; Tanco, M.; Santoro, A. Major barriers in Lean health care: An exploratory study in Uruguay. Int. J. Lean Six Sigma 2018, 9, 466–481. [Google Scholar] [CrossRef]
- Khaba, S.; Bhar, C. Lean awareness and potential for lean implementation in the Indian coal mining industry: An empirical study. Int. J. Qual. Reliab. Manag. 2018, 35, 1215–1231. [Google Scholar] [CrossRef]
- Ramadas, T.; Satish, K.P. Identification and modeling of process barriers: Implementing lean manufacturing in small-and medium-size enterprises. Int. J. Lean Six Sigma 2018. [Google Scholar] [CrossRef]
- AlManei, M.; Salonitis, K.; Tsinopoulos, C. A conceptual lean implementation framework based on change management theory. Procedia CIRP 2018, 72, 1160–1165. [Google Scholar] [CrossRef]
- Pirraglia, A.; Saloni, D.; van Dyk, H. Status of lean manufacturing implementation on secondary wood industries including residential, cabinet, millwork, and panel markets. BioResources 2009, 4, 1341–1358. [Google Scholar]
- Grushecky, S.T.; Buehlmann, U.; Schuler, A.; Luppold, W.; Cesa, E. Decline in the U.S. furniture industry: A case study of the impacts to the hardwood lumber supply chain. Wood Fiber Sci. 2006, 38, 365–376. [Google Scholar]
- Gagnon, M.A.; Michael, J.H. Employee strategic alignment at a wood manufacturer: An exploratory analysis using lean manufacturing. For. Prod. J. 2003, 53, 24–29. [Google Scholar]
- Gopalakrishnan, B.; Mardikar, Y.; Gupta, D.; Jalali, S.M.; Chaudhari, S. Establishing baseline electrical energy consumption in wood processing sawmills for lean energy initiatives: A model based on energy analysis and diagnostics. Energy Eng. J. Assoc. Energy Eng. 2012, 109, 40–80. [Google Scholar] [CrossRef]
- Reeb, J.E.; Leavengood, S.; Knowles, C. Needs assessment of the Oregon forest products industry. For. Prod. J. 2009, 59, 35–39. [Google Scholar]
- Viana, Á.L.; Lucas Filho, F.C.; de Mello, M.S.V.N.; Santos, R.M.S.; Lacerda, F.A.S.; Lira, H.N.F.; Freitas, C.R.S. Reduction of costs that do not add value through process improvement: Case study in the production of furniture. Espacios 2017, 38, 15. [Google Scholar]
- Sharma, A.; LaPlaca, P. Marketing in the emerging era of build-to-order manufacturing. Ind. Mark. Manag. 2005, 34, 476–486. [Google Scholar] [CrossRef]
- Becker, J.-M.; Klein, K.; Wetzels, M. Hierarchical Latent Variable Models in PLS-SEM: Guidelines for Using Reflective-Formative Type Models. Long Range Plan. 2012, 45, 359–394. [Google Scholar] [CrossRef]
- Samuel, R.; Ramayah, T. Employability, Mobility and Work-Life Balance: How do they relate for MBA holders in Malaysia? Pertanika J. Soc. Sci. Humanit. 2016, 24, 359–374. [Google Scholar]
- Amin, M.; Thurasamy, R.; Aldakhil, A.M.; Kaswuri, A.H.B. The effect of market orientation as a mediating variable in the relationship between entrepreneurial orientation and SMEs performance. Nankai Bus. Rev. Int. 2016, 7, 39–59. [Google Scholar] [CrossRef]
- Jayasingam, S.; Fujiwara, Y.; Thurasamy, R. ‘I am competent so I can be choosy’: Choosiness and its implication on graduate employability. Stud. High. Educ. 2018, 43, 1119–1134. [Google Scholar] [CrossRef]
- Kashif, M.; Zarkada, A.; Ramayah, T. The impact of attitude, subjective norms, and perceived behavioural control on managers’ intentions to behave ethically. Total Qual. Manag. Bus. Excell. 2018, 29, 481–501. [Google Scholar] [CrossRef]
- Ramayah, T.; Yeap, J.A.L.; Ahmad, N.H.; Halim, H.A.; Rahman, S.A. Testing a Confirmatory model of Facebook Usage in SmartPLS using Consistent PLS. Int. J. Bus. Innov. 2017, 3, 1–14. [Google Scholar]
- Xue, Y.; Liang, H.; Wu, L. Punishment, Justice, and Compliance in Mandatory IT Settings. Inf. Syst. Res. 2011, 22, 400–414. [Google Scholar] [CrossRef]
- Tehseen, S.; Sajilan, S.; Gadar, K.; Ramayah, T. Assessing Cultural Orientation as a Reflective-Formative Second Order Construct—A Recent PLS-SEM Approach. Rev. Integr. Bus. Econ. Res. 2017, 6, 38–63. [Google Scholar]
- Tehseen, S.; Qureshi, Z.H.; Ramayah, T. Impact of network competence on firm’s performances among Chinese and Indian entrepreneurs: A multigroup analysis. Int. J. Entrep. 2018, 22, 1–14. [Google Scholar]
- Duarte, P.; Amaro, S. Methods for modellingreflective-formative second order constructs in PLS: An application to online travel shopping. J. Hosp. Tour. Technol. 2018, 9, 295–313. [Google Scholar]
- Rezaei, G.; Gholami, H.; Shaharou, A.B.M.; Zameri Mat Saman, M.; Sadeghi, L.; Zakuan, N. Shared knowledge mediated correlation between cultural excellence and organisational performance. Total Qual. Manag. Bus. Excell. 2017, 28, 427–458. [Google Scholar] [CrossRef]
- Hair, J.F.; Risher, J.J.; Sarstedt, M.; Ringle, C.M. When to use and how to report the results of PLS-SEM. Eur. Bus. Rev. 2019, 31, 2–24. [Google Scholar] [CrossRef]
- Hair, J.F.; Hult, T.; Ringle, C.M.; Sarstedt, M. A Primer on Partial Least Squares Structural Equation Modeling; SAGE Publications, Inc.: Thousand Oaks, CA, USA, 2014. [Google Scholar]
- Gholami, H.; Saman, M.Z.M.; Mardani, A.; Streimikiene, D.; Sharif, S.; Zakuan, N. Proposed analytic framework for student relationship management based on a systematic review of CRM systems literature. Sustainability 2018, 10, 1237. [Google Scholar] [CrossRef]
- Shmueli, G.; Hair, J.F.; Cheah, J.-H.; Ting, H.; Vaithilingam, S.; Ringle, C.M. Predictive model assessment in PLS-SEM: Guidelines for using PLSpredict. Eur. J. Mark. 2019, 53, 2322–2347. [Google Scholar] [CrossRef]
- Rezaei, G.; Gholami, H.; Shaharou, A.B.M.; Saman, M.Z.M.; Zakuan, N.; Najmi, M. Relationship among culture of excellence, organisational performance and knowledge sharing: Proposed conceptual framework. Int. J. Product. Qual. Manag. 2016, 19, 446–465. [Google Scholar] [CrossRef]
- Gholami, H.; Rezaei, G.; Saman, M.Z.M.; Sharif, S.; Zakuan, N. State-of-the-art Green HRM System. J. Clean. Prod. 2016, 124, 142–163. [Google Scholar] [CrossRef]
- Chin, W.W. Bootstrap cross-validation indices for PLS path model assessment. In Handbook of Partial Least Squares; Esposito Vinzi, V., Chin, W., Hensler, J., Wold, H., Eds.; Springer: Berlin/Heidelberg, Germany, 2010; pp. 83–97. [Google Scholar]
- Scholtz, B.; Mahmud, I.; Ramayah, T. Does Usability Matter? An Analysis of the Impact of Usability on Technology Acceptance in ERP Settings. Interdiscip. J. Inf. Knowl. Manag. 2016, 11, 309–330. [Google Scholar] [CrossRef]
- Henseler, J.; Ringle, C.M.; Sarstedt, M. A new criterion for assessing discriminant validity in variance-based structural equation modelling. J. Acad. Mark. Sci. 2015, 43, 115–135. [Google Scholar] [CrossRef]
- Antony, J.; Krishan, N.; Cullen, D.; Kumar, M. Lean Six Sigma for higher education institutions (HEIs): Challenges, barriers, success factors, tools/techniques. Int. J. Product. Perform. Manag. 2012, 61, 940–948. [Google Scholar] [CrossRef]
- Al-Aomar, R.; Hussain, M. An assessment of adopting lean techniques in the construct of hotel supply chain. Tour. Manag. 2018, 69, 553–565. [Google Scholar] [CrossRef]
- Caldera, H.T.S.; Desha, C.; Dawes, L. Evaluating the enablers and barriers for successful implementation of sustainable business practice in ‘lean’ SMEs. J. Clean. Prod. 2019, 218, 575–590. [Google Scholar] [CrossRef]
- Soetara, A.; Machfud, A.M.; Maulana, A. The design on conceptual model for continuation of Lean Manufacturing (LM) implementation in Indonesia wood processing factory using soft system methodology. Int. J. Adv. Sci. Eng. Inf. Technol. 2018, 8, 1302–1306. [Google Scholar] [CrossRef]


| Empirical Study | Description |
|---|---|
| Kumar and Vinodh [15] | Take 24 barriers into consideration including: changing governmental policies, poor selection of change agents and improvement teams, lack of top management commitment understanding and support of the system, lack of team autonomy, lack of flexibility, and versatility and lack of customer focus/involvement. |
| Gaspar and Leal [16] | Outline the difficulties in: completing daily tasks in a standardized way (standard routine), recognizing problems through analyzing key indicators, communicating regularly with their employees, interacting with the support areas and higher hierarchical levels, going to the shop floor to realize the problems, prioritizing the identified problems, examining any taken improvements, and presenting the root cause of problems. |
| Panwar et al. [14] | Investigate nine reasons for not implementing lean: process industries already have continuous; large batch production is necessary for capacity utilization; lack of education and expertise on lean; lack of financial resources; lack of time; cultural barriers (resistance to change); specific characteristics of process industries time, temperature and process dependence; lack of senior management’s interest and support; and lean is complex to implement. |
| Abolhassani et al. [5] | Study on the obstacle and lean strategic practices in implementing lean manufacturing by Pennsylvania and West Virginia manufacturers. Authors view the barriers to lean implementation between lean and non-lean companies. Ten barriers suggested are lack of management commitment, lack of technical knowledge, lack of understanding benefits, lean does not fit the culture, management resistant to change, employee resistant to change, lean is a gimmick, lean is unsustainable, high cost of investment, and previous failures of lean. |
| Thanki and Thakkar [17] | Highlight the initiatives of Indian Government on propagating lean principles and practices in Indian industries. The authors have observed five causes for employees’ reluctant to eliminate the barriers for successful implementation of LM which are existing union work rule, perception of additional workload, oppose to take the initiative and accept the challenges, fear of committing mistakes and losing the job, and lack of monitory reward policy. |
| Bajjou and Chafi [18] | Categorize nine barriers into two classifications: “(1) Organizational barriers—time and commercial pressure, fragmentation and subcontracting, insufficient financial resources and lack of government support. (2) People-related barriers—resistance to change, unskilled human resources, lack of knowledge about lean construction concept, lack of commitment from top management and culture and human attitudinal issues.” |
| Chaple et al. [19] | Analyze lean barriers using total interpretive structural modeling (TISM). Authors divided lean implementation barriers into the main areas: “Knowledge (1. lack of training, 2. insufficient understanding of the potential benefits, 3. lack of implementation know-how, 4. lack of understanding about lean, 5. insufficient supervisory skills to implement lean, 6. insufficient senior management skills to implement lean, 7. insufficient workforce skills to implement lean, 8. lack of methodology, 9. unwillingness to learn and see); Conflicts (1. conflicts with other initiatives, 2. uncertainties in demand, 3. consultants’ apathy, 4. frequent changes in design, 5. lack of cooperation from suppliers, 6. disparate manufacturing environments, 7.“flavor of mouth” view); Resource (1. insufficient investment cost, 2. insufficient internal funding, 3. lack of communication, 4. lack of time, 5. insufficient external funding, 6. lack of labor resources, 7. lack of idea innovation); Management (1. insufficient management time, 2. lack of long-term vision, 3. lack of strategic perspective, 4. lack of contingency, 5. lack of organizational structure, 6. pressure from top management); Technology (1. lack of technological infrastructure, 2. high cost of advanced technology, 3. technological advancements, 4. requirement of alteration in process methodology); Employee (1. employee attitude/resistance to change, 2. human aspects, 3.non-lean behavior, 4. lack of empowerment of employees); Financial situation (1. financial benefits not recognized, 2. no direct financial advantage); Culture (1. cultural issues, 2. social factor); Customer (1. widening customer requirements, 2. pressure from customer, 3. past experience, 4. backsliding/lack of perseverance).” |
| Coetzee et al. [20] | Interpret the true meaning of Respect for People (RFP) according to the creators of the Toyota Way, which captures the principle of the organizational culture of the company. The Toyota Way is depicted as a house with two pillars—“RFP” and “Continuous Improvement”. |
| Escuder et al. [21] | Outline 17 barriers in implementing lean in health care, which are; terminology (B0); lack of resources (B1); leader to guide the process (B2); lack of training (B3); lacking key performance indicators (KPI) (B4), commitment and support from top managers (B5), resistance to change (B6), lack of an improvement culture (B7); the existence of conflicting requirements (B8); the existence of functional silos (B9); hierarchical structure (B10); lack of motivation (B11); poor communication (B12); health-care regulations (B13); union conflicts (B14); lack of time devoted to the improvement program (B15); poor managerial skills (B16). |
| Khaba and Bhar [22] | Investigate the key barriers of lean implementation in the Indian coal mining industry. Furthermore, the authors study the perception of lean barriers among lean implemented mines and non-lean mines. 14 lean barriers identified are backsliding to the old ways of working, cultural difference in the workplace, does not address the need of the mining industry, lack of lean understanding, resistance to change, financial constraint, shortage of lean consultants and trainers, lack of performance management systems, poor planning, lack of technical capabilities of the organization, lack of top management commitment and support, lack of effective training, the lean journey is too long to become profitable, lack of inter-department coordination. |
| Ramadas and Satish [23] | Develop a model using structural equation modeling (SEM) to present key barriers in implementing lean from 128 SMEs companies in India. Three critical factors with 29 significant variables of process barrier factors were identified: High rejection rate is mainly due to 1. lack of awareness about the process/machine; 2. lack of training program.; 3. lack of periodical maintenance; 4. low-quality standard materials from suppliers; 5. bad vendor inspection; 6. wear and tear of machines; 7. communication gap between supervisors and workers; Employee absenteeism is mainly due to 8. harassment by owners, stress or low morale; 9. personal issues such as festivals and being sick; 10. no monitoring of the period of absence; 11. not offering a flexible time for workers; 12. no motivation for workers in the form of better offers; 13. not conducting parties and rewards for perfect attendance for employees; 14. not maintaining a good employee-employer relationship; 15. not conducting health programs in SMEs; 16. serious accidents and illness because of the absence of safety awareness programs; 17. boredom on the job; 18. no incentive for strong attendance; 19. no punishment for low absenteeism; and Frequent breakdown is due to 20. electricity problem; 21. lack of routine maintenance; 22. lack of knowledge or skill of employees; 23. overrunning machines beyond their capability; 24. carelessness in work; 25. not replacing worn damaged parts periodically; 26. ignoring warning signals of machines; 27. no preventive maintenance; 28. untrained personnel to operate equipment; 29. not reading the operator’s manual. |
| AlManei et al. [24] | Propose a lean framework for lean implementation based on drivers and barriers that companies face when they try to implement lean. |
| Sahoo and Yadav [7] | Consider the relationship between lean practices and performance and analyze major challenges/barriers in Indian SMEs. As such, manufacturing companies with up to three years of lean implementation were coded as “lean beginners” group, three to five years firms were coded as “in-transition lean” group, while companies that have adopted lean more than five years were coded as “lean” group. 13 factors that impede lean implementation in the context were accordingly reported, including: “inadequate knowledge and lean expertise, lack of senior management commitment, organizational culture, inability to quantify benefits, backsliding to old ways of working, lack of resources, an attitude of workmen, internal resistance, risk of disruption in operations, lack of budget, lack of clarity across functional groups, poor training, and need of integration with business associates.” |
| Testing | Description | References |
|---|---|---|
| Reflective measurement model | ||
| Convergent validity (CV) | ||
| 1. Reflective indicator loading | Values for loadings are set at > 0.5 | [34,35] |
| 2. Composite Reliability (CR) | Recommended CR values within 0.70–0.90 are satisfactory | [42,43,44] |
| 3. Average Variance Extracted (AVE) | AVE for each construct should be >0.5 | [34,35,36,37,43] |
| Discriminant validity (DV) | ||
| 4. Heterotrait-monotrait ratio of correlations (HTMT) | For conceptually similar constructs: HTMT < 0.90 For conceptually different constructs: HTMT < 0.85 | [43] |
| Formative measurement model | ||
| 5. Variation inflation factor (VIF) | Probable (i.e., critical) collinearity issues when VIF > 5 Possible collinearity issues when VIF > 3–5 Ideally show that VIF < 3 | [43] |
| 6. Statistical significance of weights | p-value < 0.05 or the 95% confidence interval (based on the percentile method or, in case of a skewed bootstrap distribution, the BCa method) does not include zero | [43] |
| Structural model | ||
| 7. Coefficients of determination (R2) | R2 result is equal to 1 for repeated indicator approach | [32] |
| 8. Q2 value | Blindfolding-based cross validated redundancy measure (Q2) Values higher than zero denote meaningful Values larger than 0, 0.25 and 0.50 indicate small, medium and large predictive accuracy of the PLS path model | [33,43] |
| 9. PLS predict | Q2 predict values > 0 indicate that the model outperforms the most naïve benchmark (i.e., the indicator means from the analysis sample) | [43,46] |
| 10. Size and significance of path coefficients | [44,45] | |
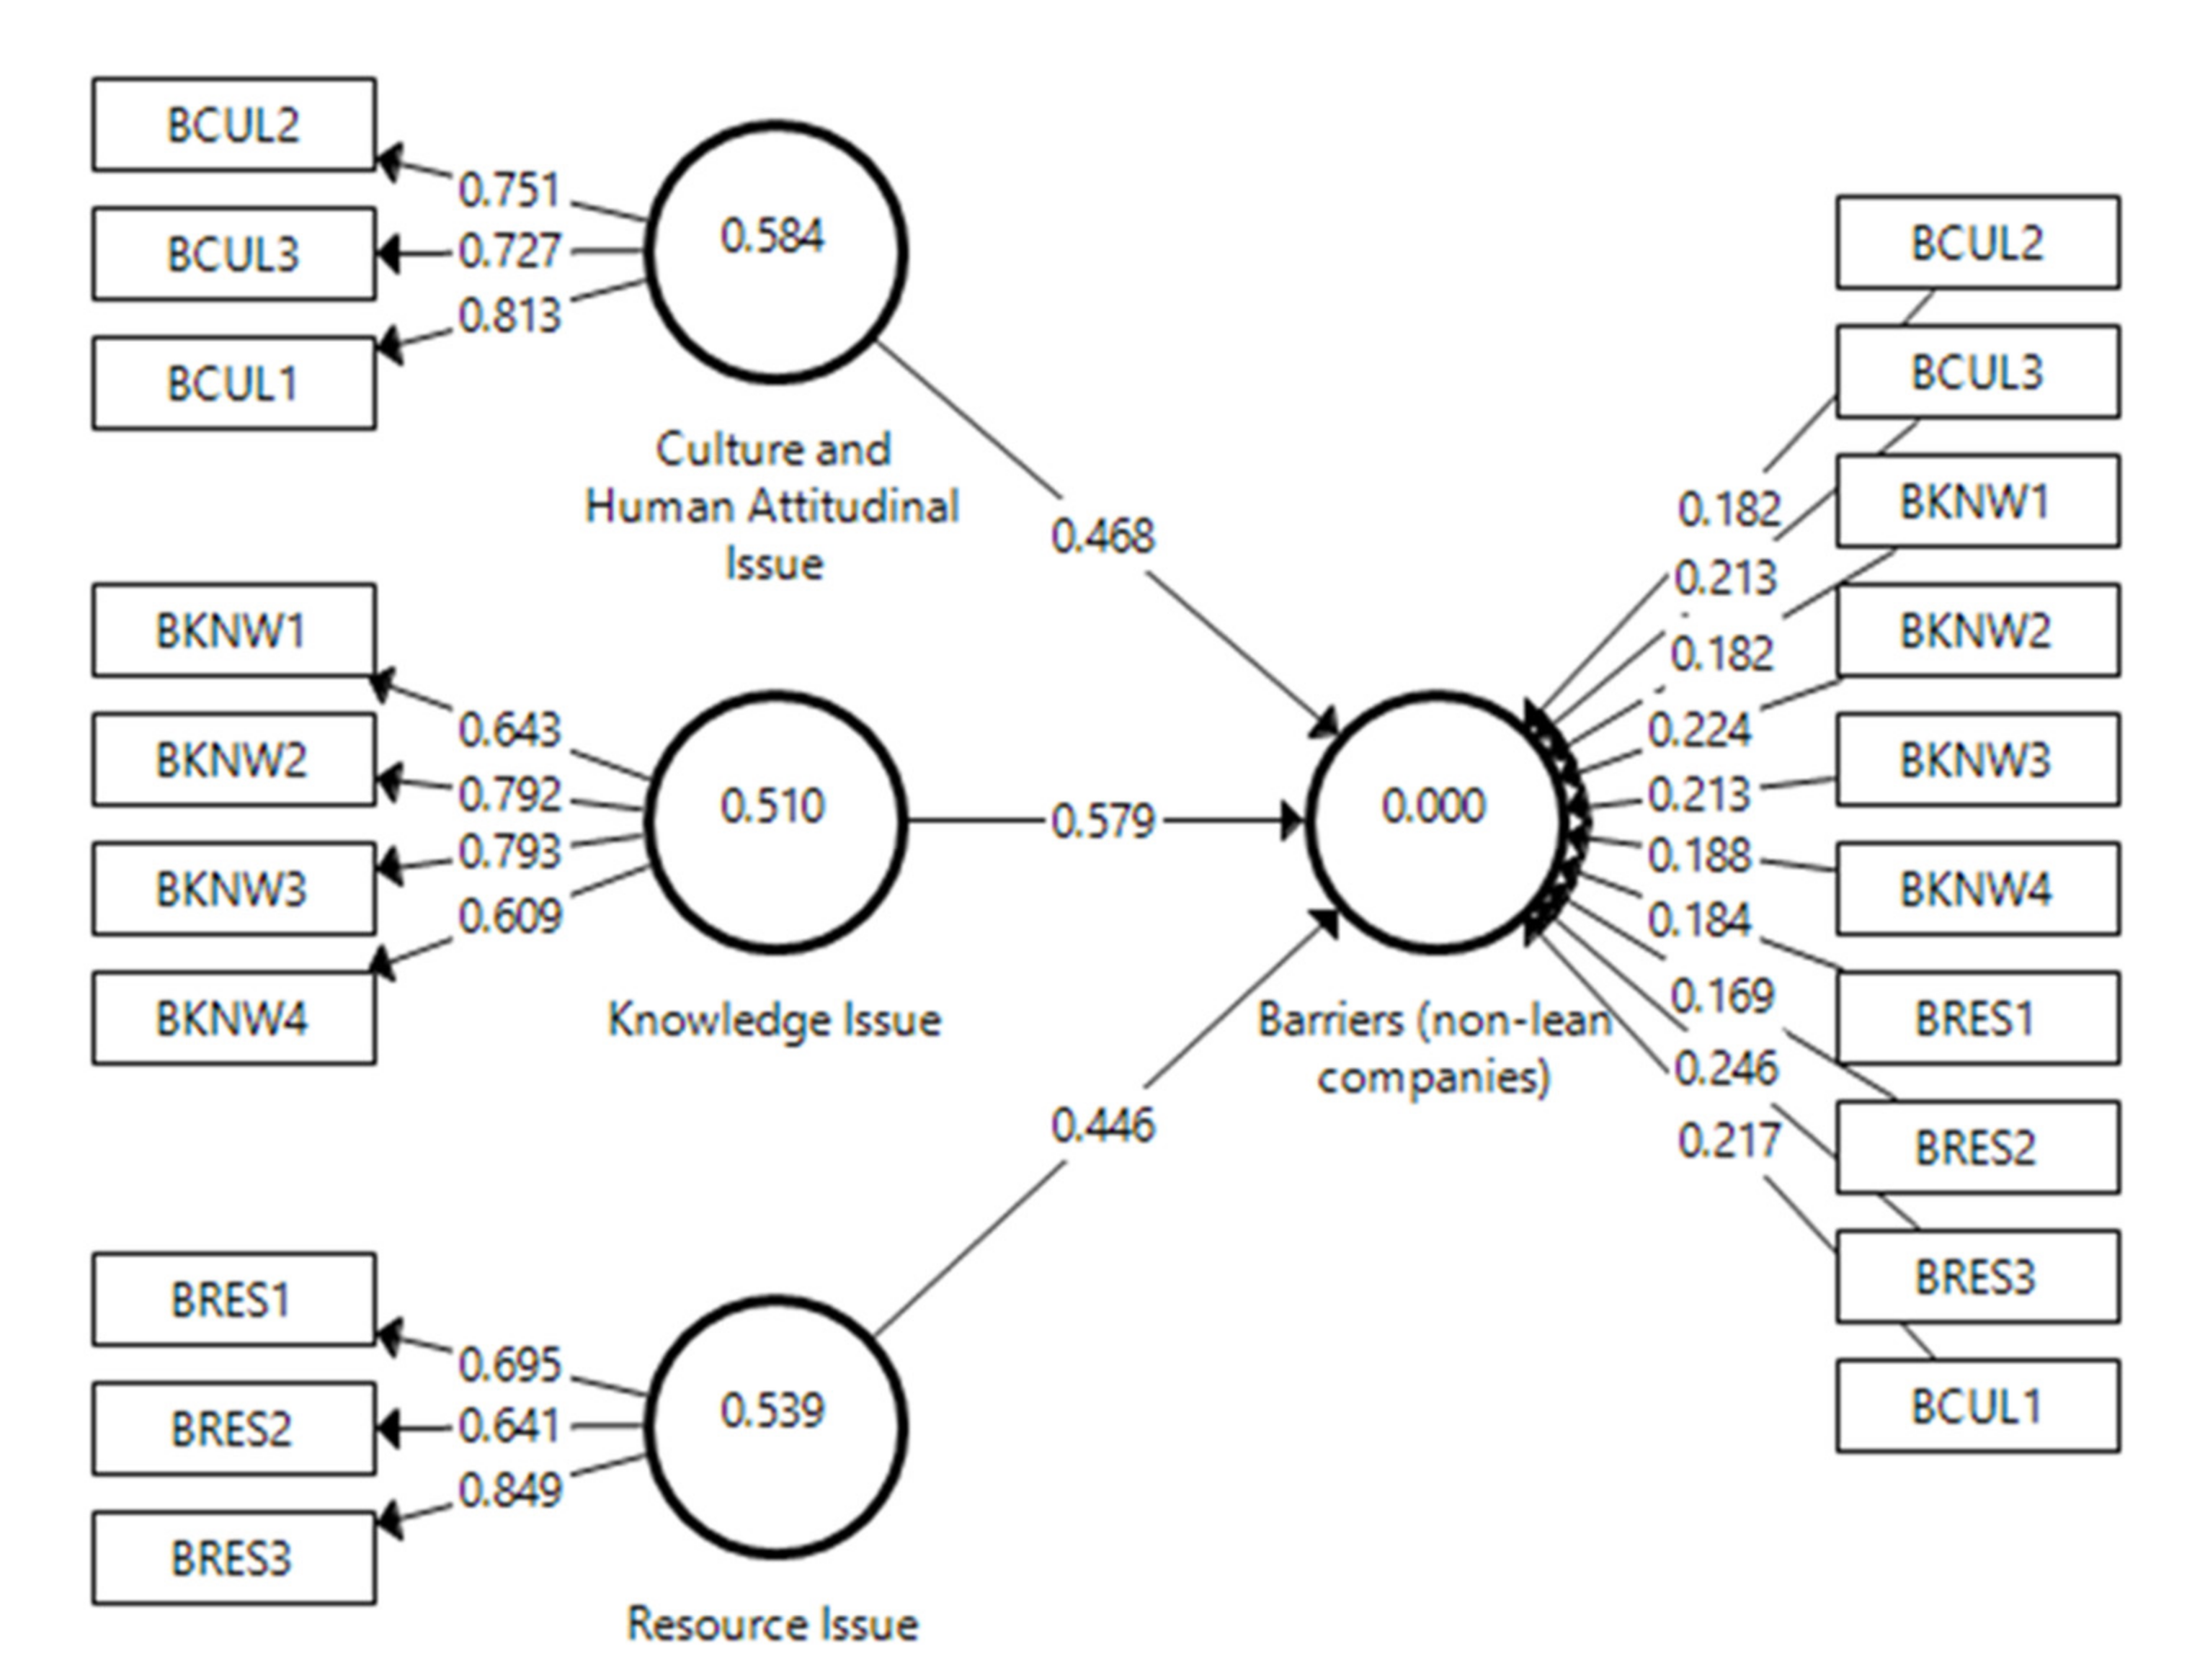
| Construct | Items | Loadings | CR | AVE |
|---|---|---|---|---|
| Culture and Human Attitudinal Issue | BCUL1 | 0.813 | 0.808 | 0.584 |
| BCUL2 | 0.751 | |||
| BCUL3 | 0.727 | |||
| Knowledge Issue | BKNW1 | 0.643 | 0.804 | 0.510 |
| BKNW2 | 0.792 | |||
| BKNW3 | 0.793 | |||
| BKNW4 | 0.609 | |||
| Resource Issue | BRES1 | 0.695 | 0.775 | 0.539 |
| BRES2 | 0.641 | |||
| BRES3 | 0.849 |
| Construct | Relation | HTMT | p-Value |
|---|---|---|---|
| Knowledge→ Culture & Human Attitudinal Issue | BKNW → BCUL | 0.277 | 0.007 |
| Resource → Culture & Human Attitudinal Issue | BRES → BCUL | 0.414 | 0.001 |
| Resource → Knowledge | BRES → BKNW | 0.175 | 0.054 |
| Construct | Collinearity (Inner VIF) | Statistical Sig. of Weights | p-Value | Confidence Intervals | |
|---|---|---|---|---|---|
| 5% | 95% | ||||
| BCUL | 1.106 | 0.468 | 0.001 | 0.415 | 0.525 |
| BKNW | 1.035 | 0.579 | 0.001 | 0.520 | 0.631 |
| BRES | 1.076 | 0.446 | 0.001 | 0.392 | 0.500 |
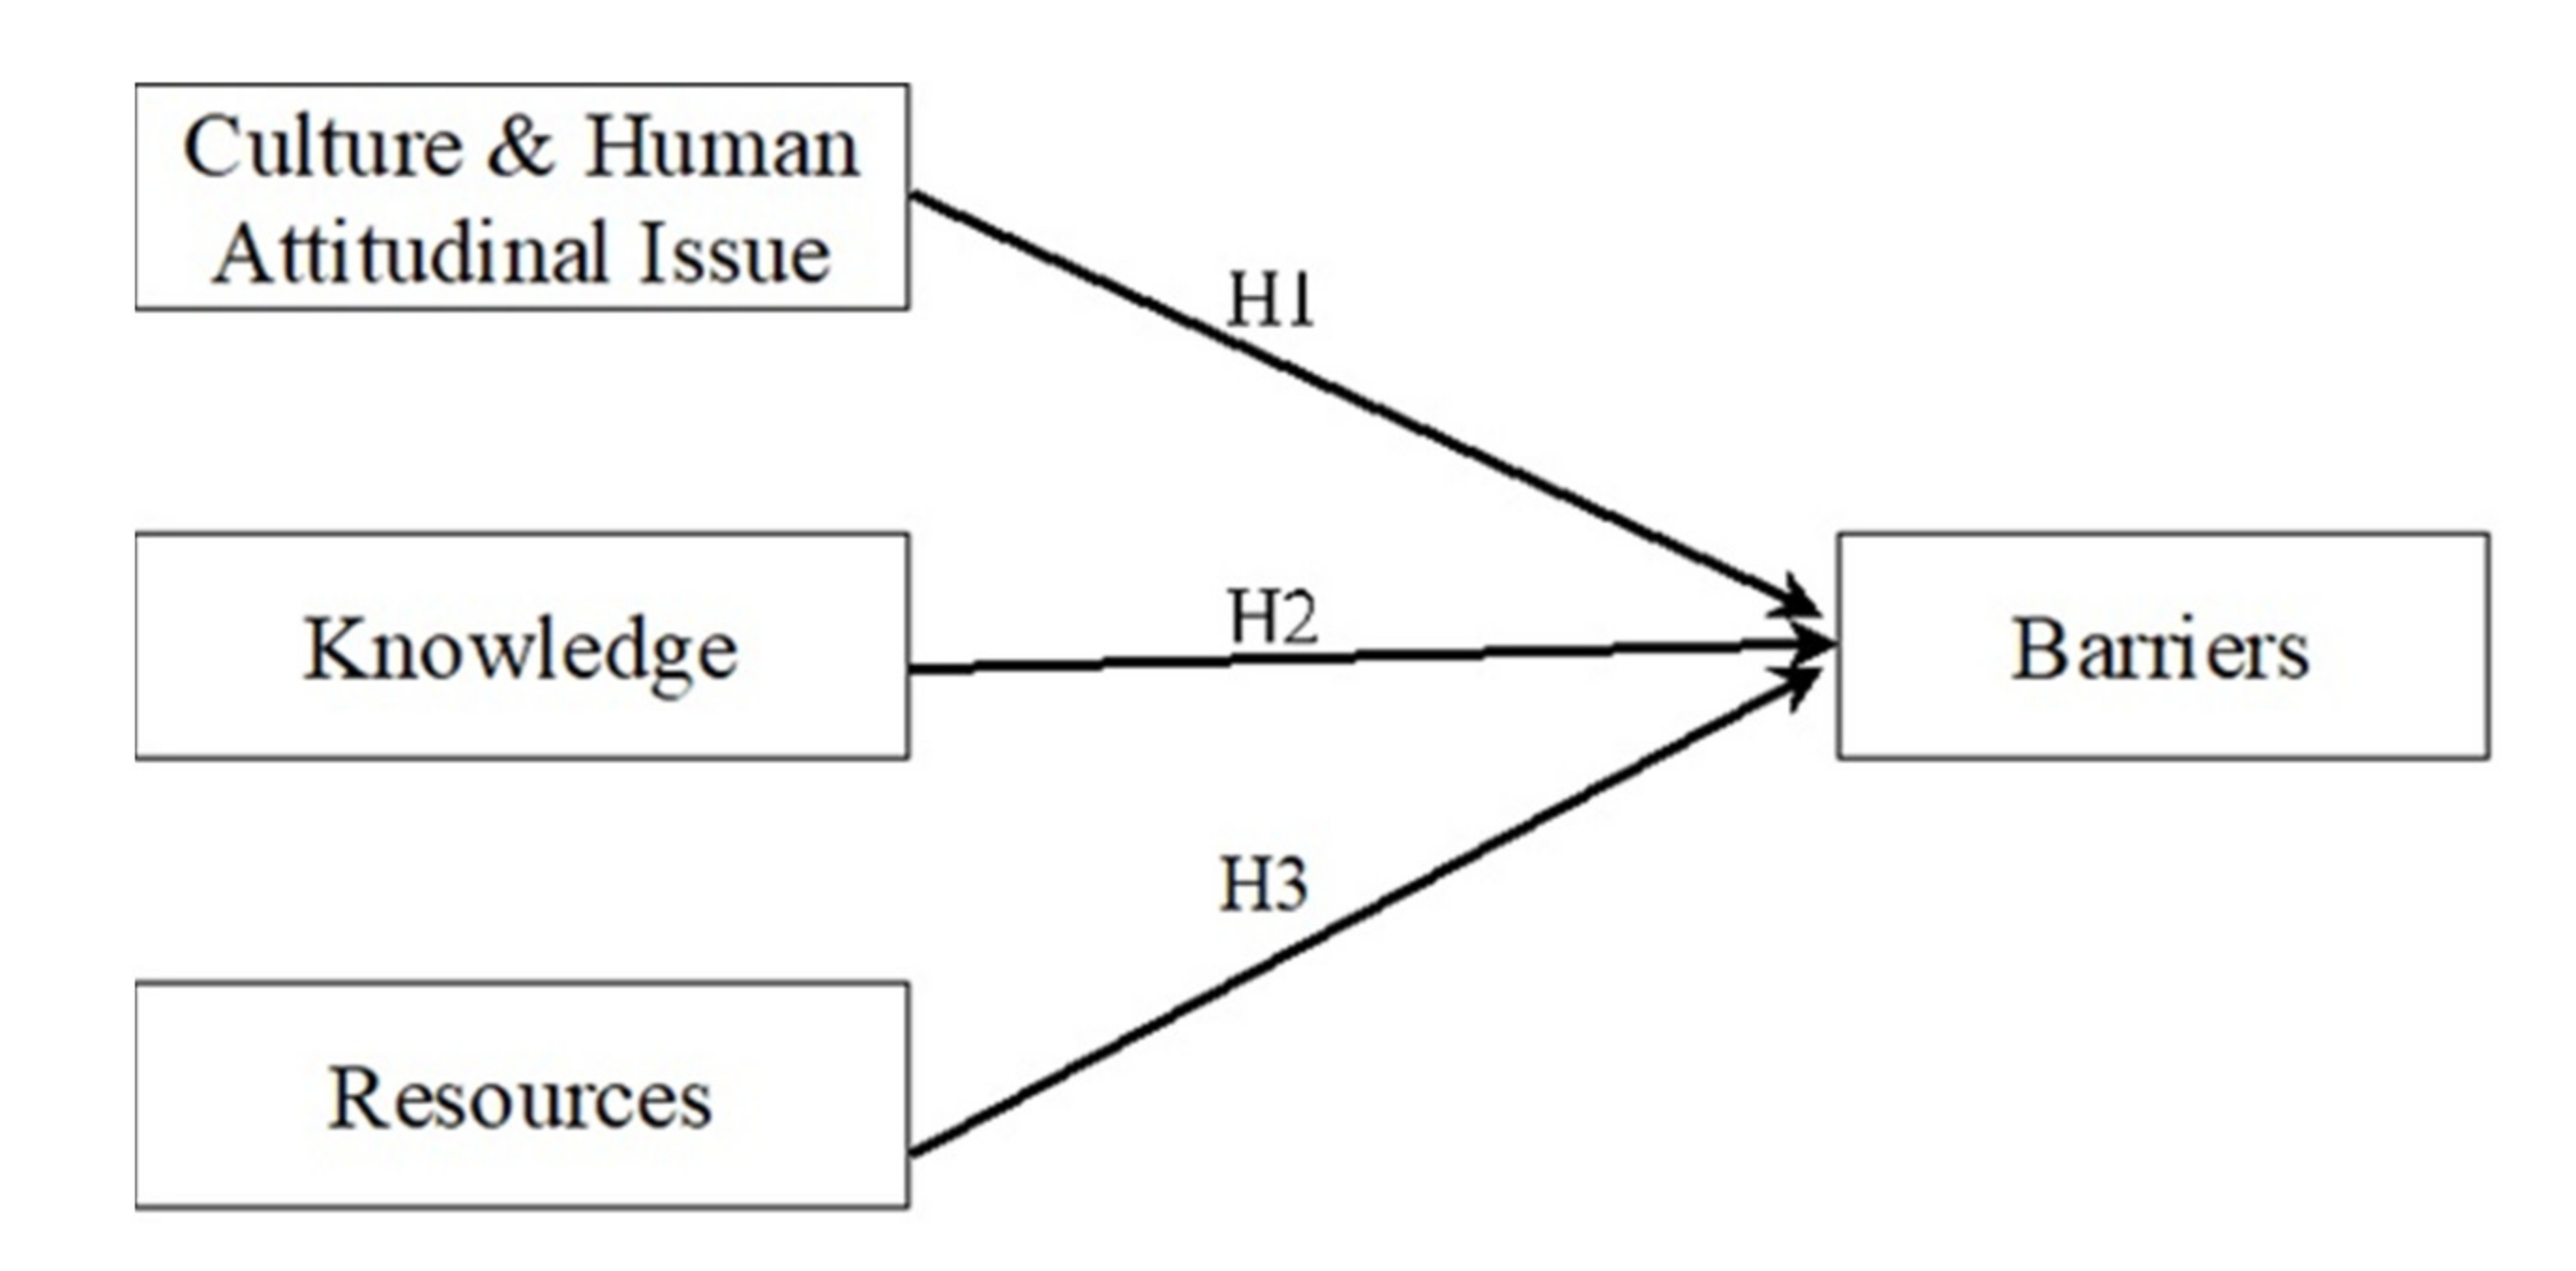
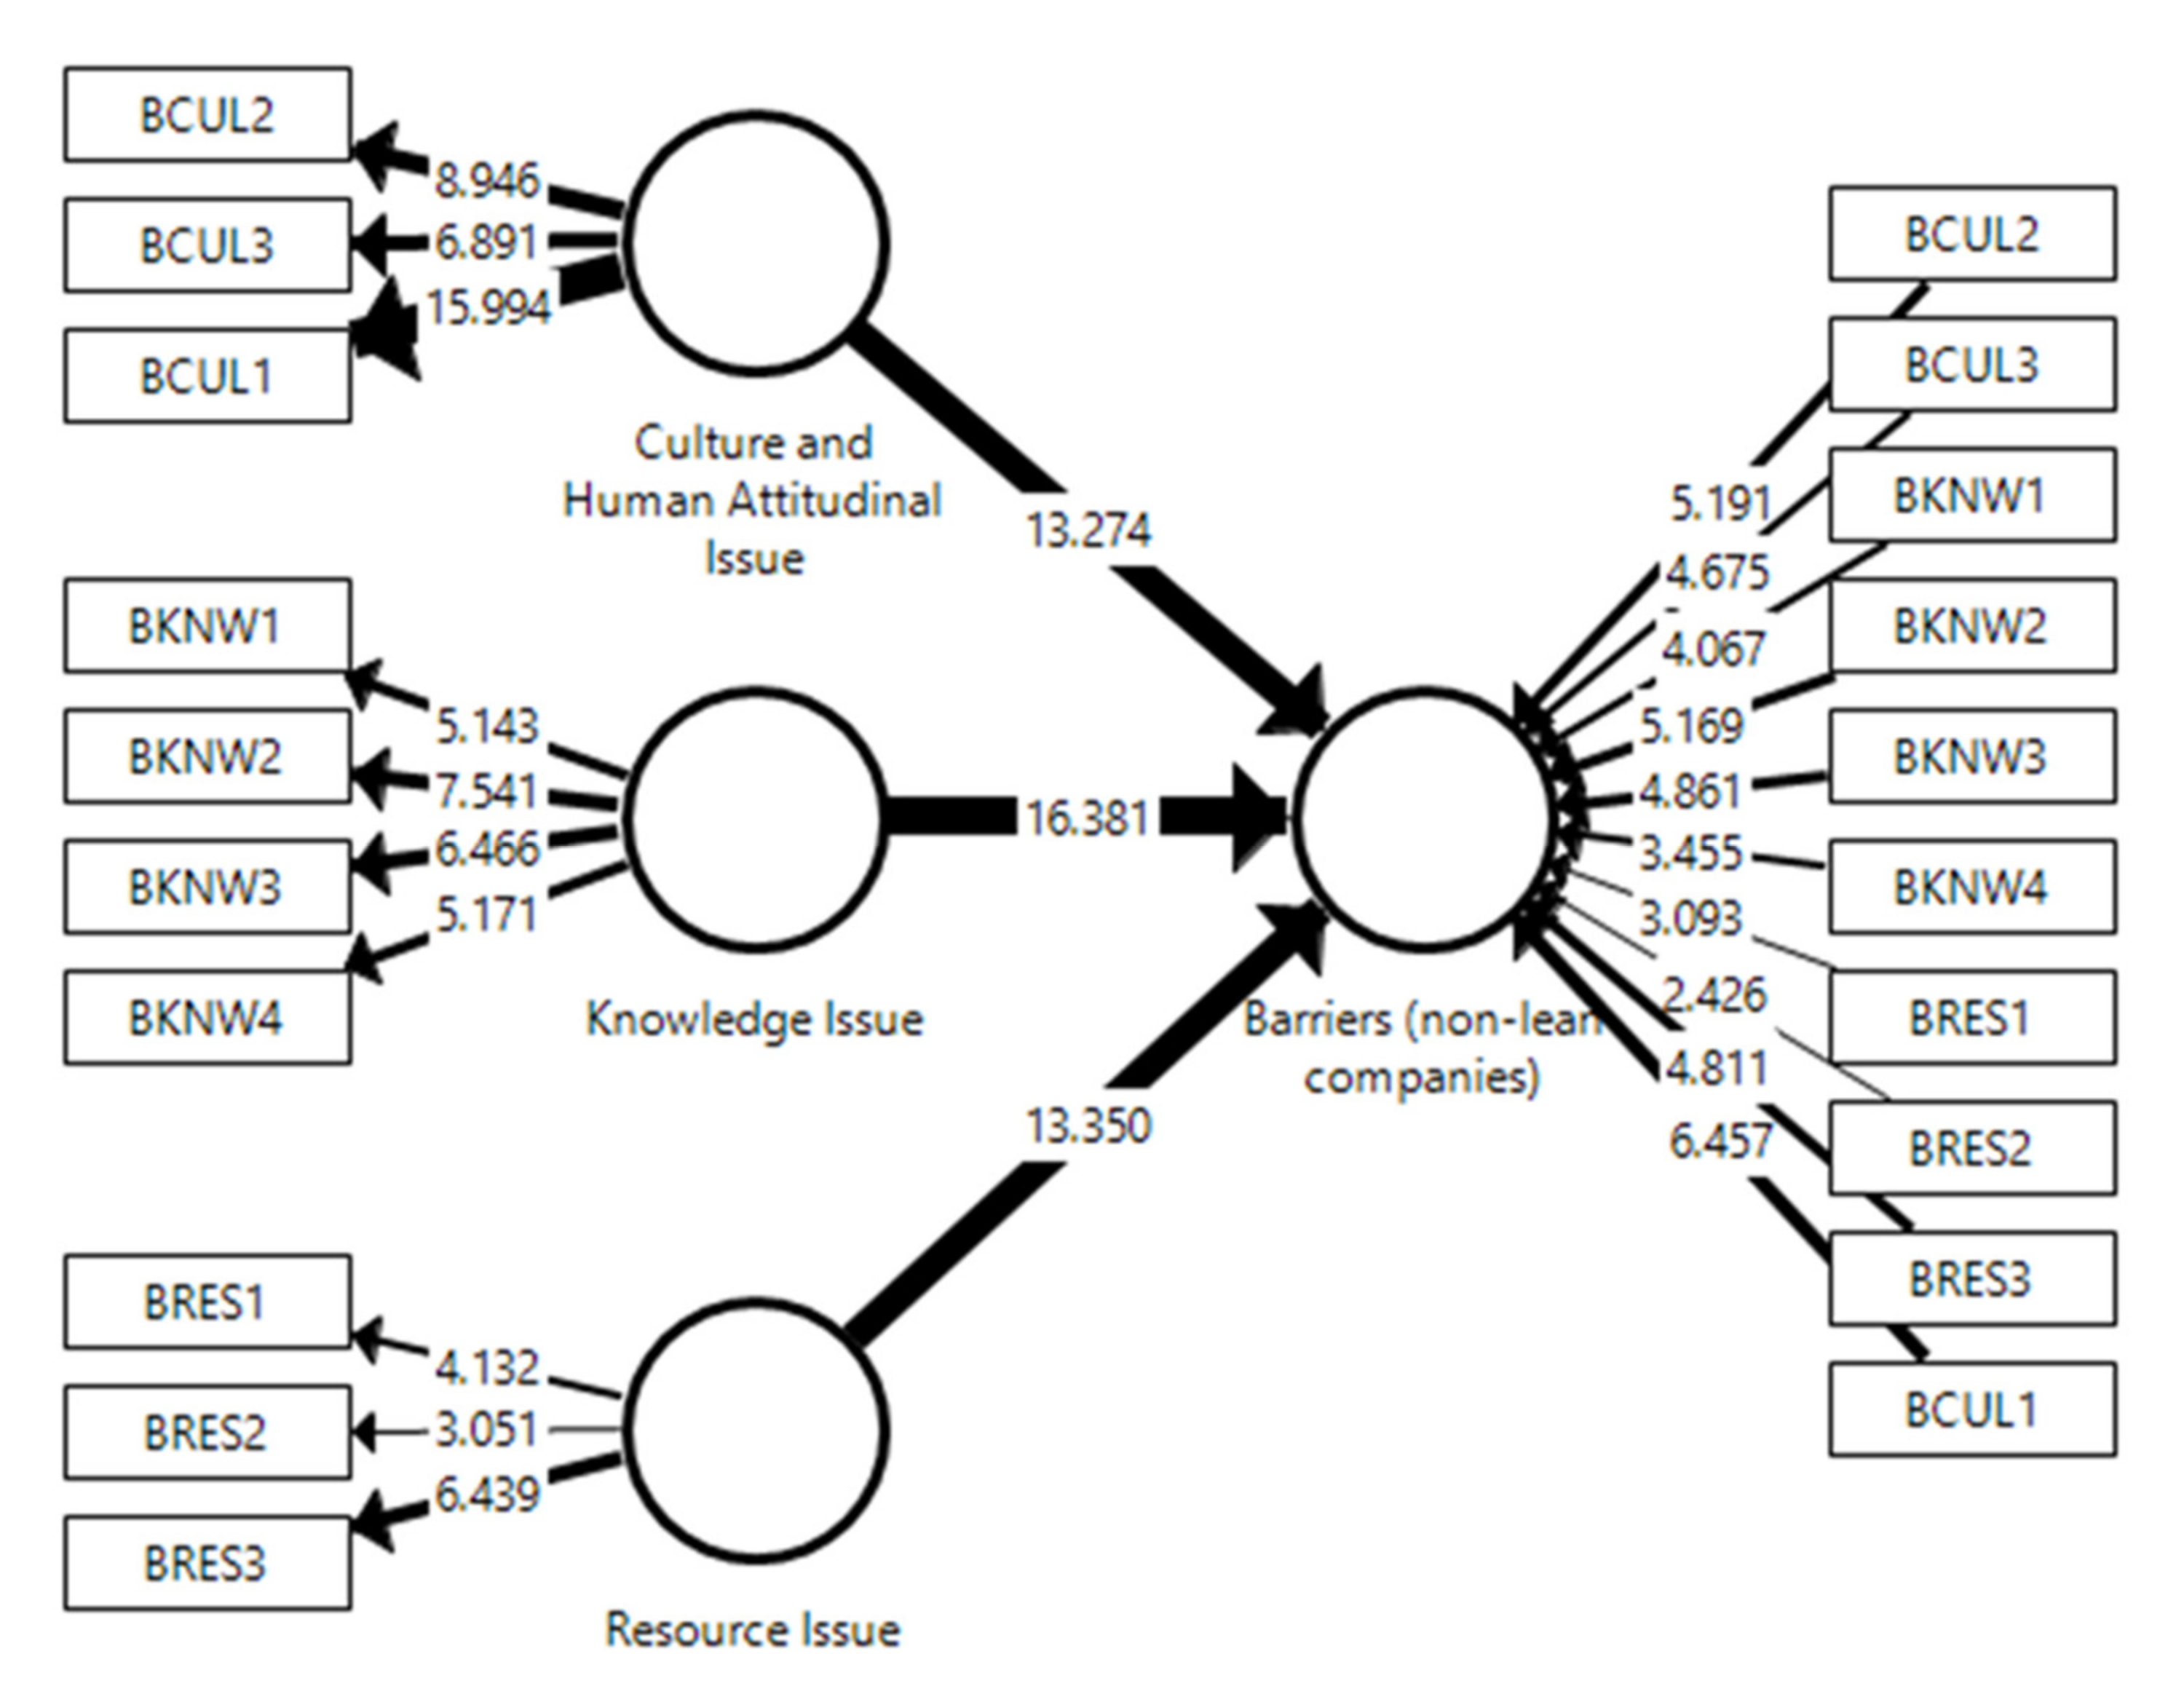
| Hypothesis | Relation | Path Co-Efficient (β) | Standard Deviation | t-Value | p-Value | BCI | Results | |
|---|---|---|---|---|---|---|---|---|
| 5% | 95% | |||||||
| H1: BCUL→ Barriers | 0.468 | 0.035 | 13.274 | 0.001 | 0.423 | 0.542 | Supported | |
| H2: BKNW→ Barriers | 0.579 | 0.035 | 16.381 | 0.001 | 0.533 | 0.650 | Supported | |
| H3: BRES→ Barriers | 0.446 | 0.033 | 13.350 | 0.001 | 0.402 | 0.514 | Supported | |
| Issues | What Activities Must be Done? | How Those Can be Executed? | Why Such Goals Should be Achieved? |
|---|---|---|---|
| Culture and human attitudinal (BCUL) | Aggressive promotion | Lean roadshows and workshops | An initiative to tackle the culture reluctant such as employee (BCUL2) and middle management (BCUL1) resist to change, and negative perception that view lean as a difficult practice to be implemented (BCUL3). |
| Knowledge (BKNW) | Aggressive promotion Basic awareness program | Lean roadshows and workshops Seminar Exhibition | Four obstacles that prohibit wood and furniture companies from implementing lean are unfamiliarity with lean (BKNW1), lack of implementing know-how (BKNW2), lack of expertise on lean (BKNW3), and lack of understanding benefits (BKNW4). To increase the awareness of the lean program. To have sufficient knowledge, a better understanding of what lean manufacturing is, and develop required skills for LM implementation. It is notable that the frequency of LM implementation increase when the company is familiar with LM. Employees will be able to cultivate the required skills to implement lean practice from the basic awareness program. To ensure the company understands the tangible and intangible benefits that they may achieve from LM implementation. |
| Resource (BRES) | Sponsorship and collaboration Aggressive promotion Basic awareness program | Government initiative University collaboration Lean roadshows Workshops Seminar Exhibition | Non-lean companies have resources constraint on time (BRES1), capital fund (BRES2), and labor (BRES3). Lean implementation is still a doubtful endeavor for SMEs due to the vague financial costs involved and the potential benefits that may arise from it [7]. The benefits of lean may take a while to materialize, the investment returns could be difficult to estimate or justify [53]. |
Publisher’s Note: MDPI stays neutral with regard to jurisdictional claims in published maps and institutional affiliations. |
© 2021 by the authors. Licensee MDPI, Basel, Switzerland. This article is an open access article distributed under the terms and conditions of the Creative Commons Attribution (CC BY) license (http://creativecommons.org/licenses/by/4.0/).
Share and Cite
Abu, F.; Gholami, H.; Saman, M.Z.M.; Zakuan, N.; Streimikiene, D.; Kyriakopoulos, G.L. An SEM Approach for the Barrier Analysis in Lean Implementation in Manufacturing Industries. Sustainability 2021, 13, 1978. https://doi.org/10.3390/su13041978
Abu F, Gholami H, Saman MZM, Zakuan N, Streimikiene D, Kyriakopoulos GL. An SEM Approach for the Barrier Analysis in Lean Implementation in Manufacturing Industries. Sustainability. 2021; 13(4):1978. https://doi.org/10.3390/su13041978
Chicago/Turabian StyleAbu, Falah, Hamed Gholami, Muhamad Zameri Mat Saman, Norhayati Zakuan, Dalia Streimikiene, and Grigorios L. Kyriakopoulos. 2021. "An SEM Approach for the Barrier Analysis in Lean Implementation in Manufacturing Industries" Sustainability 13, no. 4: 1978. https://doi.org/10.3390/su13041978
APA StyleAbu, F., Gholami, H., Saman, M. Z. M., Zakuan, N., Streimikiene, D., & Kyriakopoulos, G. L. (2021). An SEM Approach for the Barrier Analysis in Lean Implementation in Manufacturing Industries. Sustainability, 13(4), 1978. https://doi.org/10.3390/su13041978