Abstract
Dwindling water resources have drawn global attention to the reuse of treated wastewater (TWW) for irrigation. However, the impact of continuous TWW applications on soil quality and the proper quantification and monitoring frameworks have not been well-understood. This study aims to provides an insight into the impact of flood irrigation of urban TWW on soil nutritional-chemical attributes and the potential application of multiple soil quality indices for a corn cropping system. To achieve that goal, we pursued the Total Data Set (TDS) and Minimum Data Set (MDS) approaches, as well as the Integrated Quality Index (IQI) and Nemoro Quality Index (NQI) models. A total of 17 soil nutritional-chemical indicators (0–50 cm depths) were determined for the soils irrigated with TWW (five sites) and well water (one site as control) in West Azerbaijan province in northwestern Iran. Results revealed a significant difference in the majority of soil nutritional-chemical attributes, IQI-TDS, NQI-TDS, IQI-MDS, NQI-MDS, and corn yield between the TWW-irrigated and well-irrigated soils. Irrigation with TWW resulted in a significant increase in the amount of organic matter and cation exchange capacity by 9–17% and 17–26%, respectively, macronutrients (N, P, K, Ca, and Mg) by 22–164%, and the majority of trace metals (Fe, Mn, Zn, and Cu) by 17–175%, suggesting an improvement in soil nutrients and an increase in productivity. Comparing to the soil in control sites, the TWW irrigation caused a notable increase in the values of IQI-TDS, NQI-TDS, IQI-MDS, and NQI-MDS models ranging 14.6–29.5%, 19.1–25.5%, 21.7–33.3%, and 18.4–23.7%, respectively. This implies that soil quality was ameliorated to a significant extent with TWW irrigation. These improvements resulted in a remarkable increase in corn yield ranging from 12.5% to 28.1%. The regression equations revealed that up to 78%, 47%, 72%, and 36% of the variance in the IQI-TDS, NQI-TDS, IQI-MDS, and NQI-MDS models, respectively, could be captured by corn yield. The results of the regression and correlation analyses showed that the IQI-MDS model was more accurate than the other models in assessing soil quality and predicting crop yield. These findings may be an effective and practical tool for policy making, implementation, and management of soil irrigated with TWW.
1. Introduction
Historically, limited water resources have presented significant challenges in sustainable food, feed, and fiber production across many arid and semi-arid regions of the world. Over the past few decades, water scarcity has been further exacerbated due to increasing population growth and the need for more agricultural production, climate change, and increased exploitation of groundwater by the agricultural, industrial, and service sectors. The agricultural sector is the largest consumer of fresh water worldwide, accounting for the consumption of more than 70% of the freshwater resources in developed countries and 90% in developing countries [1]. This has made the reuse of unconventional water resources, e.g., salt water, brackish and grayish water, and municipal and industrial wastewater, inevitable for agricultural production. As of 2015, more than 8000 wastewater treatment plans have been registered worldwide, most being in Japan, the United States, Australia, and the European Union, respectively. Not all of the treated wastewater has been used for agriculture [2], according to Saliba et al., [3], more than 90% of wastewater used for cropland irrigation is untreated, especially in developing countries.
Sustainable use of wastewater in the agricultural sector requires proper utilization management and periodic monitoring of wastewater-irrigated soils to accurately address the trade-offs involved in wastewater irrigation [4,5]. Varying with the source of reuse water, benefits of can include increased soil macronutrients (N, P, and K) and micronutrients (Fe, Mn, Zn, and Cu) that can enhance soil fertility and crop productivity [6]. Previous studies [7] have shown that wastewater irrigation may supply 50–100% of the fertilizer requirements of certain crops (e.g., maize and wheat), which has profound implications for production economy. Nonetheless, the accumulation of heavy metals and organic pollutants have been documented as the most critical consequences of untreated wastewater irrigation, which may pose a threat to the health of the soil-water-plant system [6,8].
Soil quality is defined as the soil’s readiness to support crop growth without soil degradation or environmental damage [9,10]. A quality soil is expected to function to sustain productivity, support human and animal health, and habitation (USDA, NRCS). Unsupervised use of wastewater can increase microbes, pathogens, and hazardous chemicals beyond the tolerable limits of agroecosystems, thereby reducing soil, water, and environmental quality [11,12,13]. Likewise, high concentrations of wastewater-generated salts may deplete soil organic matter and lead soil system toward an irreversible state of degradation. The pollutants may accumulate in soil or discharge into water bodies and threaten the food and environmental safety [14,15]. A well-known example is the Mezquital Valley in Mexico, where the application of untreated wastewater along with the lack of regular monitoring has turned the opportunity of an alternative water resource into a progressing challenge of soil and groundwater pollution [16]. With imminent future need for reusable water resources, practical soil quality surveillances and monitoring techniques should be identified and implemented to diminish the risk of soil, water, and environmental deterioration [17,18,19,20]. Advancement of soil quality assessment frameworks offer a potential for a practical monitoring of the status of soils exposed to wastewater irrigation. A wide range of soil quality assessment systems are available, among which the Soil Quality Index (SQI) has received considerable attention due to its simplicity, versatility, and quantitative flexibility [10]. Mostly input-oriented soil properties and functions in SQI are easily measurable, sensitive to environmental and managerial changes, and quantifiable. The SQI assessment has been wildly adopted around the world as a result of increasing importance of sustainable natural and agricultural ecosystems and food security [21].
Several studies around the world have examined the influence of wastewater irrigation on soil chemical quality using a single soil indicator or a suite of limited soil quality indicators (e.g., pH, soil electrical conductivity, organic matter, cation exchange capacity) [5,22,23]. Although each soil quality metric represents a static state of a certain soil property at a given time, integrating multiple metrics into a comprehensive and individual index and applying repeatedly over a time period will provide better insight into the overall state of soil agronomic processes and environmental sustainability. Moreover, comprehensive indices offer an opportunity to observe the interactions among multiple soil attributes [24]. However, there is a lack of information about the potential use of soil quality indices as an inspection tool for wastewater-irrigated soil quality and environmental health monitoring. Improved understanding of the chemical dynamics of TWW-treated soils and proper surveillance methodologies will aid producers and policy makers in efficient wastewater management for greater productivity while maintaining environmental health.
The objectives of this study were to: (1) investigate the effects of long-term TWW irrigation on soil chemical and nutrient dynamics, (2) assess the effectiveness of soil fertility quality indices, including integrated quality index (IQI) and Nemoro quality index (NQI) for monitoring the fertility and pollution of TWW-treated soils, (3) establish a minimum soil quality assessment data set based on the soil fertility indicators, and (4) clarify the relationship between scoring values of SQI and corn yield productivity.
2. Materials and Methods
2.1. Site Description and Field Work
The study was conducted in the Urmia plain (45°15′–45°00′ E, 37°45′–37°30′ N) located in West Azerbaijan province in northwestern Iran (Figure 1). The site has a semi-arid Mediterranean climate with cold winters and hot summers. The average annual precipitation and temperature of the region are 330 mm and 13 °C, respectively, resulting in a Xeric soil moisture regime and a Mesic temperature regime. The soil of the study region has been developed on young alluvium deposits and is classified as Inceptions. The experimental cropping system at all sites consisted of continuously grown corn (Zea mays L., cultivar single-cross 704), growing from June to September (a period of about 120 days). Irrigation water was supplied from the outflow channel of the Urmia wastewater treatment plant. The wastewater at this treatment plant is generated from municipal, household, and local industrial units, refined through oxidation pools to deposit the suspended solid particles before using for irrigation as TWW. Conventional tillage and fertilization practices were standardized over TWW-irrigated and the control fields. During the course of the experiment (about 15 years) 100–150 kg ha−1 year−1 of urea fertilizer (CH4N2O) and 50–100 kg ha−1 year−1 of superphosphate fertilizer (Ca(H2PO4)2·H2O) were applied homogenously on both treatments. The entire amount of superphosphate fertilizer was preplant applied and soil incorporated before sowing seeds. The urea fertilizer was split applied, with the first application consisting of two-thirds of the total rate preplant soil incorporated, and the remainder top dressed at the tillering and stem elongation stage. During the five stages of corn irrigation, including germination, tillering and stem elongation, heading, flowering, and seed filling, a total of 5000 to 6000 m3 ha−1 year−1. TWW was applied through flood irrigation techniques following conventional irrigation practices. Corn and irrigation management dates were acquired from producers and the Department of Agricultural Services in the study region.
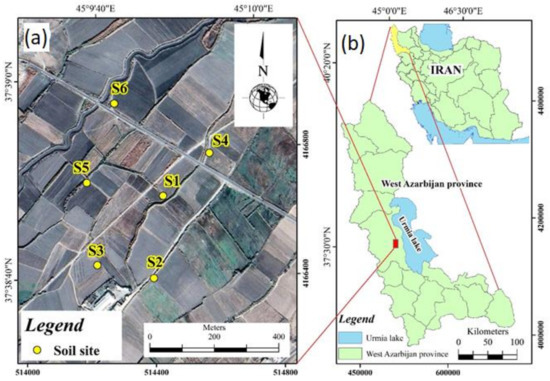
Figure 1.
The close up of individual study sites (a) and location of the study region (b).
Within a total of 12 ha farm area, TWW and WW treatments were applied on identical land surface areas by farmers. The WW-irrigation was applied on a single 2 ha farm as control, while the TWW-irrigated area comprised five approximately 2-ha field sites located around the larger WW-irrigated area. The experiment area had similar land use, slope aspect and parent material so that the results could be compared. Accordingly, differences in soil quality indicators between the TWW-irrigated and control sites were assumed to be attributed to the irrigation treatment effects. After dividing the TWW and WW farm area to six 2-ha units (five units under TWW irrigation and one unit under WW irrigation), soil samples were collected in 2018–2019 growing seasons. The geographic center of each unit was the first soil sampling point, with subsequent composite samples collected on diagonal transects at 10–15 m intervals. The composite soil samples (a total of 30 samples) were mixtures of five sub-samples collected (depth of 0–50 cm) and each composite soil sample was analyzed in triplicate as described below (Section 2.2).
2.2. Laboratory Analysis
Soil samples were air-dried in the ambient laboratory conditions. Roots, stones, and other debris were removed from the soil, then passed through 2 mm sieves and stored until soil fertility indicators were determined. All soil samples were analyzed to determine soil fertility indicators using standard procedures (Table 1).

Table 1.
Analytical laboratory methods used to identify soil variables.
The chemical parameters of both treated wastewater and freshwater samples were measured by the methods described by Eaton et al. [32]. The concentration of metal was determined using a flame atomic absorption spectrophotometry (Shimadzu AA-6300) method.
2.3. Soil Quality Index (SQI)
To quantify the impact of TWW irrigation on soil quality, SQI was calculated using the Total Data Set (TDS) and Minimum Data Set (MDS) approaches. In the TDS approach, a total of 17 soil quality indicators including pH, organic matter (OM), CEC, total nitrogen (TN), C/N ratio, available P, exchangeable cations (Ca, Mg, and K), and total and bioavailable fraction of Fe, Mn, Zn, and Cu were measured. Principal component (PC) analysis was applied on TDS dataset to reduce multicollinearity among variables and to form the MDS dataset [33]. The PCs with eigenvalue ≥ 1 that explained at least 5% of the variance in the data were included [34,35,36]. For each PC, the indicators received the factor loading value within 10% of the highest weighing factor were retained for the MDS [9].
Within each PC, variables with greater coefficient values were selected and involved in MDS dataset [34]. When multiple indicators were found in a PC, Pearson’s correlation analysis was used to determine redundant indicators [9]. The selected MDS indicators were transformed into dimensionless scores ranging between 0 and 1 using a scoring function method. Three types of standard scoring functions (SSF) were defined as: “more is better”, “less is better”, and “optimum is the best” based on the overall contribution of each variable to soil scoring functions:
The SSF equations are calculated by Equation (1) (more is better) and Equation (2) (less is better) [37].
where SLm is a “more is better” function, SLl is a “less is better” function, Xi is the indicator value, Mi is the minimum value of the soil indicator, and Ma is the maximum value of the soil indicator.
After calculating scores, Integrated Quality Index (IQI) [38] and Nemoro Quality Index (NQI) [39,40] were calculated for both TDS and MDS datasets using Equations (3) and (5), respectively:
in which Si is the attribute score (linear or nonlinear), n is the number of soil attributes in the TDS and MDS approaches, and Wi is the weighting value of soil attribute. For both TDS and MDS dataset, the weight of the indicators was estimated by their communality via a PCA method [9,39]. The equation used to estimate the weight is shown in Equation (4):
where Wi is the weighting of soil variable, Ci is the communality value of soil variable ranged from 0 to 1, and n is the number of variables.
in which P2ave and P2min are the average and minimum scores of the selected attributes in each sample site, respectively.
2.4. Data Analysis
Statistical analyses were performed in SPSS 19 software package (SPSS INC., Chicago, IL, USA). Using an independent t-test, the means of different soil variables and different SQI scenarios were separated and compared pairwise between the TWW-treated soil and the control soil at 95% confidence interval. To select the most appropriate soil indicators for evaluating SQI, the principal component analysis (PCA) method was used. The PCA is the most common the multivariate technique which simplifies the data, eliminates multi-collinearity, and ranks the variables in decreasing order of importance [40,41]. Multiple regression models were employed to establish the relationship between different SQI models and corn yield using MS Excel software packages.
3. Results
3.1. Wastewater Characteristics
The results of the chemical analysis for TWW and well water (WW)are reported in Table 2. Overall, the concentration of chemicals was significantly (p < 0.05) higher for TWW than those of the WW control treatment. The mean value of EC was 1.9 to 2.3 times higher than its maximum allowable range for the TWW [42], indicating the increased salt concentration and possible increase of osmotic pressure which may hinder the proper water utilization by plants. Likewise, N, P, and Ca concentrations were above their maximum tolerable limits [42,43]. The trace metals concentration of TWW, except for Zn, were similarly above their maximum admissible range [42,43] for the irrigation practices. This may be associated with the discharge of trace metals from industrial units in nearby urban and suburban areas (e.g., batteries, painting centers, metal plating, and automotive services).
Table 2.
The chemical composition of the treated wastewater (TWW) and well water (WW; control) in comparison with the allowable level of international standards.
Another possible source is the chemicals that are applied in residential areas and urban utilities and discharged to the urban wastewater [45].
3.2. Impact of TWW Irrigation on Soil Fertility Indicators
TWW irrigation resulted in a slight increase in soil pH ranging from 4% to 6% compared to the WW control (Table 3), which may be viewed as a negative change in soil quality in such as arid and semi-arid environment [46]. This may have contributed to the high level of soluble salts and calcium carbonate equivalent (CCE) in TWW as represented by EC and CCE values of TWW in Table 2. In most TWW-treated sites, a significant increase (p ≤ 0.5) was evident in the OM content ranging from 17% to 26% higher than WW irrigated soils, which is consistent with the results reported by Bedbabis et al. [21] and Aydin et al. [47]. The presence of degradable and compostable substances in the wastewater is possibly responsible for the increased OM, which promotes the microbial activities of the decomposition processes and thereby increases the humus in the TWW-irrigated soil [48,49]. The total N was significantly increased by TWW irrigation ranging from 22 to 90%, likely due to the biodegradation of recalcitrant carbon compounds in the wastewater [50]. The contribution of carbon compounds to total N has been reported in several previous studies [5,51]. The C/N ratio was in the range of 8 to 15 in both TWW-irrigated soils and the control soil, implying the N mineralization which has profound implications for OM cycling and nutrient release [52]. Generally, the decomposition process of organic matter and the release of N in soils are likely to happen when the C/N ratio is lower than 20:1 [53].
Table 3.
Mean comparison for the fertility indices of the treated wastewater (TWW)-irrigated soils and adjacent well water (WW)-irrigated soil.
Compared to the soil in the control site, there was a significant increase in soil available P ranging from 4 to 8.3 mg kg−1, which can considerably reduce the need for phosphorus fertilizer. A similar result was found by the study of Thapliyal et al. [54] and Khawla et al. [22]. Soil CEC as an indicator of soil productivity, nutrient retention capacity, and the soil capacity to keep groundwater from cation pollution was another key soil attribute that was regulated by the TWW irrigation when compared to the control soil. Similar to the OM, CEC increased from 33 to 42% due to TWW irrigation. OM and clay fraction are the main factors responsible for greater soil CEC [50]. A significant accumulation of exchangeable Ca+2, Mg+2, and K+ were found in TWW-irrigated versus control treatments, ranging from 14 to 50%, 37 to 101%, and 49 to 164%, respectively. Cation enrichment in the TWW-treated soil has also been reported by Bedbadis et al. [21] and Abegunrin et al. [48] in Tunisian (with a clay texture) and Nigerian (with a sandy loam texture) soils, respectively. Higher cations associated with TWW-treated soil may be direct result of a higher cation concentration compared to control treatment [45].
3.3. Effects of TWW Irrigation on Trace Metals Concentrations
The concentrations of available (extracted by DTPA) and total fractions of trace metals in the TWW-irrigated soils were higher than those in the WW-irrigated control soil (Table 4). The mean concentration of DTPA-extractable trace metals was in the order of Fe > Mn > Cu > Zn for both TWW-irrigated soils and control soil (Table 4). Except for DTPA-Fe, a significant increase occurred in all DTPA-extractable metals versus their counterparts in the control soils in the order of Cu (65–175%) > Zn > (36–73%) > Mn (25–31%) > Fe (17–22.5%) (Table 4). The results show that TWW-irrigated soils were richer in trace metals at all sites. The higher amount of metals in the TWW-irrigated soils might be directly related to the presence of these metals in the TWW or indirectly due to the higher solubility of the indigenous insoluble soil trace metals as a result of the interaction between the used wastewater and the subjected soils [22,45]. However, except for Cu whose concentration exceeded the acceptable limit [55], the remaining metals fell into the acceptable ranges. In most TWW-treated fields, DTPA-Cu was 1.3 to 1.4 times higher than its upper allowable range (2.5 mg kg−1, Malakoti and Hamedani [55], indicating the possible risk of phytotoxicity. This accords well with the findings of Avci and Deveci [56] Kabata-Pendias [57]. Excessive accumulation of Cu in TWW-irrigated soils can be attributed to the a 3-fold above threshold [42,43,44] Cu concentration in TWW (Table 2).
Table 4.
Means comparison for the trace metals of treated wastewater (TWW)-irrigated soils and adjacent well water (WW)-irrigated soil.
Similar to the DTPA-extractable form, the concentration of total forms of trace metals showed an ascending order of Fe > Mn > Cu > Zn in the TWW-irrigated soils and control soil (Table 4). Except for Fe, TWW irrigation significantly increased the total form of metals versus their counterparts in the control soils in the order of Zn (102–156%) > Cu > (38–51%) Mn (37–40%) > Fe (12–13%). Nevertheless, the total forms of all metals were within the desirable limits [57]. Moreover, significant correlations (p < 0.05, e.g., r = 0.54 for Fe, r = 0.51 for Mn, r = 0.49 for Zn, and r = 0.56 for Cu) between DTPA and total fractions of all trace metals, suggests that they likely have been initiated from the same TWW source [58,59].
3.4. Influence of TWW Irrigation on Soil Quality Indices (SQI)
3.4.1. TDS Method
In TDS approach, seventeen soil chemical quality indicators including pH, OM, CEC, total N, C/N ratio, available P, exchangeable cations (Ca, Mg, and K), and total and bioavailable fraction of Fe, Mn, Zn, and Cu were measured and evaluated in conjunction with soil productivity. Among all indicators, available P and total Mn, respectively had the highest and lowest weighting coefficients, thus having the most and least influences on the final SQI-TDS scoring results (Table 5). The IQI-TDS model proposed in the study can be calculated using the following equation. The indicators are ordered by their weighting coefficients as follows:
Table 5.
The communality and weight values of each soil variable for both TDS and MDS approaches.
Based on the IQI-NQI and IQI-TDS models, the nutritional/chemical quality of the study soil was categorized into five grades, ranging from I to V (Table 6). The assigned range illustrates the descending chemical-nutritional soil quality trend as represented by SQI. In TWW-irrigated soils, the mean IQI and NQI values based on the TDS (IQI-TDS and NQI-TDS) ranged from 0.7 (site 5) to 0.79 (site 2) and 0.56 (site 5) to 0.59 (site 4), respectively. This corresponds to III to II quality grades for both IQI and NQI models (Figure 2; Table 6). This is a typical range of soil nutritional/chemical quality grade in semi-arid climates as reported by several previous studies [35,36,60,61,62]. Soils with grade II quality either as IQI or NQI has generally been reported with suitable nutritional condition for appropriate plant growth while grade III has been characterized with some nutritional limitations [37,62].
Table 6.
Categorization of soil quality grades using different methods.
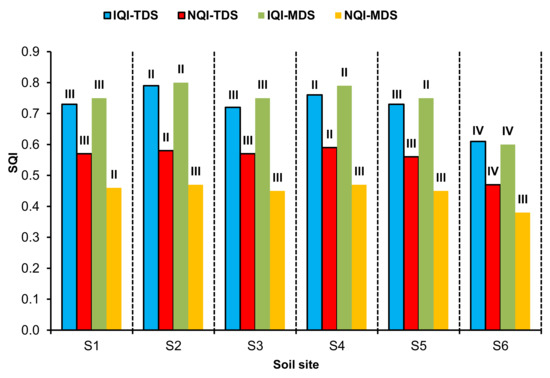
Figure 2.
The comparison of soil quality grades between the TWW-irrigated soils (S1–S5) and the control soil (S6). Symbols I, ..., IV indicate the categorization of soil quality grades (I, very high grade; II, high grade; III, moderate grade; IV, low grade).
Compared to the control soil, the IQI-TDS and NQI-TDS values were higher in the TWW-irrigated soils by 14.6% to 29.5% for the IQI-TDS model and 19.1% to 25.5% for the NQI-TDS model (Figure 3). This is associated with an upsurged soil quality grade from IV to III in most soil sites treated by TWW irrigation (Figure 2), indicating a positive effect of TWW irrigation on soil quality indices calculated by nutritional/chemical indicators. Our results corroborate the findings of previous studies conducted by Chen et al. [63] and Lyu and Chen [64], who found that SQI and soil health conditions were improved by TWW irrigation. Among different soil sites under TWW irrigation, the highest increases in IQI-TDS and NQI-TDS values were related to sites 2 and 4 where the highest increases were observed in the values of P, OM, and K versus the control. These indicators are consistent with the strongest indicators affecting the TDS approach with respect to the weight of each indicator (Table 5), thereby resulting in a greater increase in IQI-TDS and NQI-TDS in sites 2 and 4 than in the other sites. Phosphorus, OM, and K are the most important factors for soil productivity indices which have widely been considered for soil quality assessment [37,63,65,66].
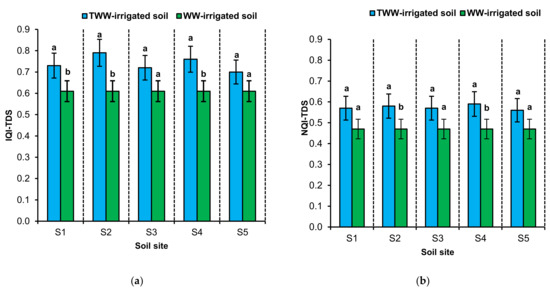
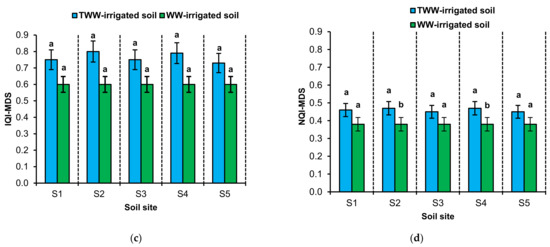
Figure 3.
The comparison of the mean values of different SQI models in well water (WW)-irrigated soil and treated wastewater (TWW)-irrigated soils at individual sites: IQI-TDS (a), NQI-TDS (b), IQI-MDS (c), and NQI-MDS (d). Different letters indicate significant differences at p < 0.05 based on the t-test. The bars represent the standard deviation (SD) of means.
3.4.2. MDS Method
The indicators of the MDS dataset were specified using PCA analysis, which is an effective and common approach to reduce the multidimensionality of dataset in agricultural and biological studies [33,36,41]. As illustrated in Table 7, first and second principal components (PCs) with eigenvalues of >1 ranging from 5.96 to 6.35, explained 83.83% of the total variance in dataset. The first PC captured 46.59% of variability, comprising OM, CEC, available P, DTPA-extractable Fe and DTPA-extractable Zn, and total Zn. Under this PC, only a significant correlation (p < 0.01) was observed between OM and CEC and between DTPA-Fe and DTPA-Zn (Table 8), so OM, available P, DTPA-Fe, and total Zn were retained in the MDS dataset. PC2 explained 37.24% of the total variance with greater weighting factor for total N (a load of 0.83) and exchangeable cations of Ca, Mg, and K in the order of K> Ca> Mg. Exchangeable Ca, Mg, and K were significantly correlated with each other (p < 0.01), but not well correlated with total N (Table 8). Thus, total N and exchangeable K were selected to be involved in MDS dataset. Organic matter, available P, DTPA-Fe, total Zn, total N, and exchangeable K were selected to form the final MDS dataset. Thus, the number of soil quality indicators was reduced from 17 in the TDS to 6 most critical indicators in the MDS. This means that a reduction of over 60% occurred in the initial dataset to maintain only nutritionally significant and independent indices in MDS dataset. Given the weight of each indicator, the IQI-MDS model can be calculated using the following equation.
Table 7.
Results of principal component analysis (PCA) for soil quality variables.
Table 8.
Pearson correlation coefficients between Cd concentration of different wheat parts and with selected soil properties.
Among all the selected indicators in the MDS, available P had the highest contribution (18.5%) to IQI-MDS, followed by exchangeable K (17.8%), total N (17.3%), total Zn (16.3%), OM (15.7%), and DTPA-Fe (14.4%), almost a similar order to those occurred for the TDS dataset. Soil OM and macronutrients (N, P, and K) are the fundamental soil quality indicators due to their central role not only in soil nutritional affluence, but also in a greater soil physical strength and biological vitality [25,36,42,65,67]. Given the inclusion of trace metals (e.g., Fe and Zn) in the MDS dataset, the metals may highlight a wider viewpoint of soil nutrition for soil operators and scientists, who usually focus on microelements such as N, P and K when applying fertilizer [67]. Fe and Zn are two important metals driving many physiological functions of crops (e.g., the synthesis of chlorophyll, membrane integrity, reproduction, etc.) and are necessary and crucial nutrients for corn growth and its quantitative and qualitative grain yield [68]. Additionally, useful information regarding the soil functions such as micronutrient availability and crop productivity can be obtained by measuring trace metals [37,68]. In this study, the corn yield had a weak significant correlation with total Fe (r = 0.22, p < 0.05) and DTPA-Zn (r = 0.28, p < 0.05). Although the available Fe and Zn values of the TWW-irrigated soils were acceptable (Fe = 8–10 mg kg −1, Zn = 2–3 mg kg−1), auxiliary practices may still be necessary for maintaining the optimal range of available soil trace metals, such as Fe and Zn, in order to improve corn yield.
The mean values of the IQI-MDS and NQI-MDS models were in the range of 0.73 (site 5) to 0.80 (site 2) and 0.45 (site 5) to 0.47 (sites 2 and 4) in the TWW-irrigated soils, respectively, which is almost similar to the trend observed for the TDS dataset (Table 6). Regarding both IQI-MDS and NQI-MDS models, in the majority of TWW-irrigated soil sites, grade III was developed while grade IV was observed in the control soil, reflecting one grade of improvement in soil quality by TWW irrigation (Figure 2; Table 6). As with the TDS dataset, TWW irrigation resulted in a significant increase in the values of the IQI-MDS and NQI-MDS models ranging from 21.7 to 33.3% and 18.4 to 23.7%, respectively. This suggests that soil quality improvement dataset increased by TWW irrigation. Evidence for this trend is a significant increase in corn yield in the TWW-irrigated soils compared to the control soil as described in the next section. Given the fact that the influencing factors (i.e., climate, topography, parent material, soil type, soil use, and conventional cultivation methods) on soil quality were similar between the TWW-irrigated and control soils, it was assumed that any differences between their soil quality could be attributed to the effects of TWW irrigation. Other studies have also shown the beneficial and improving impacts of wastewater irrigation on soil quality [6,41,56].
3.5. Relationship between SQI and Corn Yield
As shown in Figure 4, TWW irrigation significantly raised corn yield in almost all soil sites (Figure 4), ranking in the order of S2 (28.1%) > S4 (26.6%) > S1 (20.3%) > S3 (18.8%) > S5 (12.5%). Different soil sites responded to TWW irrigation differently likely as a result of antecedent differences in physicochemical soil attributes [46]. However, TWW-irrigated sites with varying magnitudes, consistently exhibited nutritionally richer soil than in control site. The significant contribution of TWW irrigation to corn yield can be associated with the higher nutrient enrichment in TWW soils, which directly affects crop performance and yield outcome. This implication is supported by statistically significant correlation (p < 0.05) between the concentration of soil nutrients and corn grain, e.g., r = 0.42 for OM, r = 041 for total N, r = 0.38 for available P, r = 0.34 for exchangeable K, r = 0.31 for DTPA-Fe, and r = 0.29 for DTPA-Zn. According to the literature, soil fertility indicators are the important attributes and critical functions affecting crop growth and yields as well as SQI, which are usually correlated with crop yields [68,69]. Our results are in accordance with the those of Khawla et al. [22], Disciglio et al. [70], and Urbano et al. [71] who reported the beneficial effects of TWW irrigation (mainly nutrient contents of the wastewater) on increasing tomato and lettuce yields and corn biomass.
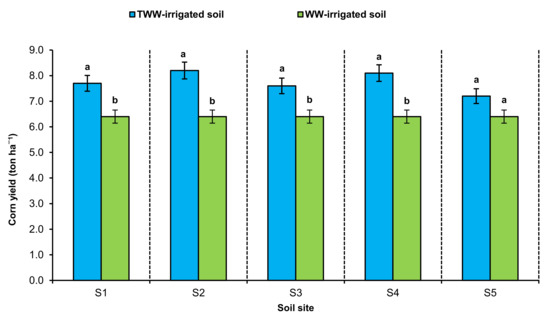
Figure 4.
The comparison of the mean values of corn yield in well water (WW)-irrigated soil and treated wastewater (TWW)-irrigated soils in different soil sites. Different letters indicate significant differences at p < 0.05 based on the t-test. The bars represent the standard deviation (SD) of means.
The linear regression analysis was carried out between SQI and corn yield to verify how well the SQI represented the corn yield. As shown in Figure 5, all SQI models (IQI-TDS, NQI-TDS, IQI-MDS, and NQI-MDS) revealed a significant relationship with the corn yield (with an R2 in the range of 0.36–0.78), implying that TWW irrigation positively affected corn yield in parallel to the changes in SQI. Previous studies around the world have reported a comparable range of R2 values (0.4–0.89) explaining yield outcomes with SQI models [37,41,71,72].

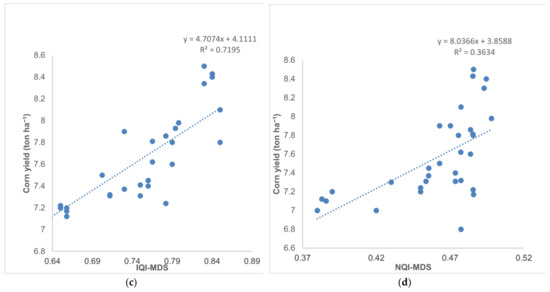
Figure 5.
The linear regression analysis between different SQI models and corn yield: IQI-TDS (a), NQI-TDS (b), IQI-MDS (c), and NQI-MDS (d).
The regression equations between different SQI models and corn yield are given as follows:
These relationships show that IQI and NQI models with two dataset size and arrangement systems of TDS and MDS explained 36 to 78% of the variability in corn yield which indicates an overall positive influence of TWW irrigation on soil nutritional quality and corn crop growth and yield. The IQI method was, however, more accurate than the NQI method in predicting corn performance as indicated by the higher correlation coefficient. These differences may be due to the fact that the combination of scoring and weighting is applied for soil variables in the IQI method, whereas the NQI model is calculated only based on the average values and the minimum score of the variables [71,72].
In short, the IQI-TDS model was more accurate than the other models in assessing soil quality and predicting corn yield because of its higher regression coefficient (Equation (7)). Comparing the different SQI models, it was observed that the consistency between TDS and MDS was higher in the IQI method than in the NQI method (Table 8), showing that IQI-MDS can provide adequate information for assessing soil quality in the region like the IQI-T model. Therefore, we suggest that the IQI-MDS model is optimal for estimating soil quality and predicting crop yields in the examined region as suggested in previous studies [37,73]. Assessing soil quality by MDS model can lead to (1) the reduction of the number of indicators used in assessing SQI, (2) the time of laboratory analysis, and (3) the cost of determining effective variables [36,41]. There was a pronounced significant correlation between IQI-TDS and IQI-MDS (p < 0.01) (Table 9) and a less significant correlation between other models, e.g., IQI-TDS versus NQI-TDS (p < 0.05, r = 0.68), IQI-MDS versus NQI-TDS (p < 0.05, r = 0.59), and IQI-MDS versus NQI-MDS (p < 0.05, r = 0.64).
Table 9.
Correlation matrix for eight SQIs.
4. Conclusions
The framework of the study involved an analysis of soil variables, indicator classification, scoring, weighting, and SQI calculation. Over ten years of TWW irrigation, a clear pattern of changes has been produced in the fertility indicators. Different SQI scenarios (IQI-TDS, IQI-MDS, NQI-TDS, and NQI-MDS) were calculated based on a total of 17 soil nutritional-chemical attributes and corn yield. TWW irrigation resulted in a significant accumulation of OM, CEC, nutrients (N, P, K, Ca, and Mg), and the majority of trace metals depending on soil site. This implies that TWW irrigation can not only be used to increase the availability of irrigation water given the water scarcity, but it can also improve soil nutrients level and increase productivity. Compared to the control soil, the values of IQI and NQI for the TWW-treated soil were higher by 14.6–29.5% and 19.1–25.5% for the TDS approach using 17 soil variables and by 21.7–33.3% and 18.4–23.7% for the MDS approach using six soil variables, respectively. These improvements were linked to at least one class of promotion in soil quality grade in all soil sites showing that soil quality was ameliorated to a remarkable extent by TWW irrigation. The results indicated that the IQI-MDS model was a more preferable index than the other models evaluated with respect to the correlation analyses among different SQI models and regression equations between corn yield and different SQI models. These findings may assist producers and policymakers with an effective and practical framework for monitoring of nutrients and contaminants in soils under wastewater irrigation.
Author Contributions
S.R. and H.M.J. designed the study and performed the analysis. A.N., S.A.H., and S.B.L. developed the methodology and wrote the manuscript. All authors have read and agreed to the published version of the manuscript.
Funding
Urmia University, Urmia, Iran.
Institutional Review Board Statement
Not applicable.
Informed Consent Statement
Not applicable.
Data Availability Statement
The data of the current study are available from the corresponding author upon a reasonable request.
Acknowledgments
The authors acknowledge Urmia University, Urmia, Iran for the financial support of the research.
Conflicts of Interest
The authors declare no conflict of interest.
References
- Steduto, P.; Faurès, J.M.; Hoogeveen, J.; Winpenny, J.; Burke, J. Coping with Water Scarcity: An Action Framework for Agriculture and Food Security; FAO Water Reports; FAO: Rome, Italy, 2012. [Google Scholar]
- UNESCO World Water Assessment Programme. The United Nations 21 World Water Development Report: Natur-Based Solutions for Water; UNESCO: Paris, France, 2018. [Google Scholar]
- Saliba, R.; Callieris, R.; D’Agostino, D.; Roma, R.; Scardigno, A. Stakeholders’ attitude towards the reuse of treated wastewater for irrigation in Mediterranean agriculture. Agric. Water Manag. 2018, 204, 60–68. [Google Scholar] [CrossRef]
- Rezapour, S.; Samadi, A.; Khodaverdiloo, H. An investigation of the soil property changes and heavy metal accumulation in relation to long-term wastewater irrigation in the semi-arid region of Iran. Soil Sed. Cont. 2011, 20, 841–856. [Google Scholar] [CrossRef]
- Rezapour, S.; Samadi, A.; Khodaverdiloo, H. Impact of long-term wastewater irrigation on variability of soil attributes along a landscape in semi-arid region of Iran. Environ. Earth Sci. 2012, 67, 1713–1723. [Google Scholar] [CrossRef]
- Rezapour, S.; Samadi, A. Soil quality response to long-term wastewater irrigation in Inceptisols from a semi-arid environment. Nut. Cycl. Agroecos. 2011, 91, 269–280. [Google Scholar] [CrossRef]
- Jaramillo, M.F.; Restrepo, I. Wastewater reuse in agriculture: A review about its limitations and benefits. Sustainability 2017, 9, 1734. [Google Scholar] [CrossRef]
- Andrews, S.S.; Karlen, D.; Mitchell, J. A comparison of soil quality indexing methods for vegetable production systems in Northern California. Agric. Ecosyst. Environ. 2002, 90, 25–45. [Google Scholar] [CrossRef]
- Andrews, S.S.; Karlen, D.L.; Cambardella, C.A. The soil management assessment framework: A quantitative soil quality evaluation method. Soil. Sci. Soc. Am. J. 2004, 68, 1945–1962. [Google Scholar] [CrossRef]
- Riemenschneider, C.; Al-Raggad, M.; Moeder, M.; Seiwert, B.; Salameh, E.; Reemtsma, T. Pharmaceuticals, their metabolites, and other polar pollutants in field-grown vegetables irrigated with treated municipal wastewater. J. Agric. Food Chem. 2016, 64, 5784–5792. [Google Scholar] [CrossRef]
- Turan, V.; Khan, S.A.; Iqbal, M.; Ramzani, P.M.A.; Fatima, M. Promoting the productivity and quality of brinjal aligned with heavy metals immobilization in a wastewater irrigated heavy metal polluted soil with biochar and chitosan. Ecotoxicol. Environ. Saf. 2018, 161, 409–419. [Google Scholar] [CrossRef]
- Lonigro, A.; Rubino, P.; Lacasella, V.; Montemurro, N. Faecal pollution on vegetables and soil drip irrigated with treated municipal wastewaters. Agric. Water Manag. 2016, 174, 66–73. [Google Scholar] [CrossRef]
- Thebo, A.L.; Drechsel, P.; Lambin, E.F.; Nelson, K.L. A global, spatially-explicit assessment of irrigated croplands influenced by urban wastewater flows. Environ. Res. Lett. 2017, 12, 074008. [Google Scholar] [CrossRef]
- Godwin, P.M.; Pan, Y.; Xiao, H.; Afzal, M.T. Progress in preparation and application of modified biochar for improving heavy metal ion removal from wastewater. J. Biores. Bioprod. 2019, 4, 31–42. [Google Scholar]
- Siebe, C.; Chapela-Lara, M.; Cayetano-Salazar, M.; Prado, B.; Siemens, J. Effects of More Than 100 Years of Irrigation with Mexico City’s Wastewater in the Mezquital Valley; Safe use of wastewater in agriculture: Good practice examples; UNU-FLORES: Dresden, Germany, 2016; pp. 121–138. [Google Scholar]
- Kalavrouziotis, I.K.; Koukoulakis, P.; Kostakioti, E. Assessment of metal transfer factor under irrigation with treated municipal wastewater. Agric. Water Manag. 2012, 103, 114–119. [Google Scholar] [CrossRef]
- Elgallal, M.; Fletcher, L.; Evans, B. Assessment of potential risks associated with chemicals in wastewater used for irrigation in arid and semiarid zones: A review. Agric. Water Manag. 2016, 177, 419–431. [Google Scholar] [CrossRef]
- Miraftab, R.; Huining, X. Feasibility and potential of graphene and its hybrids with cellulose as drug carriers: A commentary. J. Biores. Bioprod. 2019, 4, 200–201. [Google Scholar]
- Singh, S.; Jagadamma, S.; Yoder, D.; Yin, X.; Walker, F. Agroecosystem management responses to Haney soil health test in the southeastern United States. Soil Sci. Soc. Am. J. 2020, 84, 1705–1721. [Google Scholar] [CrossRef]
- Weil, R.; Brady, N. The Nature and Properties of Soils; Pearson: Upper Saddle River, NJ, USA, 2016. [Google Scholar]
- Bedbabis, S.; Rouina, B.B.; Boukhris, M.; Ferrara, G. Effect of irrigation with treated wastewater on soil chemical properties and infiltration rate. J. Environ. Manag. 2014, 133, 45–50. [Google Scholar] [CrossRef]
- Khawla, K.; Besma, K.; Enrique, M.; Mohamed, H. Accumulation of trace elements by corn (Zea mays) under irrigation with treated wastewater using different irrigation methods. Ecoto. Environ. Saf. 2019, 170, 530–537. [Google Scholar] [CrossRef] [PubMed]
- Griffiths, B.S.; Ball, B.C.; Daniell, T.J.; Hallett, P.D.; Neilson, R.; Wheatley, R.E.; Bohanec, M. Integrating soil quality changes to arable agricultural systems following organic matter addition, or adoption of a ley-arable rotation. Appl. Soil Ecol. 2010, 46, 43–53. [Google Scholar] [CrossRef]
- Zhang, Y.; Xu, X.; Li, Z.; Liu, M.; Xu, C.; Zhang, R.; Luo, W. Effects of vegetation restoration on soil quality in degraded karst landscapes of southwest China. Sci. Total Environ. 2019, 650, 2657–2665. [Google Scholar] [CrossRef]
- Sparks, D.L.; Page, A.; Helmke, P.A.; Loeppert, R.H. Methods of Soil Analysis, Part 3: Chemical Methods; Sparks, D.L., Page, A., Helmke, P.A., Loeppert, R.H., Eds.; John Wiley & Sons: Hoboken, NJ, USA, 2020. [Google Scholar]
- Nelson, R.E. Carbonate and gypsum. In Methods of Soil Analysis: Part 2 Chemical and Microbiological Properties; John Wiley & Sons: Hoboken, NJ, USA, 1983; Volume 9, pp. 181–197. [Google Scholar]
- Bremner, J.M.; Mulvaney, C.S. Nitrogen-Total Methods of Soil Analysis. Part 3-Chemical Methods; Soil Science of America and American Society of Agronomy: Madison, WI, USA, 1982; p. 1085. [Google Scholar]
- Olsen, S.R.; Sommers, L.E. Phosphorus in AL Page. Methods of Soil Analysis. Part 2. Chemical and Microbiological Properties. In Agronomy Monographs; Soil Science Society of America, Inc.: Madison, WI, USA, 1982; Volume 2, pp. 423–424. [Google Scholar]
- Thomas, G.W. Exchangeable Cations. In Methods of Soil Analysis: Part 2 Chemical and Microbiological Properties; American Society of Agronomy: Madison, WI, USA, 1983; Volume 9, pp. 159–165. [Google Scholar]
- Soon, Y.R.; Abboud, S. Cadmium, chromium, and nickel. In Soil Sampling and Methods of Soil Analysis; Carter, M.R., Ed.; Lewis Publishers: Boca Raton, FL, USA, 1993; pp. 101–108. [Google Scholar]
- Lindsay, W.L.; Norvell, W.A. Development of a DTPA soil test for zinc, iron, manganese, and copper. Soil Sci. Soc. Am. J. 1978, 42, 421–428. [Google Scholar] [CrossRef]
- Eaton, A.D.; Clesceri, L.S.; Greenberg, A.E. Recreational Waters, p. 9.26–9.27. In Standard Methods for the Examination of Water and Wastewater, 19th ed.; American Public Health Association: Washington, DC, USA, 1995. [Google Scholar]
- Andrews, S.S.; Carroll, C.R. Designing a soil quality assessment tool for sustainable agroecosystem management. Ecol. Appl. 2001, 11, 1573–1585. [Google Scholar] [CrossRef]
- Basak, N.; Datta, A.; Mitran, T.; Roy, S.S.; Saha, B.; Biswas, S.; Mandal, B. Assessing soil-quality indices for subtropical rice-based cropping systems in India. Soil Res. 2016, 54, 20–29. [Google Scholar] [CrossRef]
- Nabiollahi, K.; Golmohamadi, F.; Taghizadeh-Mehrjardi, R.; Kerry, R.; Davari, M. Assessing the effects of slope gradient and land use change on soil quality degradation through digital mapping of soil quality indices and soil loss rate. Geoderma 2018, 318, 16–28. [Google Scholar] [CrossRef]
- Li, X.; Wang, D.; Ren, Y.; Wang, Z.; Zhou, Y. Soil quality assessment of croplands in the black soil zone of Jilin Province, China: Establishing a minimum data set model. Ecol. Indic. 2019, 107, 105251. [Google Scholar] [CrossRef]
- Biswas, S.; Hazra, G.C.; Purakayastha, T.J.; Saha, N.; Mitran, T.; Roy, S.S.; Mandal, B. Establishment of critical limits of indicators and indices of soil quality in rice-rice cropping systems under different soil orders. Geoderma 2017, 292, 34–48. [Google Scholar] [CrossRef]
- Doran, J.W.; Parkin, T.B. Defining and assessing soil quality. Defin. Soil Qual. Sustain. Environ. 1994, 35, 1–21. [Google Scholar]
- Qin, M.Z.; Zhao, J. Strategies for sustainable use and characteristics of soil quality changes in urban-rural marginal area. Acta Geogr. Sin. Chin. Ed. 2000, 55, 545–554. [Google Scholar]
- De Paul Obade, V.; Lal, R. Towards a standard technique for soil quality assessment. Geoderma 2016, 265, 96–102. [Google Scholar] [CrossRef]
- Jahany, M.; Rezapour, S. Assessment of the quality indices of soils irrigated with treated wastewater in a calcareous semi-arid environment. Ecol. Indic. 2020, 109, 105800. [Google Scholar] [CrossRef]
- World Health Organization. Guidelines for the Safe Use of Wastewater, Excreta and Greywater: Vol. 1: Policy and Regulatory Aspects; World Health Organization: Geneva, Switzerland, 2006. [Google Scholar]
- FAO. Wastewater reuse and Sludge Valorisation and reuse. In Proposition for Lebanese Wastewater 9 Reuse Guidelines; United Nations—Food and Agricultural Organization (FAO): Rome, Italy, 2010. [Google Scholar]
- World Health Organization. Sanitation Safety Planning: Manual for Safe Use and Disposal of Wastewater Greywater and Excreta; World Health Organization: Geneva, Switzerland, 2015. [Google Scholar]
- Rezapour, S.; Atashpaz, B.; Moghaddam, S.S.; Kalavrouziotis, I.K.; Damalas, C.A. Cadmium accumulation, translocation factor, and health risk potential in a wastewater-irrigated soil-wheat (Triticum aestivum L.) system. Chemosphere 2019, 231, 579–587. [Google Scholar] [CrossRef]
- Smith, J.L.; Doran, J.W. Measurement and use of pH and electrical conductivity for soil quality analysis. Methods Assess. Soil Qual. 1997, 49, 169–185. [Google Scholar]
- Aydin, M.E.; Aydin, S.; Beduk, F.; Tor, A.; Tekinay, A.; Kolb, M.; Bahadir, M. Effects of long-term irrigation with untreated municipal wastewater on soil properties and crop quality. Environ. Sci. Poll. Res. 2015, 22, 19203–19212. [Google Scholar] [CrossRef] [PubMed]
- Abegunrin, T.P.; Awe, G.O.; Idowu, D.O.; Adejumobi, M.A. Impact of wastewater irrigation on soil physico-chemical properties, growth and water use pattern of two indigenous vegetables in southwest Nigeria. Catena 2016, 139, 167–178. [Google Scholar] [CrossRef]
- Liu, L.; Wang, H.; Dai, W. Characteristics of soil organic carbon mineralization and influence factor analysis of natural Larix olgensis forest at different ages. J. For. Res. 2019, 30, 1495–1506. [Google Scholar] [CrossRef]
- Rezapour, S.; Kalashypour, E.; Asadzadeh, F. Assessment of the quality of salt-affected soils after irrigation and cultivation in semi-arid condition. Int. J. Environ. Res. 2017, 11, 301–313. [Google Scholar] [CrossRef]
- Angassa, A.; Sheleme, B.; Oba, G.; Treydte, A.C.; Linstädter, A.; Sauerborn, J. Savanna land use and its effect on soil characteristics in southern Ethiopia. J. Arid Environ. 2012, 81, 67–76. [Google Scholar] [CrossRef]
- Havlin, J.L.; Tisdale, S.L.; Nelson, W.L.; Beaton, J.D. Soil Fertility and Fertilizers. Pearson Education India: Chennai, India, 2016. [Google Scholar]
- Thapliyal, A.; Vasudevan, P.; Dastidar, M.G.; Tandon, M.; Mishra, S. Irrigation with domestic wastewater: Responses on growth and yield of ladyfinger Abelmoschus esculentus and on soil nutrients. J. Environ. Biol. 2011, 32, 645. [Google Scholar]
- Rezapour, S.; Taghipour, A.; Samadi, A. Modifications in selected soil attributes as influenced by long-term continuous cropping in a calcareous semiarid environment. Nat. Hazards 2013, 69, 1951–1966. [Google Scholar] [CrossRef]
- Malakoti, M.; Hamedani, V. Fertility and Soil Fertilizer; Tehran University Press: Tehran, Iran, 2001. (In Farsi) [Google Scholar]
- Avci, H.; Deveci, T. Assessment of trace element concentrations in soil and plants from cropland irrigated with wastewater. Ecotoxicol. Environ. Saf. 2013, 98, 283–291. [Google Scholar] [CrossRef]
- Kabata-Pendias, A. Trace Elements in Soils and Plants; CRC Press: Boca Raton, FL, USA, 2010. [Google Scholar]
- Ramos-Miras, J.J.; Roca-Perez, L.; Guzmán-Palomino, M.; Boluda, R.; Gil, C. Background levels and baseline values of available heavy metals in Mediterranean greenhouse soils (Spain). J. Geochem. Explor. 2011, 110, 186–192. [Google Scholar] [CrossRef]
- Santos-Francés, F.; Martínez-Graña, A.; Ávila-Zarza, C.; Criado, M.; Sánchez, Y. Comparison of methods for evaluating soil quality of semiarid ecosystem and evaluation of the effects of physico-chemical properties and factor soil erodibility (Northern Plateau, Spain). Geoderma 2019, 354, 113872. [Google Scholar] [CrossRef]
- Zeraatpisheh, M.; Bakhshandeh, E.; Hosseini, M.; Alavi, S.M. Assessing the effects of deforestation and intensive agriculture on the soil quality through digital soil mapping. Geoderma 2020, 363, 114139. [Google Scholar] [CrossRef]
- Li, X.; Li, H.; Yang, L.; Ren, Y. Assessment of soil quality of croplands in the Corn Belt of Northeast China. Sustainability 2018, 10, 248. [Google Scholar] [CrossRef]
- Qi, Y.; Darilek, J.L.; Huang, B.; Zhao, Y.; Sun, W.; Gu, Z. Evaluating soil quality indices in an agricultural region of Jiangsu Province, China. Geoderma 2009, 149, 325–334. [Google Scholar] [CrossRef]
- Chen, W.; Lu, S.; Pan, N.; Wang, Y.; Wu, L. Impact of reclaimed water irrigation on soil health in urban green areas. Chemosphere 2015, 119, 654–661. [Google Scholar] [CrossRef]
- Lyu, S.; Chen, W. Soil quality assessment of urban green space under long-term reclaimed water irrigation. Environ. Sci. Poll. Res. 2016, 23, 4639–4649. [Google Scholar] [CrossRef] [PubMed]
- Qu, M.; Li, W.; Zhang, C.; Zhao, Y.; Huang, B.; Sun, W.; Hu, W. Comparison of three methods for soil fertility quality spatial simulation with uncertainty assessment. Soil Sci. Soc. Am. J. 2013, 77, 2182–2191. [Google Scholar] [CrossRef]
- Alloway, B.J. Heavy Metals in Soils: Trace Metals and Metalloids in Soils and Their Bioavailability; Springer Science & Business Media: Berlin/Heidelberg, Germany, 2012; Volume 22. [Google Scholar]
- Kim, S.W.; Jeong, S.W.; An, Y.J. Application of a soil quality assessment system using ecotoxicological indicators to evaluate contaminated and remediated soils. Environ. Geochem. Health 2020, 42, 1681–1690. [Google Scholar] [CrossRef]
- Cheng, J.; Ding, C.; Li, X.; Zhang, T.; Wang, X. Soil quality evaluation for navel orange production systems in central subtropical China. Soil Till. Res. 2016, 155, 225–232. [Google Scholar] [CrossRef]
- Mei, N.; Yang, B.; Tian, P.; Jiang, Y.; Sui, P.; Sun, D.; Qi, H. Using a modified soil quality index to evaluate densely tilled soils with different yields in Northeast China. Environ. Sci. Pollut. Res. 2019, 26, 13867–13877. [Google Scholar] [CrossRef] [PubMed]
- Disciglio, G.; Gatta, G.; Libutti, A.; Gagliardi, A.; Carlucci, A.; Lops, F.; Tarantino, A. Effects of irrigation with treated agro-industrial wastewater on soil chemical characteristics and fungal populations during processing tomato crop cycle. J. Soil Sci. Plant Nutr. 2015, 15, 765–780. [Google Scholar] [CrossRef]
- Urbano, V.R.; Mendonça, T.G.; Bastos, R.G.; Souza, C.F. Effects of treated wastewater irrigation on soil properties and lettuce yield. Agric. Water Manag. 2017, 181, 108–115. [Google Scholar] [CrossRef]
- Vasu, D.; Singh, S.K.; Ray, S.K.; Duraisami, V.P.; Tiwary, P.; Chandran, P.; Anantwar, S.G. Soil quality index (SQI) as a tool to evaluate crop productivity in semi-arid Deccan plateau, India. Geoderma 2016, 282, 70–79. [Google Scholar] [CrossRef]
- Raiesi, F.; Salek-Gilani, S. Development of a soil quality index for characterizing effects of land—Use changes on degradation and ecological restoration of rangeland soils in a semi-arid ecosystem. Land Degrad. Dev. 2020, 31, 1533–1544. [Google Scholar] [CrossRef]


Publisher’s Note: MDPI stays neutral with regard to jurisdictional claims in published maps and institutional affiliations. |
© 2021 by the authors. Licensee MDPI, Basel, Switzerland. This article is an open access article distributed under the terms and conditions of the Creative Commons Attribution (CC BY) license (http://creativecommons.org/licenses/by/4.0/).