Article

Factors Affecting Photovoltaic Solar Technology Usage Intention among Households in Malaysia: Model Integration and Empirical Validation

by
Syed Shah Alam
1,
Maisarah Ahmad
2,*,
Abdullah Sanusi Othman
3,
Zullina Bt Hussain Shaari
2 and
Mohammad Masukujjaman
4
1
Faculty of Business, Finance and Information Technology, MAHSA University Malaysia, Jenjarom 42610, Malaysia
2
Department of Management and Humanities, Universiti Teknologi PETRONAS, Seri Iskandar 32610, Malaysia
3
Faculty of Economics and Management, The National University of Malaysia, UKM Bangi 43600, Malaysia
4
Faculty of Business, Northern University Bangladesh, Dhaka 1205, Bangladesh
*
Author to whom correspondence should be addressed.
Sustainability 2021, 13(4), 1773; https://doi.org/10.3390/su13041773
Submission received: 26 October 2020 / Revised: 26 November 2020 / Accepted: 27 November 2020 / Published: 7 February 2021

Abstract

:
The objective of this research is to identify the antecedents affecting the behavioural intentions of local housing residences in using photovoltaic (PV) solar technology in their houses. An integrated model of behavioural intention to use PV solar technology is tested in this research. This study combined the theory of reason action (TRA), technology acceptance model (TAM), theory of planned behaviour (TPB) and diffusion of innovation (DOI) theory. Additional factors, including cost, awareness, and government initiatives, are also included in this model. The proposed model findings are based on empirical data from a sample of 382 residences in Malaysia. This study postulates that the intent to use PV solar technology is predicted by trialability, compatibility, perceived ease of use, relative advantage, observability, perceived behavioural control, attitude, subjective norms, cost, government initiatives, and level of awareness towards photovoltaic technology. The integrated model achieves 54% variance explained for usage intention of PV solar technology among housing residences in Malaysia. The findings suggest an integrated model for the acceptance intention of PV solar technology, which can assist stakeholders in planning, evaluating, and executing PV solar technology.

1. Introduction

Major changes are being required of energy infrastructure as it faces the serious challenges of protecting the climate, reducing pollution, and securing energy supply. Due to concerns about climate change and energy security, photovoltaic (PV) solar technology is one of the most promising sources of renewable energy. It has been widely discussed that photovoltaic solar technology will be one of the major sources for future energy because of its long-term benefits [1,2]. Photovoltaic solar technology is clean, quiet, and helps protect against climate change and pollution. Due to its abundant and renewable characteristics, PV solar power is also sustainable [3]. Thus, the major advantage of using PV solar technology includes its sources of energy that comes from solar power [4]. Residential PV solar energy system does not require extra land and thus reduces electricity transmission losses [5,6]. Malaysia, in this context, has a better comparative advantage due to its sunlight that is available 8–12 h a day and can generate 5.5-Kilowatt hours per square meter (KWh/m2) solar radiation every day [4], which is equivalent to 15 (MJ/m2) electricity power [7]. Compared to 2012, Malaysia added 792 MW of new solar capacity in 2013 [8].
Balancing ecology in this Earth, it is important to motivate users to adopt technologies that use renewable energy. Due to the huge demand for energy and growing concern about the environment the world is gradually pushing to use renewable energy. Considering other renewable energy fuels, PV solar technology is the sustainable and environment friendly technology. In the last decade, wide usage of PV solar technology has demonstrated its importance and it is known as the major sustainable source of power that can range from kilowatts (kW) to hundreds of megawatts (MW). Most of the experts consider that PV solar technology is the most promising renewable energy among them all. PV solar energy resulting from the Sun radiation on the Earth, it is the most abundant source of energy. The Sun is a pollution-free and most reliable renewable energy source. Due to human actions, the environment is becoming more polluted, resources are being consumed and the cost of energy is increasing, so greater focus on sustainable energy is needed.
In recent years, research on PV solar technology in a global context is readily available for locations other than Malaysia [9]. Some studies have examined the use of photovoltaic (PV) solar technology in the household context [10,11,12,13,14]. Other studies have discussed the policy context [9,15,16], market perspectives [17,18,19], and found a growing acceptability and use of PV solar systems among global residents. For example, in the US the growth of PV solar technology usage is huge, and there is no sign of a reduction or slowing down of this growth [20]. It is also found that one-quarter of the Australian homes now have PV solar systems [21]. The UAE government has decided to produce one-quarter of the country’s energy from PV solar energy systems by 2030 [22]. Contrasting to Australia and UAE, it is found that only 1 Gigawatt hour (GWh) electricity is produced in Malaysia from PV systems [23]. Located in the Asia and the Pacific region, most of the time, Malaysian weather is clear, hot and humid and has a huge potential to implement PV solar technology [23]. However, compared to other countries, the progress towards adopting PV solar energy systems in Malaysia is relatively slow.
Our review finds inadequate evidence in the literature regarding the adoption and intention to use PV solar systems in the Malaysian context. The adoption of PV solar technologies can objectively reduce energy crisis, climate change and unemployment; however, studies on improving competitiveness, future uptake and adoption process are relatively inadequate [24]. There also exists a lack of evidence demonstrating the difference in usage patterns and intention between developed and developing countries [25,26,27] for the reason that the implementation and adoption of PV solar technology vary across many factors, including political, economic, cultural and social [25]. Hence, transferring and generalising research finding from the developed to developing nations is flawed [27]. The noticeable lack of research in PV solar technology adoption/intention in the Malaysian context calls for more research.
The most important theoretical models used to investigate user acceptance and adoption of innovation are perceived characteristics of innovation (PCI), diffusion of innovation theory (DOI), technology acceptance model (TAM), theory of reasoned action (TRA), theory of planned behavior (TPB), unified theory of acceptance and use of technology (UTAUT) and the technology, organisation, environment (TEO) model. The widest usage models in innovation adoption research are TAM, DOI, TPB, TRA and TOE [28]. TOE has been commonly used for organisation research perspectives and diffusion innovation theory (DOI) [29], where individuals’ perceptions about using innovation are considered to affect their adoption behaviours [30,31]. The theory of reason action (TRA) is another important model that explains the relationship between actual system use, intention, attitude and user belief. Ajzen and Fishbein [32] used the technology acceptance model (TAM) [33,34] and the theory of planned behaviour (TPB) [35]. These theories are considered as the foundations for evaluating planning and executing the adoption of innovative technology. TAM, TRA, TPB and DOI models are integrated into this research, and additional variables such as cost, awareness and government initiative are also included.
This study makes some notable contributions. First, we reviewed existing literature in this area, develop a theoretical framework based on the three main theories commonly used in behavioural studies (i.e., TPB, TAM and DOI theory), and identify both an absolute and relative view of the gap. Second, we provide an analysis of the state of the factors driving it that owes its foundation to existing research and extend it, thus unifying and advancing the field of knowledge. Finally, we examine the factors contributing to PV solar technology usage research in developing country and urban context. Therefore, the objective of this research is to examine the factors influencing the Malaysian household’s usage intention of PV solar energy systems.
The organisation of the paper as follows. Following the introduction, the theoretical grounding, theories relevant to this study, justification of integration of the model, conceptual framework are provided. The next section discussed methodological issues. Then the empirical analysis is conducted using regression analysis on a survey of 382 respondents. Finally, discussion and conclusions are presented.

1.1. Theoretical Grounding

The adoption and diffusion of new products, services or innovation has been richly studied on factors affecting the adoption and acceptance of innovation at the individual level. However, until now, there is no single theory in existence for the researcher to utilise for renewable energy research. Thus, researchers have been applying theoretical models and theories from a variety of subject areas, which are appropriate to explain the adopter’s innovation behavior and attitude of renewable energy adoption intention. Moreover, most of the innovation adoption studies have behavior theories from other disciplines such as sociology and psychology that models related to users acceptance of innovation.
PV solar technology needs its study with its unique features [36]. Individuals’ perceptions play an important role as PV solar technology depends on the socially oriented process because it is from conventional energy sources [37]. It can be claimed that the appropriate theories will be for this research would be technology innovation theories and social psychological theories.

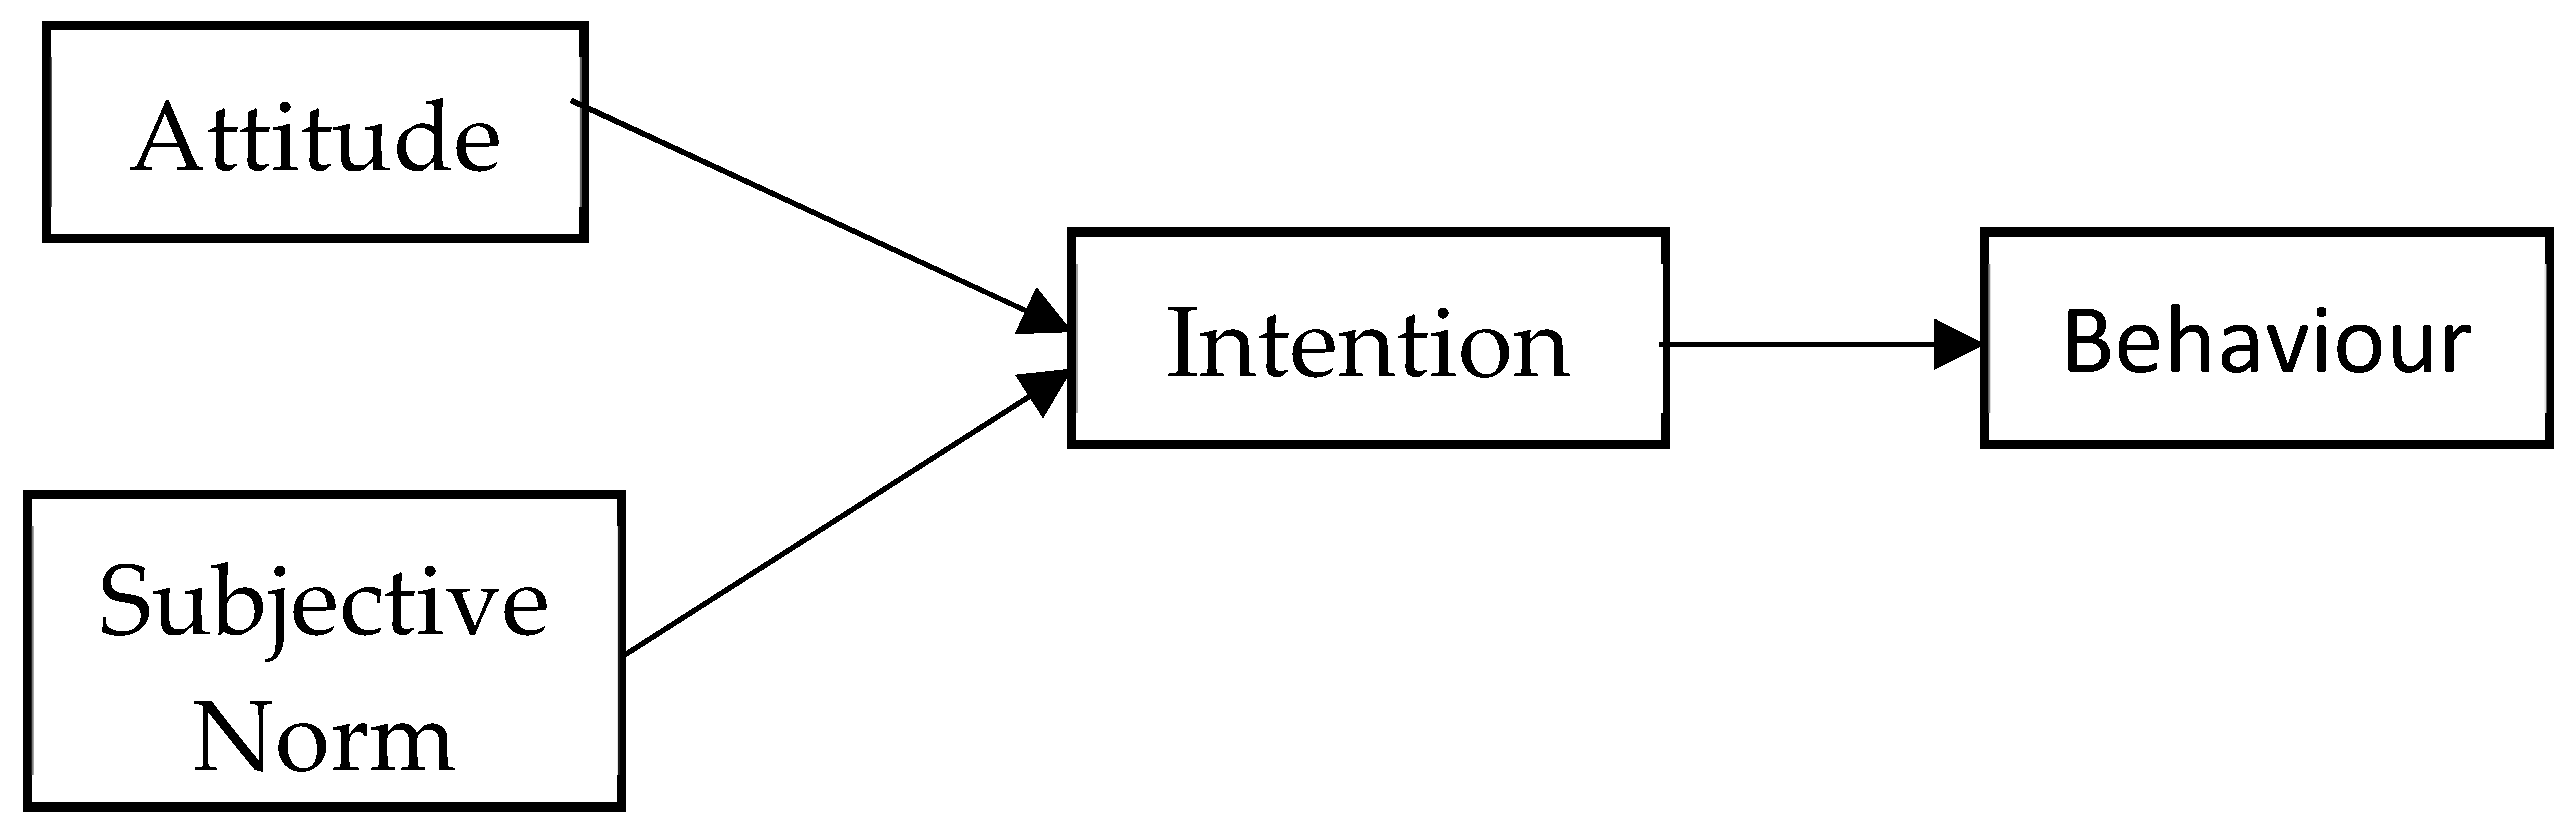
1.2. Theory of Reasoned Action (TRA)

TRA is an intention theory developed based on the research in attitude theories, persuasion models and social psychology for explaining the relationship between behavior and attitudes in a different context and athwart varied domains [32]. According to TRA, the behavioural performance of a certain task for a person is determined by the individual’s behavioural intention to exhibit specific actions. Specifically, attitude and subjective norm are the two constructs jointly influencing the behavioural intention (see Figure 1).

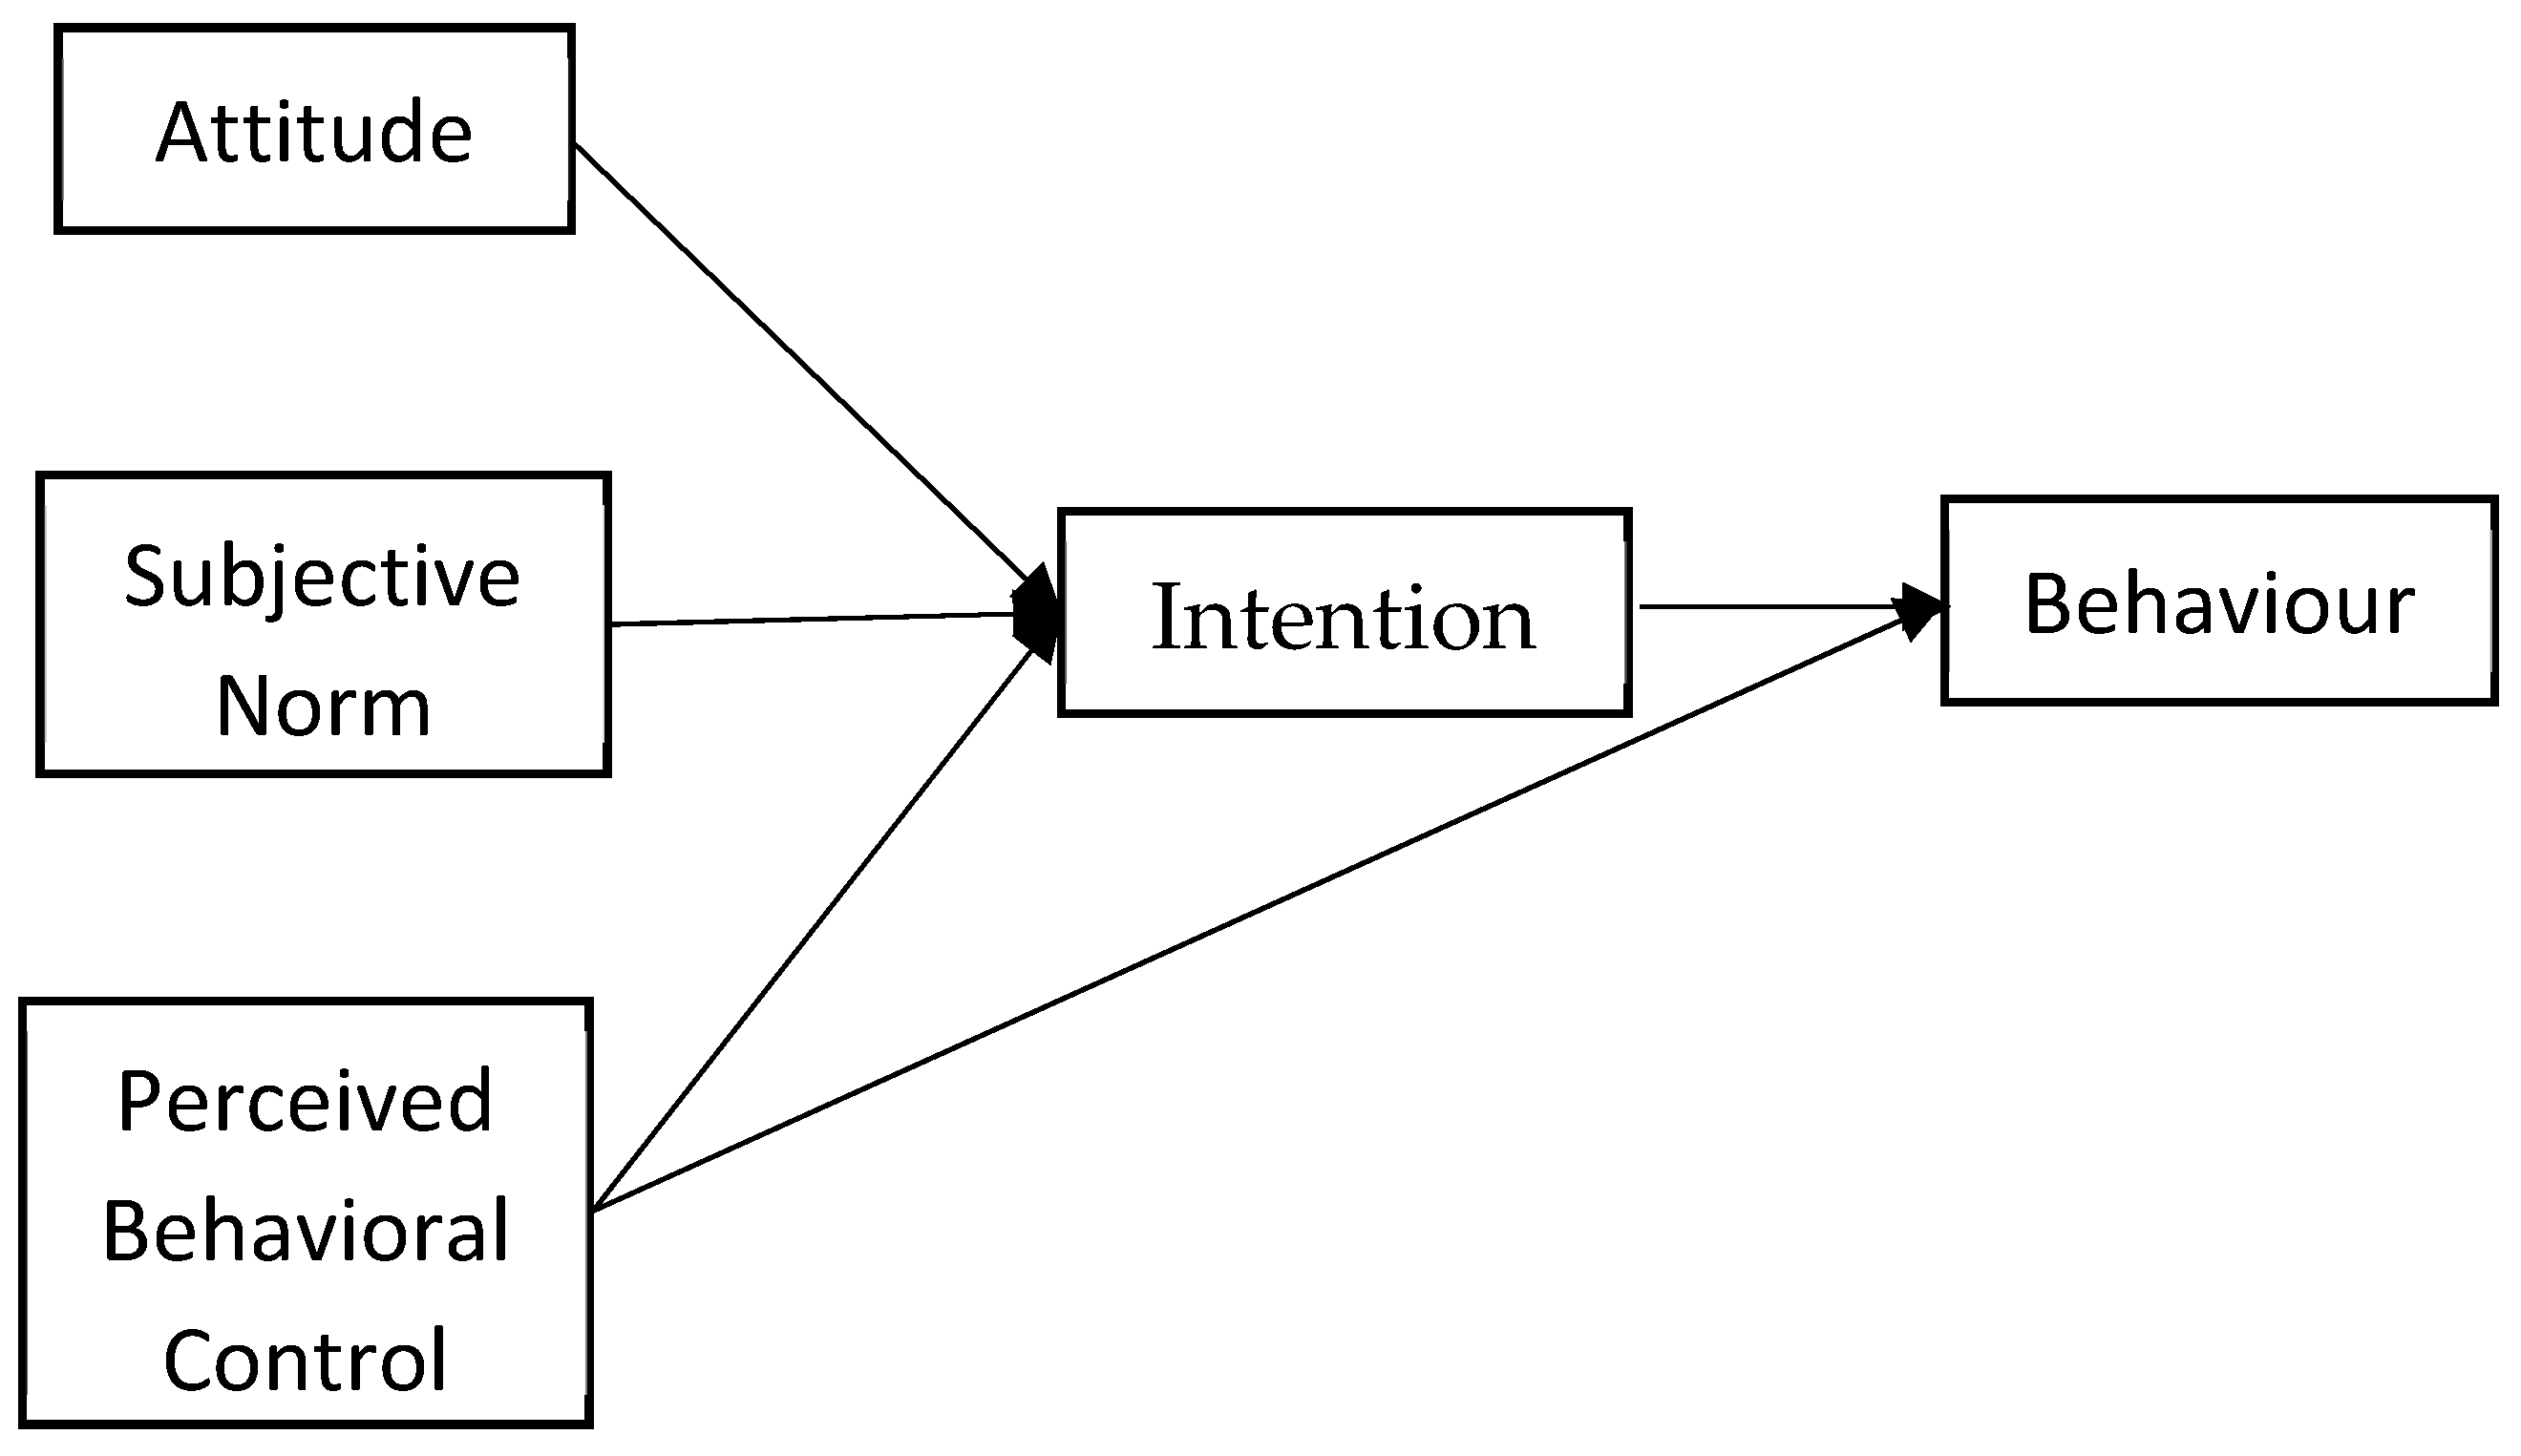
1.3. Theory of Planned Behavior (TPB)

The theory of planned behaviour (TPB) [35,38] (Figure 2) extends the theory of reasoned action (TRA) to account for conditions where individuals do not have complete control over their behaviour [35]. Perceived behavioural control (PBC) is an additional variable used in TPB to extend the TRA theory. PBC is a similar concept of Bandura’s [39,40] self-efficacy and denotes to people’s perception of his or her capability of performing certain behaviour (e.g., “doing X would be easy/difficult”). PBC is regarded as the codetermining intentions, among which attitude and subjective norm; and (under specific circumstances, at least) as codetermining behaviour, together with intention. Other studies confirmed that TPB is an important model. TPB is one of the psychological theory, which finds the link between attitude and behaviour. Many different technology adoption and usage studies have applied the TPB model [35,41,42,43] successfully. Casper [44] highlighted that following the prediction model of TPB, and many empirical studies provided conclusive results. Conclusive results also found other TPB studies such as the purchase of organic food [45,46], Halal food purchasing behaviour [47], and online purchasing behaviour [48,49,50,51] information system research [41,42,52] and genetically modified food production [53].

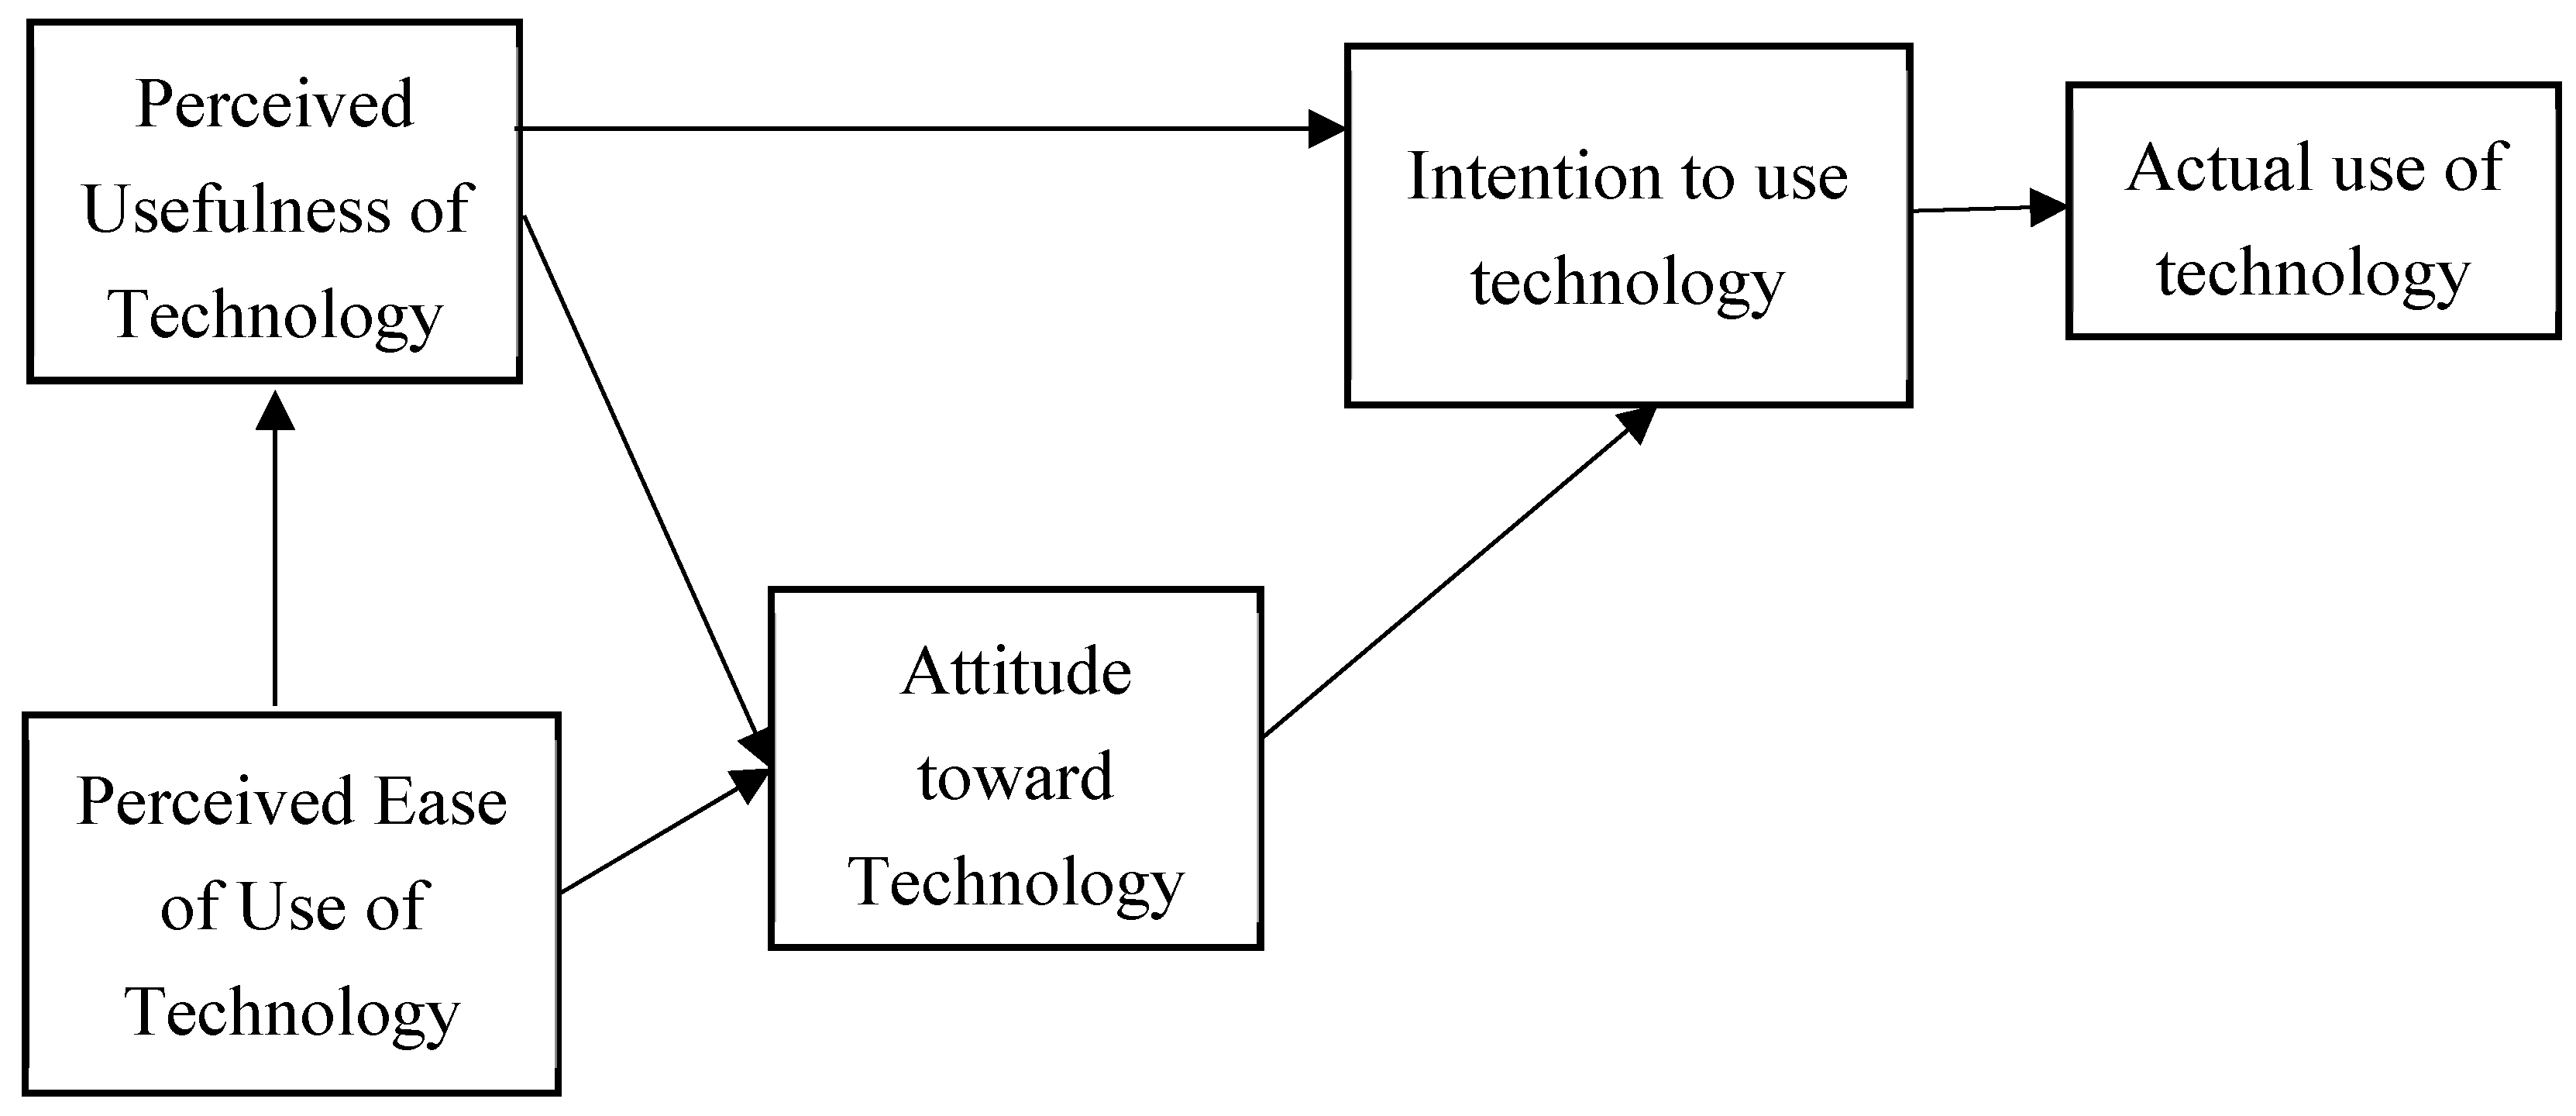
1.4. Technology Acceptance Model (TAM)

The most common model that used for new services adoption and technological research is TAM (Figure 3) [33]. TAM explains about attitudinal perspectives which are intended to use a specific service or technology. The predictors of the TAM are “perceived ease of use (PEU),” which is defined as “the degree to which a person believes that using a particular system would be free of effort,” and “perceived usefulness (PU),” which is defined as “the degree to which a person believes using a particular system would enhance his or her job performance” [55]. Another main predictor is “behavioural intention to use (BI)” [56]. Venkatesh et al. [43] highlighted that perceived usefulness is the most important predictor for technology adoption, whereas perceived ease use has a significant effect on behavioural intention, attitude, perceived usefulness and actual behaviour [31]. Other researchers such as King and He [57] opined that TAM is most widely used, a robust and valid model commonly used in technology usage research. Other scholars argued that TAM is used widely and accepted to explain the association between perception and technology use Azmi et al. [58]. The main predictors of TAM model are PU and TEOU have a significant influence on behavioural intention.

1.5. Diffusion of Innovation Theory (DOI)

Rogers developed the DOI conceptual model in 1962 [60]. Rogers defined diffusion is “the process by which innovation is communicated through certain channels over time among the members of a social system”. There are five predictors in Rogers’s model. Rogers [60,61] proposes that potential innovation adopters possess the main five perceived characteristics of innovation: complexity, Compatibility, relative advantage, observability and trialability. Definitions of all five perceived characteristics of innovation are shown in Table 1. Kendall et al. [62] agree that Rogers’s innovation diffusion characteristics are studied more frequently and are most helpful in explaining the technology adoption rate. Rogers’s [29] study results reveal that five main innovation characteristics explain the rate of adoption with the variance of 49% to 87%. Failure or successes of diffusion of innovation depend on these five major characteristics [29].

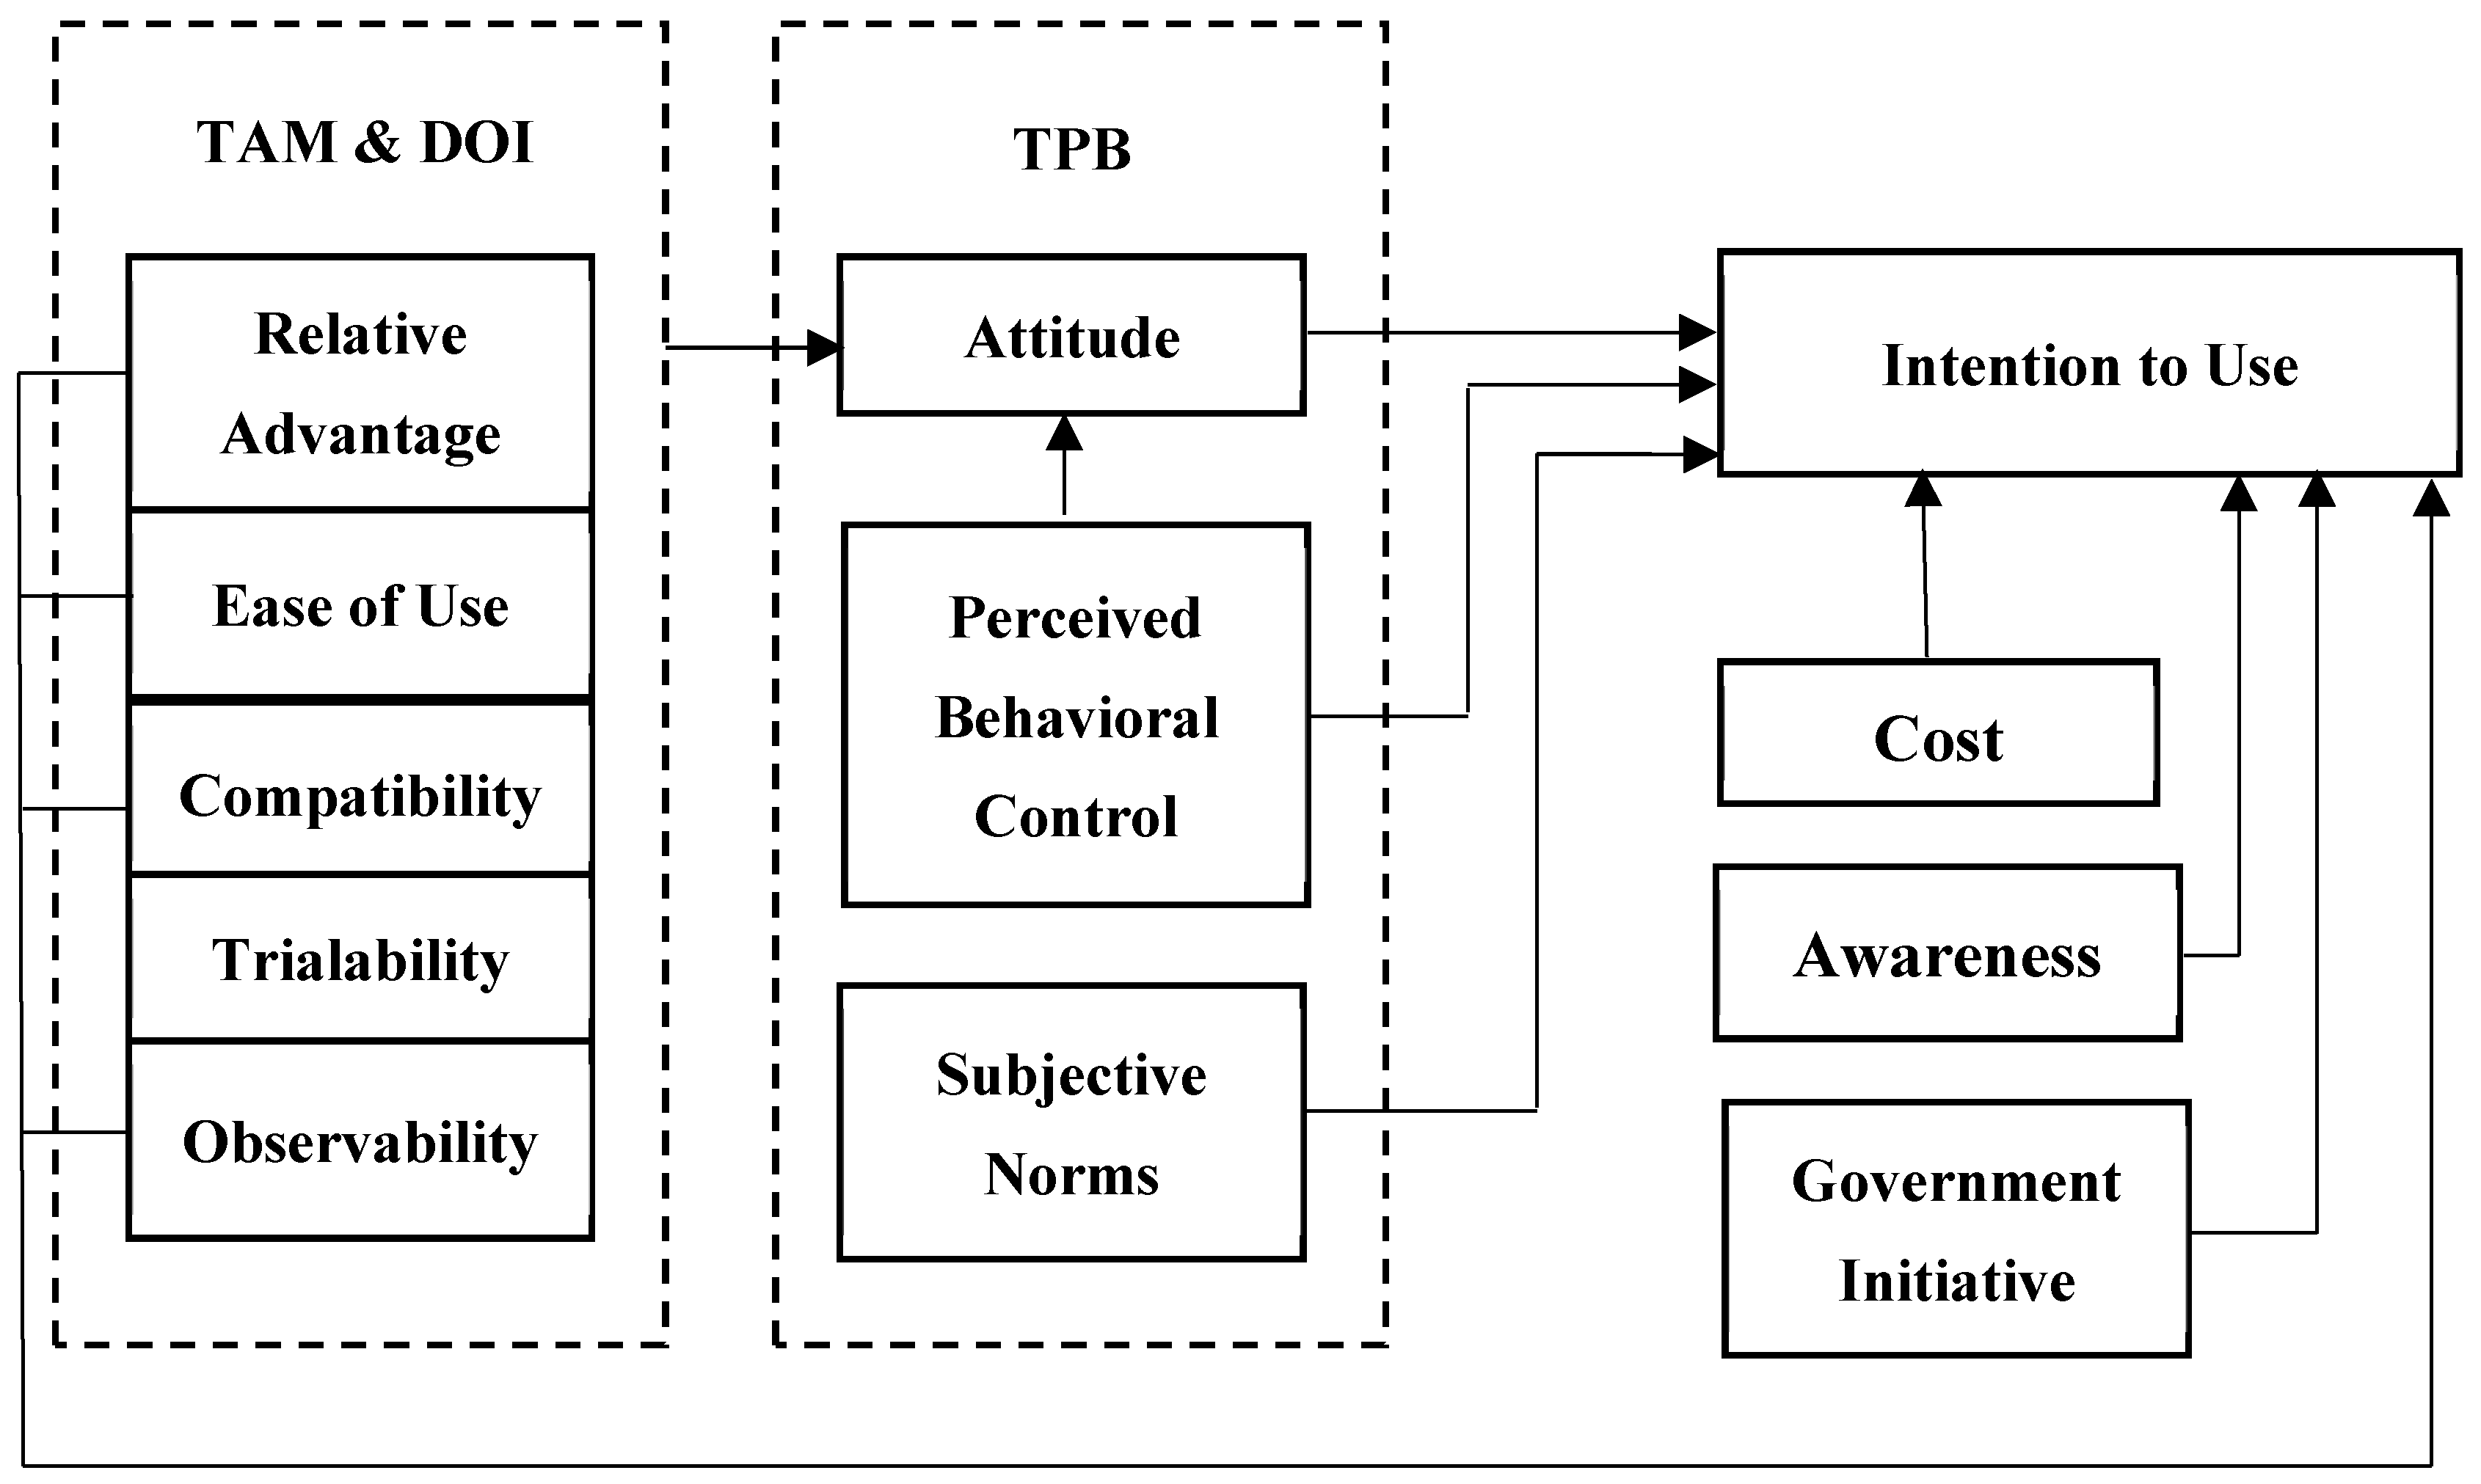
1.6. Integration of TRA, TPB, TAM and DOI Theories

Researchers find that TRA is one of the influential models in behavioural research, but several researchers have criticised this model [68,69]. One of the most important criticisms is that the TRA model is not falsifiable [68]. Although many researchers accepted it and used it in their research, it is not a good model because it is not falsifiable [70]. Another scholar highlighted its importance for the researchers refining and revising this model during the extension of choice and goals [71]. Other scholars also criticise that TRA theory neglected the impact of external factors and suggested that external factors have a significant influence on behavioural intention [72,73] therefore in this research we included some other important constructs and combine with TPB, TAM and DOI theory. Kippax and Crawford [74] further criticised that TRA has theoretical shortcomings and individualistic biased, which ignored external factors.
TAM model is derived from the TRA model, and the TPB model is the extension of the TRA model. Both TAM and TPB model is analogous and complement each other [75]. Attitude, subjective norm and perceived behavioural control from TPB predict behavioural intention whereas perceived ease of use and perceived usefulness from TAM predict attitude. The TPB is another model commonly used for technology adoption research. The main limitation of TAM is that it does not reflect the variety of user task environment and constraints. Researchers [76,77] also suggested combining TAM and TPB models.
Researchers support that TAM model is one of the very popular theory in IS adoption and usage research, but it is questionable whether this model alone can be applied to other innovation adoption contexts. However, most studies use DOI and TAM separately but to improve the explanatory power, and specificity researchers have suggested integrating these two models [30,78,79]. Similarly other researchers have also recommended combining these models to offer a solid model [80,81]. For better understanding, Sigala et al.’s [82] study also combined these two models. Thus, we integrated TRA, TPB, DOI and TAM models.
Rogers’s DOI and Davis’s TAM models are complementary. Two constructs of TAM are very similar to Rogers’s two basic constructs. Specifically, Davis’s ease of use is analogous to complexity, whereas relative advantage is similar to usefulness. Researchers argued that TAM is a subcategory of perceived innovation characteristics; thus, it is better to integrate these two models than either standing alone [81]. Chen et al. [81] and Sigala et al. [82] studies integrated these two models and provided good results.
This research integrated four major theories- TRA, TPB, TAM and DOI and three additional factors included with the combined model. After reviewing technology adoption literature, we synthesised empirical research and main theories, then suggested an integrated model that combined key constructs involved residences acceptance of PV solar technology.
In this study, we have identified and included other important determinants such as awareness, cost of technology, and government support that affect innovation technology usage intention. Cost/price is considered as one of the very key predictors affecting PV solar technology adoption. Researchers identify the initial cost for most renewable energy sources as being very high [37,83,84]. Borenstein [85] clearly explains that the installation of PV solar technology is not financially viable for most customers because of its high initial setup cost. If not for this substantial initial investment, PV is optimal in all locations. It can be argued that if a household owner finds that PV solar technology requires high installation cost, then the owner of the household will be reluctant to use PV solar technology in their residences.
Awareness also plays pivotal roles in technology adoption by consumers. Researchers emphasise that when adopting technology, “consumers must become aware of a new brand” [86]. The deficiencies of brand awareness negatively affect intention to adopt new technology [87]. Fishbein [88] suggests that in order to use new technologies, such as renewable energy sources, a household may need assistance in developing new skills and knowledge, as well as in acquiring technical support and capital. Other studies also confirmed that awareness is another important predictor affecting the latest innovation technology adoption [84,89]. Still, other studies [30,84] argue that the information gap leads to a slower rate of technology adoption. According to Cohen and Levinthal [90], implementation and introduction of innovation depend on pre-existing knowledge in which is related to intended innovation.
In PV solar technology adoption decision in developing countries, government initiatives always come up as crucial determinants [91]. Fostering adoption and promote PV solar technology government, an initiative is considered as the decision and actions required. Government initiatives, such as providing subsidies for PV solar technology installation, encourage the household owner to install PV solar technology in their premises [92]. Tax incentives are another example of government support to the PV solar technology producers and will serve to lower prices and ultimately increase demand for PV solar systems.
Five constructs (i.e., relative advantage, compatibility, ease of use, observability and trialability) taken from DOI and TAM models and three constructs (attitude, subjective norm and perceived behavioural control were taken from TRA and TPB models and additional three important constructs (cost, awareness and government support) included in this research. With appropriate modification, our integrated model could be successfully generalised in other technological innovation adoption research.

2. Research Model and Hypotheses

According to the above discussion in this study, we developed a combined model. The model was developed based on the technology acceptance theories and models, which are found in the previous literature. The theoretical framework combines the TRA, TPB, TAM, and DOI theories with cost, awareness, and government initiatives are considered as additional constructs (see Figure 4).
Previous studies on technology adoption [30,78,93,94,95,96,97,98,99] have shown that relative advantage, compatibility, ease of use, trialability, and observability positively affect technology adoption intention. The Folorunso [100] and Zolait [101] studies confirmed that compatibility, observability, and trialability have a positive and significant effect on attitude. The Karahanna et al. [102] study reveals a positive relationship between ease of use and relative advantage. Davis [33] confirms the relationship between ease of use and attitude. In this research, we are also expecting these relationships remain the same. A study by Alam and Sayuti [47] confirms a significant positive relationship between perceived behavioural control and subjective norms with behavioural intention. Cloete et al. [103] emphasise that attitude is a motivational factor that is dependent on an individual’s level of knowledge of the behaviour and application of the technology to perform that behaviour.
Several studies have considered cost factor and found to have a significant direct negative relationship between technology adoption and cost [104]. Petera, Dickieb and Peter [90] show that government initiatives have a significant positive relationship with PV solar technology adoption intent. Alam et al. [98] confirm a significant positive relationship between awareness and technology innovation adoption.
Based on the discussion above, we test the validity and applicability of the proposed model for PV solar technology usage intention using the following hypotheses (Table 2).

3. Research Methods

This is an empirical study which examines the intention to use PV solar technology in households. To fulfil the objective, a cross-sectional study method was used in collecting primary data at a single time. The survey covered the urban households of Klang Valley in Malaysia, as urban people have better affordability to avail PV technology compared to the village areas. The sample frame of the study was the household who did not use the PV solar technology to get insights from the prospective users’ perspectives. For selecting respondents and infer the population, the study adopted a purposive sampling method. The survey employed a questionnaire interview with the help of structured questionnaires written in the Malay language. We distributed 500 questionnaires to household owners and returned 391 completed questionnaires, giving us a response rate of 78.2%. A total of nine questionnaires were discarded for incomplete responses, leaving us a total of 382 completed questionnaires. We used for eleven independent constructs or predictors, the suggested sample size was 178 (f2 = 0.15 for effect size, α = 0.05 for error type 1 and ß = 0.20 for error type 2). To minimize potential problems from a limited sample size, 382 respondents were considered for the study, which seemed to be sufficient. Based on the established guideline by Hair et al. [105] in this study, we use multiple regression techniques to analyse collected data. The objective of using regression analysis is to relate a set of independent variables to a dependent variable [106] and determine the capability of every independent variable to explain our dependent variable. Multiple regression analysis is used instead of other techniques, as this model is widely accepted in many other studies concerning technology adoption [107,108].Table 3 shows the respondents profile. More than 70% of respondents were Malay, and 59.68% had 3–5 rooms at their residence. A majority of the respondents (92.15%) own a house while others are tenants. On average, 33% of the residences monthly used less than 500 Kilowatts of electricity. Almost 87% of the residents claimed that they used electricity in a range of 0–3000 KW.
The questions that measure perceived ease of use, relative advantage, awareness, cost, perceived behavioural control, compatibility, trialability, observability, and intent to use are adopted from Alam et al. [97,98]. Items that measure attitude and subjective norms are adopted from Alam and Sayuti [47]. Government initiatives are assessed using measures reported by Petera et al. [91]. All items are modified to measure PV solar technology adoption intention. In this research, a 6-point Likert scale (1 = strongly disagree to 6 = strongly agree) is used to gather information. The Likert scale is appropriate for use when the research needs to measure respondents’ attitudes toward constructs [109].

4. Results

Non-Response Bias and Common Method Bias

Based on the recommendation by the Kolmogorov-Smirnov (K-S) test was executed to examine the non-response bias. To test the non-response bias, we compared 50 early responses that received immediately with another 50 responses that were received after the follow-up. Significant differences are not found in this K-S test. Thus, we can conclude that non-response bias is not the issue here. In this study, common bias methods were used because the same respondents responded to the dependent and independent variables. First, all independent variables were subjected to factor analysis and tested in a single factor. The first factor accounted for 37.4% of the variance in the variables which below than 50%. From the factor analysis, more than one single factor appeared and the majority of the variance is not accounted for one general factor, this confirmed no evidence of the presence of common method bias.

5. Reliability

Table 4 shows the Cronbach’s alpha value that is used to test the reliability obtained for this research, according to Moore and Benbasat [31]. Based on the sample, the reliability value is the reasonable level which is considered higher than the value α > 0.70.

Factor Analysis: Test for Construct Validity

Exploratory factor analysis was conducted on all independent variables to establish validity. Eleven factors are found from the factor analysis results following the eigenvalue criteria, which is greater than 1.0 suggested by Hair et al. [105]. About 62.60% of the variance is explained by the eleven factors identified here. Principal axis factoring and the varimax rotation method were used in this test. According to Alexander and Colgate [110], this method is commonly used by other researchers. The Kaiser-Meyer-Olkin (KMO) [111] method was also checked, and the value (0.86) is greater than the recommended 0.5 level, and Bartlett’s test of sphericity is significant. Hence, this dataset is suitable for factor analysis. The Bartlett’s test of sphericity indicates that there is a satisfactory correlation found among all the selected variables (X2(288) = 18.89, p < 0.01) (Table 5).

6. Testing the Underlying Assumptions for Multiple Regression

Normality of Data and Multicollinearity

The central limit theorem is applied because of the relatively big sample size (382 respondents). Therefore, data is considered normal with any question. When interpreting regression analysis multicollinearity is considered based on the suggestions [105]. Highly collinear variables cannot be generalised because it substantially. The researcher argued that Pearson’s r should be more than 0.80 and if any independent variable exceeds 0.80 exhibits multicollinearity [112]. In this research, multicollinearity is not the issue as all independent variables Pearson r value less than 0.80. Variance inflation factor (VIF) and tolerance are also the other two measures used to test multicollinearity in this research (Table 6). VIF value should not be more than 10, and the tolerance value should be less/ equal to 1.10 [105]. In this current research, we found that the tolerance value of all independent variables is more than 0.10 and VIF less than 10. Thus, we can conclude that these independent variables do not reach the levels indicating multicollinearity.

7. Independence of Residuals and Outlier Analysis

The Durbin-Watson values for the two regression models are 2.212 and 2.037, respectively. Moreover, the values are equal to or higher than 2; the values do not violate the independence of residual assumption. The value of Cook’s distance and centered leverage are within an acceptable range. Values are within the acceptable range. Therefore, we can conclude that the regression model is not influenced by outliers and in this study, measures chosen for assessing independent constructs and found no existence of multicollinearity.

8. Hypotheses Testing

In Table 7, we have shown the multiple regression analysis results, which are shown the strength of the hypothetical relationship. Eleven hypotheses were formulated, and after filtering with reliability, all variables are retained. According to Hair et al. [105], we have tested the hypothetical model using multiple regression using household intention to use PV solar technology as the main dependent variable and attitude as a secondary dependent variable in this research. The results obtained, which are shown in Table 7, reveal that H1a, H1b, H2a, H2b, H3a, H4a, H4b, H5a, H5b, H6a, H6b, H7, H8, H10 and H11 are found to have a significant effect in the prediction model. H2a, H3b and H9 test the effects of the compatibility, ease of use and cost, which are not supported by this test.
An integrated model of behavioural intention to use PV solar technology usage is tested in this research. This model combines the technology acceptance model (TAM), the diffusion of innovation theory (DOI) and the theory of planned behaviour (TPB). In this study, intention to use PV solar technology is jointly predicted by relative advantage (t = 5.563; p < 0.01), compatibility (t = 2.352; p < 0.05), perceived ease of use (t = 2.002; p < 0.05), trialability (t = 3.107; p < 0.01), observability (t = 4.551; p < 0.01), perceived behavioural control (t = 2.370; p < 0.05), attitude (t = 1.981; p < 0.05), subjective norms (t = 5.922; p < 0.01), government initiatives (t = 2.417; p < 0.05), and awareness (t = 4.199; p < 0.01). The integrated model explains a large proportion (54%) of the variance in PV solar technology adoption among household in Malaysia. These results show that H1a, H2a, H3a, H4a, H5a, H6a, H7a, H8, H10 and H11 are well supported. Cost (t = 1.440; p < 0.151) is not significant.
Attitude is predicted by relative advantage (t = 3.920; p < 0.01), trialability (t = 5.925; p < 0.01), observability (t = 4.677; p < 0.01), and perceived behavioural control (t = 1.989; p < 0.05). Together, these variables explain 49.3% of the total variance. These results validate hypotheses H1b, H2b, H4b, H5b, and H7b. Compatibility (t = 1.619; p < 0.107) and perceived ease of use (t = 1.440; p < 0.151) do not have a significant effect on attitude towards PV solar technology usage.

9. Discussion of the Findings

The overall results confirm that intention to use PV solar technology can be predicted by Rogers’s [29] diffusion of innovation theory. Studies such as Alam et al. [8,97] and Tan and Teo [94] have shown a positive and strong effect of relative advantage on innovation adoption. This result of relative advantage (β = 0.370; p < 0.01) confirms earlier findings. The positive and strongly significant relationship proves that the higher the advantages, the higher the level of PV solar technology adoption intention among households.
The support of H2 (compatibility) is in line with Alam et al. [97,98] and Tan and Teo [94]. The regression results show that compatibility (β = 0.151; p < 0.05) is another important predictor of PV solar technology adoption. Therefore, this study again proves the earlier study showing that those who feel that using PV solar technology is compatible with their culture are more motivated to adopt such services. The implication is that before using PV solar technology at the residences, firstly they evaluate whether PV solar technology meet their daily electricity usage or not. If they perceived that PV solar technology meets their needs and usable for their electric consumption, then they were likely to adopt it in their residences.
A significant positive association found between perceived ease of use and PV solar technology usage intention. This relationship is significant (β = 0.135; p < 0.05). This result confirms a wide range of previous research results [98]. The argument is that ease of use is a mental barrier to understand and maintain before purchase, particularly for the unfamiliar and less skilled individuals. The residents will use PV solar technology when they find the technology is easy to use. The suppliers and manufacturers of solar technology should ensure user-friendly and simple solar product to the customer.
The support for H4a (trialability) and H5a (observability) is in line with the results of Tran [113]. Research outcomes show that there is a strong significant and positive association between trialability (β = 0.183; p < 0.01) and observability (β = 0.284; p < 0.01) about PV solar technology adoption intention. The main reason behind is that if there is a chance to try the PV solar technology before actual usage, and it works satisfactorily, then residents are eager to accept PV solar technology. On the other hand, the possibility to observe the benefits of PV solar technology would have a significant effect on usage intention.
Hypotheses H6, H7b and H8 confirm the results of previous behavioural researchers [45,48,49], which show that positive and significant association with behavioural intention. These results suggest that attitude (β = 0.227; p < 0.05) and perceived behavioural control (β = 0.169; p < 0.05) have a moderate effect on PV solar technology usage intention, whereas subjective norms (β = 0.307; p < 0.01) indicate that it has a significant and strong effect on PV solar technology usage intention among households in Malaysia. This study matches the findings of previous studies that subjective norms are important in influencing consumer purchase intention [47]. According to this research result, nowadays, some people influence other people to adopt this technology by providing moral support. The residents confirmed that some of their family and friends suggested them to adopt PV solar technology at their premises. Even the demonstration effect comes into action purchasing a new system if this system will enhance their social pride.
Surprisingly, this study results reveal that cost (H9) has a positive relationship; this relationship is not significant (β = 0.072; p < 0.151). One possible reason is that it is easy for Malaysians to get financial support from some agencies that are promoting green issues in Malaysia. In Malaysia, it is also easy to get a loan from the bank adopt this green initiative. The Malaysian government is providing tax exemptions and allowances to those who are interested in using green technology. These conditions can lead to the perceived cost of PV solar technology usage intention among household being viewed as unimportant.
The support of H10 (awareness) is consistent with the studies by Alam et al. [8,97] and Ahmad et al. [99]. The regression results show that awareness β = 0.330 (ρ = 0.001) is the strongest predictor of PV solar technology adoption intention. As PV solar technology is a very new technology, this is expected, as past literature shows that awareness is one of the most significant and positive predictors of PV solar technology adoption intention [84]. Environmental Awareness brings a regular shift in an individual’s buying habit towards pro-environmental. If the government and other relative stakeholders create awareness by advertising and or other promotional strategies, then the possibility of using this PV solar technology would be higher.
Earlier research suggested that the role of government initiatives is indeed positive and significantly correlated with PV solar technology adoption intention [91]. The present study results that agree with that as a significant positive relationship is found between government initiatives and PV solar technology usage intention in residences with β = 0.175 (ρ = 0.05). The support for hypothesis 11 reflects that as the government in Malaysia adopts more initiatives, consumers’ intention to adopt PV solar technology will increase. To reduce pollution and support to the higher demand for energy, the government of Malaysia has taken the initiative to use PV solar energy. The government has reassured to hold these initiatives in a more sustainable way. Now, the Malaysian government is also installing solar panels not only in the commercial buildings but also on factory buildings to magnify the benefits and carry forward sustainable development.

10. Policy Implication

This study validates the integration model in the PV solar energy usage context and provides further understanding into possible perceptions regarding the use of PV solar technology of owners of the households. The contribution of this research to PV solar technology acceptance is discussed. Based on the study result, we propose that the combination of the TPB, TABM and DOI model can offer better overall results.
There are immense knowledge and information gaps about households’ ability to use PV technology sources as well as educating stakeholders on PV technology. The Malaysian energy commission must take steps to launch an information campaign to educate businesses and the public about PV solar technology usage and the government must consider investing money to develop the bountiful PV solar energy available in the country into viable energy for industrial, commercial and domestic use. Supporting decision-makers, it is important for the government of Malaysia is to create an information hub through a quantitative survey in whole Malaysia on existing customers and respective users of PV solar technology (household surveys). Close cooperation is needed with all local stakeholders such as Tenaga National Berhad (TNB), Special Commission on Renewable Energy (SCORE) and other local stakeholders involved in promoting PV solar technology adoption in Malaysia. These stakeholders should create some awareness programs for the whole of Malaysia through a special campaign such as providing financial incentives, long-term financial support and training program to households. Bonus or award can be given to the residences those already have PV solar technology in their premises. It can be stated that to increase the possibility of PV solar technology usage for households, the government has to enforce a uniform, consistent and standardised policies in all areas and stakeholders involving the deployment of PV solar technology usage. More distribution channels (wholesaler, retailer) have to involve making available PV solar-based panels or other materials in all over the nation.

11. Conclusions

The objective of the study is to identify what factors affecting households PV solar technology usage intention. This study integrated TRA, TPB, TAM and DOI theory and additional three constructs cost, government initiative and awareness were included with the model. The study results show that relative advantage, compatibility, perceived ease of use, trialability, observability, perceived behavioural control, attitude, subjective norms, government initiatives, and awareness have a significant effect on the intention to use PV solar technology. Cost is found as the irrelevant to predict intention to use PV solar technology in Malaysia. Moreover, the study results further confirmed that attitude towards the use of PV solar technology can be predicted by relative advantage, trialability, observability, and perceived behavioural control. However, the outcome of the study indicates that compatibility and perceived ease of use do not have a significant effect on attitude towards PV solar technology usage.
This study results further establish a higher level of explanatory power for the integration model. In addition, the research result enhances our understanding about adoption intention of PV solar technology as a source of renewable energy for household use. Renewable energy is the clean, efficient energy that shapes the role of social and economic transformations, and its services synchronize the three pillars—socio-economic-environmental. The nexus between these three aspects of household life ensures sustainability. Government initiatives to diffuse solar technology through megaprojects requires time and efforts, but household awareness and their active participation can expedite the whole transformation into prompt and convenient towards the zero-carbon economy and sustainable development goal (SDG).

12. Limitation and Future Direction

There are certain limitations identified in this research. Although the findings of this study provided meaningful insight for the use of PV solar technology in residence contexts, the researchers collected data from willing respondents therfore bias may exist in the sample frame. To overcome this limitation, future researchers could study to test our proposed model using a random sampling method. Another limitation is related to our sample size. Our sample is relatively small compared to the total number of households in Malaysia. It suggested using more diversified respondents with larger sample size.
Furthermore, this research was cross-sectional, not longitudinal. Thus, it was unclear whether the individuals’ expectation influenced the PV solar technology usage and acceptance behaviours over, Ref. [43] highlighted that if the individuals’ gain experience their perception may change. Therefore, it is suggested to conduct a longitudinal study to validate our findings and proposed an integrated model.
Current research has integrated TRA, TPB, TAM and DOI theory and additionally, three other variables were considered for this empirical research. Future researchers need to add some control variables such as gender, age of the owner for further clarify the factors included here. It would be good for future researchers if they test competing models used previously in technology adoption researches separately. Moreover, the structural equation model could be used to test interrelationships between factors. The preliminary study will nevertheless be helpful for policymakers and the need to implement PV solar technology usage in households in the whole of Malaysia.

Author Contributions

Conceptualization, S.S.A., M.A. and A.S.O.; methodology, S.S.A.; software, M.M.; validation, S.S.A., Z.B.H.S. and M.M.; resources, M.A.; writing—original draft preparation, S.S.A., M.A., M.M. and A.S.O.; writing—review and editing, S.S.A., M.M. and M.A.; project administration, S.S.A.; funding acquisition, M.A. All authors have read and agreed to the published version of the manuscript.

Funding

The APC was funded by Yayasan Universiti Teknologi PETRONAS grant no. 015LC0-254.

Conflicts of Interest

The authors declare no conflict of interest. The funders had no role in the design of the study; in the collection, analyses, or interpretation of data; in the writing of the manuscript, or in the decision to publish the results.

References

  1. Nageler, P.; Koch, A.; Mauthner, F.; Leusbrock, I.; Mach, T.; Hochenauer, C.; Heimrath, R. Comparison of dynamic urban building energy models (UBEM): Sigmoid energy signature and physical modelling approach. Energy Build. 2018, 179, 333–343. [Google Scholar] [CrossRef]
  2. Wu, J.; Zhang, X.; Shen, J.; Wu, Y.; Connelly, K.; Yang, T.; Tang, L.; Xiao, M.; Wei, Y.; Jiang, K.; et al. A review of thermal absorbers and their integration methods for the combined solar photovoltaic/thermal (PV/T) modules. Renew. Sustain. Energy Rev. 2017, 75, 839–854. [Google Scholar] [CrossRef]
  3. Cáceres, M.; Vera, L.H.; Firman, A.D.; Busso, A. Stand alone photovoltaic management system for ICTs devices. In Proceedings of the 2018 IEEE PES Transmission & Distribution Conference and Exhibition-Latin America (T&D-LA), Lima, Peru, 1–5 September 2018. [Google Scholar]
  4. Jaafar, Z.M.; Kheng, W.H.; Kamaruddin, N. Greener energy solutions for a sustainable future: Issues and challenges for Malaysia. Energy Policy 2002, 31, 1061–1072. [Google Scholar] [CrossRef]
  5. Ali, R.; Daut, I.; Taib, S. A review on existing and future energy sources for electrical power generation in Malaysia. Renew. Sustain. Energy Rev. 2012, 16, 4047–4055. [Google Scholar] [CrossRef]
  6. Oh, T.H.; Pang, S.Y.; Chua, S.C. Energy policy and alternative energy in Malaysia: Issues and challenges for sustainable growth. Renew. Sustain. Energy Rev. 2010, 14, 1241–1252. [Google Scholar] [CrossRef]
  7. Toke, D.; Breukers, S.; Wolsink, M. Wind power deployment outcomes: How can we account for the differences? Renew. Sustain. Energy Rev. 2008, 12, 1129–1147. [Google Scholar] [CrossRef]
  8. Alam, S.S.; Hashim, N.H.N.; Rashid, M.; Omar, N.A.; Ahsan, N.; Ismail, M.D. Small-scale households renewable energy usage intention: Theoretical development and empirical settings. Renew. Energy 2014, 68, 255–263. [Google Scholar] [CrossRef]
  9. Crago, C.L.; Chernyakhovskiy, I. Residential solar photovoltaic technology adoption: An empirical investigation of state policy effectiveness. In Proceedings of the Agricultural & Applied Economics Association’s 2014 AAEA Annual Meeting, Minneapolis, MN, USA, 27–29 July 2014. [Google Scholar]
  10. Graziano, M.; Gollingham, K. Spatial patterns of solar photovoltaic system adoption: The influence of neighbors and the built environment. J. Econ. Geogr. 2015. [Google Scholar] [CrossRef]
  11. Hoen, B.; Wiser, R.; Cappers, P.; Thayer, M. An Analysis of the Effects of Residential Photovoltaic Energy System on Home Sales Prices in California; Ernet Orlando Lawrence Berkeley National Laboratory: Berkeley, CA, USA, 2011; 52p, LBNL-2829E. [Google Scholar]
  12. Lobel, R.; Perakis, G. Consumer Choice Model for Forecasting Demand and Designing Incentives for Solar Technology. MIT Sloan Research Paper No. 4872-11. Available online: https://papers.ssrn.com/sol3/papers.cfm?abstract_id=1748424 (accessed on 28 February 2019).
  13. Hughes, J.E.; Podolefsky, M. Getting green with solar subsidies: Evidence from the California solar initiative. J. Assoc. Env. Res. Econ. 2015, 2, 235–275. [Google Scholar] [CrossRef] [Green Version]
  14. Sulaiman, J.; Azman, A.; Saboori, B. Development of solar energy in Sabah Malaysia: The case of Trudgill’s perception. I. J. Sustain. Energy Env. Res. 2014, 3, 90–99. [Google Scholar]
  15. Bäckström, K.R.; Lundmark, R.; Söderholm, P. Public policies and solar PV innovation: An empirical study based on patent data. In Proceedings of the IAEE International Conference: Energy & the Economy, New York, NY, USA, 15–18 June 2014. [Google Scholar]
  16. Adachi, C.; Rowlands, I.H. The role of policies in supporting the diffusion of solar photovoltaic systems: Experiences with Ontario, Canada’s renewable energy standard offer program. Sustainability 2010, 2, 30–47. [Google Scholar] [CrossRef] [Green Version]
  17. Mann, W. Solar renewable energy certificate markets: Assessing the volatility impact. 2014. Available online: https://openscholarship.wustl.edu/wushta_spr2014/73/ (accessed on 11 December 2020).
  18. Hirth, L. The market value of solar power: Is photovoltaics cost-competitive? IET Renew. Power Gener. 2014, 9, 37–45. [Google Scholar] [CrossRef]
  19. Huo, M.; Zhang, X.; He, J. Causality relationship between the photovoltaic market and its manufacturing in China, Germany, the US, and Japan. Front. Energy 2010, 51, 43–48. [Google Scholar] [CrossRef]
  20. Renewable Energy World.com. US Solar Industry Continues Rapid Growth. 2014. Available online: http://www.renewableenergyworld.com/rea/blog/post/2014/09/u-s-solar-industry-continues-rapid-growth (accessed on 12 February 2018).
  21. Vorrath, S. One-quarter of Australian Homes Now have Solar. Available online: https://reneweconomy.com.au/one-quarter-of-australian-homes-now-have-solar-70886/ (accessed on 30 November 2018).
  22. International Trade Administration (ITA). United Arab Emirates—Renewable Energy. Available online: https://www.export.gov/article?id=United-Arab-Emirates-Renewable-Energy (accessed on 30 November 2018).
  23. Borhanazad, H.; Mekhilef, S.; Saidur, R.; Boroumandjazi, G. Potential application of renewable energy for rural electrification in Malaysia. Renew. Energy 2013, 59, 210–219. [Google Scholar] [CrossRef]
  24. Kabir, E.; Kumar, P.; Kumar, S.; Adelodun, A.A.; Kim, K.H. Solar energy: Potential and future prospects. Renew. Sustain. Energy Rev. 2018, 82, 894–900. [Google Scholar] [CrossRef]
  25. Spanos, Y.E.; Prastacos, G.P.; Poulymenakou, A. The relationship between information and communication technologies adoption and management. Inf. Manag. 2002, 39, 659–675. [Google Scholar] [CrossRef]
  26. Dewan, S.; Kraemer, K.L. Information technology and productivity: Preliminary evidence from country-level data. Manag. Sci. 2000, 46, 548–562. [Google Scholar] [CrossRef] [Green Version]
  27. Davis, S. The Diffusion of Process Innovations; Cambridge University Press: Cambridge, UK, 1979. [Google Scholar]
  28. Plouffe, C.R.; Hulland, J.S.; Vandenbosch, M. Richness versus parsimony in modeling technology adoption decisions-understanding merchant adoption of a smart car-based payment system. Inf. Syst. Res. 2001, 12, 208–222. [Google Scholar] [CrossRef]
  29. Rogers, E.M. The Diffusion of Innovations; Free Press: New York, NY, USA, 1995. [Google Scholar]
  30. Agarwal, R.; Prasad, J. The role of innovation characteristics and perceived voluntariness in the acceptance of information technologies. Dec. Sci. 1997, 28, 557–582. [Google Scholar] [CrossRef]
  31. Moore, G.C.; Benbasat, I. Development of an instrument to measure the perceptions of adopting information technology innovation. Inf. Syst. Res. 1991, 2, 173–191. [Google Scholar] [CrossRef] [Green Version]
  32. Ajzen, I.; Fishbein, M. Understanding Attitudes and Predicting Social Behavior; Prentice-Hall: Englewood Cliffs, NJ, USA, 1980. [Google Scholar]
  33. Davis, F.D. Perceived usefulness, perceived ease of use, and user acceptance of information technology. MIS Q. 1989, 13, 319–339. [Google Scholar] [CrossRef] [Green Version]
  34. Davis, F.D.; Bagozzi, R.P.; Warshaw, P.R. User acceptance of computer technology: A comparison of two theoretical models. Manag. Sci. 1989, 35, 982–1003. [Google Scholar] [CrossRef] [Green Version]
  35. Ajzen, I. The theory of planned behaviour. Org. Behav. Hum. Dec. Proc. 1991, 50, 179–211. [Google Scholar] [CrossRef]
  36. Alam, S.S. Adoption of internet in Malaysian SMEs. J. Small Bus. Enterp. Dev. 2009, 16, 240–255. [Google Scholar] [CrossRef]
  37. Newell, R.G.; Jaffe, A.B.; Stavins, R.B. The effects of economic and policy incentives on carbon mitigation technologies. Energy Econ. 2006, 28, 563–578. [Google Scholar] [CrossRef]
  38. Ajzen, I. From intentions to actions: A theory of planned behavior. In Action Control: From Cognition to Behavior; Kuhl, J., Beckmann, J., Eds.; Springe: Berlin, Germany, 1985; pp. 11–39. [Google Scholar]
  39. Bandura, A. Self-efficacy: Toward a unifying theory of behavioral change. Psyc. Rev. 1977, 84, 191–215. [Google Scholar] [CrossRef]
  40. Bandura, A. Self-Efficacy: The Exercise of Control; Freeman: New York, NY, USA, 1997. [Google Scholar]
  41. Harrison, D.A.; Mykytyn, P.P., Jr.; Riemenschneider, C.K. Executive decisions about adoptin of information technology in small business: Theory and empirical tests. Inf. Syst. Res. 1997, 82, 171–195. [Google Scholar] [CrossRef]
  42. Mathieson, K. Predicting user intentions: Comparing the technology acceptance model with the theory of planned behavior. Inf. Syst. Res. 1991, 2, 173–191. [Google Scholar] [CrossRef]
  43. Venkatesh, V.; Morris, M.G.; Davis, G.B.; Davis, F.D. User Acceptance of Information Technology: Toward a Unified View. MIS Q. 2003, 27, 425–478. [Google Scholar] [CrossRef] [Green Version]
  44. Casper, E.S. The theory of planned behavior applied to continuing education for mental health professionals. Psyc. Serv. 2007, 58, 1324–1329. [Google Scholar] [CrossRef]
  45. Anssi, T.; Sanna, S. Subjective norms, attitudes and intentions of Finnish consumers in buying organic food. Br. Food J. 2005, 107, 808–822. [Google Scholar]
  46. Maria, K.M.; Anne, M.; Hustri, U.K. Attitude towards organic food among Swedish consumers. Br. Food J. 2001, 103, 209–226. [Google Scholar]
  47. Alam, S.S.; Sayuti, N.M. Applying theory of planned behavior (TPB) in halal food purchasing. Int. J. Commer. Manag. 2011, 21, 8–20. [Google Scholar]
  48. Joey, F.G. The theory of planned behavior and internet purchasing. Internet. Res. 2004, 14, 198–212. [Google Scholar]
  49. Battarcherjee, A. Individual Trust in Online Firms: Scale Development and Initial Trust. J. Manag. Inf. Syst. 2002, 19, 211–241. [Google Scholar]
  50. Jarvenpaa, S.L.; Todd, P.A. Consumer reactions to electronic shopping on the World Wide Web. Int. J. Elect. Commer. 1997, 1, 59–88. [Google Scholar] [CrossRef]
  51. Suh, B.; Han, I. The impact of customer trust and perception of security control on the acceptance of electronic commerce. Int. J. Elect. Commer. 2003, 7, 135–161. [Google Scholar]
  52. Taylor, S.; Todd, P. Decomposition and crossover effects in the Theory of Planned Behavior: A study of consumer adoption intentions. Int. J. Res. Mark. 1995, 12, 137–156. [Google Scholar] [CrossRef]
  53. Sparks, P.; Shepherd, R.; Frewer, L.J. Assessing and structuring attitudes towards the use of gene technology in food production: The role of ethical obligation. Basic App. Soc. Psychol. 1995, 16, 67–285. [Google Scholar] [CrossRef]
  54. Ajzen, I. TPB diagram. The theory of planned behavior. 2000. Available online: http://people.umass.edu/aizen/tpb.diag.html (accessed on 11 December 2020).
  55. Van der Heijden, H.; Verhagen, T. Online store image: Conceptual foundations and empirical measurement. Inf. Manag. 2004, 41, 947–959. [Google Scholar] [CrossRef]
  56. Legris, P.; Ingham, J.; Collerette, P. Why do people use information technology? A critical review of the technology acceptance model. Inf. Manag. 2003, 40, 191–204. [Google Scholar] [CrossRef]
  57. King, W.R.; He, J. A meta-analysis of the technology acceptance model. Inf. Manag. 2006, 43, 740–755. [Google Scholar] [CrossRef]
  58. Azmi, A.C.; Bee, N.L. The Acceptance of the e-Filing System by Malaysian Taxpayers: A Simplified Model. Elect. J. E-Gov. 2010, 8, 13–22. [Google Scholar]
  59. Davis, F.D. A Technology Acceptance Model for Empirically Testing New End-User Information Systems: Theory and Results. Ph.D. Dissertation, Massachusetts Institute of Technology, Cambridge, MA, USA, 1985. [Google Scholar]
  60. Rogers, E.M. Diffusion of Innovations, 5th ed.; Free Press: New York, NY, USA, 2003. [Google Scholar]
  61. Rogers, E.M. The Diffusion of Innovations; Free Press: New York, NY, USA, 1983. [Google Scholar]
  62. Kendall, J.; Tung, L.L.; Chua, K.H.; Ng, C.H.D.; Tan, S.M. Electronic Commerce Adoption by SMEs in Singapore. In Proceedings of the 34th Hawaii International Conference on System Sciences, Washington, DC, USA, 6 January 2001; pp. 1–10. [Google Scholar]
  63. Tolba, A.H.; Mourad, M. Individual and cultural factors affecting diffusion of innovation. J. Int. Bus. Cult. Stud. 2011, 5, 1–16. [Google Scholar]
  64. Bulte, C. New product diffusion acceleration: Measurement and analysis. Mark. Sci. 2000, 19, 366–380. [Google Scholar] [CrossRef] [Green Version]
  65. Takada, H.; Jain, D. Cross-national analysis of diffusion of consumer durable goods in Pacific Rim countries. J. Mark. 1991, 52, 48–54. [Google Scholar] [CrossRef]
  66. Gupta, A.; Rogers, E. Internal Marketing: Integrating R&D and marketing within the organisation. J. Serv. Mark. 1991, 5, 55–68. [Google Scholar]
  67. Straub, E. Understanding technology adoption: Theory and future directions for informal learning. Rev. Educ. Res. 2009, 79, 625–649. [Google Scholar] [CrossRef] [Green Version]
  68. Smedslund, G. A pragmatic basis for judging models and theories in health psychology: The axiomatic method. J. Health Psychol. 2000, 5, 133–149. [Google Scholar] [CrossRef] [Green Version]
  69. Ogden, J. Some problems with social cognition models: A pragmatic and conceptual analysis. Health Psychol. 2003, 22, 424–428. [Google Scholar] [CrossRef] [Green Version]
  70. Trafimow, D. The Theory of Reasoned Action A Case Study of Falsification in Psychology. Theor. Psychol. 2009, 19, 501–518. [Google Scholar] [CrossRef]
  71. Sheppard, B.H.; Hartwick, J.; Warshaw, P.R. The theory of reasoned action: A meta-analysis of past research with recommendations for modifications and future research. J. Cons. Res. 1988, 15, 325–343. [Google Scholar] [CrossRef]
  72. Bagozzi, R.; Baumgartner, H.; Yi, Y. State versus action orientation and the theory of reasoned action: An application to coupon usage. J. Cons. Res. 1992, 18, 505–518. [Google Scholar] [CrossRef]
  73. Shim, S.; Morris, N.J.; Morgan, G.A. Attitudes toward imported and domestic apparel among college students: The Fishbein model and external variables. Cloth. Text. Res. J. 1989, 7, 8–18. [Google Scholar] [CrossRef]
  74. Kippax, S.; Crawford, J. Flaws in the theory of reasoned action. In The Theory of Reasoned Action: Its Application to AIDS Preventive Behavior; Terry, D.J., Gallois, C., McCamish, M.M., Eds.; Pergamon Press: New York, NY, USA, 1993; pp. 253–269. [Google Scholar]
  75. Tekele, Y.; Sira, Z. Analysis of factors influencing customers’ intention to the adoption of e-banking service channels in Bahirdar City: An integration of TAM, TPB. Eur. J. Sci. Res. 2013, 9, 402–417. [Google Scholar]
  76. Hsu, M.; Chiu, C. Internet self-efficacy and electronic service acceptance. Decis. Support Syst. 2004, 38, 369–381. [Google Scholar] [CrossRef]
  77. Pavlou, P.A.; Fygenson, M. Understanding and predicting electronic commerce adoption: An extension of the theory of planned behavior. MIS Q. 2006, 30, 115–134. [Google Scholar] [CrossRef]
  78. Chong, S. An empirical study of factors influence the extent of deployment of electronic commerce for small-and medium-sized enterprises in Australia. J. Theor. Appl. Elect. Commer. Res. 2006, 1, 45–57. [Google Scholar] [CrossRef]
  79. Carter, L.; Be’langer, F. The utilisation of e-government services: Citizen trust, innovation and acceptance factors. Inf. Syst. J. 2005, 15, 5–25. [Google Scholar] [CrossRef]
  80. Wu, J.H.; Wang, S.C. What drives mobile commerce? An empirical evaluation of the revised technology acceptance model. Inf. Manag. 2005, 42, 719–729. [Google Scholar] [CrossRef]
  81. Chen, L.D.; Gillenson, M.L.; Sherrell, D.L. Enticing online consumers: An extended technology acceptance perspective. Inf. Manag. 2002, 39, 705–719. [Google Scholar] [CrossRef]
  82. Sigala, M.; Airey, D.; Jones, P.; Lockwood, A. The diffusion and application of multimedia technologies in the tourism and hospitality industries. Inf. Commer. Tech. Tour. 2000, 396–407. [Google Scholar]
  83. Anderson, K. Australia leads the way in small scale solar installs. 2012. Available online: http://www.solarguide.co.uk/australia-leads-the-way-in-small-scale-solar-installs (accessed on 11 December 2020).
  84. Zografakis, N.; Sifaki, E.; Pagalou, M.; Nikitak, G.; Psarakis, V.; Tsagarakis, K.P. Assessment of public acceptance and willingness to pay for renewable energy sources in Crete. Renew. Sustain. Energy Rev. 2011, 14, 1088–1095. [Google Scholar] [CrossRef]
  85. Borenstein, S. Electricity Rate Structures and the Economics of Solar PV: Could Mandatory Time-of-Use Rates Undermine California’s Solar Photovoltaic Subsidies? Center for the Study of Energy Market: Berkeley, CA, USA, 2007; Working Paper 172. [Google Scholar]
  86. Howard, J.; Moore, W.J. Changes in Consumer Behavior over the Product Life Cycle; Tushman, M.L., Moore, W.L., Eds.; Readings in the Management of Innovation: Boston, MA, USA, 1982; p. 128. [Google Scholar]
  87. Sathye, M. Adoption of internet banking by Australian consumers: An empirical investigation. Int. J. Bank Mark. 1999, 17, 324–334. [Google Scholar] [CrossRef]
  88. Fishbein, R.E. Survey of Productive Uses of Electricity in Rural Areas, Africa Energy Unit; World Bank: Washington, DC, USA, 2003; Available online: http://www.martinot.info/Fishbein_WB.pdf (accessed on 11 December 2020).
  89. Wüstenhagen, R.; Wolsink, M.; Bürer, M.J. Social acceptance of renewable energy innovation: An introduction to the concept. Energy Policy 2007, 35, 2683–2691. [Google Scholar] [CrossRef] [Green Version]
  90. Cohen, W.M.; Levinthal, D.A. Absorptive Capacity: A new perspective on learning and innovation. Admin. Sci. Q. 1990, 35, 128–152. [Google Scholar] [CrossRef]
  91. Petera, R.; Dickieb, L.; Peter, V.M. Adoption of photovoltaic power supply systems: A study of key determinants in India. Renew. Energy 2006, 31, 2272–2283. [Google Scholar] [CrossRef]
  92. Alam, S.S.; Nor, N.F.M.; Ahmad, M.; Hashim, N.H.N. A Survey on renewable energy development in Malaysia: Current status, problems and prospects. Environ. Clim. Technol. 2016, 17, 5–17. [Google Scholar] [CrossRef] [Green Version]
  93. Premkumar, G.; Ramamurthy, K.; Crum, M. Determinants of EDI adoption in the transportation industry. Eur. J. Inf. Syst. 1997, 6, 107–121. [Google Scholar] [CrossRef]
  94. Tan, M.; Teo, T.S.H. Factors influencing the adoption of internet banking. J. Assoc. Inf. Syst. 2000, 1, 1–44. [Google Scholar] [CrossRef] [Green Version]
  95. Scupola, A. The adoption of internet commerce by SMEs in the south of Italy: An environmental Technological and Organisational Perspective. J. Glob. Inf. Tech. Manag. 2003, 6, 52–71. [Google Scholar] [CrossRef]
  96. Carter, L.; Belanger, F. The influence of perceived characteristics of innovating on e-government adoption. Elect. J. E-Gov. 2003, 2, 11–20. [Google Scholar]
  97. Alam, S.S.; Khatibi, A.; Ismail, S.S.A.; Ismail, H. Factors affecting e-commerce adoption in the electronic manufacturing companies in Malaysia. Int. J. Commer. Manag. 2007, 17, 125–139. [Google Scholar] [CrossRef]
  98. Alam, S.S.; Ali, M.Y.; Fauzi, M.M.J. An empirical study of factors affecting electronic commerce adoption among SMEs in Malaysia. J. Bus. Econ. Manag. 2011, 12, 375–399. [Google Scholar] [CrossRef] [Green Version]
  99. Ahmad, A.; Rashid, M.; Omar, N.A.; Alam, S.S. Perceptions on renewable energy use in Malaysia: Mediating role of attitude. J. Pengur. 2014, 41, 123–131. [Google Scholar] [CrossRef]
  100. Foloruns, O.; Vincent, R.O.; Adekoya, A.F.; Ogunde, A.O. Diffusion of innovation in social networking sites among university students. Int. J. Comp. Sci. Sec. 2010, 4, 361–372. [Google Scholar]
  101. Zolait, A.H.S. UIBR—An Approach to innovations acceptance. J. Int. Bank. Commer. 2009, 14, 1–17. [Google Scholar]
  102. Karahanna, E.; Straub, D.W.; Chervany, N.L. Information technology adoption across time: A cross sectional comparison of pre adoption and post-adoption beliefs. MIS Q. 1999, 23, 183–213. [Google Scholar] [CrossRef]
  103. Cloete, E.; Courtney, S.; Fintz, J. Small business acceptance and adoption of e-commerce in the western-cape province of South Africa. EJISDC 2002, 10, 1–13. [Google Scholar]
  104. Seyal, A.H.; Rahim, M.M. A preliminary investigation of electronic data interchange adoption in Bruneian small business organisations. Elect. J. Inf. Syst. Dev. Count. 2006, 24, e21. [Google Scholar]
  105. Hair, J.F.; Anderson, R.E.; Tatham, R.L.; Black, W.C. Multivariate Data Analysis, 5th ed.; Pearson Education: Upper Saddle River, NJ, USA, 1998. [Google Scholar]
  106. Mendental, W.; Sincich, T. Second Course in Business Statistics; Dellen/Macmillian: New York, NY, USA, 1993. [Google Scholar]
  107. Alenezi, A.R.; Abdulkarim, A.; Veloo, A. An empirical investigation into the role of enjoyment, computer anxiety, computer self-efficacy and Internet experience in influencing the students’ intention to use E-learning: A case study from Saudi Arabian governmental universities, TOJET. Turk. Online J. Educ. Technol. 2010, 9, 22–34. [Google Scholar]
  108. Alireza, A.; Yap, V.C.; Saravanan, M. Preparation of Measurement Tools of the Effective Factors for the Acceptance of Online Stock Trading. Europ. J. Econ. Fin. Adm. Sci. 2010, 19, 1450–2275. [Google Scholar]
  109. Moghavvemi, S.; Salleh, N.A.M.; Zhao, W. An empirical study of IT innovation adoption among small and medium sized enterprises in klang valley Malaysia. Soc. Tech. 2011, 1, 267–282. [Google Scholar]
  110. Alexander, N.; Colgate, M. Retail financial services: Transaction to relationship marketing. Eur. J. Mark. 2000, 34, 938–953. [Google Scholar] [CrossRef]
  111. Malhotra, N.K. Marketing Research, An Applied Orientation, 3rd ed.; Prentice-Hal: Englewood Cliffs, NJ, USA, 1999. [Google Scholar]
  112. Bryman, A.; Cramer, D. Quantitative Data Analysis with SPSS Release 10 for 108 Windows; Routledge: London, UK, 2001. [Google Scholar]
  113. Tran, L.A. Diffusion of community information networks in New Zealand public libraries: A case studies. N. Lib. World 2005, 106, 269–283. [Google Scholar] [CrossRef]
Figure 1. Theory of Reasoned Action, Source: Ajzen & Fishbein [32].
Sustainability 13 01773 g001
Figure 2. Theory of planned behavior, Source: Ajzen I [54].
Sustainability 13 01773 g002
Figure 3. Technology Acceptance Model, Source: Davis [59].
Sustainability 13 01773 g003
Figure 4. Conceptual framework.
Sustainability 13 01773 g004
Table 1. Innovation Attributes Definition.
ConstructEffect on AdoptionDefinition
Relative advantageIncrease“Relative advantage refers to the uniqueness of need,
value, and financial return” [63,64,65,66,67]
CompatibilityIncrease“Compatibility refers to compliance with
customers’ existing values, past experiences, and the
needs of potential adopters” [61,66,67]
ComplexityLower“Complexity is the extent to which the product is
perceived as difficult to understand and use”
[61,66,67]
TrialabilityIncrease“Trial-ability is the extent that the product can be
Experimented” [61,66,67]
ObservabilityIncrease“Observability means the results of an innovation are
visible to others” [61,66,67]
Source: Tolba and Mourad [63].
Table 2. Hypotheses.
Name HypothesesHypothetical RelationshipConstructs
H1aThere is a positive and significant relationship between relative advantage and attitude toward PV solar technology usage in the household.Relative → AttitudeRelative Advantage
H1bThere is a positive and significant relationship between relative advantage and intention in the household.Relative → Intention
H2aCompatibility has a significant association with attitude toward PV solar technology usage in the household.Compat → AttitudeCompatibility
H2bThere is a significant relationship between compatibility and intention to use PV solar technology in the household.Compat → Intention
H3aThere is a positive and significant effect of perceived usefulness on attitude towards PV solar technology usage in households.PEOU → AttitudePerceived ease of use
H3bPerceived ease of use has a significant effect on usage intention of PV solar technology.PEOU → Intention
H4aThere is a significant positive relationship between trialability and attitude toward PV solar technology usage in the household.Trial → AttitudeTrialability
H4bTrialability has a significant positive effect on the intention to use PV solar technology among households. Trial → Intention
H5aObservability has significant positive on attitude toward PV solar technology usage in the household. Observ → AttitudeObservability
H5bObservability has a significant positive effect on the intention to use PV solar technology in the household. Observ → Intention
H6Attitude has a positive effect on the intention to use PV solar technology in the household. Attitude → IntentionAttitude
H7aPerceived behavioural control has a significant positive influence on attitude toward PV solar technology usage in the household. PBC → AttitudePerceived behavioural control
H7bPerceived behavioural control has a positive impact on the intention to use PV solar technology in the household. PBC → Intention
H8There is a significant positive relationship between subjective norm and intention to use PV solar technology in the household.SN → IntentionSubjective norm
H9The cost has a negative effect on the intention to use PV solar technology in the household.Cost → IntentionCost
H10There is a significant positive association between awareness and intention to use PV solar technology in the household.Aware → IntentionAwareness
H11Government initiatives have a positive effect on usage intention of PV solar technology in the household.Govt → IntentionGovernment initiative
Table 3. Respondent Profile.
Ethnic OriginFreq.%Establishment SizeFreq.%
Malay28273.82Below 3 Room12632.99
Chinese5213.613–5 Rooms22859.69
Indian328.385–10 Rooms277.06
Others164.1910–20 Rooms10.26
Total382100.0Total38298.0
Table 4. Reliability Analysis.
VariablesCoefficient Alpha
Relative advantage0.800
Compatibility0.717
Perceive Ease of Use0.842
Trialability0.782
Observability0.949
Attitude0.731
Perceived Behavioural Control0.805
Subjective Norm0.794
Cost0.868
Government initiative0.876
Awareness0.763
Behavioural Intention0.912
Table 5. Factor analysis and reliability.
Determinant FactorsFactor
Loading
Cronbach
α
Relative Advantage 0.800
Better environmental performance is possible through PV solar technology usage0.561
Higher economic benefits are possible through PV solar technology usage0.683
PV solar technology will reduce our electricity bill0.623
Ease of Use 0.842
Using PV solar technology easier for us0.725
Learning PV solar technology is easy.0.801
Ease for me to become skilful at using PV solar technology0.612
Compatibility 0.717
PV solar technology is compatible with our culture0.731
PV solar technology is compatible with our value0.765
I think using PV solar technology will increase my image0.692
Trialability 0.842
I want to use PV solar technology at my residence on a trial basis0.784
I know where I can go to try out PV solar technology usage satisfactorily0.762
Observability 0.903
Looking at the results of those who PV solar technology electricity generation will help us to decide if we should go into it as well0.821
I have enough confidence to use PV solar technology will enhance the desired returns in terms of energy cost0.792
Attitude 0.731
I like the idea of using PV solar technology0.623
I think that buying PV solar technology is a good idea0.734
I have a favourable attitude toward using PV solar technology0.67
Perceived Behavioral Control 0.805
I will use PV solar technology even if PV solar technology is relatively expensive0.713
I will use PV solar technology even my friends advise me not to use0.615
Using PV solar technology is entirely within my control0.764
I have resources, knowledge and ability to use PV solar technology0.672
Subjective Norm 0.794
People who influence my behaviour would think that I should use PV solar technology0.688
My close friends think that I should use PV solar technology0.627
Most of the people who are important to me think I should use 0.632
PV solar technology
Adoption Cost 0.864
Initial set up cost is very high0.725
Need to spend money for training purposes0.798
Cost and benefits cannot justify0.663
Government Initiatives 0.874
Government offers financial support for implementing PV solar technology0.621
The government provides training opportunities to adopt PV solar technology0.721
The government gives technical support for adopting PV solar technology0.523
Awareness 0.763
I can recall what PV solar technology is0.692
I am aware of PV solar technology0.689
I can recognise the PV solar technology easily0.751
Easy to imagine PV solar technology0.769
Intention to use PV solar technology 0.924
I intend to adopt PV solar technology0.878
I intend to use PV solar technology regularly in future0.863
I would highly recommend PV solar technology for other people to use0.895
Table 6. Collinearity test.
VariablesToleranceVIF
Behavioural Intention DV
Relative advantage0.3792.639
Compatibility0.4082.450
Perceive Ease of Use0.3672.724
Trialability0.4812.081
Observability0.4302.325
Attitude0.1277.875
Perceived Behavioural Control0.3283.044
Subjective Norm0.6231.605
Cost0.6621.510
Government initiative0.3203.126
Awareness0.1596.274
Attitude DV
Relative advantage0.4542.203
Compatibility0.4872.053
Perceive Ease of Use0.3952.533
Trialability0.5751.739
Observability0.5181.930
Perceived Behavioural Control0.4132.419
Table 7. Regression Results.
VariablesBetat-Valuep-Value
Behavioural Intention (Dependent Variable)
(constant) 4.5510.000
Relative advantage0.3705.5630.000
Compatibility0.1512.3520.019
Perceive Ease of Use0.1352.0020.046
Trialability0.1833.1070.002
Observability0.2844.5510.000
Perceived Behavioural Control0.1692.3700.018
Attitude0.2271.9810.049
Subjective Norm0.3075.9220.000
Cost0.0721.4400.151
Awareness0.3304.1990.000
Government initiative0.1752.4170.016
R20.540
Attitude (Dependent Variable)
(constant) 3.5780.000
Relative advantage0.2473.9200.000
Compatibility0.0981.6190.107
Perceive Ease of Use0.0971.4400.151
Trialability0.3325.9250.000
Observability0.2764.6770.000
Perceived Behavioural Control0.1311.9890.048
R20.493
Publisher’s Note: MDPI stays neutral with regard to jurisdictional claims in published maps and institutional affiliations.

