Abstract
In the recent 10 years, China’s housing prices and land prices have risen rapidly, resulting in precious land resources, thus restricting the development of the cities. How to effectively measure urban land-use efficiency and how to optimize it has become a stumbling block on the road of sustainable development in China. This article focuses on the vital province in southwest China—Sichuan Province, which is facing the problem of insufficient land-use efficiency and uses the data of 32 cities from 2003 to 2018 to carry out the research. Based on the measurement results of urban land-use efficiency in Sichuan Province and its temporal and spatial evolution characteristics, this paper uses the SDM model to verify that the land-use efficiency can be optimized from the three aspects of innovation, industrial structure, and economic connections. The conclusion shows: (1) There is a weak decoupling relationship between urban land use and economic development in Sichuan Province. The urban land-use efficiency has the characteristics of polarization of more than two ends and less in the middle, but the gap is gradually reduced; (2) Time series level, urban land-use efficiency in various regions is increasing, and potential benchmark technology progress is the main reason for the increase; (3) At the spatial distribution level, urban land-use efficiency has spatial autocorrelation, forming an obvious “center-periphery” distribution pattern; (4) Innovation, economic connection, and industrial structure optimization can promote the improvement of land-use efficiency, and economic connection has a positive spillover effect on the land-use efficiency of surrounding areas. Accordingly, this study puts forward some targeted suggestions on improving urban land-use efficiency in Sichuan Province.
1. Introduction
In recent years, there has been a rapid urbanization trend around the world [1]. Urbanization has become an essential engine for the economic development of developing countries. Simultaneously, economic development has also fed back the expansion and growth of cities [2,3]. According to United Nations estimates, by 2050, about 70% of the world’s population will live in cities, and cities will become the primary carrier of human life in the future [4]. In keeping with the times, China has vigorously promoted the process of urbanization and achieved remarkable achievements. At the beginning of reform and opening-up, China’s urbanization rate was only 17.90%, and by 2017 it reached 58.52%, which is about 2.5% higher than the global average. The annual growth rate of 1.04% is also far ahead, and this trend has not faded, still showing strong growth potential [5,6].
With the continuous advancement of urbanization, urban construction land, which is a fundamental element of urban development, is also increasing [7]. As of 2014, the urban construction land of China has reached 49,882.7 km2 [8]. The rapid growth of urban construction land usually comes at the expense of agricultural land and environmental land, which has caused new problems, such as the decline of ecological quality, land degradation, the increasingly prominent contradiction between human and land, and the decline of the overall benefit level of urban land use [9]. However, land-related income (land finance, etc.) accounts for a large part of government revenue. Under the pressure of regional competition and economic performance, for local governments, economic policies or administrative methods, which are used to convert agricultural land and ecological land into urban construction land, still have great appeal [10]. The massive loss of agricultural land and ecological land has seriously threatened China’s food security and ecological stability. Based on this, as early as the early 1990s, China has begun to improve land-use management, mainly by protecting cultivated land resources and limiting the growth of built-up areas [11].
The control of built-up areas also brings a new set of problems. Due to the monopoly of local governments over land ownership, when the central government reduces the allocation of land for construction, it will further stimulate local governments to raise land prices by virtue of their monopoly of land ownership and obtain high land revenues, which will be transmitted to the real estate market, thus pushing up property prices, increasing people’s cost of living and partially restricting the inflow of labor [12]. Simultaneously, local governments have been competing with each other in attracting investment, resulting in the over-expansion of industrial land and its inefficient use [13]. The dual effect of this has resulted in extremely inefficient land use, which has constrained the sustainable development of cities [14]. Besides, the current land allocation system restricts the trading targets of construction land so that cities with high land-use efficiency cannot obtain more construction land, thus increasing the gap in land-use efficiency between cities and affecting the coordinated development of the region [15].
The problem of inefficient land use is particularly acute in Sichuan province. Although Sichuan Province is located in western China, most of its territory is covered by mountains and hills, and land resources are scarce and economic development is relatively backward. In order to support the economic development of western China, the central government has given Sichuan province more land targets for construction [16]. This policy has boosted Sichuan’s economic development to a certain extent, but the urban land-use efficiency is still lower than the average in China. As shown in Figure 1, the proportion of urban construction land in Sichuan province is generally higher than the proportion of GDP in second and tertiary industry and the proportion of the urban population, indicating that Sichuan province is at a lower level, both at the level of population gathering capacity and at the level of economic development. Also, there is a significant difference in the land-use efficiency between cities in Sichuan Province. As a critical intersection of the national strategy The Belt and Road and Yangtze River Economic Belt, the low land-use efficiency in Sichuan Province will seriously restrict its social and economic development and urbanization process. It will also hinder the national The Belt and Road strategic layout. At present, there is no quantitative standard for the specific development status of land-use efficiency in each city in Sichuan Province, and it is impossible to compare the development status of each city horizontally and vertically. In contrast, the main factors affecting land-use efficiency in Sichuan Province have not yet been clarified. The answers to these questions will help the government formulate better land management policies, strengthen the intensive use of land in Sichuan Province, promote social and economic development and facilitate the smooth implementation of The Belt and Road strategy.
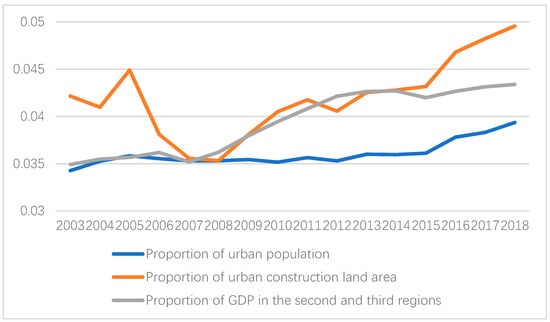
Figure 1.
The relationship between the GDP of secondary industry and tertiary industry and construction land, population.
In order to answer the above questions, based on the statistical data of Sichuan Province from 2003 to 2018, this paper first analyzed the relationship between changes in urban land use and changes in the GDP of the secondary and tertiary industry in 32 regions of Sichuan Province using the Tapio decoupling model. Subsequently, each region’s urban land-use efficiency was measured by using the super-efficient Slack Based Model with the area of urban construction land, the number of employees in the secondary and tertiary industry, and fixed asset investment as input indicators and their corresponding GDPs as output indicators. Thirdly, this paper studies the time series evolution law of urban land use-efficiency in each city according to the Malmquist index and discusses the spatial distribution pattern of urban land-use efficiency using the spatial autocorrelation model. Finally, the Spatial Dubin Model (SDM) is used to analyze the main factors improving the urban land-use efficiency to provide a reference for improving urban land-use efficiency, optimizing the spatial governance of land resources, and promoting the sustainable development of land.
The rest of this paper is structured as follows: Section 2, a review of previous literature, is presented; Section 3, a detailed description of the data and methods used for this study is given; Section 4, the results of the empirical analysis are given; Section 5 goes on to discuss the results and future research; Section 6, conclusions are drawn and policy recommendations are made.
2. Literature Review
Currently, researchers still take different views on the measurement of land-use efficiency. Louw and Huang et al. used the unit land output to measure urban land-use efficiency [17,18]. More researchers consider urban land-use efficiency as the efficiency of inputs and outputs, including land factors, which involve the input and output of multiple factors. There are three main methods to measure urban land-use efficiency: indicator estimation method, parametric method, and non-parametric method. The indicator estimation method usually represents urban land-use efficiency by constructing an evaluation system of indicators. Depending on the perspective of the selected indicators, the variability of land-use efficiency can be significant [19,20]; the parametric method is based on a production function with a random error term added to the production equation, and the efficiency value is estimated through regression, but it is difficult to determine the exact form of the distribution of the error [21]; the non-parametric method is also known as data envelopment analysis (DEA). Charnes et al. point out that DEA uses an optimal method that endogenously determines the weights of various input factors, which not only does not require specific expressions for the input-output relationship and excludes many subjective factors but also has the advantage of being independent of market prices, making it ideal for efficiency evaluation of complex systems [22]. Therefore, DEA and its derivative models have become the primary method for studying urban land-use efficiency [23,24]. In this paper, concerning existing studies, we consider land-use efficiency as the ratio of the combination of input factors, including land factors, to the combination of output factors under certain social and natural conditions, that is, the pursuit of obtaining the maximum output combined with the minimum combination of input factors.
Land-use efficiency is closely related to the sustainability of the city [25]. Liu argued that the urbanization process has an important impact on the rural environment and that improving urban land-use efficiency will contribute to sustainable land use [26]. The influence of urban land-use efficiency is multifaceted. Yu et al. used 12 urban agglomerations in China to verify the main drivers of land-use efficiency in terms of economic level, economic structure, and government regulation [1]. Lu et al. used 14 years of data from 285 cities in China and found that economic development, urbanization level, and industrial structure had different degrees of influence on urban land-use efficiency [27]. In their study of the Yangtze River Economic Zone, Dong et al. found that urban land-use efficiency and industrial transformation showed synergistic effects of interactive growth [28]. Taken together, the influencing factors of urban land-use efficiency have different characteristics according to different research scales and regional characteristics.
Nowadays, urban land-use efficiency in China is studied at an increasingly diverse object and scale, with different types of cities [24,29,30] and typical provinces and regions [31] being addressed. Furthermore, most of the studies are based on specific regions, such as Beijing-Tianjin-Hebei Urban Agglomeration [32], Wuhan urban agglomeration [23], Shandong Peninsula urban agglomeration [33], Yangtze River Delta urban agglomeration [34], etc. In addition, the Geographic Information System (GIS), remote sensing technology, and space measurement technology [35,36,37], combined with K-means clustering [1], spatial correlation model [38], kernel density estimation [8], and other methods are used to analyze the distribution characteristics and evolution law of urban land-use efficiency.
To sum up, in terms of research regions, it mainly focuses on coastal areas and the more economically developed central-eastern region, with little research on the relatively backward western region. The research mainly focuses on the prefecture-level city scale, with few county-level cities included in the current study, which also affects the judgment on the distribution characteristics of urban land-use efficiency. Besides, the influencing factors of urban land-use efficiency have distinctive regional characteristics, and the research in other regions has less reference value for Sichuan Province. This paper hopes to make up for these shortcomings by studying urban land-use efficiency in the Sichuan Province, enriching the literature on urban land-use efficiency, and making suggestions for land management in Sichuan Province.
3. Data and Methodology
3.1. Research Area and Data
3.1.1. Research Area
Sichuan Province is located in Southwest China, which is between 97°21′–108°12′ E and 26°03′–34°19′ N. It is adjacent to Chongqing in the east, Yunnan and Guizhou in the south, Tibet in the west, Shaanxi, Gansu and Qinghai in the north (see Figure 2). As of the end of 2018, Sichuan Province has 18 prefecture-level cities, 3 autonomous prefectures, 54 municipal districts, 17 county-level cities, and 112 counties, and has gathered 56 ethnic groups, with a resident population of 83.41 million [39]. The total land area of Sichuan Province is about 486,000 km2, accounting for 5.1% of China’s total land area, ranking fifth in the country, but due to the large population, the land area per capita is lower than the national average. The western Sichuan Province is covered by plateaus and mountains, with altitudes mostly above 3000 m; the eastern is covered by basins and hills, with altitudes mostly between 500 and 2000 m, and nearly 85% of the province’s land is covered by mountains and hills, making available land resources extremely scarce [39].
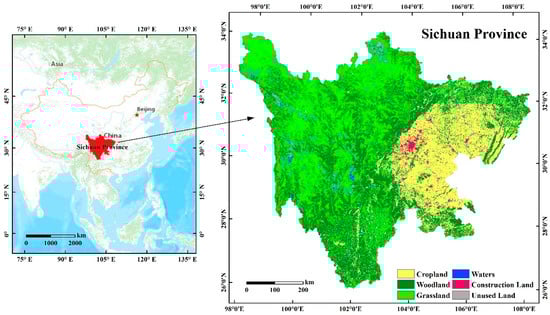
Figure 2.
The location of the research area.
In recent years, the social economy of Sichuan Province has developed rapidly. From 2003 to 2018, the GDP increased from 533.31 billion yuan to 4067.7 billion yuan, an annual growth rate of 14.5%, GDP per capita grew from RMB 6418 to RMB 48,883, an increase of nearly 6.6 times. Moreover, the population urbanization rate increased from 30.1% to 52.3%. People’s living standards have achieved tremendous progress. Between 2003 and 2018, the annual per capita disposable income of urban residents increased from RMB 7042 to 33,216, increasing 3.72 times; the annual per capita disposable income of rural residents increased from RMB 2230 to 13,331, an increase of nearly five times. At the same time, the scale of the city continues to expand. In 2003, the urban construction land was only 1221.22 km2, and by 2018 it reached 2744.2 km2. The rapid urban expansion merged a large number of environmental and agricultural lands, and the scarce available land resources gradually begin to restrict urban development, and the inefficient use of urban land has also exacerbated the land use contradiction [40]. Therefore, exploring the evolutionary law and spatial distribution of urban land-use efficiency in Sichuan Province is of great significance to improve its land-use efficiency and promote the rapid development of the city.
3.1.2. Data
Sustainable urban development involves the sustainability of factor inputs. Given the enormous lack of data on resource and environmental factors and pollutants at the urban level, we attempt to study urban land-use efficiency through economic sustainability from an economic perspective.
According to economic growth theory, human capital and physical capital are the main elements of economic development. Generally, researchers do not include the land factor, but in China, the land has become a core economic activity element. In order to fully reflect the connotation of urban land-use efficiency and to emphasize the role of the land factor, we have included land, capital, and labor together as input factors and selected GDP of the secondary and tertiary industry as economic outputs. From the output perspective, higher land-use efficiency means that the same combination of input factors will produce a more splendid combination of outputs, and the marginal rewards of factor inputs are higher. Therefore, when land-use efficiency is high in regional cities, the higher marginal rewards of factors will continue to attract more factor inputs, thus contributing to the sustainable development of the urban economy. In addition, economic output is divided into the secondary and tertiary industry for the following reasons: firstly, the tertiary industry has a more vigorous economic agglomeration compared to the secondary industry, and the more significant the proportion of the tertiary industry, the more developed the area is; secondly, the negative impact of the tertiary industry on the environment is usually much lower than that of the secondary industry, which is more conducive to sustainable urban development. In this case, we selected the secondary sector and the tertiary sector as economic output. We assumed no primary industry in built-up areas, rather than no secondary or tertiary industry in non-built-up areas. However, since the secondary and tertiary industries are mainly concentrated in urban areas, this small error is statistically acceptable, although there is a metric error.
In this study, the total social fixed asset investment is taken as urban capital input, the area of urban construction land as urban land input, and the number of employees in secondary and tertiary industries as an urban labor input. The indicators are explained as follows.
Urban construction land refers to the area of urban land, other than water and other lands, namely residential land, land for public facilities, industrial land, storage land, land for external transportation, land for roads and squares, land for municipal utilities, green areas, and special land. Data from China Urban Statistical Yearbook.
The number of employees in secondary and tertiary industries refers to the population working in the secondary and tertiary industries. Data from the Sichuan Statistical Yearbook.
Total investment in fixed assets is a general term for the amount of work involved in constructing and acquiring fixed assets in a given period and the costs associated with it, expressed in monetary terms. It is a comprehensive indicator reflecting the scale, structure, and development rate of fixed-asset investment. Data comes from the Sichuan Statistical Yearbook.
For factors affecting urban land-use efficiency, technological innovation is the primary driver of economic growth [41], which we express in terms of the number of patents granted (utility models), data from the State Patent Office. Current studies have shown that upgrading industrial structure can significantly promote economic growth and improve urban land use-efficiency [28], which we express in terms of the ratio of the total output value of the tertiary industry to GDP, data sourced from the Sichuan Provincial Statistical Yearbook. Economic linkages can promote information exchange and economic interaction between cities, strengthening the mutual imitation, learning, and competition effects of regions, thus promoting the economic development of neighboring cities [42], as calculated by Gao et al. [23].
To circumvent the effects of price fluctuations, we converted all economic variables to constant prices in 2003. Specific information on all variables is shown in Table 1.

Table 1.
Summary statistics for the 32 cities of the Sichuan Province (2003–2018).
3.2. Methodology
3.2.1. Tapio Eecoupling Model
The Tapio decoupling index helps us analyze that when one variable increases (decreases), the other variable increases (decreases) or decreases (increases); It can also compare that when the two variables increase (decrease) at the same time, this variable increases (decreases) faster or slower than the other variable, and is not affected by the change of statistical dimension [43]. This paper uses the Tapio decoupling model to analyze the decoupled state between the urban land area and the GDP of secondary and tertiary industries. According to this method, the calculation of the decoupled elastic index is shown in Formula (1):
where represents the decoupled elasticity between the urban land area and the GDP of secondary and tertiary industries. represents the change of urban land area during the period and represents the urban land area in the base year. represents the change of GDP of the second and third industries during the period and represents the GDP of the second and third industries in the base year.
3.2.2. Super-Efficiency SBM Model
In 1978, Charnes et al. [44] first proposed the DEA model, which is a non-parameter evaluation method to determine the relative efficiency level of each decision-making unit (compare the relative efficiency of each decision-making unit and the best decision-making unit) by comparing the deviation degree of a group of decision-making units and their production front by mathematical planning. It can effectively measure the efficiency of the decision-making unit (DUM) (comprehensive technical efficiency) and identify pure technical efficiency and scale efficiency. It is widely used in efficiency evaluation in various fields because it does not require prior knowledge of production function, only needs to use real data (no hypothetical production function or efficiency value), and can combine multiple inputs with multiple [45].
Although traditional DEA models (such as the CCR model and BCC model) have many advantages, they have the problem of “congestion” or “relaxation” of input factors. Therefore, tone added slacks to the objective function and proposed a non-radial and non-angle model (Slacks-Based Measure (SBM) model) based on the measure of relaxation variables [46]. Unlike the traditional DEA model, which seeks to maximize the benefit ratio, the SBM model seeks to maximize the actual profit. Even so, when multiple decision-making units (the efficiency value of multiple decision-making units is 1) are encountered, the SBM model and the traditional DEA model cannot distinguish them. In order to solve this problem, tone combined the super-efficiency model with the SBM model, constructed the super-efficiency SBM model, and realized the comparison and ranking of these decision-making units with full efficiency. The calculation is as follows [47]:
where, represents urban land-use efficiency, and the higher the value , the higher the efficiency; represents the elements in the input matrix; represents the elements in the output matrix; represents the number of DUM; represents the number of input elements; represents the number of output elements; represents the weight vector. Referring to the research of Li et al., we classify the efficiency values according to Table 2 [48].
Table 2.
Classification of urban land-use efficiency.
3.2.3. Malmquist Index
Sten Malmquist first proposed the concept of “scaling factor” when analyzing consumption changes in 1953. The scaling factor ratio was used to construct the consumption quantity index, which became the original Malmquist index [49]. Later, Caves et al. applied this idea to production analysis in 1982, constructed the production efficiency index by the ratio of distance function, and named it as Malmquist productivity efficiency index [50]. However, since there is no method to measure the distance function, this index is only a theoretical index. With the development of the DEA model, Färe et al. combined the Malmquist productivity index with the DEA model to change the Malmquist index from a theoretical index to an empirical index, and further decomposed the Malmquist index into technical efficiency changes, technological progress, and scale efficiency changes [51,52]. This also overcomes the shortcoming that the DEA model can only compare the static efficiency of cross-section data and cannot compare the efficiency level across time. The construction is as follows:
Define as technology in period t. The Malmquist index based on the output perspective is shown in Formula (3):
where and represent the input and output vectors of period t + 1 and period t, respectively; represents the distance function of the period t.
Similarly, define as technology in period t + 1. The Malmquist index based on the output perspective is shown in (4):
where represents the distance function of the period t + 1.
In order to avoid possible differences caused by the randomness of the period selection, the geometric average of Formulas (2) and (3), which measures the change of productivity from period t to period t + 1, can measure the Malmquist index [50]. The detailed formula is shown in (5):
When the value is greater than 1, it indicates that the total factor productivity is increasing from period t to period t + 1, that is, the level of comprehensive productivity increases; otherwise, it indicates that total factor productivity is decreasing.
Most of the studies used the trichotomy of Färe et al. to decompose the Malmquist index. Zofio further decomposes the technology change index (TC) into pure technology change and scale technology change based on Färe [53]. Here, we only list the formula’s short form:
PEC represents pure technical efficiency change, which, when greater than 1, represents the improvement of technical application level, improving resource allocation efficiency. Otherwise, it represents the technical step back; it represents scale efficiency change, which, when greater than 1, represents the improvement of reasonable allocation of input and output elements and the scale optimization. Otherwise, it represents the deterioration; PTC represents pure technology change, which, when greater than 1, represents the potential benchmark technical progress. Otherwise, it represents the step back; generation STC represents scale technology change, which, when greater than 1, indicates the increase of scale effect of technology changes. Otherwise, it indicates the decreasing effect of technology scale. Figure 3 shows the structure of the decomposition.
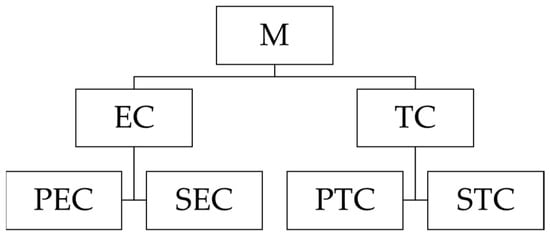
Figure 3.
Malmquist index decomposition.
3.2.4. Spatial Autocorrelation Analysis
Global Spatial Autocorrelation
Global spatial autocorrelation describes the spatial characteristics of the whole region with attribute values and reflects the dependence of attribute values on the whole space. Generally, Moran’s I is used to judge the spatial agglomeration degree of attribute values [54,55]. Its calculation is shown in Formula (7):
where is the number of research areas; and represents the efficiency value of the area i and j; is the spatial weight matrix, which is based on the distance; is the variance of the efficiency value; is the average of the efficiency value. The range of Moran’s I is . , indicates that there is a positive spatial correlation, the attribute data tends to be aggregated; , indicates that there is no spatial correlation, the attribute data is randomly distributed; , indicates that there is a negative spatial correlation, the attribute data is in a discrete distribution state.
Local Spatial Autocorrelation
The global Moran’s I, which reflects that the existence of autocorrelation features in the global space, means the existence of local dissimilar spaces. When there are both positive and negative correlations in the global attribute data, the two may weaken the role of the other party, thus reducing Moran’s I. Anselin proposed to observe the unstable characteristics of the local space with the local indicators of spatial association and test whether there is similar or different aggregation between the local area and the surrounding area [55]. The index can reflect the internal characteristics of global autocorrelation and identify different spatial correlation patterns in different local spaces in the global context. The calculation process is shown in Formula (8):
The meaning of variables in the above formula is the same as that in Formula (7). represents the spatial clustering of similar values of adjacent units in the local area; represents the spatial clustering of non-similar values of adjacent units in the local area; represents the spatial random distribution of the values of adjacent units in the local area.
3.2.5. Influencing Factors of Land-Use Efficiency
In order to optimize urban land-use efficiency, this article further explores the influencing factors of urban land-use efficiency. Unlike traditional standard panel model research, we use the spatial econometric model as the empirical model. Spatial econometric models incorporate spatial correlation into the model to reflect the impact of spatial location. Besides, the spatial autocorrelation test also shows that the spatial econometric model is more suitable for this study. The spatial econometric model mainly includes the spatial lag model (SLM) [56], the spatial error model (SEM) [56], and the spatial Dubin model (SDM) [57]. Among them, SDM is the most common. Therefore, we use SDM for empirical analysis, and its expression is shown in Equation (9).
in which, is the explained variable; is the explanatory variable; is spatial autocorrelation coefficient; is spatial weight matrix; , and are the elastic coefficients of corresponding variables, respectively; is a unit matrix; is stochastic error; is explanatory variables of spatial lag; is explained variable of spatial lag.
We choose the total external economic connection, technological innovation level, industrial structure upgrading as the core explanatory variables, construction land, fixed asset investment, and labor force as control variables.
4. Results
4.1. Decoupling Analysis
In order to preliminarily understand the relationship between urban land-use change and GDP growth of secondary and tertiary industries in Sichuan Province, we used the decoupled analysis, and the results are shown in Figure 4.
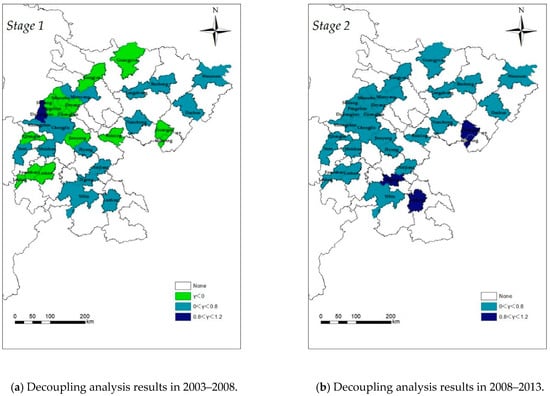
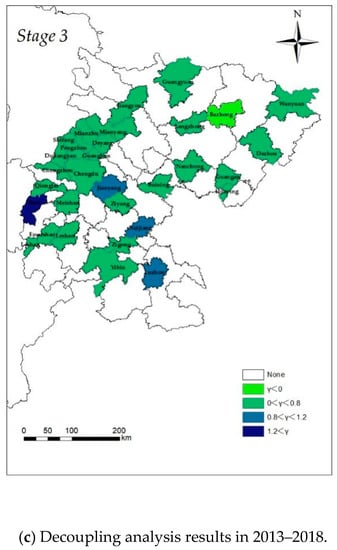
Figure 4.
Decoupling analysis results in three periods.
From Figure 4, during the period of 2003–2008, the urban land-use elasticity of 17 cities ranged from 0 to 0.8, which was in the weak decoupling state; the urban land-use elasticity of 14 cities was less than 0, which indicates that there was a decoupled relationship between urban land use and economic growth in these cities, and these cities may pay more attention to the use of land resources; only Dujiangyan was in the expansive state coupling state. During the period of 2008–2013, the urban land-use elasticity of four cities ranged from 0.8 to 1.2, which was in the state of expansive coupling; the rest of the cities ranged from 0 to 0.8, in the state of weak decoupling. During the period of 2013–2018, the urban land-use elasticity of three cities ranged from 0.8 to 1.2; the urban land-use elasticity of 27 cities ranged from 0 to 0.8, which was in the state of weak decoupling. From a comprehensive perspective, except for individual cities in individual years, the urban land-use elasticity of almost all cities is less than 1, among which the proportion between 0 and 0.8 is 53.1%, 87.5%, and 84.4%, respectively, which indicates that the growth rate of urban land-use efficiency is always lower than the growth rate of GDP of secondary and tertiary industries, but most cities are still in a weak decoupling state. However, compared with different stages, the urban land-use elasticity of most cities has different degrees of growth, indicating that the growth rate of urban land expansion and the total value of secondary and tertiary industries have a trend of convergence, further indicating that Sichuan Province should strengthen land protection and optimize the land use structure.
4.2. Results of Urban Land-Use Efficiency
In order to further study the urban land-use level of Sichuan Province, we calculated the urban land-use efficiency of each city using the super-efficiency SBM model. For space reasons, we only present the results for 2003, 2008, 2013, and 2018, as shown in Table 3.
Table 3.
Urban land-use efficiency in 2004, 2008, 2013, and 2018.
According to Table 3, during the four years of 2003, 2008, 2013, and 2018, the urban land-use efficiency value of each region fluctuated wildly. Taking efficiency 1 as a reference, in 2003, the highest in Chongzhou city was 21% higher than 1, and the lowest in Guang’an city was 76% lower than 1; the highest in Yibin city was 14% higher than 1, and the lowest in Wanyuan city was 65% lower than 1 in 2008; the highest in Chengdu city was 14% higher than 1, and the lowest in Guangyuan city was 65% lower than 1 in 2013; the highest in Panzhihua City was 18% higher than 1, and the lowest in Guangyuan City was 73% lower than 1 in 2018; meanwhile, the variance of efficiency in each year was 0.0807, 0.0743, 0.0706 and 0.0668, respectively. It shows that the urban land-use efficiency of each city in Sichuan Province has a large gap, but the gap is continuously decreasing. The urban land-use efficiency of each city is mainly in the following stages: high efficiency, medium efficiency, medium-low efficiency, and low efficiency, and mainly in the form of high efficiency and low efficiency, accounting for 84%, 78%, 78%, and 84% respectively over the years, which reflects the characteristics of polarization of urban land-use efficiency in Sichuan Province, with low efficiency in the majority.
From the perspective of the spatial distribution of the stage in each city, there is a clear “center-periphery” distribution trend, as shown in Figure 5. With Chengdu, Mianyang, and Yibin as the center, the surrounding cities of these three central cities generally present a distribution pattern—the closer to the central city, the higher the efficiency, and the farther away from the central city, the lower the efficiency. Furthermore, as time progresses, high-efficiency areas are increasingly concentrated near Chengdu.
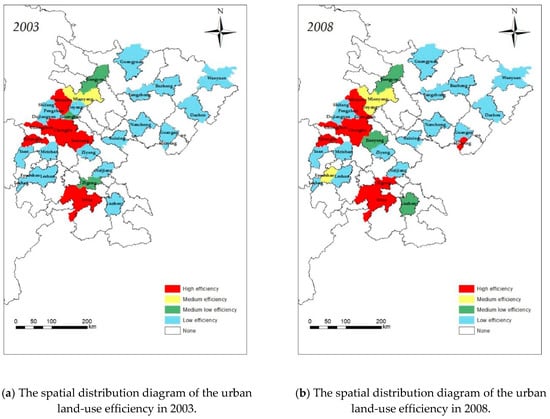

Figure 5.
The spatial distribution diagram of the urban land-use efficiency.
4.3. Malmquist Index Analysis
In order to further explore the evolution law of urban land-use efficiency in Sichuan Province, we calculated and decomposed the Malmquist index. In Table 4, we showed the average annual Malmquist index and its decomposition for each city.
Table 4.
Average annual Malmquist index and its decomposition.
In general, the growth rate of urban land-use efficiency in Sichuan Province is greater than 1 (Malmquist index) in 2003–2018, with an average annual growth rate of 4.71%. From the perspective of decomposition of average annual growth rate, except for the average annual decrease of 0.28% in pure technical efficiency (PEC), the scale efficiency (SEC), pure technical change (PTC), and scale technical change (STC) all increased, of which the scale efficiency increased by 0.34%, the pure technical change increased by 3.42%, and the scale technical change increased by 1.28%. It shows that the level of technology application in Sichuan Province is declining. The improvement of urban land-use efficiency is mainly due to the reasonable allocation of input and output factors, the improvement of potential benchmark technology progress, and the scale effect of technological change. The potential benchmark technology progress plays a major role.
From the perspective of the city, Panzhihua, Bazhong, Huaying, Suining, and Chengdu have the fastest growth, with annual growth rates of 8.25%, 8.17%, 7.27%, 7.26%, and 7.06%, respectively, which are much higher than the average level. However, the reasons for their growth are slightly different. Panzhihua and Suining are mainly due to the potential benchmark technology progress, Bazhong and Huaying are due to the improvement of technology utilization level Chengdu is dependent on the improvement of scale effect of technological change. Also, Panzhihua, Chengdu, and Jiangyou are the best in efficiency among them and at the forefront of efficiency growth rate, and they will continue to maintain the top several in the future. From the perspective of the factors restricting the growth of urban land-use efficiency, 62.5% of cities are due to the decline of pure technical efficiency, which is much higher than other factors, indicating that the technical application capacity of Sichuan Province still needs to be improved.
As shown in Figure 6, from the perspective of time series, the growth rate of urban land-use efficiency in Sichuan Province fluctuated wildly before 2009 and gradually stabilized after 2009. It experienced a process of first rising, then falling, then rising, and finally stabilizing. The changes in STC and PTC were consistent with the change base of the Malmquist index, while the changes in PEC and SEC were opposite to the changes in the Malmquist index, which further confirmed that the main reason for the increase of efficiency growth rate is the improvement of potential benchmark technology progress and the scale effect of technological change.
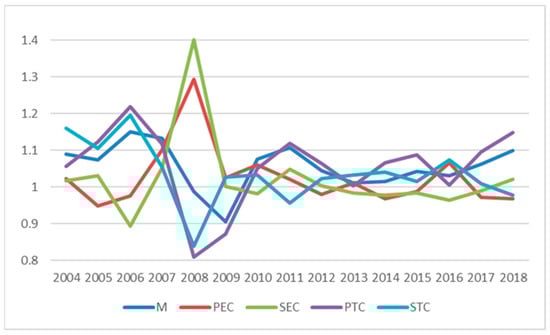
Figure 6.
Malmquist index and its decomposition time series diagram.
4.4. Global Spatial Autocorrelation
Using Stata software, we calculated the global Moran’s I index and z-value of urban land-use efficiency in various cities of Sichuan Province in 2003–2018, as shown in Figure 7. The results show that the global Moran’s I index is greater than 0, between 0.007 and 0.128. Except for 2008 and 2009, The remaining z-value are all greater than 1.96, which means that the p-value is less than 0.05 and passed the significance test. In 2008 and 2009, the z-value is close to 1.96, which can also be considered passing the test. Thus, during the research period, the spatial distribution of urban land-use efficiency in Sichuan Province has a significant positive global spatial correlation. The land-use efficiency of local cities will affect the neighboring cities and be affected by the neighboring cities. Overall, the global Moran’s I index from 2003 to 2018 was small and showed a trend of the first decline, then rise and then fall, indicating that the global spatial correlation of urban land-use efficiency in Sichuan Province showed a cyclical evolution process from strong to weak and then strong, but the overall correlation was still at a low level.
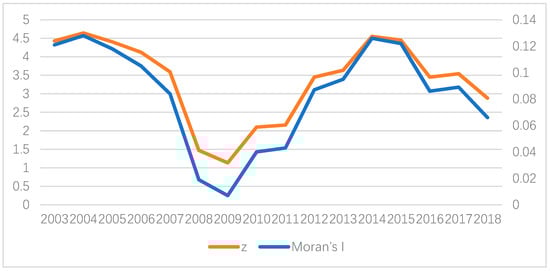
Figure 7.
Time series graph of Moran’s I index and Z-value.
4.5. Local Spatial Autocorrelation
The global Moran’s I index indicates that there is spatial self-correlation in the urban land-use efficiency of Sichuan Province from a macro perspective but cannot visualize the correlation. So, we calculated the local Moran index using Stata software and presented it in the form of a scatter plot. Here, we only show the distribution in 2003 and 2018.
Figure 8 and Figure 9 show that the local correlation of urban land-use efficiency in Sichuan Province is still at a low level in 2003–2008 and has been weakened. The areas with atypical observations—the areas in the second and fourth quarters—still account for a considerable proportion and are dominated by the spatial disequilibrium related agglomeration state of “low center, high around”. However, in general, the urban land-use efficiency of Sichuan Province still has the spatial proximity peer effect. That is, when the urban land-use efficiency of the adjacent area around the local city is at a high (low) level, the local is also more likely to become a high (low) level urban land-use efficiency city, forming a local distribution pattern of “high is always high, low is always low”.
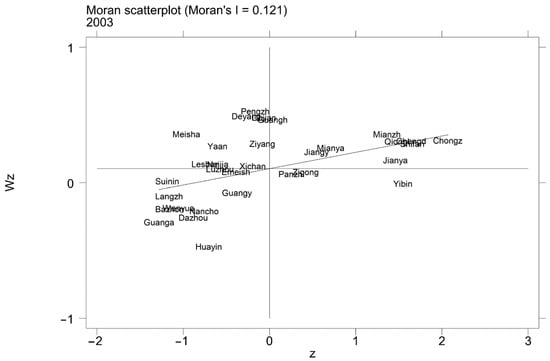
Figure 8.
Moran scatter plots in 2003.
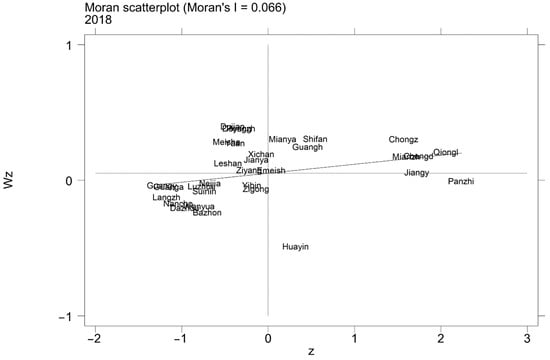
Figure 9.
Moran scatter plots in 2018.
4.6. Analysis of Influencing Factors of Urban Land-Use Efficiency
In order to further explore how to improve urban land-use efficiency, this paper uses SDM for empirical analysis, and the results are shown in Table 5. In Table 5, Model I reveals the impact of fundamental factors on urban land-use efficiency, and Model II adds three core explanatory variables—innovation, economic connection, and industrial structure—based on Model I. In addition, LM Test and LR test showed that SDM could not be simplified as SLM or SEM, which further confirmed that SDM is the most suitable model for this study. Finally, the value of the Hausman test shows that the model needs to control the spatial fixed effect.
Table 5.
Regression results of SDM.
It can be seen from Table 5 that construction land, fixed assets investment, and labor force in Model 1 and Model 2 have adverse effects on urban land-use efficiency but have different spillover effects. Among them, fixed assets investment has a negative effect on urban land-use efficiency at a significant level of 1%, which is greater than that of urban land input and labor input (not significant). It shows that the extensive use of urban land and idle land in Sichuan Province reduce urban land-use efficiency. Compared with this, the negative impact of urban overinvestment on urban land-use efficiency is more significant. The spillover effects of fixed asset investment and land investment are positive at the significant level of 5% and 10%, respectively, which indicates that the increase of capital and land investment in neighboring cities will positively impact the local area. On the whole, the control variables are significant, and the model is well controlled.
In terms of core explanatory variables, innovation plays the most prominent role in improving urban land-use efficiency. Its significance level is also the highest, which means that scientific and technological innovation is the main reason for urban land-use efficiency growth. At the same time, industrial structure and economic connection also promote the growth of urban land-use efficiency at a significant level of 10%, which indicates that the transformation from the primary and secondary industries with more land occupation to the more concentrated tertiary industry can improve the urban land-use efficiency. Besides, strengthening economic exchanges and promoting trade between cities can also significantly improve urban land-use efficiency. However, except for the positive spillover effect of economic connection, there is no spillover effect in innovation and industrial structure, which indicates that it is more effective to improve the land-use efficiency of the surrounding areas through economic exchanges. In contrast, the industrial structure and innovation have more regional characteristics and are not easily affected by the surrounding areas.
5. Discussion
The study of urban land-use efficiency in Sichuan Province is of great significance to promoting the sustainable development of Sichuan cities. However, existing studies have mainly focused on coastal areas and the more economically developed Middle East [29,30,31,32,33,34], and there is still a gap in research on western China, especially Sichuan Province. This paper takes 32 county-level areas in Sichuan Province as the subject of study, enriching the relevant research while expecting to provide literature support for urban land management in Sichuan Province.
This paper finds that urban land-use elasticity in Sichuan Province is on an increasing trend through statistical data. From the perspective of the land factor, urban land-use efficiency in Sichuan Province is decreasing. However, from the perspective of capital and labor factors, urban land-use efficiency is increasing. The index decomposition results and the measurement results show that this increase in efficiency does not benefit from factor inputs but benefits from technological progress. This finding confirms Cai’s judgment that China should move from a “factor-driven” to an “innovation-driven” [58] and emphasizes the importance of technological progress for urban land-use efficiency. It is worth noting that different research objectives will produce different indicator evaluation systems. Therefore, the indicator system does not have to be uniform but should vary according to the content of the study, with the core purpose of meeting the research needs.
The results show that urban land-use efficiency has a clear “center-periphery” distribution pattern. It is not an exception, as Fu et al., Gao et al., and Lu found this pattern in the Changzhutan urban agglomeration, the Wuhan urban agglomeration, and China as a whole, respectively [15,23,59]. Although the subjects and methods of study are distinctive, the conclusions are relatively uniform, suggesting that the “center-periphery” distribution pattern is widespread. This study also found that economic connections can significantly improve urban land-use efficiency. The radiative effect of economic connections is felt between the central city and its neighboring cities [60]. Also, the level of transport infrastructure is fundamental to economic connections [61]. Railways are still the most cost-effective means of intra-provincial access in China, and this role in facilitating urban exchanges and strengthening economic connections between cities is being enhanced with the development of high-speed railways [62]. Therefore, local governments should further increase investment in railway systems to create a well-developed and dense rail network.
Finally, technological innovation has been found to be a significant factor influencing urban land-use efficiency, and it also has a positive impact on industrial upgrading [63]. However, for a long time, the transformation rate of scientific research results in China has been low, and its contribution to economic development has been limited. According to the experience of developed countries, collaborative innovation between industry, universities, and research institutions can help improve technological innovation, promote the transformation of scientific and technological achievements, and achieve joint economic and technological development [64]. Therefore, the Chinese government should further promote the strategy of collaborative development between industry, university, and research, and build a strategic partnership between bodies of industry, university, and research to achieve a virtuous cycle of economic and technological development.
The DEA approach constructs indicators that are more comprehensive than single indicators [17,18]. Land use is a complex system involving many elements [65] and complex types [66]. However, limited by data, this paper only indirectly measures urban land-use efficiency at the economic level. It is because, in the last decade or so, China’s economy has been closely linked to land (land prices), and most elements can be linked to the economy. Therefore, this paper chooses to reflect land use from the side of the economy. It is believed that more detailed data will be able to present more convincing conclusions if relevant micro-data become available in the future.
In terms of models, super-efficiency SBM can circumvent the problem of multiple values of 1 in ordinary DEA, but the efficiency values are still relative, meaning that there is no comparability between different analysis groups with the same indicator system [47]. In addition, it is difficult to give specific policy recommendations using DEA, so, based on this, this study using tools such as econometric models [67,68] and spatial econometric models [23] to identify specific factors that can influence land-use efficiency, in order to gain targeted policy insights.
Firstly, one of the fundamental fiscal budget management units in China is the county. Due to the lack of data, this paper does not include it in the research system. Secondly, limited by the inconsistent statistical caliber and a large number of missing micro-level data of the environment, this paper cannot use environmental data to measure land-use efficiency directly. It can only use economic data to measure it indirectly. Thirdly, limited by space and the main research objectives, the research in this study has limitations. Although the spatial and temporal evolution of land-use efficiency in Sichuan Province was explored, it is impossible to go further and discuss the situation in different cities and at different stages in time. This would be an exciting direction for the researcher if the relevant data were available.
6. Conclusions
Through the study of the time-space evolution law of urban land-use efficiency in various cities of Sichuan Province, it is of great practical significance to optimize the urban land allocation in Sichuan Province, improve the urban land-use efficiency and sustainability of the land, and promote the healthy development of urbanization. Therefore, this paper uses the statistical data of 2003–2018 to study the urban land-use efficiency of 32 cities in Sichuan Province. We first used the Tapio decoupling model to preliminarily explore the relationship between urban land use and economic growth, and then used the super-efficiency SBM model to calculate the urban land-use efficiency of each city. Then, we conducted efficiency decomposition based on the measurement results and studied its time evolution law. Thirdly, we discuss the spatial distribution pattern of urban land-use efficiency by using the spatial autocorrelation model. Finally, SDM is used to analyze the main factors improving urban land-use efficiency.
The conclusions are as follows:
- There is a weak decoupling relationship between urban land use and economic development. The urban land-use efficiency of each city has polarization characteristics (more at both ends and less in the middle), but the difference is gradually narrowing.
- From the perspective of time evolution, we found that the urban land-use efficiency is increasing in different regions, but the reasons for promoting the growth are slightly different. The improvement of urban land-use efficiency is mainly due to the reasonable allocation of input-output factors, the improvement of scale effect of potential benchmark technology progress and technological change, and the potential benchmark technology progress plays a major role.
- From the perspective of spatial distribution, the urban land-use efficiency of each city has spatial self-correlation, but the correlation is not very strong. Furthermore, it formed a clear “center-peripheral” distribution pattern.
- Construction land and fixed assets investment have a significant negative impact on urban land-use efficiency. In addition, innovation, economic connection, and industrial structure optimization can improve land-use efficiency, and economic connection has a positive spillover effect on the land-use efficiency of surrounding areas.
In summary, the following policy implications emerge from this paper: firstly, the government should recognize the fact that land use in Sichuan is inefficient, strengthen the intensive use of land and give more targets to regions with higher land-use efficiency (e.g., Chengdu, Yibin, and Mianzhu) when allocating construction land targets; secondly, the government should increase investment in transport infrastructure; thirdly, the government should actively coordinate the collaborative innovation of industry, academia, and research, with enterprises as the primary innovation body and the R&D capabilities of universities and research institutions, to promote the transformation of research results and industrial upgrading.
Author Contributions
Conceptualization, M.Y., and Y.Z.; Formal analysis, M.Y., and Y.Z.; Methodology, M.Y.; Writing—review and editing M.Y., and Y.Z. Both authors have read and agreed to the published version of the manuscript.
Funding
This research was funded by the Fundamental Research Funds for the Central Universities of Northwest Minzu University (Grant No. 3192010026).
Institutional Review Board Statement
Not applicable.
Informed Consent Statement
Not applicable.
Data Availability Statement
All data comes from the statistical yearbook published by the government.
Conflicts of Interest
The authors declare that they have no conflict of interest.
References
- Yu, J.; Zhou, K.; Yang, S. Land use efficiency and influencing factors of urban agglomerations in China. Land Use Policy 2019, 88. [Google Scholar] [CrossRef]
- Wang, H.; He, Q.; Liu, X.; Zhuang, Y.; Hong, S. Global urbanization research from 1991 to 2009: A systematic research review. Landsc. Urban Plan. 2012, 104, 299–309. [Google Scholar] [CrossRef]
- Michael, F.L.; Noor, Z.Z.; Figueroa, M.J. Review of urban sustainability indicators assessment—Case study between Asian countries. Habitat Int. 2014, 44, 491–500. [Google Scholar] [CrossRef]
- The United Nations. China’s Urban Population Will Increase by 255 Million in 2050; The United Nations: New York, NY, USA, 2018.
- Wang, Z.; Liang, L.; Sun, Z.; Wang, X. Spatiotemporal differentiation and the factors influencing urbanization and ecological environment synergistic effects within the Beijing-Tianjin-Hebei urban agglomeration. J. Environ. Manag. 2019, 243, 227–239. [Google Scholar] [CrossRef]
- Liu, Y.; Li, J.; Yang, Y. Strategic adjustment of land use policy under the economic transformation. Land Use Policy 2018, 74, 5–14. [Google Scholar] [CrossRef]
- Wang, J.; Lin, Y.; Glendinning, A.; Xu, Y. Land-use changes and land policies evolution in China’s urbanization processes. Land Use Policy 2018, 75, 375–387. [Google Scholar] [CrossRef]
- Lu, X.H.; Kuang, B.; Li, J. Regional difference decomposition and policy implications of China’s urban land use efficiency under the environmental restriction. Habitat Int. 2018, 77, 32–39. [Google Scholar] [CrossRef]
- Wang, K.; Tang, Y.; Chen, Y.; Shang, L.; Ji, X.; Yao, M.; Wang, P. The Coupling and Coordinated Development from Urban Land Using Benefits and Urbanization Level: Case Study from Fujian Province (China). Int. J. Environ. Res. Public Health 2020, 17, 5647. [Google Scholar] [CrossRef]
- Lian, H.; Li, H.; Ko, K. Market-led transactions and illegal land use: Evidence from China. Land Use Policy 2019, 84, 12–20. [Google Scholar] [CrossRef]
- Qian, Z. Land acquisition compensation in post-reform China: Evolution, structure and challenges in Hangzhou. Land Use Policy 2015, 46, 250–257. [Google Scholar] [CrossRef]
- Zeng, L.; Yang, J. Urban Expansion, Land Finance and Rural Surplus Labor Transfer—Evidence from the Panel Data of 281 Prefecture-level Cities in China. Res. Econ. Manag. 2020, 41, 14–32. [Google Scholar] [CrossRef]
- Zhang, Z. Study of Chinese Urban Land Use Efficiency. J. Quant. Tech. Econ. 2014, 31, 134–149. [Google Scholar] [CrossRef]
- He, S.; Yu, S.; Li, G.; Zhang, J. Exploring the influence of urban form on land-use efficiency from a spatiotemporal heterogeneity perspective: Evidence from 336 Chinese cities. Land Use Policy 2020, 95, 104576. [Google Scholar] [CrossRef]
- Lu, M. Transfer of Land for Construction: Breakthrough Point in China’s Coordinated Rural-Urban and Regional Development. Int. Econ. Rev. 2010, 2, 137–148. [Google Scholar]
- Liu, Y.; Zhang, Z.; Zhou, Y. Efficiency of construction land allocation in China: An econometric analysis of panel data. Land Use Policy 2018, 74, 261–272. [Google Scholar] [CrossRef]
- Louw, E.; Van der Krabben, E.; Amsterdam, H. The Spatial Productivity of Industrial Land. Reg. Stud. 2012, 46, 137–147. [Google Scholar] [CrossRef]
- Huang, Z.; He, C.; Wei, Y.H.D. A comparative study of land efficiency of electronics firms located within and outside development zones in Shanghai. Habitat Int. 2016, 56, 63–73. [Google Scholar] [CrossRef]
- Matthews, K.; Buchan, K.; Sibbald, A.; Craw, S. Combining deliberative and computer-based methods for multi-objective land-use planning. Agric. Syst. 2006, 87, 18–37. [Google Scholar] [CrossRef]
- Wey, W.-M.; Hsu, J. New Urbanism and Smart Growth: Toward achieving a smart National Taipei University District. Habitat Int. 2014, 42, 164–174. [Google Scholar] [CrossRef]
- Liu, S.; Xiao, W.; Li, L.; Ye, Y.; Song, X. Urban land use efficiency and improvement potential in China: A stochastic frontier analysis. Land Use Policy 2020, 99, 105046. [Google Scholar] [CrossRef]
- Charnes, A.; Cooper, W.W.; Li, S. Using data envelopment analysis to evaluate efficiency in the economic performance of Chinese cities. Socio-Econ. Plan. Sci. 1989, 23, 325–344. [Google Scholar] [CrossRef]
- Gao, X.; Zhang, A.; Sun, Z. How regional economic integration influence on urban land use efficiency? A case study of Wuhan metropolitan area, China. Land Use Policy 2020, 90, 104329. [Google Scholar] [CrossRef]
- Huang, J.; Xue, D.Q. Study on Temporal and Spatial Variation Characteristics and Influencing Factors of Land Use Efficiency in Xi’an, China. Sustainability 2019, 11, 6649. [Google Scholar] [CrossRef]
- Zitti, M.; Ferrara, C.; Perini, L.; Carlucci, M.; Salvati, L. Long-Term Urban Growth and Land Use Efficiency in Southern Europe: Implications for Sustainable Land Management. Sustainability 2015, 7, 3359–3385. [Google Scholar] [CrossRef]
- Liu, Y. Introduction to land use and rural sustainability in China. Land Use Policy 2018, 74, 1–4. [Google Scholar] [CrossRef]
- Lu, X.; Chen, D.; Kuang, B.; Zhang, C.; Cheng, C. Is high-tech zone a policy trap or a growth drive? Insights from the perspective of urban land use efficiency. Land Use Policy 2020, 95, 104583. [Google Scholar] [CrossRef]
- Dong, Y.; Jin, G.; Deng, X. Dynamic interactive effects of urban land-use efficiency, industrial transformation, and carbon emissions. J. Clean. Prod. 2020, 270, 122547. [Google Scholar] [CrossRef]
- Zhu, X.; Li, Y.; Zhang, P.; Wei, Y.; Zheng, X.; Xie, L. Temporal-spatial characteristics of urban land use efficiency of China’s 35mega cities based on DEA: Decomposing technology and scale efficiency. Land Use Policy 2019, 88, 104083. [Google Scholar] [CrossRef]
- Hong, H.; Xie, D.; Liao, H.; Tu, B.; Yang, J. Land Use Efficiency and Total Factor Productivity—Distribution Dynamic Evolution of Rural Living Space in Chongqing, China. Sustainability 2017, 9, 444. [Google Scholar] [CrossRef]
- Zhang, L.; Zhang, L.; Xu, Y.; Zhou, P.; Yeh, C.-H. Evaluating urban land use efficiency with interacting criteria: An empirical study of cities in Jiangsu China. Land Use Policy 2020, 90, 104292. [Google Scholar] [CrossRef]
- Li, C.; Gao, X.; He, B.-J.; Wu, J.; Wu, K. Coupling Coordination Relationships between Urban-industrial Land Use Efficiency and Accessibility of Highway Networks: Evidence from Beijing-Tianjin-Hebei Urban Agglomeration, China. Sustainability 2019, 11, 1446. [Google Scholar] [CrossRef]
- Cui, X.; Fang, C.; Wang, Z.; Bao, C. Spatial relationship of high-speed transportation construction and land-use efficiency and its mechanism: Case study of Shandong Peninsula urban agglomeration. J. Geogr. Sci. 2019, 29, 549–562. [Google Scholar] [CrossRef]
- Wu, C.; Wei, Y.D.; Huang, X.; Chen, B. Economic transition, spatial development and urban land use efficiency in the Yangtze River Delta, China. Habitat Int. 2017, 63, 67–78. [Google Scholar] [CrossRef]
- Akıncı, H.; Özalp, A.Y.; Turgut, B. Agricultural land use suitability analysis using GIS and AHP technique. Comput. Electron. Agric. 2013, 97, 71–82. [Google Scholar] [CrossRef]
- Kazemi, H.; Akinci, H. A land use suitability model for rainfed farming by Multi-criteria Decision-making Analysis (MCDA) and Geographic Information System (GIS). Ecol. Eng. 2018, 116, 1–6. [Google Scholar] [CrossRef]
- Li, J.; Lewis, J.; Rowland, J.; Tappan, G.; Tieszen, L. Evaluation of land performance in Senegal using multi-temporal NDVI and rainfall series. J. Arid. Environ. 2004, 59, 463–480. [Google Scholar] [CrossRef]
- Zhao, X.; Zhang, L.; Huang, X.; Zhao, Y.; Zhang, Y. Evolution of the Spatiotemporal Pattern of Urban Industrial Land Use Efficiency in China. Sustainability 2018, 10, 2174. [Google Scholar] [CrossRef]
- SPBS (Sichuan Provincial Bureau of Statistics). Sichuan Statistical Yearbook 2018; China Statistics Press: Beijing, China, 2019.
- Ji, X.; Wang, K.; Ji, T.; Zhang, Y.; Wang, K. Coupling Analysis of Urban Land Use Benefits: A Case Study of Xiamen City. Land 2020, 9, 155. [Google Scholar] [CrossRef]
- Fagerberg, J.; Srholec, M.; Verspagen, B. Chapter 20—Innovation and Economic Development. In Handbook of the Economics of Innovation; Hall, B.H., Rosenberg, N., Eds.; North-Holland: Amsterdam, The Netherlands, 2010; Volume 2, pp. 833–872. [Google Scholar]
- Lu, X.; Yang, X.; Chen, Z. Measurement and temporal-spatial evolution characteristics of urban land green use efficiency in China. China Popul. Resour. Environ. 2020, 30, 83–91. [Google Scholar] [CrossRef]
- Chen, J.; Wang, P.; Cui, L.; Huang, S.; Song, M. Decomposition and decoupling analysis of CO2 emissions in OECD. Appl. Energy 2018, 231, 937–950. [Google Scholar] [CrossRef]
- Charnes, A.; Cooper, W.W.; Rhodes, E. Measuring the efficiency of decision making units. Eur. J. Oper. Res. 1978, 2, 429–444. [Google Scholar] [CrossRef]
- Matthias, K. Do Forwarders Improve Sustainability Efficiency? Evidence from a European DEA Malmquist Index Calculation. Sustainability 2017, 9, 842. [Google Scholar]
- Tone, K. A slacks-based measure of efficiency in data envelopment analysis. Eur. J. Oper. Res. 2001, 130, 498–509. [Google Scholar] [CrossRef]
- Tone, K. A slacks-based measure of super-efficiency in data envelopment analysis. Eur. J. Oper. Res. 2002, 143, 32–41. [Google Scholar] [CrossRef]
- Li, J.; Jing, Y. Research on Green Development Efficiency Evaluation and Spatial-Temporal Differentiation Based on SBM-GIS: Take the Central Plains Urban Agglomeration as an Example. Ecol. Econ. 2019, 35, 94–101. [Google Scholar]
- Malmquist, S. Index numbers and indifference surfaces. Trab. Estad. 1953, 4, 209–242. [Google Scholar] [CrossRef]
- Caves, D.W. The Economic Theory of Index Numbers and the Measurement of Input, Output, and Productivity. Econometrica 1982, 50, 1393–1414. [Google Scholar] [CrossRef]
- Färe, R.; Grosskopf, S.; Lindgren, B.; Roos, P. Productivity Developments in Swedish Hospitals: A Malmquist Output Index Approach. In Data Envelopment Analysis: Theory, Methodology, and Applications; Springer: Dordrecht, The Netherlands, 1994; pp. 253–272. [Google Scholar]
- Färe, R.; Grosskopf, S.; Norris, M.; Zhang, Z.Z. Productivity Growth, Technical Progress, and Efficiency Change in Industri-alized Countries. Am. Econ. Rev. 1994, 84, 66–83. [Google Scholar]
- Zofío, J.L. Malmquist productivity index decompositions: A unifying framework. Appl. Econ. 2007, 39, 2371–2387. [Google Scholar] [CrossRef]
- Anselin, L.; Bera, A.K.; Florax, R.; Yoon, M.J. Simple diagnostic tests for spatial dependence. Reg. Sci. Urban Econ. 1996, 26, 77–104. [Google Scholar] [CrossRef]
- Anselin, L. Local Indicators of Spatial Association-LISA. Geogr. Anal. 1995, 27, 93–115. [Google Scholar] [CrossRef]
- Anselin, L.; Le Gallo, J.; Jayet, H. Spatial Panel Econometrics. In Monetary Policy; Springer Nature: Berlin/Heidelberg, Germany, 2008; pp. 625–660. [Google Scholar]
- Lesage, J.; Pace, R.K. Introduction to Spatial Econometrics; Chapman and Hall/CRC: Boca Raton, FL, USA, 2009; pp. 1–341. [Google Scholar]
- Cai, F. How Can Chinese Economy Achieve the Transition toward Total Factor Productivity Growth? Soc. Sci. China 2013, 1, 56–71. [Google Scholar]
- Fu, L.; Chen, X.; Leng, Z. Urban Agglomerations Eco-Efficiency Analysis Based on Super-efficienty DEA Model: Case Study of Chang-Zhu-Tan “3 + 5” Urban Agglomeration. China Popul. Resour. Environ. 2013, 23, 169–175. [Google Scholar]
- Fang, C. New Structure and New Trend of Formation and Development of Urban Agglomerations in China. Sci. Geogr. Sin. 2011, 31, 1025–1034. [Google Scholar] [CrossRef]
- Meng, D.; Lu, Y. Analysis of inter-provincial accessibility and economic linkage spatial pattern based on the railway network. Geogr. Res. 2012, 31, 107–122. [Google Scholar]
- Chen, Z.; Haynes, K.E. Impact of high-speed rail on regional economic disparity in China. J. Transp. Geogr. 2017, 65, 80–91. [Google Scholar] [CrossRef]
- Wu, F.; Liu, R. Industrial Upgrading and Independent Innovation Ability Construction—Empirical Research Based on China’s Provincial Panel Data. China Ind. Econ. 2013, 57–69. [Google Scholar] [CrossRef]
- He, Y. The theoretical model of I-U-R collaborative innovation. Stud. Sci. Sci. 2012, 30, 165–174. [Google Scholar] [CrossRef]
- Xie, H.; Chen, Q.; Wang, W.; He, Y. Analyzing the green efficiency of arable land use in China. Technol. Forecast. Soc. Chang. 2018, 133, 15–28. [Google Scholar] [CrossRef]
- Xie, H.; Chen, Q.; Lu, F.; Wang, W.; Yao, G.; Yu, J. Spatial-temporal disparities and influencing factors of total-factor green use efficiency of industrial land in China. J. Clean. Prod. 2019, 207, 1047–1058. [Google Scholar] [CrossRef]
- Kuang, B.; Lu, X.; Zhou, M.; Chen, D. Provincial cultivated land use efficiency in China: Empirical analysis based on the SBM-DEA model with carbon emissions considered. Technol. Forecast. Soc. Chang. 2020, 151, 119874. [Google Scholar] [CrossRef]
- Chen, W.; Chen, W.; Ning, S.; Liu, E.; Zhou, X.; Wang, Y.; Zhao, M. Exploring the industrial land use efficiency of China’s resource-based cities. Cities 2019, 93, 215–223. [Google Scholar] [CrossRef]


Publisher’s Note: MDPI stays neutral with regard to jurisdictional claims in published maps and institutional affiliations. |
© 2021 by the authors. Licensee MDPI, Basel, Switzerland. This article is an open access article distributed under the terms and conditions of the Creative Commons Attribution (CC BY) license (http://creativecommons.org/licenses/by/4.0/).