Review

Industrial Symbiosis: A Sectoral Analysis on Enablers and Barriers

1
Low Carbon & Resource Efficiency, R&Di, Instituto de Soldadura e Qualidade, 4415-491 Vila Nova de Gaia, Portugal
2
IN+ Center for Innovation, Technology and Policy Research, Instituto Superior Técnico, University of Lisbon, 1049-001 Lisbon, Portugal
3
INESC-ID/IST, University of Lisbon, 1049-001 Lisbon, Portugal
*
Author to whom correspondence should be addressed.
Sustainability 2021, 13(4), 1723; https://doi.org/10.3390/su13041723
Submission received: 25 November 2020 / Revised: 28 January 2021 / Accepted: 29 January 2021 / Published: 5 February 2021
(This article belongs to the Collection Industrial Symbiosis and Sustainability)

Abstract

:
Industrial Symbiosis (IS) around the world in the last 20 years had been characterized through an extensive analysis of scientific papers on the IS emerging process, with a special focus on its early stages. The literature suggests that in this process there are key factors (enablers, barriers, triggers, and challenges) that play a critical role in Industrial Symbiosis. From those factors, the enablers and barriers have been highlighted in most of the studies in their different dimensions (social, economic, policy, technological, management, or geographical, amongst others). Several implementation cases suggest that the relevance of these factors rely on the dominant economic sectors involved. This study aims to reveal the key enablers and barriers in various economic sectors and its behaviour according to each one. To accomplish this objective, a comprehensive assessment methodology was designed and performed. This methodology is divided in two sequential phases: the first, sectoral analysis, focuses on the identification of the more relevant dimensions per economic sectors; in the second phase, incidence analysis, the individual behaviour of the enablers and barriers per economic sector are identified. This new approach correlates the economic sectors and factors incidence in order to provide new insights on the key barriers, and enablers on different dimensions. The main result of this study consists in the identification of a set of recommendations that might be critical to reinforce the emerging synergies process and to help overcome the barriers in each economic sector analysed.

1. Introduction

Industrial Symbiosis (IS) is commonly associated to Industrial Ecology (IE) and constitutes a strategy to promote circular economy, as it replicates or mimics nature in an industrial environment or industrial ecosystem [1]. This business model recreates an ecosystem where the elements or industrial actors actively share resources and wastes. One of the most accepted definitions establishes IS as the use by one company or sector of underutilised resources broadly defined (waste, by-products, residues, energy, water, logistics, capacity, expertise, equipment, and materials) from another, with the result of keeping resources in productive use for longer [2]. The firms involved in these kinds of synergies through these exchanges achieve economic, environmental and social benefits [3]. In practice, the companies may benefit from reduced operational costs [4], reduced taxes [5,6], job creation [7] and reduced emissions of CO2 [8]. Among the various successful implementation cases, the Kalundborg Eco-Industrial park (EIP) is one of the best-known examples in the world [9], since it has been establishing exchanges and industrial cooperation for over 50 years, involving nine partners and 25 stream exchanges [10].
The circumstances that promote IS initiatives is a subject that has been widely addressed in last 20 years [11]. Most of these studies were intended to understand the generic conditions, benefits and factors driving the IS emerging processes, and are especially focused on the early stage [12,13,14,15]. Several studies [3,12] have highlighted that in the IS implementation cases there are “key factors” that end up being crucial for the emerging process of synergies. Commonly, these key factors have been categorized as enablers, barriers, challenges and triggers [3,15,16,17], and the main objective of this categorization is to discern between factors that allow, ignite or enable IS implementation and factors that obstruct or threaten this process.
These factors cross-cut different dimensions—namely, policy, social, economic, intermediaries, geographical, and technological [3]—although it is recognized that the relation and behaviour between these factors and the economic sectors has not been appropriately analysed, especially regarding enablers and barriers [15,16,17,18,19]. In fact, these factors do not behave in the same manner for different economic sectors. For instance, while some authors defend the idea that geographical proximity is a fundamental enabler for promotion of synergies [20,21,22,23], other authors defend a contrary position [24], but a more detailed analysis shows that this divergence can be related with the economic sector’s nature, exchange streams and materials. In this context, the purpose of this paper is to advance in the understanding of the barriers and enablers behaviour in the IS emerging process, considering the specificities of different economic sectors, by answer the following research questions:
1. What are the key enablers and barriers in the implementation cases analysed?
2. How do the enablers and barriers function according to its economic sector?
3. What are the generic recommendations for promoting IS in the economic sectors analysed?
This paper is structured as follows: Section I is an introductory section discussing the scope of the paper and motivations of the paper. Section II typifies IS, its context approaches. Section III describes the methodology adopted and section IV promotes a better understanding on the role of the enablers and barriers in the different economic sectors. A critical discussion is carried out in section V. The conclusions are drawn in the last section.

2. Typifying Industrial Symbiosis

Industrial Ecology (IE) and its concepts emerged in the literature of the 1970s [25]. IE is an interdisciplinary study field that cover interrelated study areas of industrial ecosystem, industrial symbiosis, industrial metabolism, legislation and regulations for IE development and applications [26]. Nevertheless, before the IS existed as a fairly established concept, there were cases of companies that established synergies, mainly of wastes and resources. These first IS initiatives occurred typically in Europe [9,27]. The approaches were diverse, but both internal and external synergies could be identified, improving the productive processes through the increase of resource and, in particular, energy efficiency [27]. Currently, these industrial ecosystems have spread throughout the world, mostly in countries with strong production activities, such as Australia [28,29,30,31,32], China [8,33,34,35,36,37,38,39,40], and United States [41,42,43,44,45].
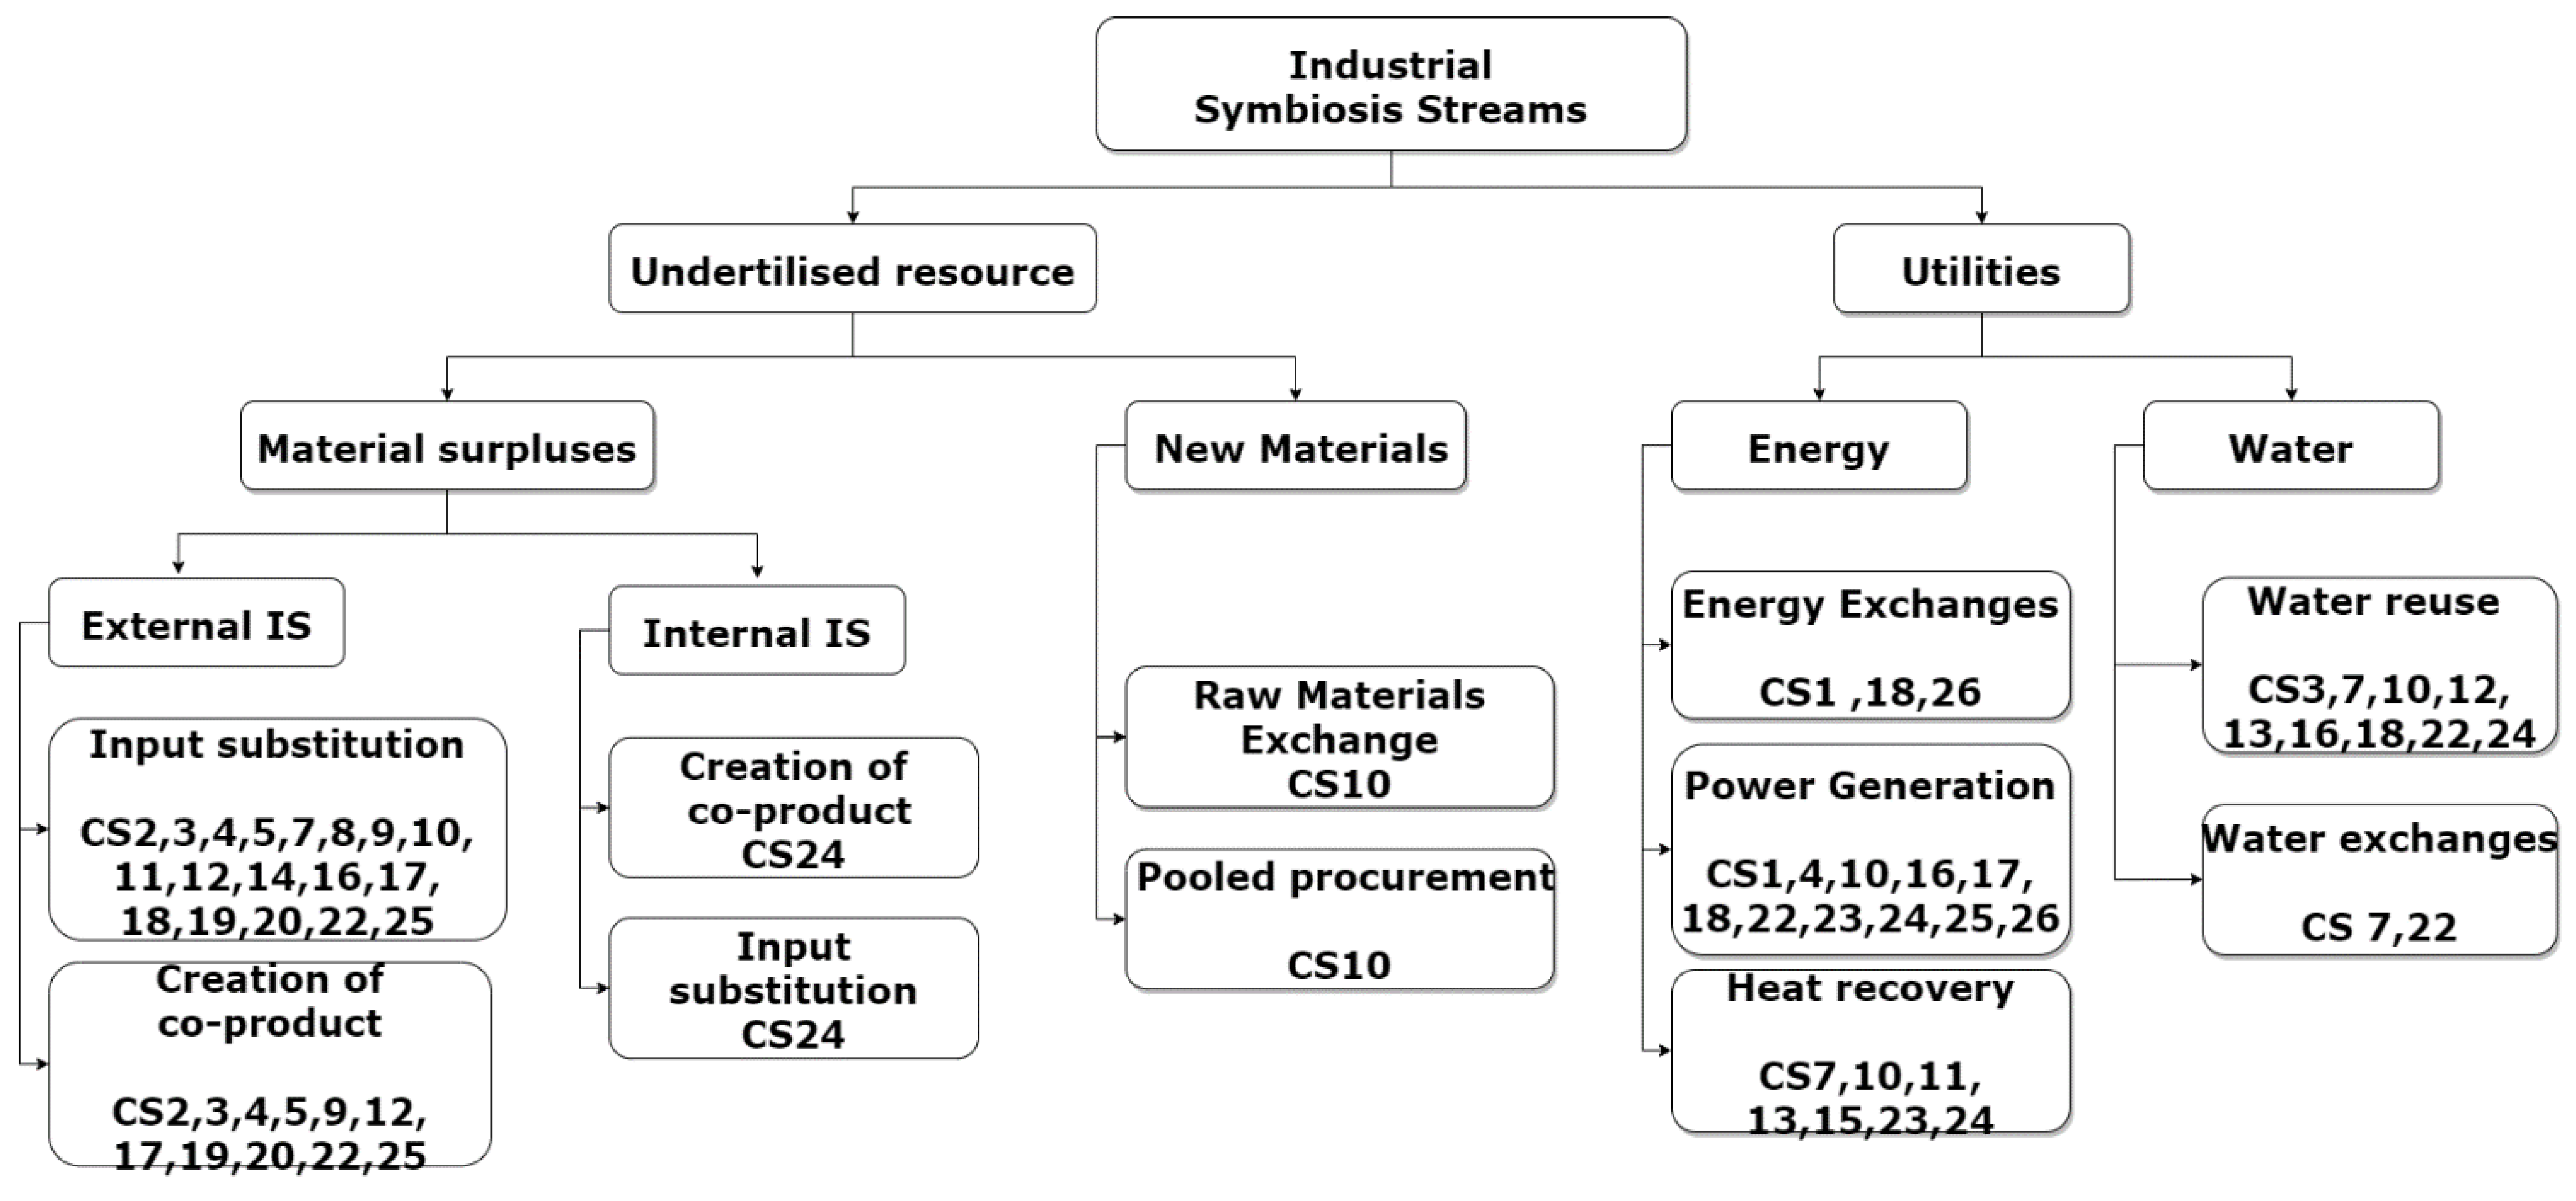
Considering IS as a collaborative approach concerning physical exchange among different companies [1], it is natural that there are several business scenarios that provide the context for companies to perform these symbiotic exchanges [46,47]. The nature of these exchanges is directly related to the company operations, its environment, resources and wastes. The literature suggests that there are four types of approaches to perform these exchanges, namely:
Internal exchange: This approach refers to companies that develop synergies within the boundaries of one organization [27].The principle is that companies can use wastes produced by their own production processes to replace inputs in other production processes within the company boundaries [46]. Since this business model does not require strategic partnerships, the relationships will be confined to the internal boundaries, not requiring interdependences in complex networks [47]. As a consequence, companies have to adapt their usual business model by changing the production chain to enable the synergies. The implementation of internal IS allows for adding value through lower production costs, in the form of lower virgin input purchase costs, and additional revenues [46].
External exchange: In the external exchanges approach, instead of using the wastes produced within the company boundaries, they can send or receive wastes to/from other companies, which will use them in their production processes [46]. In this model, the value is captured in two perspectives: the sender through the sale of the waste that is used by other companies (or at least to avoid the cost associated to waste disposal) and the receiver through lower production cost. The companies that participate in this model are highly dependent on each other to develop the streams exchanges [47].
Eco Industrial Park: An EIP is represented by an industrial park where the local companies cooperate with each other in order to reduce the waste and pollution trough the symbiotic exchanges [20,48]. The main goal of this collaboration is to reduce economic costs and engage in sustainable production practices [49]. In this approach, a central authority may design and manage the stream exchanges that will take place in the EIP [47,50]. The value is captured through material exchanges (by-products, wastes, resources or real-value products), operational cost reduction and non-direct revenues like stakeholder contributions and tax benefits [46,51,52].
Urban Industrial Symbiosis: This approach can be described as a network of community and industrial actors bridging local needs to improve resource utilization [53], by exploring synergies in urban and industrial areas, namely by using municipal solid waste into industrial companies, and meanwhile, applying industries as providers for living resources [8]. In this approach, the government usually facilitates the wastes exchanges and interaction between companies and community, and, therefore, this approach is characterized by a high level of centralization [47].

3. Industrial Symbiosis Case Studies: A Sectoral Distribution

3.1. Literature Review Methodology

This study is based on a systematic and detailed literature review directed to identify publications associated with the IS implementation case studies (CS). The objective of this literature review is to reveal the enablers and barriers associated to the Industrial Symbiosis. In this sense, a search was conducted in the search engines Scopus and Web of Science. This search was developed using the principal keyword “Industrial Symbiosis” and combining with other keywords, as presented in Table 1.
Our main information source for the case studies characterization was based on scientific peer-reviewed journal articles. In addition, a complementary research was developed through Internet searches for technical reports and technical documentation of European initiatives, such as European projects, sectoral clusters and IS networks. This complementary information, enabled the identification of critical aspects that were not registered in the scientific literature. Figure 1 presents the research strategy and the analytical procedures considered in the development of this study.
Through this structure, it was possible to obtain an initial sample of 126 references, which were analysed and resulted in the identification of 51 articles describing relevant symbiosis case studies. For the processing of the information, an analytical procedure consisting of the following steps, was adopted:
Step 1: Case study characterization;
Step 2: Identification of the enablers and barriers involved in the case studies;
Step 3: Development of an interpretive approach on the behaviour between the enablers/barriers and economic sectors;
Step 4: Proposal of a set of generic recommendations for the IS implementation

3.2. Industrial Symbiosis Case Studies Identification

The analysis of the 51 papers allowed for the identification of 26 implementation case studies. These case studies represent diverse implementation approaches, such as, synergies (internal or external), urban industrial symbiosis and EIP Industrial symbiosis. It was also possible to identify other important aspects such as geographical distribution, economic sectors and the streams. Table 2 present the 26 case studies and the characterization of their economic/industrial sectors.

3.2.1. Geographical Distribution and IS Approach

Regarding the alternative approaches to perform IS, in the sample there is a clear tendency for external IS, specifically referring to cases with two or more industries that are not necessarily located in an industrial park or EIP that manage to develop streams [46]. The approaches less represented were the internal IS and urban IS.
The low representativity of internal IS can be associated with the fact that this type of approach usually requires a comprehensive restructuring of the company’s business model [27,34] and strategic changes [11], one of the best known cases is The British Sugar Plc CS24 [27] whose processes optimization took 30 years of development and an important economic investments. The concept of the urban IS approach is represented in the final sample by CS3 [57,58,59]. The EIPs require joint efforts of several different stakeholders (firms, industries, local government, agencies) and face various barriers in its development [77].
In terms of geographical distribution, our sample it is mainly focused on European cases. Figure 2 represents (a) IS approach, (b) geographical distribution and (c) number of published papers per year in the final sample.

3.2.2. Industrial Symbiosis Streams

There are several streams or exchanges that can take place within the scope of IS [2], for the purpose of this study were categorized the different streams identified in the final sample. Regarding the underutilized resources identified in the CS, two main aspects were targeted. The surpluses, defined as the materials produced by an industrial activity (wastes and by-products) and the new materials (raw material). On the other hand, the utilities were targeted, since some synergies involve sharing of infrastructure to perform the stream. It is important to highlight that IS also considers the share of facilities and services [11,78,79], normally called as under-utilized capacity or sharing of over capacities. Nevertheless, for the purposes of this study, were just identified approaches concerning underutilized resources and utilities. Figure 3 shows the categorization of the various IS streams and their distribution in the final sample.
It was observed that the type of exchange implemented is intrinsically associated with the economic sector and its activities. For instance, the sectors of energy production or high energy consumption are characterized by implementing energy streams, such as energy exchange and heat recovery, as observed in case CS1 [54]. On the other hand, sectors like waste management and agribusiness are characterized by exchange of waste and by-products in an inter-company perspective.

3.2.3. Economic Sectors and Activities

The case studies were organized by economic sectors as presented in Table 3 and, although various authors suggest that industrial symbiosis initiatives are mainly concentrated in primary sectors and manufacturing [15,80], the sample obtained is very varied including other sectors such as logistics, waste management, pharmaceutical, and others. This indicates that the opportunities for IS are not only restricted to those sectors and activities.

4. Enablers and Barriers: Uncovering Industrial Symbiosis in Each Economic Sector

The nomenclature given to the key symbiosis factors in the literature can diverge: drivers, enablers, incentives, barriers, and challenges [14,15,81]. However, in general terms, all the studies that were analysed have the same purpose: to propose a categorization of these factors. This division of factors is intended to categorize or group them into two groups: factors that can unlock, facilitate and support the consolidation of synergies (enablers, drivers, triggers), and factors that can block or hinder the concretization of an initiative (barriers, challenges). As a consequence, we have focused on the assessment of enablers and barriers, which are amply discussed in the literature [15,16,17,18,19], and therefore, two concepts that limit the boundaries were defined:
Enabler: A factor that facilitates and supports the concretization of symbiotic synergies.
Barrier: A factor that hinders or obstructs the development of symbiotic synergies.
Enablers and barriers can be presented in various dimensions and levels [3,16,19,22,82,83,84,85,86] and we suggest seven fundamental dimensions to be considered, namely social, economic, policy, management, technological, geographical and intermediaries. Any of these dimensions can be relevant in three levels of implementation [7,80,87,88]: (1) a local level that involves the most direct and close to industrial agents such as chambers, industrial park and local government; (2) a level of regional perspective that involves regional government and authorities; and (3) a national level that involves macro elements such as general government, agencies and others. Figure 4 represents the identification framework developed for processing the enablers and barriers.
The identification of enablers and barriers was developed through a critical analysis of each paper in order to identify which were the enablers and barriers associated to each of the case study. It was possible to conclude that the majority of the studies identify the factors that had helped to overcome obstacles (enablers). However, the barriers identification was not so straightforward, but the analysis allowed for the identification of descriptors that can be used to describe the key enablers and barriers. This is presented in Table 4 and Table 5, where the descriptors are grouped by dimensions. The abbreviations are defined as follows: social (S); economic (E); policy (P); management (M); technological (T); geographical (G) and intermediaries (I).

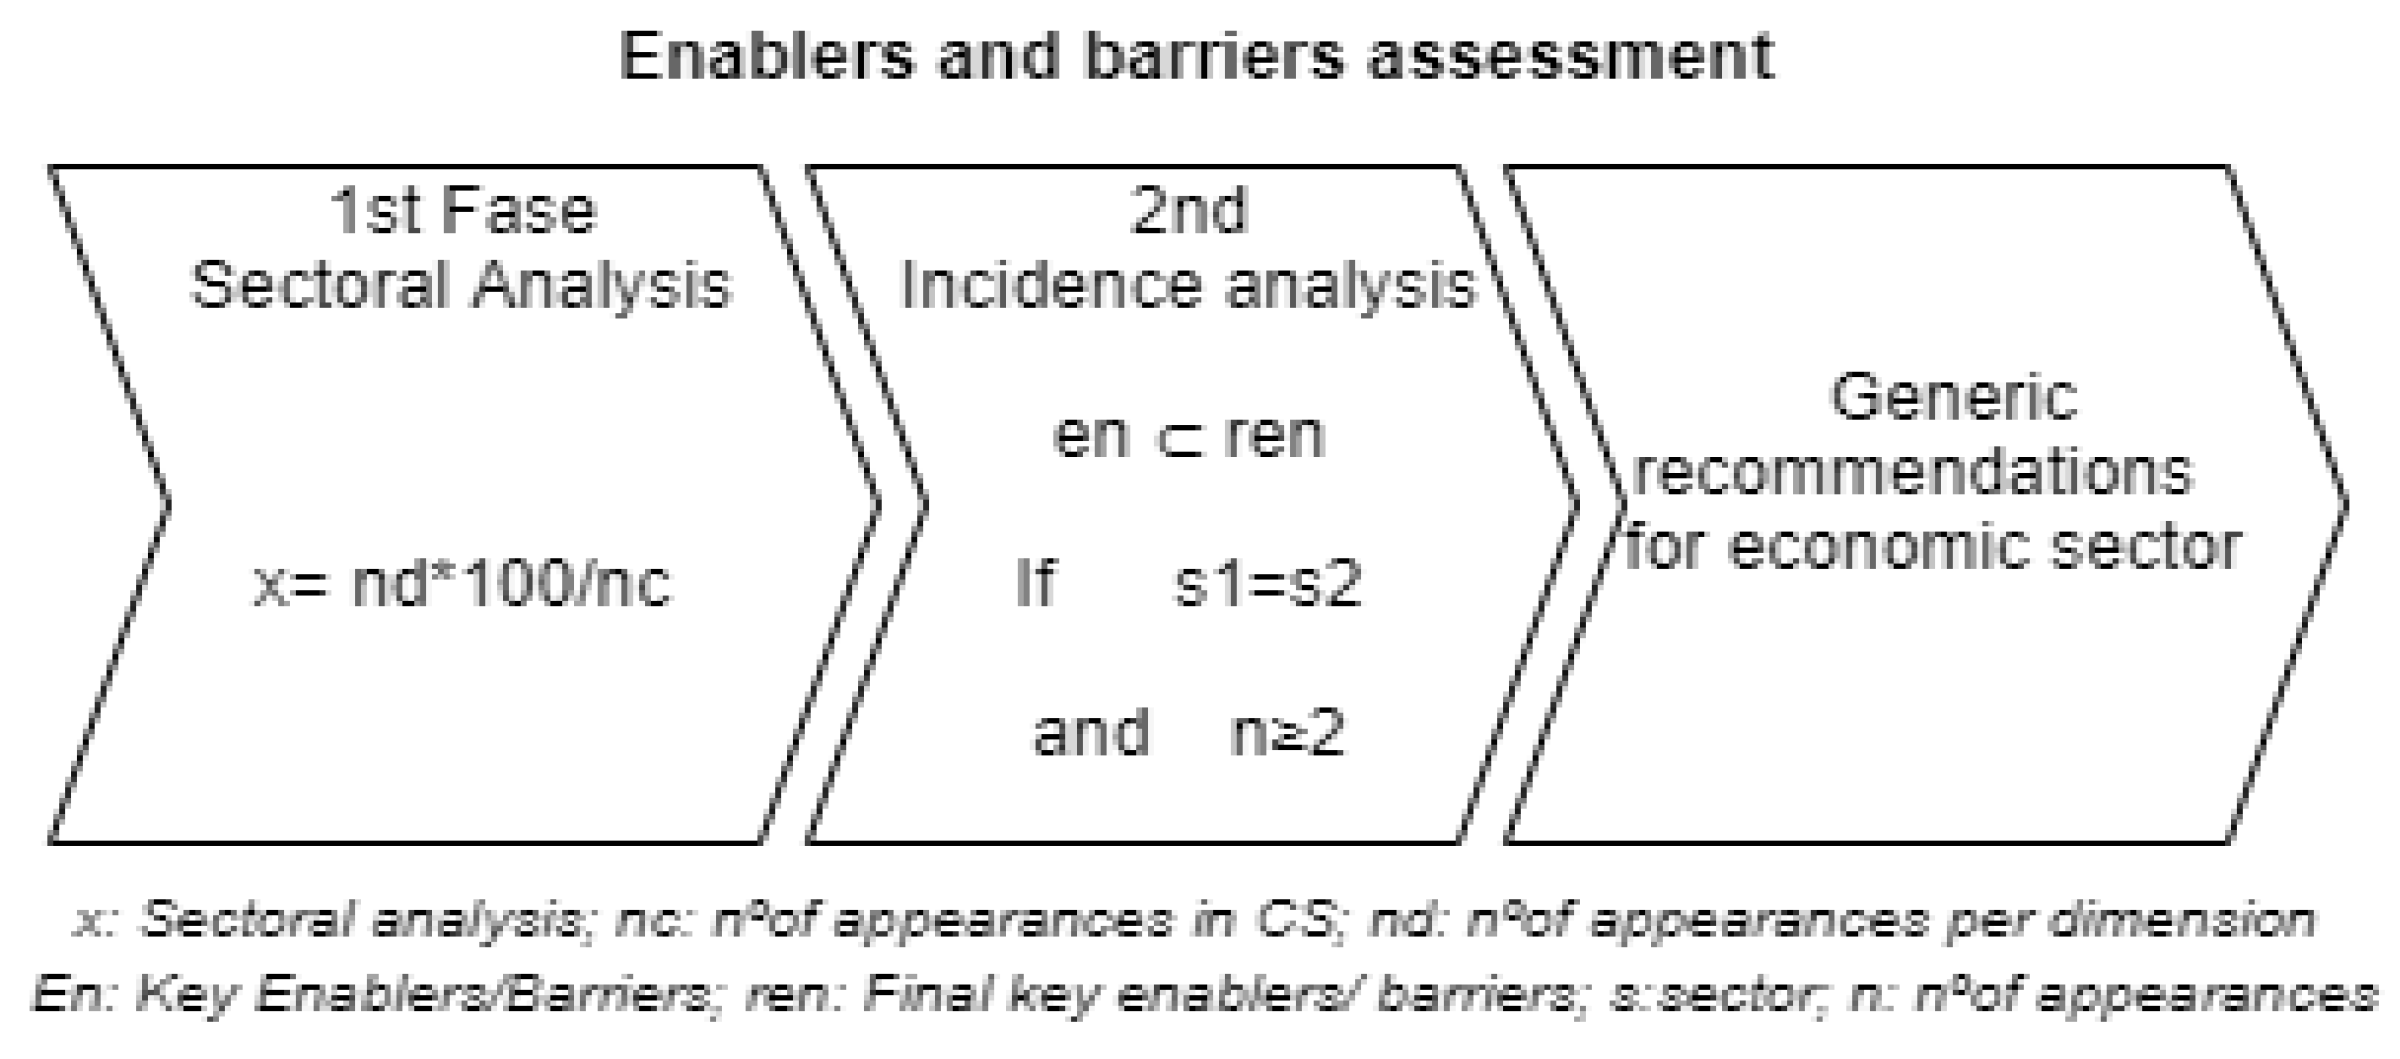
4.1. Enablers and Barriers Assessment

The identification of the most important enablers and barriers in each economic sector was performed in two phases. A first phase (sectoral analysis) evaluates the dimension’s relevance (social, economic, policy, management, technological, geographical, and intermediaries) in the economic sectors. The second phase (incidence analysis), consists of the individual evaluation of barriers and enablers in each economic sector. Figure 5 represents this two-phase approach.
The first phase (sectoral analysis) aims to identify which dimensions are more relevant in the economic sectors. For the design of the sectoral analysis, the number of cases with the same economic sector (nc) was correlated with the number of presences per dimensions (nd). The final results are presented in a heat diagram that allows for the visualization of the most important dimensions in each sector. In the second phase (incidence analysis), the barriers and enablers were separated of their dimensions, in order to evaluate the prevalence of each barrier/enabler individually. This separation of the factors dimensions is due to the fact that the first phase only allows us to obtain the overview by sector, and the second phase allows us to verify the individual behaviour of the enablers and barriers per sector.

4.1.1. Phase 1: Sectoral Analysis

For the purpose of the phase 1, the enablers and barriers relevance are represented on a matrix basis. This heat diagram allows for the visualization of barriers and enablers relevance by economic sector. In this sense, darkest green represents the dimension with the highest presence ranging in colour degraded until darkest red, that represent those with no presence. Figure 6 shows the heat diagram obtained for the purpose of the first phase of the factor’s assessment.
Regarding the enablers, the most relevant dimensions are the policy and intermediaries, followed by geographical and economic enablers. Concerning the barriers identification, social, technological and economic barriers are the ones that are represented with higher relevance in this first phase of the final sample.

4.1.2. Phase 2: Incidence Analysis

In phase 2, the incidence analysis was performed to identify the enablers and barriers with the highest prevalence and represent their importance in each sector. Figure 7 and Figure 8 represent the results of the second phase regarding the enablers and barriers. Appendix A shows the final key enablers and barriers considered to the incidence analysis.
In the enablers incidence analysis, the sectors with the highest number of enablers are energy, waste management, and chemical. The main reason for these high number of enablers on the mentioned sectors is that they are highly developed sectors, with advanced processes, regulations, and technologies, such as CS 7, 10, 18. The agribusiness sector also has an important representation. A possible explanation for this important number of enablers, can deal with the fact that it is a sector with modest profit margins and, therefore, it is a sector that is quite receptive to any opportunities to create new profits [23], such as the incorporation of synergies that can increase profits and reduce costs. This situation is presented in CS 17, 19. The cement sector is one of the best represented in existing symbiotic exchanges [89,90] and one of the sectors with the greatest potential for IS implementation [91,92], due to the fact that this sector can process diverse wastes as substitute for raw material [89]. However, predominant enablers that met the phase 2 criteria of our analysis were not identified.
The enablers related to geographical and intermediaries’ dimensions were the ones with the greatest incidence in general terms, mostly in sectors such as wastes management, agribusiness and energy. Those sectors frequently process wastes with relatively low prices (waste management and agribusiness), and therefore, significant transport costs could make synergies unfeasible [80]. Another premise is related to thermal losses associated to synergies on those sectors, that impose geographical proximity. This was a fact verified in energy synergies (e.g., steam and heat exchange) where the long distances could make the synergies technically and economically feasible [93].
In regard to the enablers with less representation, in general terms, they were management and technological. This result is due to the fact that both enablers usually stand at the bottom of implementation priorities. Frequently, the implementation of management strategies or technology optimization for synergies is supported by intermediaries with strong background in IS implementation (knowledge and historical background in the development of synergies). In fact, this was confirmed in CS 23 where aspects, such as protocols for implementation of I4.0, were promoted by intermediaries with strong background [62].
Regarding the barriers incidence analysis, the sectors with the highest representation are the agribusiness and chemical. Concerning the agribusiness sector, the technological limitations (due to the nature of the activities), social factors and reduced profit margins end up causing this great number of barriers. In the chemical sector, factors such as financial unviability due to lack of commercially viable technologies, lack of intermediaries, and social barriers have placed it as the sector with the highest characterization of barriers.
In regard to the individual incidence of barriers in the economic sectors, those that had the greatest presence were the technological and economic barriers. On the other hand, the economic barriers appeared in sectors such as agribusiness because it usually has modest profit margins. The barriers with the lowest representation were the policies and management. It is important to note that the lack of policies and a legal framework for IS is often seen as a problem [15,68,94]. Even though an exception to this statement was found in CS17 [23,69], where firms use this absence to take advantage of the ambiguity and have flexibility to build up an incentive to promote synergies.
There are also other factors that have been represented transversally in some studies [3,15] and have also been identified in this analysis, reinforcing the importance of these factors. For instance, the lack of intermediaries (knowledge agents, consultancy, and companies) was represented in almost all economic sectors of the sample.
Additionally, the geographical factors re-emerge as a great barrier, especially geographical proximity. As previously mentioned, this barrier has a greater impact in low-value wastes or cases with technical specificities that require close proximity, for instance, heat and steam recovery synergies [93]. It is important to highlight that for waste with low commercial value, the purchase of raw material often ends up being more economically viable for companies, since the distance travelled will affect the economic value of a synergy (logistics and transport) [95]. For wastes with greater market value, proximity might not be a relevant factor [24].

4.2. Generic Recommendations for IS per Economic Sector

The generic recommendations for symbiosis implementation are based on the key points and results of the factors’ assessment. For its promotion, has been performed a triangulation methodology in which the results of the two phases (Sectoral analysis and incidence analysis) and the literature review were triangulated in order to obtain the recommendations. This allows the main findings by means of data crosschecking from the different analysis considered to be unveiled. Hence, the generic recommendations of this study are obtained through our own methodology and results.
These recommendations are provided in order to reinforce the emerging synergies process and to help overcome the barriers identified in this study. Table 6 present the generic recommendations for symbiosis implementation per economic sector.

5. Results Discussion

Considering the first question that refers to the enablers and barriers with greatest presence, the main output about this point was the extensive characterization of the barriers and enablers.
In general terms, this study suggests that the most important enablers dimensions are: intermediaries, geographical and policy dimensions. Concerning the intermediaries, government involvement [35,55,63] and regional/national entities promoting synergies are the most prominent in this dimension [28,29,60,70].
In policy terms, the most relevant enabler is the promotion of framework supporting IS [3,9,15,16,41,96]. In various cases of the sample, the availability of a framework to promote industrial symbiosis was a defining factor for the realization of synergies, namely CS5, CS7, and CS22. The literature suggests that there are diverse levels of frameworks supporting IS: Macro (e.g., Waste Framework Directive [97], Circular Economy Package [98], Nationals plan for EC [99]); meso (e.g., UK NISP [88], ENEA Italy [62]) and micro (e.g., Relvão Eco Park [60]). Regardless of the level of governance, the framework should focus on strategic investment, promote regulatory instruments, promote incentives for IS, and increase the awareness on IS benefits and opportunities.
The taxation instruments also had an important role in this dimension, they can be separated into two main approaches: those that penalize environmental pollution or excessive and inefficient use of resources, and those taxes that promote the use of alternative methods with less environmental impact. Another important dimension consists on the economic enablers, and we specifically refer to funding and access to finance support in order to tackle economic barriers, such as co-funding investment [7,81], R&D projects [100], and the local and regional funding for IS [7]. Lastly, the geographical enablers, such as the proximity and availability of logistic networks [20,21,22,23], end up being the most prominent in this dimension.
On the other hand, the most important barriers dimensions are: technological, social, intermediaries, and geographical dimensions. Regarding intermediaries and social barriers, the conflict of interest [22,67,68], the lack of trust environment [28,64] are the most important barriers in this dimension. In technological terms, the lack of appropriate investment and technical integration problems ended up being the most relevant in this dimension [54,55,72,75]. In social terms, the lack of interest and trust is a key barrier for IS implementation [22,76,101]. Lastly, the presence of long distances is the most important geographical barrier [9,33].
Answering to the second question about the behaviour of the barriers and enablers according to its economic sector, there is no transversal answer, since the behaviour of the enablers and barriers will depend on the nature of each sector, streams exchanges, resources, and materials. Nevertheless, it can be concluded that primary sectors such as agribusiness, mineral extraction, and processing tend to have preference for the implementation direct exchanges of surpluses (raw material substitution) that allow to complement their operations and reduce operational costs. Secondary sectors such as manufacturing industry, steel, and wastes management, usually are characterized by high development levels, processes and regulations clearly stipulated. For this reason, those sectors tend to favour more ambitious and complex actions such as diversification of the business model, generation of new products and alteration of regulations.
In relation to the third question that refers to the recommendations for the economic sectors, it is concluded that each economic sector has different realities, priorities and interests, and, generic recommendations for each sector could be identified. It can be highlighted that we could identify as well some key aspects to promote industrial symbiosis. In this sense, the recommendations were addressed in order to reinforce these aspects (policy, economic, and social).
In policy terms, the promotion of an industrial wastes framework that effectively supports the long-term IS implementation was recommended. This framework should incentivize synergies creation through strategic investment, policy promotion and raising awareness. In economic terms, the attribution funds for synergies implementation, which will support overcoming cost barriers and uncertainties, was highlighted since many of the companies do not have the required funds to implement synergies, especially for purchase of infrastructure and utilities [60,68]. In the social aspect, the actions were directed in order to reinforce critical aspects such as government participation as a driving agent [35,55,63], creation of collaborative approach [60,85] trust environment [16,22,68,76,101], and reinforcing of strategic partnership.

6. Conclusions and Recommendations

This paper has systematically reviewed the enablers and barriers for IS, in order to correlate their behaviour in the economic sectors based on their incidence. The methodology developed allowed to extensively identify and synthesize the enablers and barriers in the case studies analysed. In a second phase of the study, it was possible to detail the analysis, and conclude about the key enablers and barriers in the various economic sector, and we could propose a set of generic recommendations for each economic sector. The methodology used for the assessment was based on the interpretation of the analysis provided in the papers that characterize 26 case studies and the incidence of their enablers and barriers.
As main recommendation for future studies, we suggest the development a more comprehensive methodology that may allow for addressing more directly the economic sectors and to obtain greater precision in the results.

Author Contributions

J.H. performed the literature review, selection of references, methodology and wrote the initial versions of the paper. P.F., R.C. and J.A. contributed to develop the paper structure, improvement of the research approach and the paper writing. All authors have read and agreed to the published version of the manuscript.

Funding

This work has received funding from the European Union’s Horizon 2020 research and innovation programme under grant agreement No 810764. Rui Castro was supported by national funds through Fundação para a Ciência e Tecnologia (FCT) with reference UIDB/50021/2020.

Institutional Review Board Statement

Not applicable.

Informed Consent Statement

Not applicable.

Data Availability Statement

No new data were created or analyzed in this study. Data sharing is not applicable to this article.

Acknowledgments

This work was supported by the European Union’s Horizon 2020 research and innovation programme through the TRUST project (grant agreement No 810764).

Conflicts of Interest

The authors declare no conflict of interest.

Appendix A

Table A1. Phase 1: Sectoral Analysis.
CasesCase DenominationIndustrial SectorTypologies of EnablersTypologies of Barriers
CS1Göta Älv region caseEnergyS3, E2, G2S3,T3
CS2The Nanning Sugar Co., Ltd. CaseAgribusiness, cementP1, E1, M2, I1E4, T2, G1
CS3Kawasaki Eco-tow caseMetal, paper, waste management, manufacturing, chemicalP1, G2, T1I3,T1
CS4The Eco-Industrial Park, RizhaoChemical, manufacturing, cement, metal, logistic, energy, agribusinessE1, P1, I2M2, T3, E4
CS5Relvão Eco Industrial Park, Municipality of Chamusca, PortugalPaper industry, waste management, Agribusiness, chemicalG1, P3,I2, E4, T4E3, S1, P1
CS6The Liuzhou city caseMetal, cementI1, I2, G1I3, T1, S4
CS7The symbiotic industrial district of GuayamaChemical, construction, pharmaceutical, waste management, energyS1, P1, G1S1, G2, I3
CS8The PODEBA caseAgribusiness, manufacturing M4, E4, T4, I2T4, G1
CS9The Forestry industry case in Santa CatarinaForestry sector, paper sectorI2,T2, S2G2, T2
CS10The Barceloneta cluster casePharmaceutical, energy, agribusiness, waste managementG2, E3, P5,I3S3, M1, I1
CS11The case of facilited exchange in Northern Ireland (NISP)Chemical, agribusinessI2, E1, M2I1, S2
CS12The case of the Guitang GroupAgribussines, chemical, paper industry, cement S4, P1, T2, M1E1, T4, E2
CS13Jorf LasfarLogistic I3, E5, S3G1, I3
CS14BejaïaLogistic, chemicalS3, I3, E1, M2G1, I3
CS15KoekhovenAgribusinessP3, I4, E4T3, S1, P2, S3
CS16The case of Kwinana Industrial area Metal, oil, cement, chemicals, energy, water supply and treatmentG1, I4, T1P2, P1, E3, S2
CS17The case of Nanjangud Industrial Area (NIA)Waste management, agribusiness, chemical, textil, paper, minerals, oil and energyG1, E2, P1, I4I1, E5, M3
CS18The case of Dalian Economic Development Area (DEDA) Chemical, manufacturing, metal, logistic and bio-medicineG3, I4, P4-
CS19The breweries industry caseAgribussiness G1, S3, P1P3, T4
CS20The wood industry in Latvia caseForestry industry, chemical and energyE1, G1,S3P3, T3
CS21The Kalundborg industrial clusterEnergy, chemical, manufacturing, construction, Waste managementS1, T3, P1S1, G1
CS22Humber Region case Paper industry, wastes, agribusiness, energyG1,I2, E2, S1, M1, P1E4,S3
CS23The Hamburger Rieger GmbH casePaper industry, energyE1, P2, T1G1, T2
CS24British Sugar PlcAgribusiness, chemical, energyE2, S5, M3S1, T2, E1
CS25The Ulsan industrial parkChemical, oilI2,P1P1, T3
CS26The Bussi Chemical Site caseChemicals, energyG1, P1, I4M1, S1, E2
Table A2. Phase 2: Incidence Analysis.
Economic SectorWaste ManagementAgribusinessEnergyPaper IndustryChemicalLogisticsCementForestry IndustryManufacturingMetal
Key enablersS1, P3, G1, G2, I2E2,E4, E1,P1, M1,M4, G1,I2, I3, I4S1, S2, E2, P1, G1, I2, I4G1, I2S1, S2, E2, E3, P1, P3, P4, T2, G1, G2, G3, I2, I4I2--P1, T1, I2P1, I2
Key barriersS1,S3,I1S1,S3, E1,E4, T2,T3, T4, G1, I1S1,S3, M1,T2, T3,G1, I1T2S1, S2, E1, E2,E3, P1, T3, G1, I1, I3G1E4,I3-G1T1

References

  1. Chertow, M.R. Industrial symbiosis: Literature and taxonomy. Annu. Rev. Energy Environ. 2000, 25, 313–337. [Google Scholar] [CrossRef] [Green Version]
  2. CEN-CENELEC Management Centre. Industrial Symbiosis: Core Elements and Implementation Approaches; CEN-CENELEC: Brussels, Belgium, 2018. [Google Scholar]
  3. Mirata, M. Experiences from early stages of a national industrial symbiosis programme in the UK: Determinants and coordination challenges. J. Clean. Prod. 2004, 12, 967–983. [Google Scholar] [CrossRef]
  4. Albino, V.; Fraccascia, L.; Giannoccaro, I. Exploring the role of contracts to support the emergence of self-organized industrial symbiosis networks: An agent-based simulation study. J. Clean. Prod. 2016, 112, 4353–4366. [Google Scholar] [CrossRef]
  5. Costa, I.; Massard, G.; Agarwal, A. Waste management policies for industrial symbiosis development: Case studies in European countries. J. Clean. Prod. 2010, 18, 815–822. [Google Scholar] [CrossRef]
  6. Fraccascia, L.; Giannoccaro, I.; Albino, V. Efficacy of landfill tax and subsidy policies for the emergence of industrial symbiosis networks: An agent-based simulation study. Sustainbility 2017, 9, 521. [Google Scholar] [CrossRef] [Green Version]
  7. Johnsen, I.; Berlina, A.; Lindberg, G.; Mikkola, N.; Smed Olsen, L.; Teräs, J. The Potential of IS as a Key Driver of Green Growth in Nordic Regions; Nordregio: Stockholm, Sweden, 2015. [Google Scholar]
  8. Sun, L.; Li, H.; Dong, L.; Fang, K.; Ren, J.; Geng, Y.; Fujii, M.; Zhang, W.; Zhang, N.; Liu, Z. Eco-benefits assessment on urban industrial symbiosis based on material flows analysis and emergy evaluation approach: A case of Liuzhou city, China. Resour. Conserv. Recycl. 2016, 119, 78–88. [Google Scholar] [CrossRef] [Green Version]
  9. Adamides, E.D.; Mouzakitis, Y. Industrial ecosystems as technological niches. J. Clean. Prod. 2009, 17, 172–180. [Google Scholar] [CrossRef]
  10. Symbiosis, K. Kalumborg Symbiosis. Available online: http://www.symbiosis.dk/en/. (accessed on 1 October 2020).
  11. Boons, F.; Chertow, M.; Park, J.; Spekkink, W.; Shi, H. Industrial Symbiosis Dynamics and the Problem of Equivalence: Proposal for a Comparative Framework. J. Ind. Ecol. 2017, 21, 938–952. [Google Scholar] [CrossRef]
  12. Chertow, M.R. “Uncovering” Industrial Symbiosis. J. Ind. Ecol. 2007, 11, 11–30. [Google Scholar] [CrossRef]
  13. Song, X.; Geng, Y.; Dong, H.; Chen, W. Social network analysis on industrial symbiosis: A case of Gujiao eco-industrial park. J. Clean. Prod. 2018, 193, 414–423. [Google Scholar] [CrossRef]
  14. Yu, C.; Davis, C.; Dijkema, G.P.J. Understanding the evolution of industrial symbiosis research: A bibliometric and network analysis (1997–2012). J. Ind. Ecol. 2014, 18, 280–293. [Google Scholar] [CrossRef]
  15. Neves, A.; Godina, R.; Azevedo, G.S.; Pimentel, C.; Matias, J.C.O. The Potential of Industrial Symbiosis: Case Analysis and Main Drivers and Barriers to Its Implementation. Sustainability 2019, 11, 7095. [Google Scholar] [CrossRef] [Green Version]
  16. Islam, K.; Islam, K.N.; Rahman, M.F. Industrial Symbiosis: A Review on Uncovering Approaches, Opportunities, Barriers and Policies. J. Civ. Eng. Environ. Sci. 2016, 2, 011–019. [Google Scholar] [CrossRef] [Green Version]
  17. Corder, G.D.; Golev, A.; Fyfe, J.; King, S. The status of industrial ecology in Australia: Barriers and enablers. Resources 2014, 3, 340–361. [Google Scholar] [CrossRef]
  18. Fric, U. Socio-cultural aspects and barriers of industrial symbiosis—The good, the bad and the ugly: Which ones matter and why? In Economics, Law and Political Science—Proceedings of the 4th International Conference on Economics, Political and Law Science; 2015; pp. 125–131. Available online: http://www.wseas.us/e-library/conferences/2015/Rome/EPLS/EPLS-15.pdf (accessed on 23 July 2020).
  19. Golev, A.; Corder, G.D.; Giurco, D.P. Barriers to Industrial Symbiosis Insights from the Use of a Maturity Grid. J. Ind. Ecolocy 2014, 19, 141–154. [Google Scholar] [CrossRef]
  20. Chertow, M.; Ehrenfeld, J. Organizing Self-Organizing Systems. J. Ind. Ecol. 2012, 16, 13–27. [Google Scholar] [CrossRef]
  21. Velenturf, A.P.M.; Jensen, P.D. Promoting Industrial Symbiosis: Using the Concept of Proximity to Explore Social Network Development. J. Ind. Ecol. 2016, 128, 116–130. [Google Scholar] [CrossRef] [Green Version]
  22. Taddeo, R.; Simboli, A.; Morgante, A. Implementing eco-industrial parks in existing clusters. Findings from a historical Italian chemical site. J. Clean. Prod. 2012, 33, 22–29. [Google Scholar] [CrossRef]
  23. Ashton, W.S.; Bain, A.C. Assessing the “Short Mental Distance” in Eco-Industrial Networks. J. Ind. Ecol. 2012, 16, 70–82. [Google Scholar] [CrossRef]
  24. Cerceau, J.; Mat, N.; Junqua, G.; Lin, L.; Laforest, V.; Gonzalez, C. Implementing industrial ecology in port cities: International overview of case studies and cross-case analysis. J. Clean. Prod. 2014, 74, 1–16. [Google Scholar] [CrossRef] [Green Version]
  25. Erkman, S. Industrial ecology: An historical view. J. Clean. Prod. 1997, 5, 1–10. [Google Scholar] [CrossRef]
  26. Li, X.; Li, X. Industrial Ecology and Industrial Symbiosis—Definitions and Development Histories. In Industrial Ecology and Industry Symbiosis for Environmental Sustainability; Palgrave Pivot: Sheffield, UK, 2018. [Google Scholar]
  27. Short, S.W.; Bocken, N.M.P.; Barlow, C.Y.; Chertow, M.R. From Refining Sugar to Growing Tomatoes. J. Ind. Ecol. 2014, 18, 603–618. [Google Scholar] [CrossRef]
  28. Van Beers, D.; Corder, G.; Bossilkov, A.; Van Berkel, R. Industrial symbiosis in the Australian minerals industry: The cases of Kwinana and Gladstone. J. Ind. Ecol. 2007, 11, 55–72. [Google Scholar] [CrossRef] [Green Version]
  29. Van Berkel, R.; Van Beers, D.; Bossilkov, A. Regional resource synergies for sustainable development: The case of Kwinana. In Proceedings of the Materials Forum; 2006. Available online: http://citeseerx.ist.psu.edu/viewdoc/download?doi=10.1.1.489.5811&rep=rep1&type=pdf (accessed on 2 July 2020).
  30. Harris, S. Industrial symbiosis in the Kwinana Industrial Area (Western Australia). Meas. Control 2007, 40, 239–244. [Google Scholar] [CrossRef]
  31. MacLachlan, I. Kwinana Industrial Area: Agglomeration economies and industrial symbiosis on Western Australia’s Cockburn Sound. Aust. Geogr. 2013, 44, 383–400. [Google Scholar] [CrossRef]
  32. Golev, A.; Corder, G.D.; Giurco, D.P. Industrial symbiosis in gladstone: A decade of progress and future development. J. Clean. Prod. 2014, 84, 421–429. [Google Scholar] [CrossRef]
  33. Yang, S.; Feng, N. A case study of industrial symbiosis: Nanning Sugar Co., Ltd. in China. Resour. Conserv. Recycl. 2008, 52, 813–820. [Google Scholar] [CrossRef]
  34. Zhu, Q.; Lowe, E.A.; Wei, Y.A.; Barnes, D. Industrial symbiosis in China: A case study of the Guitang Group. J. Ind. Ecol. 2007, 11, 31–42. [Google Scholar] [CrossRef]
  35. Yu, F.; Han, F.; Cui, Z. Evolution of industrial symbiosis in an eco-industrial park in China. J. Clean. Prod. 2015, 87, 339–347. [Google Scholar] [CrossRef]
  36. Wang, D.; Wang, Y.; Song, X. Evolution model with time lag effects for the coal industrial symbiosis system: A case study of Ordos, China. J. Clean. Prod. 2018, 187, 863–876. [Google Scholar] [CrossRef]
  37. Wang, Q.; Tang, H.; Qiu, S.; Yuan, X.; Zuo, J. Robustness of eco-industrial symbiosis network: A case study of China. Environ. Sci. Pollut. Res. 2018, 25, 27203–27213. [Google Scholar] [CrossRef] [PubMed]
  38. Liu, Z.; Adams, M.; Cote, R.P.; Geng, Y.; Chen, Q.; Liu, W.; Sun, L.; Yu, X. Comprehensive development of industrial symbiosis for the response of greenhouse gases emission mitigation: Challenges and opportunities in China. Energy Policy 2017, 102, 88–95. [Google Scholar] [CrossRef]
  39. Li, B.; Xiang, P.; Hu, M.; Zhang, C.; Dong, L. The vulnerability of industrial symbiosis: A case study of Qijiang Industrial Park, China. J. Clean. Prod. 2017, 157, 267–277. [Google Scholar] [CrossRef]
  40. Zhang, Y.; Zheng, H.; Fath, B.D. Ecological network analysis of an industrial symbiosis system: A case study of the Shandong Lubei eco-industrial park. Ecol. Modell. 2015, 306, 174–184. [Google Scholar] [CrossRef]
  41. Chertow, M.R.; Ashton, W.S.; Espinosa, J.C. Industrial symbiosis in Puerto Rico: Environmentally related agglomeration economies. Reg. Stud. 2008, 42, 1299–1312. [Google Scholar] [CrossRef]
  42. Neves, A.; Godina, R.; Carvalho, H.; Azevedo, S.G.; Matias, J.C.O. Industrial Symbiosis Initiatives in United States of America and Canada: Current Status and Challenges. In Proceedings of the 2019 8th International Conference on Industrial Technology and Management, Cambridge, UK, 2–4 March 2019; pp. 247–251. [Google Scholar]
  43. Chertow, M.; Miyata, Y. Assessing collective firm behavior: Comparing industrial symbiosis with possible alternatives for individual companies in Oahu, HI. Bus. Strateg. Environ. 2011, 20, 266–280. [Google Scholar] [CrossRef]
  44. Chertow, M.R.; Lombardi, D.R. Quantifying economic and environmental benefits of co-located firms. Environ. Sci. Technol. 2005, 39, 6535–6541. [Google Scholar] [CrossRef] [Green Version]
  45. Ashton, W. Understanding the organization of industrial ecosystems: A social network approach. J. Ind. Ecol. 2008, 12, 34–51. [Google Scholar] [CrossRef]
  46. Fraccascia, L.; Magno, M.; Albino, V. Business models for industrial symbiosis: A guide for firms. Procedia Environ. Sci. Eng. Manag. 2016, 3, 83–93. [Google Scholar]
  47. Fraccascia, L.; Giannoccaro, I.; Albino, V. Business models for industrial symbiosis: A taxonomy focused on the form of governance. Resour. Conserv. Recycl. 2019, 146, 114–126. [Google Scholar] [CrossRef]
  48. Chertow, M. Dynamics of Geographically Based Industrial Ecosystems. In The Dynamics of Regions and Networks in Industrial Ecosystems; Edward Elgar Publishing: Cheltenham, UK, 2009; pp. 13–29. [Google Scholar]
  49. ElMassah, S. Industrial symbiosis within eco-industrial parks: Sustainable development for Borg El-Arab in Egypt. Bus. Strateg. Environ. 2018, 27, 884–892. [Google Scholar] [CrossRef]
  50. Boix, M.; Montastruc, L.; Pibouleau, L.; Azzaro-Pantel, C.; Domenech, S. Industrial water management by multiobjective optimization: From individual to collective solution through eco-industrial parks. J. Clean. Prod. 2012, 22, 85–97. [Google Scholar] [CrossRef] [Green Version]
  51. Afshari, H.; Farel, R.; Peng, Q. Challenges of value creation in Eco-Industrial Parks (EIPs): A stakeholder perspective for optimizing energy exchanges. Resour. Conserv. Recycl. 2018, 139, 315–325. [Google Scholar] [CrossRef]
  52. Paquin, R.L.; Busch, T.; Tilleman, S.G. Creating economic and environmental value through industrial symbiosis. Long Range Plann. 2015, 48, 95–107. [Google Scholar] [CrossRef]
  53. Kurdve, M.; Jönsson, C.; Granzell, A.S. Development of the urban and industrial symbiosis in western Mälardalen. Procedia CIRP 2018, 73, 96–101. [Google Scholar] [CrossRef]
  54. Mulder, K.; Kaijser, A. The dynamics of technological systems integration: Water management, electricity supply, railroads and industrialization at the Göta Älv. Technol. Soc. 2014, 39, 88–99. [Google Scholar] [CrossRef]
  55. Evans, S.; Benedetti, M.; Holgado, M. Library of Case Studies. Available online: https://maestri-spire.eu/symbiosis-space/library-case-studies/ (accessed on 23 July 2020).
  56. Jianhua, Y.; Zhaohua, W. Material flows pathway in industrial ecosystem: A case study of Nanning Sugar Group in China. In Proceedings of the 2008 IEEE International Conference on Service Operations and Logistics, and Informatics; 2008. Available online: https://ieeexplore.ieee.org/document/4686597/similar#similar (accessed on 1 September 2020).
  57. Geng, Y.; Zhang, L.; Chen, X.; Xue, B.; Fujita, T.; Dong, H. Urban ecological footprint analysis: A comparative study between Shenyang in China and Kawasaki in Japan. J. Clean. Prod. 2014, 75, 130–142. [Google Scholar] [CrossRef]
  58. Ohnishi, S.; Dong, H.; Geng, Y.; Fujii, M.; Fujita, T. A comprehensive evaluation on industrial & urban symbiosis by combining MFA, carbon footprint and emergy methods—Case of Kawasaki, Japan. Ecol. Indic. 2017, 73, 315–324. [Google Scholar]
  59. Dong, H.; Ohnishi, S.; Fujita, T.; Geng, Y.; Fujii, M.; Dong, L. Achieving carbon emission reduction through industrial & urban symbiosis: A case of Kawasaki. Energy 2014, 64, 277–286. [Google Scholar]
  60. Costa, I.; Ferrão, P. A case study of industrial symbiosis development using a middle-out approach. J. Clean. Prod. 2010, 18, 984–992. [Google Scholar] [CrossRef]
  61. Dong, L.; Liang, H.; Zhang, L.; Liu, Z.; Gao, Z.; Hu, M. Highlighting regional eco-industrial development: Life cycle benefits of an urban industrial symbiosis and implications in China. Ecol. Modell. 2017, 361, 164–176. [Google Scholar] [CrossRef]
  62. ENEA. Experiences of Industrial Symbiosis in Italy; ENEA: Rome, Italy, 2014. [Google Scholar]
  63. Wahrlich, J.; Simioni, F.J. Industrial symbiosis in the forestry sector: A case study in southern Brazil. J. Ind. Ecol. 2019, 1–13. [Google Scholar] [CrossRef]
  64. Earley, K. Industrial symbiosis: Harnessing waste energy and materials for mutual benefit. Renew. Energy Focus 2015, 16, 75–77. [Google Scholar] [CrossRef]
  65. Shi, L.; Chertow, M. Organizational Boundary Change in Industrial Symbiosis: Revisiting the Guitang Group in China. Sustainability 2017, 9, 1085. [Google Scholar]
  66. Fang, Y.; Côté, R.P.; Qin, R. Industrial sustainability in China: Practice and prospects for eco-industrial development. J. Environ. Manag. 2007, 83, 315–328. [Google Scholar] [CrossRef] [PubMed]
  67. Verguts, V.; Dessein, J.; Dewulf, A.; Lauwers, L.; Werkman, R.; Termeer, C.J.A.M. Industrial symbiosis as sustainable development strategy: Adding a change perspective. Int. J. Sustain. Dev. 2016, 19, 15–35. [Google Scholar] [CrossRef]
  68. Vladimirova, D.; Miller, K.; Evans, S. Scaler Deliverable 2.1:Lessons Learn and Best Practices for Enhancing Industrial Symbiosis in the Process Industry. 2018. Available online: https://www.scalerproject.eu/wp-content/uploads/2019/07/Lessons-Best-practices-SCALER-D2.2.pdf (accessed on 16 September 2020).
  69. Bain, A.; Shenoy, M.; Ashton, W.; Chertow, M. Industrial symbiosis and waste recovery in an Indian industrial area. Resour. Conserv. Recycl. 2010, 54, 1278–1287. [Google Scholar] [CrossRef]
  70. Zhe, L.; Yong, G.; Hung-Suck, P.; Huijuan, D.; Liang, D.; Tsuyoshi, F. An emergy-based hybrid method for assessing industrial symbiosis of an industrial park. J. Clean. Prod. 2016, 114, 132–140. [Google Scholar] [CrossRef]
  71. Zhang, Y.; Duan, S.; Li, J.; Shao, S.; Wang, W.; Zhang, S. Life cycle assessment of industrial symbiosis in Songmudao chemical industrial park, Dalian, China. J. Clean. Prod. 2017, 158, 192–199. [Google Scholar] [CrossRef]
  72. Rosa, M.; Beloborodko, A. A decision support method for development of industrial synergies: Case studies of Latvian brewery and wood-processing industries. J. Clean. Prod. 2015, 105, 461–470. [Google Scholar] [CrossRef]
  73. Jacobsen, N.B. Industrial Symbiosis in Kalundborg, Denmark: A Quantitative Assessment of Economic and Environmental Aspects. J. Ind. Ecol. 2006, 10, 239–255. [Google Scholar] [CrossRef]
  74. Velenturf, A.P.M. Promoting industrial symbiosis: Empirical observations of low-carbon innovations in the Humber region, UK. J. Clean. Prod. 2016, 128, 116–130. [Google Scholar] [CrossRef]
  75. Park, H.S.; Rene, E.R.; Choi, S.M.; Chiu, A.S.F. Strategies for sustainable development of industrial park in Ulsan, South Korea-From spontaneous evolution to systematic expansion of industrial symbiosis. J. Environ. Manag. 2008, 87, 1–13. [Google Scholar] [CrossRef]
  76. Taddeo, R.; Simboli, A.; Morgante, A.; Erkman, S. The Development of Industrial Symbiosis in Existing Contexts. Experiences From Three Italian Clusters. Ecol. Econ. 2017, 139, 55–67. [Google Scholar] [CrossRef]
  77. United Nations Industrial Development Organization. An International Framework for Eco-Industrial Parks; The World Bank Group: Washington, DC, USA, 2017. [Google Scholar]
  78. Molinier, R.; Costa, P. Da Infrastructure Sharing Synergies and Industrial Symbiosis: Optimal Capacity Oversizing and Pricing. J. Ind. Intell. Inf. 2019, 1, 24–32. [Google Scholar]
  79. Meneghetti, A.; Nardin, G. Enabling industrial symbiosis by a facilities management optimization approach. J. Clean. Prod. 2012, 35, 263–273. [Google Scholar] [CrossRef]
  80. Domenech, T.; Bleischwitz, R.; Doranova, A.; Panayotopoulos, D.; Roman, L. Mapping Industrial Symbiosis Development in Europe_ typologies of networks, characteristics, performance and contribution to the Circular Economy. Resour. Conserv. Recycl. 2019, 141, 76–98. [Google Scholar] [CrossRef]
  81. Henriques, J.; Azevedo, J.; Dias, R.; Estrela, M.; Ascenço, C. Industrial Symbiosis Incentives: Mitigating Risks for Facilitated Implementation. 2020. Available online: https://zenodo.org/record/3964127#.YBrXvuj7Q2w (accessed on 14 September 2020).
  82. Mirata, M.; Pearce, R. Industrial symbiosis in the UK. 2006. Available online: https://www.researchgate.net/profile/Murat_Mirata/publication/252394796_Industrial_Symbiosis_in_the_UK/links/5695fe7208ae425c6898691e.pdf (accessed on 14 September 2020).
  83. Doroteya Vladimirova, K.M. Enablers and barriers for industrial symbiosis: Lessons learnt from twenty-five case studies. In The Routledge Handbook of Waste, Resources and the Circular Economy; Taylor & Francis Ltd.: Oxford, UK, 2020. [Google Scholar]
  84. Fichtner, W.; Tietze-Stöckinger, I.; Frank, M.; Rentz, O. Barriers of interorganisational environmental management: Two case studies on industrial symbiosis. Prog. Ind. Ecol. 2005, 2, 73–88. [Google Scholar] [CrossRef]
  85. Park, J.; Duque-Hernández, J.; Díaz-Posada, N. Facilitating business collaborations for industrial symbiosis: The pilot experience of the sustainable industrial network program in Colombia. Sustainbility 2018, 10, 3637. [Google Scholar] [CrossRef] [Green Version]
  86. Maqbool, A.S.; Piccolo, G.E.; Zwaenepoel, B.; Van Eetvelde, G. A heuristic approach to cultivate symbiosis in industrial clusters led by process industry. In Proceedings of the Smart Innovation, Systems and Technologies; Springer: Berlin/Heidelberg, Germany, 2017. [Google Scholar]
  87. European Commission. Cooperation Fostering Industrial Symbiosis Market Potential, Good Practice and Policy Actions. 2018. Available online: https://op.europa.eu/en/publication-detail/-/publication/174996c9-3947-11e8-b5fe-01aa75ed71a1/language-en (accessed on 2 June 2020).
  88. Laybourn, P.; Morrissey, M. The Pathway To A Low Carbon Sustainable Economy, National Industrial Symbiosis Programme; International Synergies: Bristol, UK, 2009. [Google Scholar]
  89. Krese, G.; Dodig, V.; Lagler, B.; Strmčnik, B.; Podbregar, G. Best Practices for Adopting the Industrial Symbiosis Concept in the Cement Sector. In Proceedings of the 1st International Conference on Technologies & Business Models for Circular Economy, Portorož, Slovenia, 5–7 September 2018; pp. 223–237. [Google Scholar]
  90. Ramsheva, Y.; Remmen, A. Industrial Symbiosis in the Cement Industry—Exploring the Linkages to Circular Economy. 2018, pp. 35–53. Available online: https://vbn.aau.dk/en/publications/industrial-symbiosis-in-the-cement-industry-exploring-the-linkage (accessed on 14 July 2020).
  91. Lessard, L.; Laffely, J. Scaler Deliverable 3.3: Synergies Environmental Impact Assessment. 2019. Available online: https://www.scalerproject.eu/wp-content/uploads/2019/10/Synergies-environmental-impact-assessment-SCALER-D3.3.pdf (accessed on 23 September 2020).
  92. Quintana, J. Scaler Deliverable 3.4: Synergies Socio-Economic Impact Assessment. 2019. Available online: https://www.scalerproject.eu/wp-content/uploads/2019/10/Synergies-socio-economic-impact-assessment-SCALER-D3.4.pdf (accessed on 23 September 2020).
  93. Fraccascia, L.; Yazdanpanah, V.; van Capelleveen, G.; Yazan, D.M. Energy-based industrial symbiosis: A literature review for circular energy transition. Environ. Dev. Sustain. 2020. Available online: https://link.springer.com/article/10.1007/s10668-020-00840-9#citeas (accessed on 26 September 2020).
  94. Bacudio, L.R.; Benjamin, M.F.D.; Eusebio, R.C.P.; Holaysan, S.A.K.; Promentilla, M.A.B.; Yu, K.D.S.; Aviso, K.B. Analyzing barriers to implementing industrial symbiosis networks using DEMATEL. Sustain. Prod. Consum. 2016, 7, 57–65. [Google Scholar] [CrossRef]
  95. Jensen, P.D.; Basson, L.; Hellawell, E.E.; Bailey, M.R.; Leach, M. Quantifying “geographic proximity”: Experiences from the United Kingdom’s National Industrial Symbiosis Programme. Resour. Conserv. Recycl. 2011, 55, 703–712. [Google Scholar] [CrossRef] [Green Version]
  96. Leong, Y.T.; Lee, J.Y.; Tan, R.R.; Foo, J.J.; Chew, I.M.L. Multi-objective optimization for resource network synthesis in eco-industrial parks using an integrated analytic hierarchy process. J. Clean. Prod. 2017, 143, 1268–1283. [Google Scholar] [CrossRef]
  97. European Commission. Waste Framework Directive—Directive 2008/98/EC. 2008. Available online: https://eur-lex.europa.eu/legal-content/EN/TXT/?uri=CELEX:32008L0098 (accessed on 23 September 2020).
  98. European Commission. Circular Economy Action Plan. 2020. Available online: https://ec.europa.eu/environment/circular-economy/pdf/new_circular_economy_action_plan.pdf (accessed on 14 July 2020).
  99. Diário da República. Plano de Ação para a Economia Circular em Portugal; Ministry of Environment: Lisbon, Portugal, 2017. [Google Scholar]
  100. European Commission. SPIRE Roadmap 2030; A.SPIRE: Brussels, Belgium, 2013. [Google Scholar]
  101. Taddeo, R. Local industrial systems towards the eco-industrial parks: The model of the ecologically equipped industrial areas. J. Clean. Prod. 2016, 131, 189–197. [Google Scholar] [CrossRef]
Figure 1. Schematization of the research strategy and the analytical procedures.
Sustainability 13 01723 g001
Figure 2. (a) IS approach, (b) Geographical distribution and (c) Number of published papers per year in the final sample.
Sustainability 13 01723 g002
Figure 3. Industrial Symbiosis streams characterization.
Sustainability 13 01723 g003
Figure 4. Enablers and barriers identification framework.
Sustainability 13 01723 g004
Figure 5. Framework of the enablers and barriers assessment.
Sustainability 13 01723 g005
Figure 6. Enablers and barriers heat diagram (Phase 1 results).
Sustainability 13 01723 g006
Figure 7. Enablers incidence analysis (Phase 2 results).
Sustainability 13 01723 g007
Figure 8. Barriers incidence analysis (Phase 2 results).
Sustainability 13 01723 g008
Table 1. Set of keywords.
Keywords
Industrial Symbiosis; enablers, barriers, drivers, incentives, challenges, key factors, critical factors, review, benefits, circular economy, emerging process, development, case, intervention, opportunities, approach, project, implementation, analysis, assessment, status.
Table 2. Characterization of case studies.
CasesDenomination CaseEconomics SectorCountrySource
CS1The Göta Älv region caseEnergySweden[54]
CS2The Nanning Sugar Co., Ltd., NanningAgribusiness, cementChina[33,55,56]
CS3The Kawasaki Eco-townMetal, paper, waste management, manufacturing, chemicalJapan[57,58,59]
CS4The Eco-Industrial Park, RizhaoChemical, manufacturing, cement, metal, logistic, paper industry, energy, agribusinessChina[35]
CS5The Relvão Eco Industrial Park, Municipality of Chamusca, PortugalPaper industry, waste management, agribusiness, chemical, paper industryPortugal[55,60]
CS6The Liuzhou city caseMetal (Iron and steel), cement, constructionChina[8,61]
CS7The symbiotic industrial district of GuayamaChemical (Refinery), construction, pharmaceutical, waste management, energyU.S.[41,44,55]
CS8The PODEBA caseAgribusiness, manufacturing (leather industry)Italy[62]
CS9The Forestry industry case in Santa CatarinaForestry sector, paper sectorBrazil[63]
CS10The Barceloneta cluster casePharmaceutical, energy, agribusiness, waste managementU.S.[41,45,55]
CS11The case of facilitated exchange in Northern Ireland (NISP)Chemical, agribusinessUK [55,64]
CS12The case of the Guitang GroupAgribusiness, chemical, paper industry, cementChina[34,65,66]
CS13The Jorf Lasfar PortLogisticMorocco[24]
CS14The Bejaïa PortLogistic, chemicalMorocco[24]
CS15The Koekhoven caseAgribusinessBelgium[67,68]
CS16The case of Kwinana Industrial areaMetal (Alumina, nickel, iron), oil (refinery, cement, chemicals (basics, fertilizers and pigment), Energy (power generation), water supply and treatmentAustralia[28,29,55]
CS17The case of Nanjangud Industrial Area (NIA)Waste management, agribusiness, chemical, textile, paper, minerals, oil and energyIndia[23,69]
CS18The case of Dalian Economic Development Area (DEDA)Chemical, manufacturing, metal (aviation metallurgy), logistic and bio-medicineChina[70,71]
CS19The breweries industry caseAgribusinessLatvia[72]
CS20The wood industry in Latvia caseForestry industry, chemical and energyLatvia[72]
CS21The Kalundborg industrial clusterEnergy, Chemical, Manufacturing, Construction, Waste managementDenmark[9,73]
CS22The Humber Region casePaper Industry (Pulp and paper), Wastes, Agribusiness, energyUK [3,55,74]
CS23The Hamburger Rieger GmbH casePulp and paper Industry, energyGermany[62]
CS24The British Sugar PlcAgribusiness, chemical, energy (power generation)UK[27]
CS25The Ulsan industrial parkChemical, Oil (Petro-chemical),South Korea[55,75]
CS26The Bussi Chemical Site caseChemicals (Basic, Pesticides, Silicates), Energy (Power generation and distribution), manufacturingItaly[22,76]
Table 3. Economic activities and sectors of the CS’s.
Economic SectorActivities Involved in the CS´s
Waste managementWaste management activities, MSW
AgribusinessSugar refining, agriculture, cane farming, horticulture, animal food production, food production
EnergyPower generation and distribution, heat exchanges
Paper IndustryPulp and paper production
ChemicalChemical refinery, basics, pesticides, silicates
LogisticPort industry, transport services
CementCement production
Forestry industryWood products (wood, chips, bark, sawdust and shaving)
ManufacturingEquipment, IT assembly industry, leather industry, textile, automotive
MetalIron and steel foundry
PharmaceuticalPharmaceutical production
OthersOil extraction, petro-chemical, oil refinery, water supply and treatment, construction
Table 4. Key enablers descriptors.
Key Enablers OverviewNomenDescription
SocialTrust environmentS1Openness relation between companies, sharing information and promoting trust between the involved parts
Environmental awarenessS2Knowledge at the company level, concern for the impacts of industrial activities on the environment
Spontaneous and self-organized approachS3Leaders, entrepreneurs, firms motivated by the implementation of concepts such as industrial ecology, willing to take the initiative
Internal and external network of the relation between companiesS4Networks that allow the creation of common spaces between companies, knowledges agents, government entities
Community Awareness & Education Activities ProgramsS5Interfaces and programs that relates the industries sides and the local community for sustainable development
EconomicOperational cost reductionE1Identification of saving in resources (mainly water, energy, raw material)
New business opportunitiesE2Incorporation of new revenues through the integration of new products and services that a synergy involves
Identification of saving in the waste managementE3Identification of savings, mainly in landfill tax, wastes management cost, etc.
National fundingE4Policy that promotes and allows to have National, regional and local funds to support circular economy (such as operational programs and projects)
Private contributionE5Banks and entities promoting private funds through innovations projects and initiatives in order to support industries and firms
PolicyPromotion of the industrial policyP1Desegregated industrial policy framework (Nacional, regional and local) that allows the implementation of synergies between industries through the simplification of waste declassification
Environmental tax policyP2Policy increase especially in landfill tax, CO2 emission control and wastes managements policies that banned the environmental impacts of industrial activities
Promotion of network and waste marketP3Promotion instrument to commercialized industrial wastes in simple method
Promotion of framework for CEP4Plans and policies that allow the implementation the Circular Economy in industrial activities
ManagementPromotion of protocols and formal agreementsM1Instruments that help to standardize and formalize the operation in synergies initiatives
Diversification of the traditional business approachM2Incorporation of new business approach that produces economic and environmental benefits
Promotion of spontaneous negotiation “one-to-one negotiations”M3Negotiations promoted in order to optimize operational costs and efficiency energy/resource efficiency
TechnologicalFacilities that allow the technological viability of synergyT1Components and facilities to improve the operations (equipment, treatment plants) and control (Laboratories)
Improving the process, incorporation of technologiesT2Increase the sustainability of the processes and adapting their industrial process for the valorisation and synergies
Network PromotionT3Technological networks that support the processes of matching and mimicking
Digitization of the industry through the transition to I4.0T4The technology improvement in industry will allow better control of production processes, data availability, wastes, resources
GeographicalGeographical proximityG1Short distances between the involved synergy elements
Strategic positionG2Defined by factors such as regions with strong industrial diversity or regions of national interest
Logistic networksG3Availability of infrastructure to improve the communication and transport of materials (high way, airport, and ports)
IntermediariesInvolvement of R&D institution and universitiesI1Promoters of knowledge transfer to the industry in order to consolidate the initiatives
Government involvementI2Increase the participation of government as a promoter of industrial sustainability (Diverse levels local, regional and national), aiming the transition to a less polluting industry
Anchor companies’ involvementI3Large companies with prestige and multinational presence involved in this type of initiatives
Regional and national entities promoting synergiesI4National/regional entities promoting IS practices, at various levels such as business, technological, strategic, etc.)
Table 5. Key barriers descriptors.
Key Barriers OverviewNomenDescription
SocialSocial InertiaS1Lack of interest, lack of motivation and resistance to change of the company elements (engineers, technical, managers)
Lack of trust environmentS2The self-interest or the competitive nature of certain industrial sector group the collaborative efforts
Conflicts of interestS3Conflicts interests between elements due the competitive nature (same sector or activity)
Lack of knowledge in industrial sustainabilityS4Presence of lack of knowledge at corporate, occupational and community that produce in lack of interest
EconomicLower, unclear or inexistence economic benefitsE1Struggle on the part of the firm to identify which flows can be taken advantage of in this type of initiatives
Instability in demand factorsE2Lack of stability in demand factors, which ends up directly affecting the supply chain
Low costs associated with waste disposalE3Low prices of disposal methods, especially in landfill waste
Lack of financing funds (private or public)E4Availability of fund in order to support the creation of synergies, especially for the acquisition of equipment, utilities and others.
Market immaturityE5The market itself could be inadequately prepared for the incorporation of IS (economically and environmentally)
PolicyExistence of regulation and frameworkP1Specific approach that limits the creation of symbiotic exchanges (e.g., water and energy regulation) or limits the use of waste, requiring complex declassification processes
High complicate bureaucratic proceduresP2Struggle to acquire permits to implement symbiotic exchange
Uncertainty in the approach of the future policyP3The direction of national framework and politics towards the environment, waste management and industrial ecology
ManagementLimited resourcesM1Lack of human and technical resources being available to seek out and understand the potential avenues for waste streams
Implementation unviabilityM2The transition to an IS system initiative a multitude of changes across all dimensions (technical, management, geographical, etc.) with a variety of levels of how major they are considered
Lack of protocols and formal agreementsM3Lack of formals procedures to initiate the synergies planning process
TechnologicalLack of knowledge or nonexistence (commercially) of reliable material recovery technologiesT1Lack of commercial availability of technologies or impossibility of acquisition because the high prices
Lack of investmentT2Appropriate investment in technologies and skilled technologists, engineers and IT specialists
Integration problemT3Technologies and procedures integration problem
Lack of quality materialsT4Lack of sufficient inputs of the right quality at a predictable flow rate
GeographicalLong distances between the involved companiesG1Long distances that reduce the economic viability of the symbiotic exchanges
Lack of infrastructureG2Utilities, services, and facilities (Logistic network)
IntermediariesLack of intermediariesI1Lack of coordination that helps to undertake, support the consolidation of the initiative
Poor communicationsI2Lack of communication and continuous dialogue between the involved companies
Lack of participative networkI3Liking different interesting part in the implementation of IS, such as policy actors, community, knowledge agents, and industries
Table 6. Generic recommendations for symbiosis implementation per economic sector.
Generic Recommendations
Waste management
  • Strengthen the relationships between industries and waste management companies. With this purpose, participation in collaborative networks, clusters, and associations has proven to be an important facilitator
  • Promotion of the policy framework is essential for waste management. Companies and policy actors should work together in order to simplify processes and improve negotiations (e.g., waste market)
  • The promotion of formal protocols and agreements will help to simplify the negotiation process in an initial phase ensuring the long-term commitment and overcome conflicts of interest
Agribusiness
  • Strengthen the participation and partnerships with knowledge agents, such as R&D entities will help the synergies planning process (Promoting practice-oriented research)
  • Promotion of sectoral financing programs could be a valuable tool to overcome barriers, such as lack of financing, payback time, and initial investment
  • Reinforce the participation and long-term commitment trough collaborative networks, cluster and associations in order to overcome social barriers
  • Promotion of dissemination and training programs that bring the community, local government, and firms to work together
  • Reinforce the negotiation process through formal protocols and agreements to simplify the initiatives in an initial phase
Energy
  • Promote trust environment between stakeholders, through collaborative networks, clusters, and associations in order to overcome social barriers
  • Promotion of financing funds (private or public) is a fundamental tool to overcome the economic barriers
  • Geographical proximity is essential due to technical specificities of energetic synergies. In the development of synergies, geographical proximity should be an important factor to consider in order to ensure the synergies feasibility
  • Encourage the participation of regional and government entities (e.g., development agencies and, energy agencies)
Paper Industry
  • Promote sectoral funds, financing programs (Private and public), R&D projects, and economic incentives in order to overcome economic barriers
  • Geographical proximity should be an important factor to consider due to volumes to be directed in the flows. The promotion of partnerships and agreements with logistics companies will also help consolidate this process
  • Encouraging the government role as a driven for IS, through action plans, clustering actions, and awareness-raising (training and dissemination actions)
Chemical
  • Promote policies that simplify the by-product classification process have proven to be an important mobilizer in this sector
  • Promotion of strategic partnership and formal protocols with logistics companies in order to overcome geographical limitations
  • Encouraging the government role as a driven for IS, through action plans, clustering actions, and awareness-raising (training and dissemination actions)
  • Promotion of sectoral financing programs could be a valuable tool to overcome barriers, such as lack of financing, payback time, and initial investment
  • Promote trust environment between stakeholders through collaborative networks, clusters, and associations in order to overcome social barriers
Logistic
  • The distance travelled could make synergies economically unfeasible, in this regard the development and promotion of mechanisms (methodologies and tools.) that allow measuring the synergy value could be a useful tool
  • Reinforce the participation of intermediaries and promoters, such as government entities and companies have proven fundamental. Encourage approximation between industries and logistics companies through strategic partnerships
  • The promotion of collaborative and participatory networks will support to engage more stakeholders and promote interaction, overcoming social barriers
Cement
  • Promotion of collaborative and participatory networks will increase awareness on the opportunities offered by the cement sector (incentivize collaboration between anchor companies and government)
  • Promotion of sectoral financing programs and economic incentives for synergies achievement
  • Promote practice-oriented research and collaboration between knowledge agents, can support to demonstrate the potential of the sector and create awareness
  • The promotion of formal protocols and agreements will help to simplify the initiatives in an initial phase and ensure the long-term commitment
Manufacturing
  • Promotion of framework supporting IS, with special focus on simplifying by-product classification process
  • Promote sectoral funding or economic incentives to allow the acquisition of infrastructure, utilities, and services required for developing synergies
  • Boost partnership and formal protocols between logistics companies and industries, in order to overcome geographical limitations
  • Encouraging the government role as a driven for IS, through action plans, clustering actions, and awareness-raising (training and dissemination actions)
Metal
  • The involvement of government entities is fundamental, not only as policy promoters but also as mobilizers of initiatives for the approximation between various industrial actors. Collaborative networks have proven to be a valuable tool for this purpose
  • Promotion of framework supporting IS, with special focus on simplify the by-product classification process and promote sectoral financing
  • Promote the participation and collaboration between knowledge agents (R&D units and universities) and industries to perform specialized studies that allow the standardization of sectoral synergies
Pharmaceutical
  • Promotion internal organizational IS structure dedicated to explore and drive synergistic opportunities
  • The promotion of formal protocols and agreements will help to simplify the initiatives in an initial phase and ensure the long-term commitment
  • Promotion of partnerships with logistics companies in order to overcome geographical limitations
Publisher’s Note: MDPI stays neutral with regard to jurisdictional claims in published maps and institutional affiliations.

