Article

Developing a Product Knowledge Graph of Consumer Electronics to Manage Sustainable Product Information

Department of Library and Information Science, Chung-Ang University, 84 Heukseok-ro, Dongjak-gu, Seoul 06974, Korea
Sustainability 2021, 13(4), 1722; https://doi.org/10.3390/su13041722
Submission received: 30 November 2020 / Revised: 26 January 2021 / Accepted: 1 February 2021 / Published: 5 February 2021

Abstract

:
Transformational computing paradigms, such as artificial intelligence, home automation, and the Internet of Things, are being rapidly applied to consumer electronics products, thus aiding in the development of integrated and innovative features. Hence, ubiquitous computing and electronic devices are increasingly becoming essential to everyday life. In this context, a wide gulf often exists between the capabilities and technical features of consumer electronic devices and the consumers’ understanding of such devices and ability to operate them correctly and effectively. This study proposes a machine-readable knowledge model representing technical terms in product specifications along with a product knowledge graph to discover semantic relationships among various products. Formal concept analysis is applied to conceptually analyze the specification terms of heterogeneous electronic products and design a hierarchical knowledge structure of extracted concepts, to elaborate the proposed knowledge model.

1. Introduction

According to Growth from Knowledge [1], manufacturers are presenting new consumer electronics with innovative features, and consumers prefer premium home appliances that provide convenient and unique experiences. Nonetheless, consumers tend to find it necessary to apply some effort in understanding such devices. For instance, consider a modern television remote control with a dozen or more buttons that no one in some households can remember ever using. In general, manufacturers provide product specifications or manuals, and retailers selectively provide consumers with key features of their products. A specification refers to detailed precise requirements that have to be satisfied by a product or service. A product technical specification often refers to a particular document to explicitly state technical standards in detail (https://tinyurl.com/yyzv3qjm (accessed on 10 October 2020)). It provides the main facts of a product, so that any audience, from development teams to customers, can precisely understand the features and capabilities of the product.
Information contained in specifications or manuals, however, is often insufficient [2]. First, such specifications tend to be difficult for many consumers to understand because they are written using technical terms [3]. Consumers tend to understand products based on their usages, such as connecting to the Internet or watching a movie; however, most specifications provide technical information on product capacities without sufficient natural language description. Second, the terms in product specifications are not yet standardized. Equivalent information is often expressed in different terms and values depending on manufacturers [4]. For example, the frame interpolation techniques of Samsung and LG TVs are marked as Auto Motion Plus and TruMotion 100, respectively; therefore, it is difficult to compare them. Third, it commonly remains difficult to check the compatibility of different devices [3]. For instance, checking whether high-definition videos on a Samsung Galaxy S20 (Samsung) are properly displayed on an OLED TV (LG) using only the specifications might be a difficult task. If manufacturers use standard vocabulary, it will be easier to judge the compatibility between heterogeneous products.
Knowledge graphs are one approach to resolve this limitation. They define the meaning of machine-readable vocabulary, and can express relationships between the vocabulary terms [5]. Since Google applied knowledge graph technology to search [6], there has been a trend of providing large-scale data in various domains as knowledge graphs [5]. Numerous studies continue to be conducted in the field of consumer electronics, much of which focuses on providing taxonomy (https://www.google.com/basepages/producttype/taxonomy.en-US.txt (accessed on 10 October 2020)) and categorizing consumer electronics or enabling product search functions. Several studies have proposed ontology models for home appliances [7]. Meanwhile, as electronic devices become diversified and product functions more complex, knowledge models can enable the representation of comprehensive vocabularies and their relationships, using a hierarchical structure ordering relations among various vocabularies. Formal concept analysis (FCA) has been applied to analyze and design such systems. FCA is a mathematical data analysis technique based on lattice and order theory [8], which extracts concepts from binomial relationships between objects and attributes, and constructs hierarchical structures of levels of relationships between concepts. FCA has been applied to various fields [9,10], and is especially used in object-oriented domain modelling [11] and ontology construction with hierarchical concept structures [12,13]. Based on such prior research, this study extracts common vocabularies from a list of product specifications using FCA techniques and elaborates a set of derived formal concepts to design the proposed knowledge model.
This study introduces a knowledge model, representing technical specifications of electronic products at a semantic level. A set of technical terms are extracted from collected specification datasets, and relationships between products and technical terms, which are used in product specifications, are analyzed. In particular, conceptual analysis is conducted to discover common vocabularies among various electronic devices; furthermore, a knowledge model is designed using common formal concepts extracted by this analysis.
The remainder of this study is organized as follows. Section 2 describes some related work, and Section 3 briefly outlines the proposed approach. Section 4 introduces FCA with a theoretical background. Section 5 describes the results of our conceptual analysis of aggregated datasets. Section 6 presents a knowledge model for expressing various product specifications, used to transform a product knowledge graph. Section 7 describes the evaluation results on five use cases, employing product knowledge graphs. Finally, Section 8 presents our conclusions.

2. Related Work

A knowledge graph encodes data in the form of graph structures, capturing relationships between entities in a flexible style [3,5]. Early research on knowledge graphs focused on general knowledge and common sense, such as Dbpedia [14] and Wikidata [15]. Such knowledge graphs are mainly aimed at expressing basic social and geographical information, such as well-known people, cities, countries, and airports. Recently, knowledge graphs have been rapidly applied by businesses. Google and Bing’s search engines are representative examples of applying knowledge graphs [16], while Google Home and Amazon Alexa use knowledge graphs in virtual assistant services [17].
In the field of e-commerce, knowledge graphs are applied in product search and recommendation. Research has been conducted on representing product information with ontology models such as GoodRelations [18], Consumer Electronics Ontology [7], and Schema.org [19,20]. Furthermore, various studies have been conducted to establish large-scale knowledge graphs at a commercial level. Ontology-based product data management (OPDM) has been demonstrated using several types of ontology as an extension of GoodRelations. Home appliances, such as vacuum cleaners, televisions, and tablet PCs, have been incorporated into vocabularies. Currently, these vocabularies are able to represent some of the general characteristics of consumer products; nevertheless, they are subject to limitations in expressing specifications at a detailed level. For example, according to the television vocabulary (http://www.ebusiness-unibw.org/ontologies/opdm/television.html#HDMI (accessed on 10 October 2020)), the obk:HDMI class can express the HDMI function in an xsd:boolean format, which is unable to describe the role, capacity, or relationships of other vocabularies on a specification. The related vocabulary of OPDM is designed similarly. Meanwhile, the product class of Schema.org can be used for describing products and services. However, this class aims to describe the basic metadata of a product (e.g., brand, global trade item number, logo, model, and offers). The knowledge model proposed in this study is designed to semantically describe technical terms expressed in specifications for electronic products, and aims define relevant technical terms as well as their capacities and semantic interrelations.
Zhu et al. proposed a runtime knowledge graph for home automation and introduced conceptual models for representing relationships between Internet of Things devices for smart home application development [21]. Mitsubishi Electric Corporation developed a compact AI knowledge representation and reasoning solution for human–machine interfaces, which is powered by a knowledge graph integrating user information and device specifications [22]. Xu et al. introduced a product knowledge graph for e-commerce, defining a set of key entities from product information and various product relations [23]. This knowledge graph evaluated the performance on knowledge completion, and used search rankings and recommendations from http://grocery.walmart.com (accessed on 10 October 2020). Moreover, Alonso et al. introduced a commercial knowledge graph of http://walmart.com (accessed on 10 October 2020), aiming to aid users to search for products by discovering the relationships between products, brands, and categories [23]. Amazon also uses a product graph to answer user questions about products and related knowledge [5,24]. In particular, they introduced a practical broad graph approach to describe general facts by extracting product profiles from the Web. This graph does not represent full-fledged semantics, because it lacks references for product knowledge, and has difficulty curating new products along with broad categories of products.
FCA is a mathematical model for deriving a concept hierarchy from a collection of objects and their attributes [25,26]. It is an applied branch of lattice theory [27,28], and has become popular for knowledge representation and data analysis since 1980 [29]. FCA has been widely adopted in the design and construction of ontology models [30,31,32,33,34]. Recently, Ferré and Cellier proposed a method to reconstruct a binary context using a hypergraph based on a notion of pattern basis [34]. González and Hogan introduced a framework for calculating an ontology schema from a large-scale knowledge graph using FCA. They proposed lightweight structures to build a concept hierarchy, and evaluated their algorithms against the Wikidata dataset [35]. In addition, embedding techniques have been adopted to enhance classical concept analysis [36,37]. In this study, FCA on product types and specification terms is applied to discover the relationships between vocabularies, and used to define a hierarchical knowledge model structure.

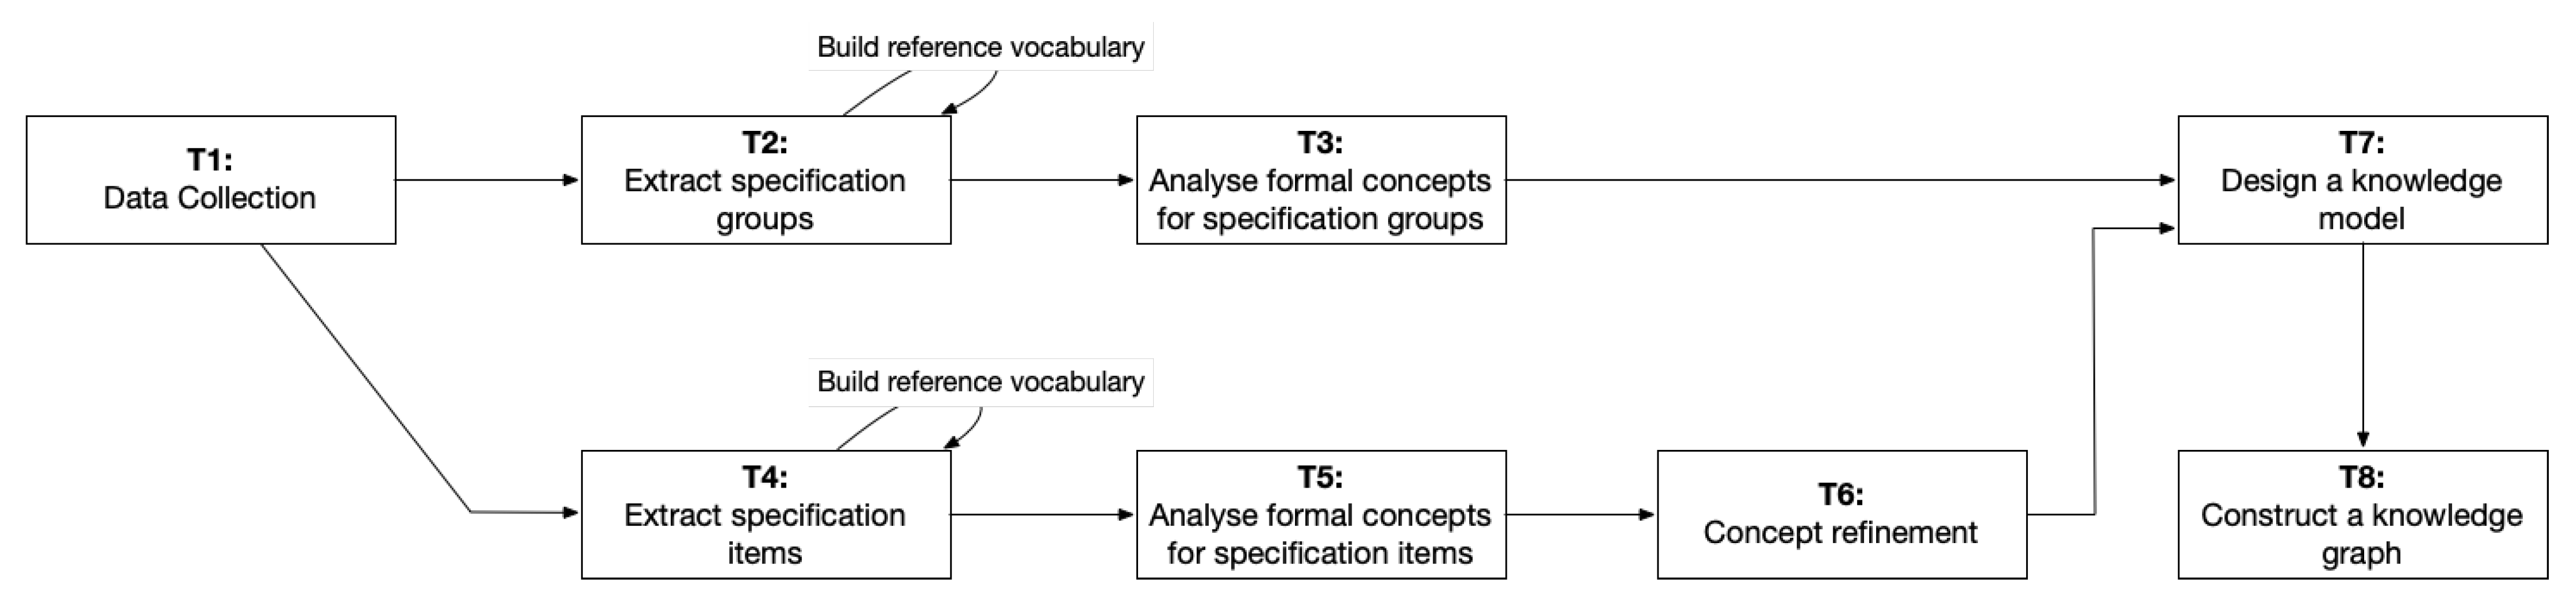
3. A Development Process of a Knowledge Graph

In general, a product specification comprises a set of technical items. As shown in Figure 1 as an example, a ‘FEATURES’ specification for a consumer device consists of a group of specification items. This example includes eight functions (items); here, individual functions are expressed as function names and values. Each specification has one or more specification groups, and each group has various specification items.
The development of the product knowledge graph was divided into two steps. First, terms in the specifications were extracted and analyzed in a formalized process; then, the knowledge graph was constructed. Analyzing the technical terms involves the extraction of vocabularies from heterogeneous product specifications, definition of common vocabularies, and application of common vocabularies between products. The specification vocabularies were analyzed at the level of groups (T2–T3) and items (T4–T6). When specification groups and items were extracted from the collected dataset (T1), redundancy was removed and refined for comprehensive vocabularies to establish a reference vocabulary (T2 and T4). However, because the number of specification items was large and there were many similar clusters, the analysis target was specified through refinement work (T6). The specification groups and items obtained through FCA (T3 and T5) were applied to design and transform the knowledge model. First, the classes and hierarchical structures of the knowledge model were defined. Then, the specification vocabularies, which were extracted from the collected specifications, applied common specification groups and items appropriate to the product types (T7). Finally, a product knowledge graph was created (T8). The analytical process of this study is summarized in Figure 2.

4. Formal Concept Analysis

4.1. Background

FCA is a mathematical model, defining attributes of concepts and creating a conceptual hierarchy based on the interdependence relations of attributes [27]. The basic structure of FCA is context. Context consists of a set of objects, a set of attributes or properties, and relationships between objects and attributes. More formally, a formal definition of context as follows:
Definition 1.
Formal context K = ( G , M , I ) , where G is a set of objects, M refers to a set of attributes, and  I G × M represents the binary relation between G and M. In other words, the elements of G and M represent the objects of the context and properties that each object can have. For an object g with an attribute m, the relation is represented by g I m or ( g , m ) I , meaning that g has m.
Such a formal context can be represented in the form of a matrix. The head of the rows and columns of the table is composed of objects and attributes. For each cell of the table, if the object and attribute related to the cell satisfy the binary relationship I, the cell is denoted by ‘X’; otherwise, it is left blank. Table 1 shows an example context table comprising the following products g = {‘Air Conditioner’, ‘Cell phone’, ‘Monitor’, ‘TV’, ‘Washer’} and their attributes as specification items m = {‘display’, ‘filter’, ‘hdmi’, ‘wifi’}.
A list of formal concepts is extracted from the formal context. Each concept is defined as a pair of the form (O, A), and a more formal definition is obtained as follows.
Definition 2.
For an arbitrary context K = ( G , M , I ) , when O G and A M , if intent(O) = A extent(A) = O is satisfied, ( O , A ) is called a formal concept. The following is also satisfied. Intent(O):= { a M | o O : ( o , a ) I }, extent(A):= { o i n G | a A : ( o , a ) I }.
The formal concept ( O , A ) is defined by the Galois connection consisting of intent and extent; by intent(O) and extent(A); and by the set of attributes common to all objects of O and attributes of A. The list of concepts in Table 2, which is extracted from Table 1, shows how the upper and lower hierarchal order relations can be defined based on extent or intent.
Definition 3.
For any concept ( O 1 , A 1 ), ( O 2 , A 2 ) of a given context K = ( G , M , I ) , the upper-lower concept relationship ( O 1 , A 1 ) ( O 2 , A 2 ) is a type of partial order relation, defined as follows. ( O 1 , A 1 ) ( O 2 , A 2 ) O 1 O 2 ( A 1 , A 2 ) .
This concept has the characteristics of hierarchical structure in that it has fewer extents than the upper concepts, while simultaneously having larger intents. The upper-lower concept relationship (≤) between concepts is a partially ordered set called a concept lattice or Galois lattice [8]. Figure 3 shows a concept lattice corresponding to the formal context that is represented in Table 1. The lines in Figure 3 indicate hierarchical relationships: from top (most general) to bottom (most specific). C 2 is a subconcept of C 4 . The extension of C 2 is T V , and the extension of C 4 is {Cell phone, Monitor, TV}. Meanwhile, the intent of C 2 is {display, filter, hdmi}; however, the intent of C 4 has {display, hdmi} without ‘filter’. In this study, the Galois lattice hierarchical structure is used to analyze the functions that electronic products have in common. In other words, ‘display’ in C 7 can be interpreted as a function or feature provided by all products in a given context.

4.2. Concept Refinement

Each formal concept has a different number of products and specification terms. Note that a significance of concepts can be evaluated by measuring occurrences of objects and attributes within each. A significance score of a concept S ( c ) is computed by using both the absolute and relative frequencies of the extents and intents within each concept modified from [38].
S ( c ) = 1 N i = 1 k = 1 A ( o i a k ) × R ( o i a k ) × 1 100
where A ( o i a k ) is the absolute frequency of attributes a k of the object o i in cluster c, and  R ( o i a k ) is the normalized frequency of the attributes of objects o i in this concept. Thus, to obtain S ( c ) in each cluster, the absolute and relative occurrence of each attribute are multiplied, and a score is summed for each object. The objects’ scores are then summed and averaged.
By using the occurrences of each keyword from Table 3, S c of C 4 (i.e., {Cell phone, Monitor, TV}, {display, hdmi}), and  C 6 (i.e., {Air conditioner, Washer}, {display, filter}) can be computed as follows:
S ( C 4 ) = 1 3 × 37 × 37 65 + 49 × 49 86 + 50 × 50 72 + 28 × 28 65 + 37 × 37 86 + 18 × 18 72 × 1 100 = 0.39 S ( C 6 ) = 1 2 × 35 × 35 47 + 10 × 10 36 + 12 × 12 47 + 10 × 10 36 × 1 100 = 0.17
From the above example, the significance of two concepts can be directly calculated from the frequencies of attributes (keywords) for each object. The significance depends on the frequencies of objects and attributes, rather than on their total number. In particular, when there are numerous similar formal concepts, the significance score is used as a threshold value, and concepts below a certain score are excluded from the analysis. This method is applied to the analysis of specification items, to reduce the scope.

5. Conceptual Data Analysis Using FCA

From Specifications to Formal Concepts

For conceptual analysis, 497 products are selected from different manufacturers. A specification is collected by crawling manufacturer websites, as well as those of retailers such as BestBuy. Table 4 summarizes the results of analyzing specification groups and items via FCA. The specification items are divided into ‘Original’ and ‘Revised’ based on refinement work.
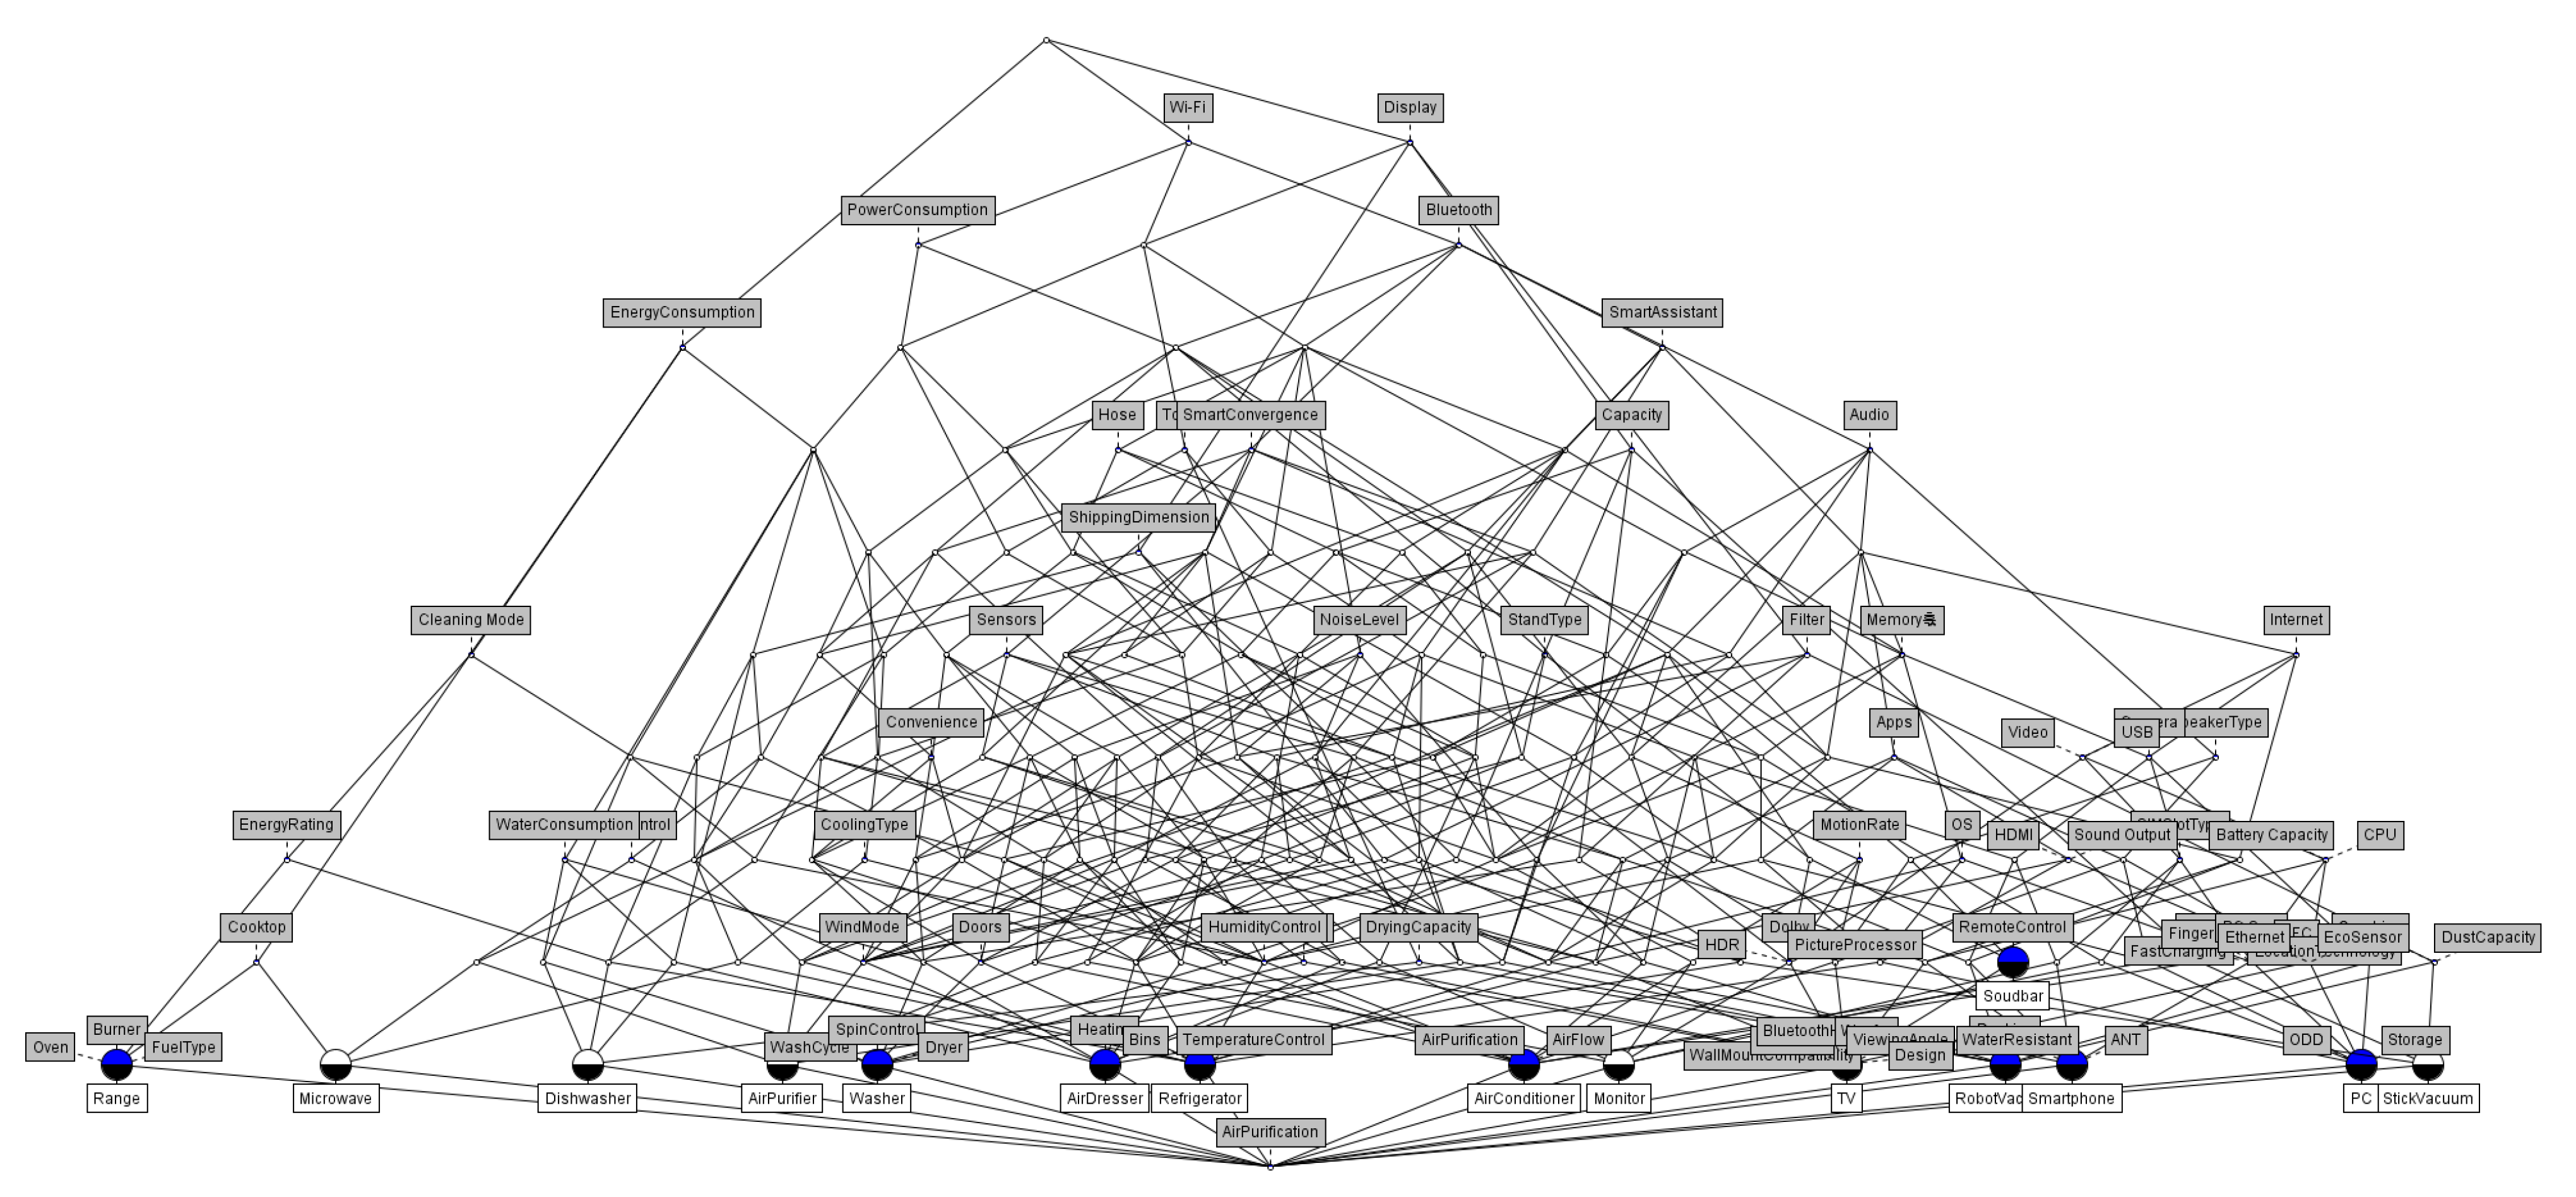
  • Specification groups. The formal context is configured by removing duplicates from objects for 15 product types (devices) and 96 specification groups. In other words, it includes a set of attributes (specification groups) as A g r o u p that all objects (electronic products) of O g r o u p have in common, or a set of objects having attributes of A g r o u p . The number of concepts extracted from this context was C g r o u p = 50, while the height of the lattice was H g r o u p = 7. Excluding the top and bottom concepts, the average number of objects included in one concept was eight, and the range was 1 < O g r o u p < 9 meanwhile, the range of attributes was 1 < A g r o u p < 34.
  • Specification items. The number of specification items extracted from the collected specification was 14,519, from which 2783 items were removed as duplicates. The number of concepts extracted from context (i.e., 15 × 2783) is C o r i g i n a l = 179. The extent of a concept, excluding itself, was 1 < A o r i g i n a l < 19, and the range of intent was 1 <  O o r i g i n a l  < 13.
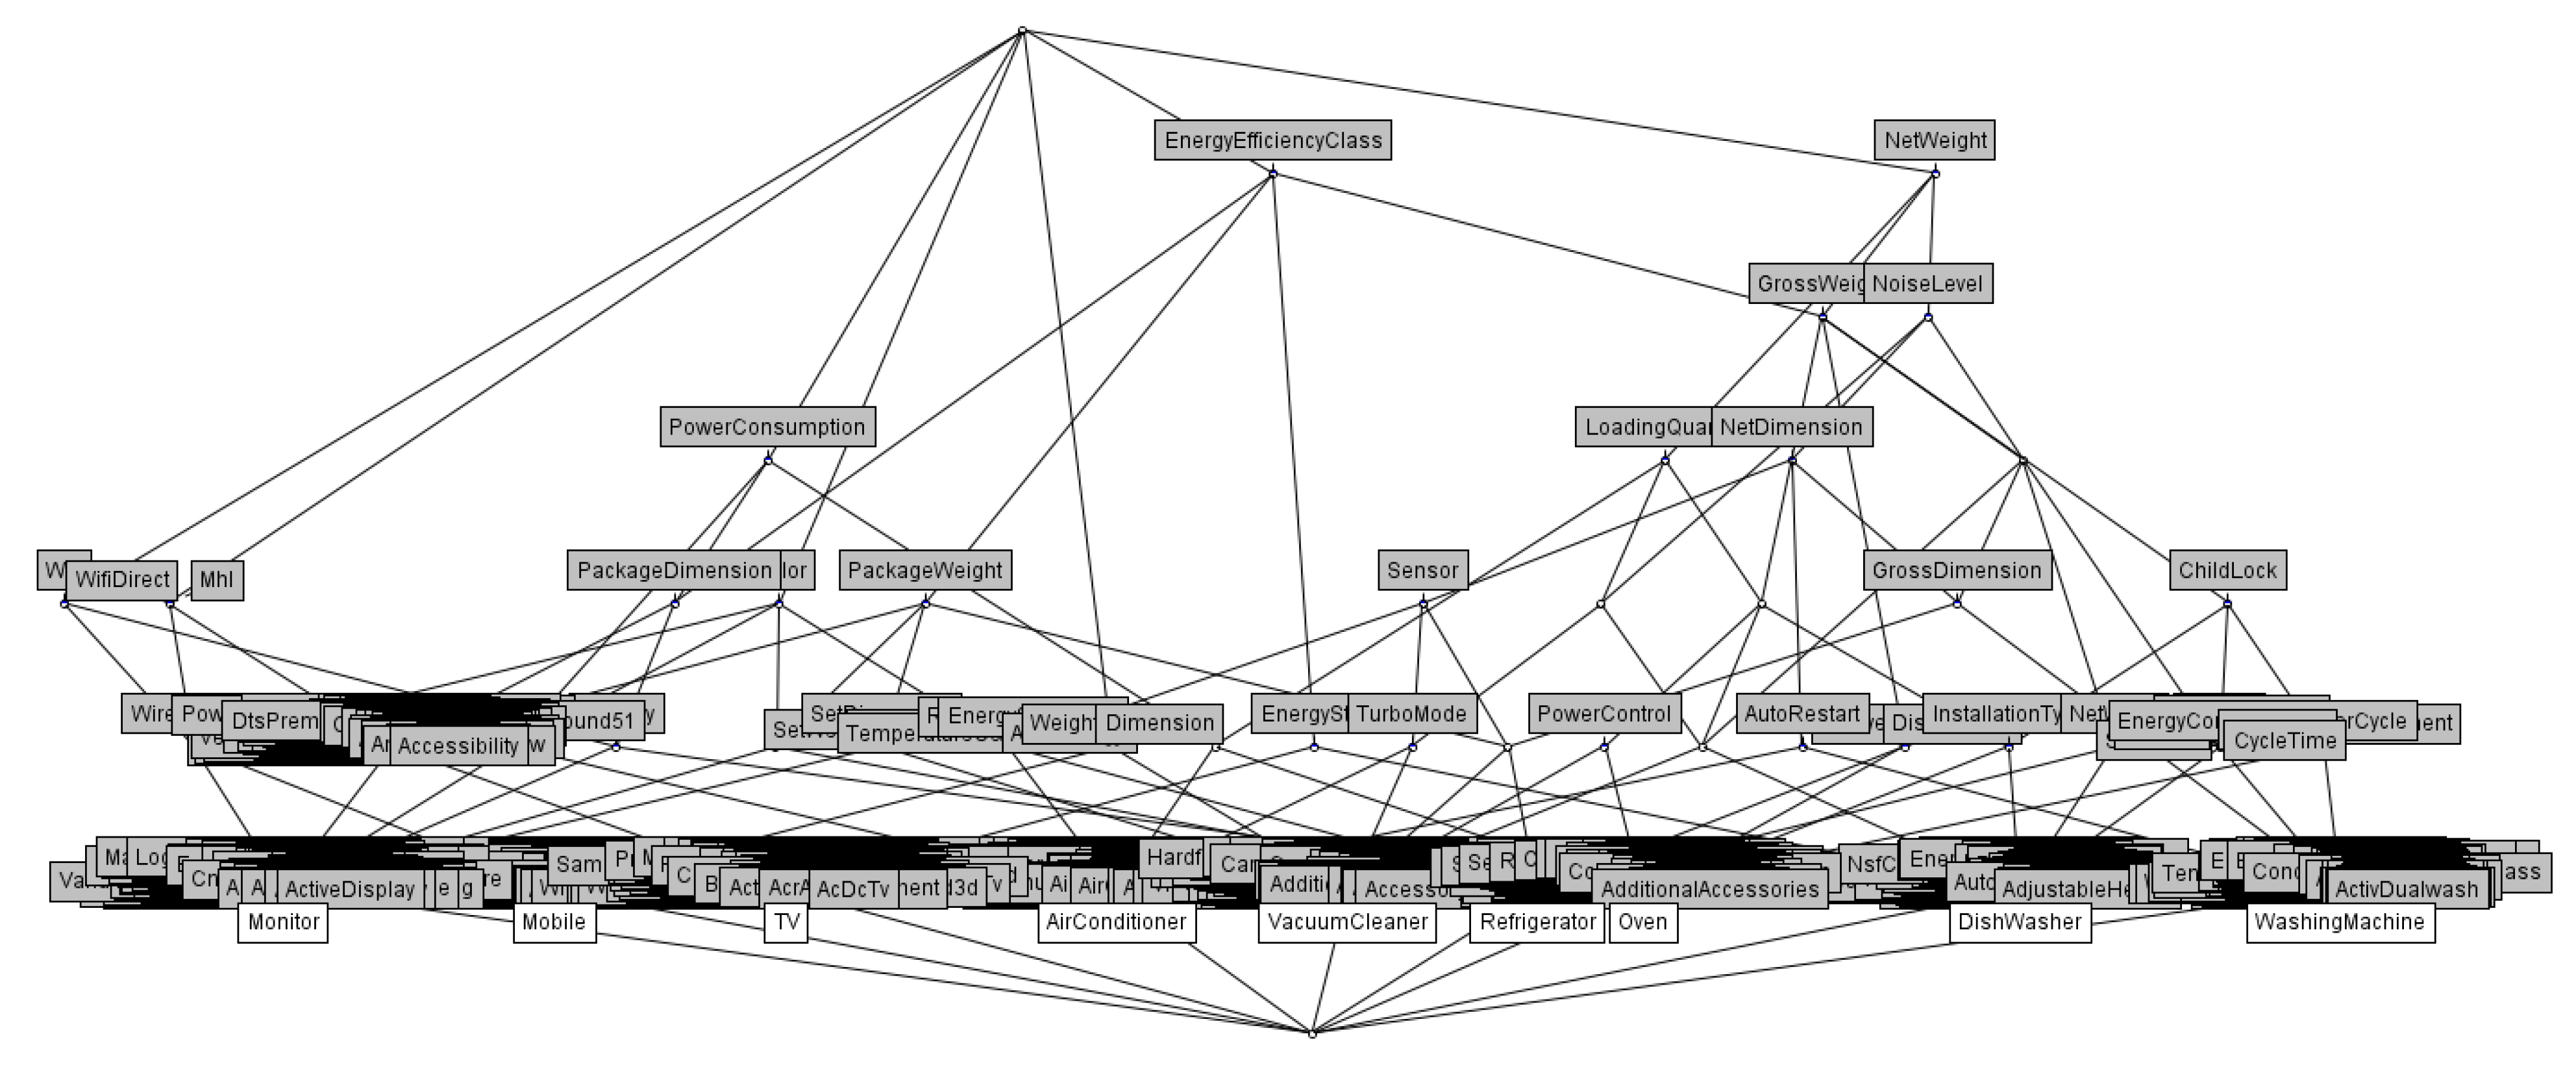
  • Refined specification items. The concept refinement, described in Equation (1), was applied to select a part of C o r i g i n a l . The 179 formal concepts, which were included in C o r i g i n a l , excluded concepts with S ( c ) < 0.2 or less. At this point, the product types and specification items included in the concept were excluded. Through this process, six products were filtered out, and the total number of specification items was reduced. Consequently, the revised concept C r e v i s e d was obtained in a formal context with nine products and 1902 specification items. There are 49 revised concepts C r e v i s e d , and the extent and intent ranges are 1 < A r e v i s e d < 8 and 1 < O r e v i s e d < 119, respectively.
As shown in Figure 4, the concept lattice is tightly connected by 474 edges, and the height of the lattice is H o r i g i n a l = |12|. C 2 , which has ‘Wifi’ as a common property, is the top concept that includes 13 electronic devices, i.e., 87% of devices. In  C o r i g i n a l 3 , 12 devices have ‘display’ as an attribute. Meanwhile, C o r i g i n a l 5 includes 12 devices that have ‘Wifi’ and ‘Bluetooth’ as common attributes. C o r i g i n a l 8 includes devices that have ‘EnergyConsumption’ as a common attribute. The extent of C o r i g i n a l 8 can be interpreted as a major feature of products with relatively high energy consumption such as ‘AirConditioner’, ‘AirPurifier’, ‘DishWasher’, ‘MicroWave’, ‘Range’, ‘Refrigerator’, and ‘Washer’. However, 91% of the extracted concepts can be considered common vocabulary, while the averages of A o r i g i n a l and O o r i g i n a l are 4.6 and 3.3, respectively. In other words, because individual concepts are separated by one or two differences in the properties they contain, similar concepts can exist on a large scale. To solve this problem, it is necessary to select a concept to be considered by calculating its importance.
Compared to C o r i g i n a l , C r e v i s e d contains concepts that have numerous common vocabulary or product types. The average of A r e v i s e d and O r e v i s e d are 3 and 7, respectively. That is, it can be observed that several products can use the same specification items. For example, C r e v i s e d 37 contains ‘Refrigerator’, ‘VacuumCleaner’, and ‘WashingMachine’ as the intent and ‘EnergyEfficiencyClass’, ‘GrossDimension’, ‘GrossWeight’, ‘NetDimension’, ‘NetWeight’, and ‘NoiseLevel’ as the extent. In addition, TV and monitor commonly define 119 specification items (i.e., C r e v i s e d 24 ). The two product types have similar functions. Figure 5 visualizes the concept lattice of C r e v i s e d . The lattice height was C r e v i s e d = 7.
In summary, the hierarchal structure of relations between concepts, which are represented as upper and lower, can be interpreted as a relationship in which the specification group is commonly used in numerous devices. In the proposed approach, the results of concept analysis are applied to design knowledge models and construct a knowledge graph. First, a common specification group is derived, regardless of the type of product. The inconsistent terms used by manufacturers or retailers are integrated using the results of concept analysis. Second, similar specification items are aligned to specification groups, regardless of products. The products and specification groups included in the formal concept form a starting point, and the specification items can be adjusted according to specification groups. Third, the value and range of the specification items can be normalized. Currently, the specification item ‘Network’ has several values such as ‘Gigabit LAN’, ‘802. 11’, ‘Bluetooth’, ‘Bluetooth v5.0’, and ‘Yes/No’. The specification group that is included in the formal concept is a common attribute used in heterogeneous product lists, and can extract specification items, which are included in specification group, and define a list of allowed values. Once a specification group is defined for a certain device, the specification item is selected from a list of allowed items or values.

6. Knowledge Graph for Consumer Electronics

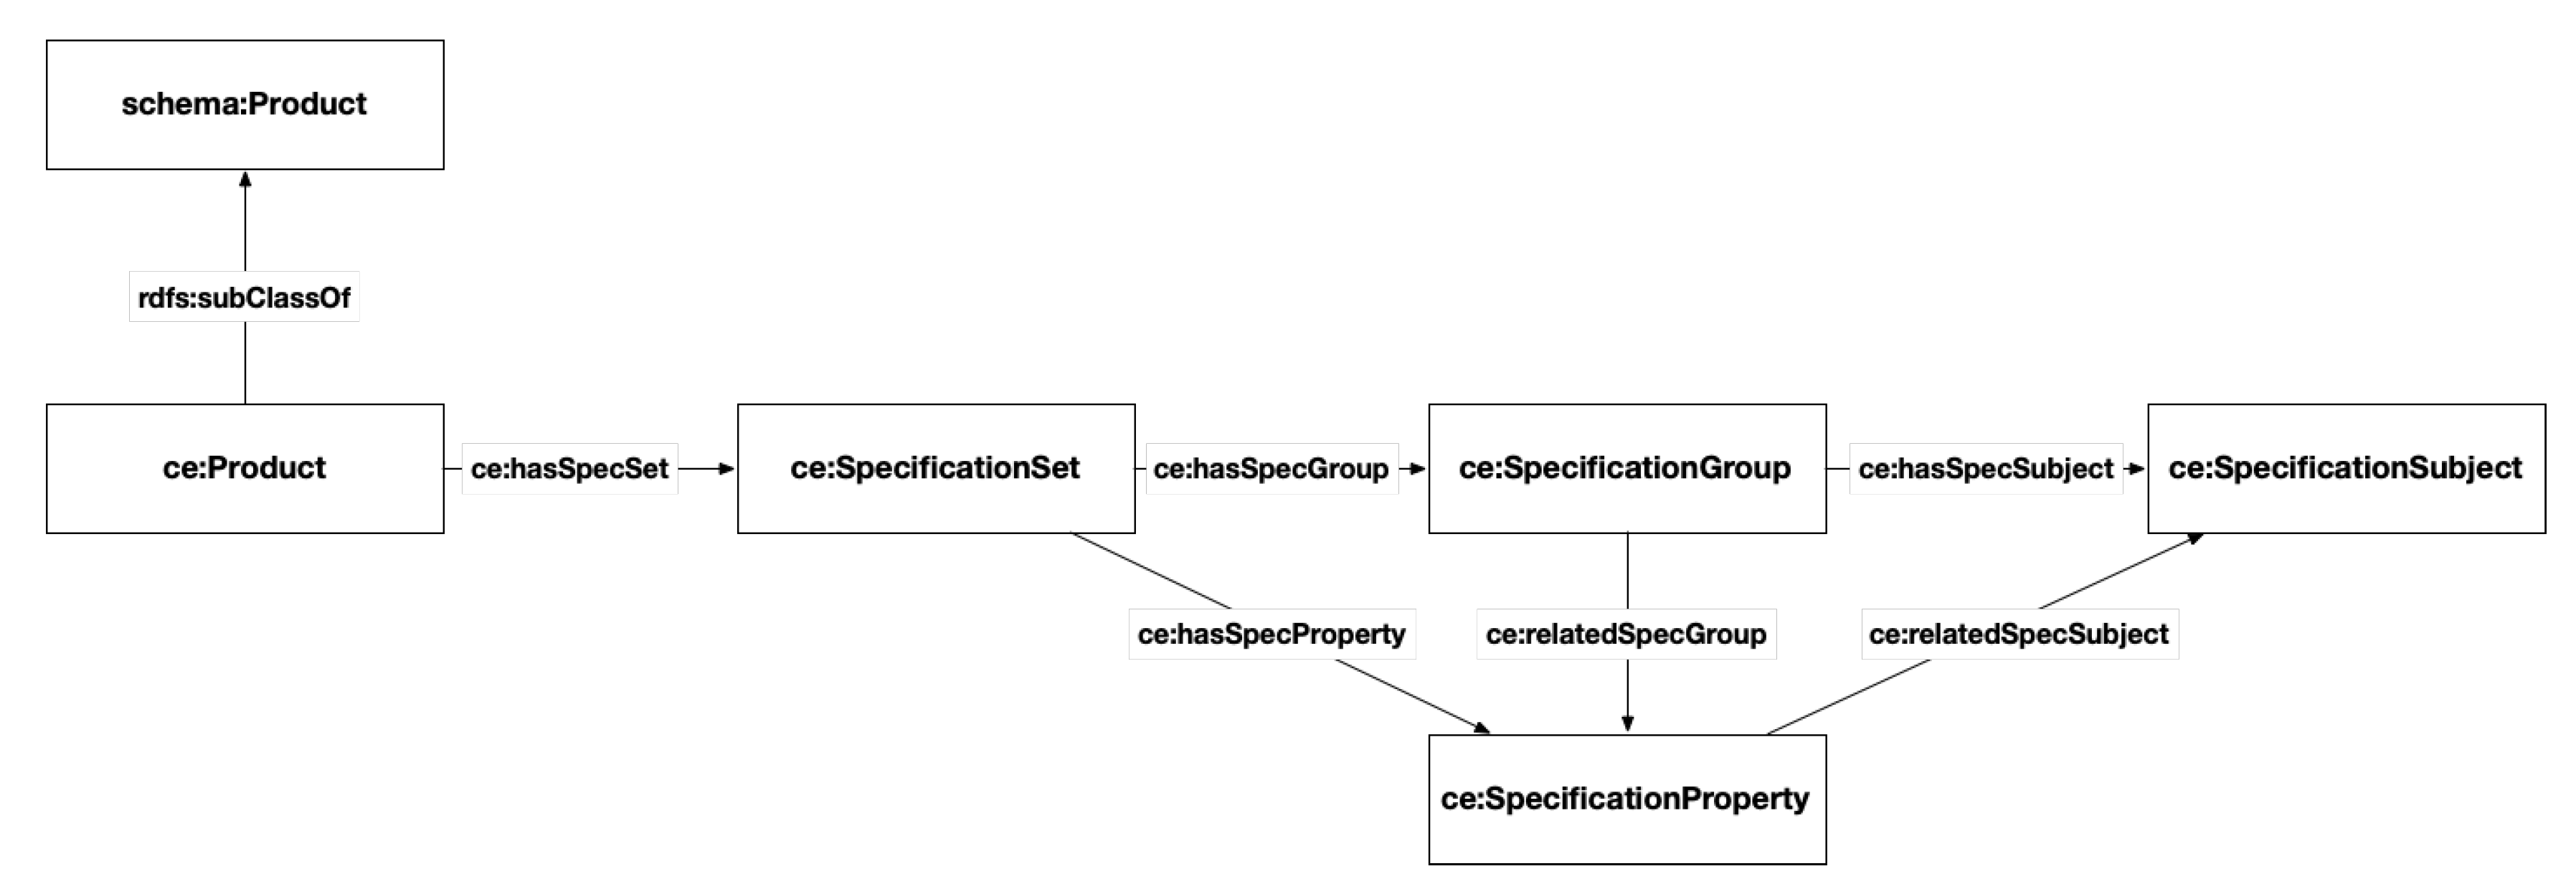
6.1. Knowledge Graph Model

A knowledge model is designed to semantically express the vocabulary of the collected product specifications. As illustrated in Figure 6, each product is represented by an instance of ce:Product, which is a subclass of the class Product from Schema.org. Each device has a set of product specifications (ce:SpecificationSet), and each specification comprises a collection of specification groups (ce:SpecificationGroup) with individual specification items (ce:SpecificationSubject). Then, a knowledge graph is constructed based on this ontology model, expressing the structure and semantics of product data and the transformation of information from product specifications to formalized knowledge in a graph format.

6.2. Defining Product Categories

All CE products are defined as subclasses of the ElectronicProduct class; products with similar features are grouped into subclass relationships. For designing top-level classes, several classifications such as manufacturers (Samsung Electronics), Consumer Reports, Amazon, and Best Buy, are collected and revised. Subsequently, 10 classes are defined: AccessoryDevice, AirConditioningHeatingDevice, AudioDevice, CellPhone, CleaningDevice, ComputerOrTablet, KitchenAppliance, NetworkDevice, SmartWatch, and VideoDevice. In addition, 73 detailed product types are organized as sub-classes of the 10 classes. The classes can abstract the product categories to some extent, and extend additional classes freely as needed to expand the range of the expression. For example, audio-related items are defined as the AudioDevice class (e.g., HomeAudio, Headphone, Mp3Player, SoundBar, and Speaker is defined as subclasses).

6.3. Specification Groups and Subjects

The specification groups reflect the formal concepts of C g r o u p , which are established via FCA. All revisions of individual groups are based on the product type and specification groups included in the concept. If a potential group does not match an existing defined group, it is replaced with the specification group in the formal concept; if it does not exist, the group is added. Through this technique, specification groups used by different products are integrated, and interoperability is established between specifications.
As shown in Table 5, the size of the specification groups vary by product types. In the extracted dataset, the specification group for monitors and refrigerators was the most used (418 and 256, respectively); even after removing redundancy, the ratio remains similarly high. In contrast, air conditioners and washing machines have relatively few group names after removing duplicates. Notably, our adjustment of the specification group lead to the size of the revised groups increasing for all products, except Mobile. For example, Oven, Air conditioner, and Dish washer increased by 55%, 45%, and 40%, respectively, compared to previous initial groups. Because these products use a method of enumerating specification items within a few groups, without dividing the specification group in detail, the application rate of common specification group names increased. As shown in Table 6, four specification groups, such as Exterior Feature, General Feature, Performance, and Robotic, were added to the Air conditioner product category, and the frequency of the existing group was slightly changed.
Specification items refer to individual hardware or software functions that are expressed in various vocabularies, depending on the manufacturers and products. The  C r e v i s e d obtained by FCA is used as a normalization reference. TV is used as a source for a basic vocabulary because these specification items are relatively normalized. The existing specification items decrease by 10% to 40% depending on product type. As the functions of products such as mobiles (from 151 to 91: 40%) and refrigerators (from 238 to 160: 33%) become more diverse and complex, the provided specification items tend to be subdivided. These products have a relatively high application rate of common vocabulary. The specification group and specification items are mapped to the SpecificationGroup and SpecificationSubject classes of the knowledge model, respectively. Table 7 presents an example of the converted result based on C g r o u p and C r e v i s e d , which is derived based on FCA. For example, the noise level of the air conditioner is moved to the performance group commonly used by other products, the group name is changed, and the specification subject is assigned a noise level. The names of the revised group and items follow the basis of the formal concept, and the descriptions of the original source are added as additional information of the knowledge model (i.e., rdf:comment). After reflecting the result of the formal concept, 96 and 1345 instances were newly declared as rdf:type of the SpecificationGroup and SpecificationSubject class, respectively. The range of value of SpecificationSubject in the knowledge model differs according to class. Most values of the specification items extracted from the original source were in text (1622) and number (277) format; however, the value of SpecificationSubject can be limited to the exact meaning by adding the Resource (677) and Enumeration (815) format. The text value as a range decreased by 196. Resource refers to the value of SpecificationSubject corresponding to a specific class; further, Enumeration refers to Boolean values, such as ‘Yes’ or ‘No’, and values divided into ‘Level1’ or ‘Level2’ such as EnergyEfficiency. The value of each range defines the representative format after removing the unit and other labels from the value extracted from the original source. It is difficult to specify a representative format, such that all applicable values are allowed and specified in a literal format. Finally, relatedProductType explicitly represents the product types with the SpecificiationSubject class. From the 1902 specification items analyzed, about 380 items were mapped to two or more products, which is helpful in finding relationships among heterogeneous products.

6.4. Transforming Product Specifications into a Knowledge Graph

The product knowledge graph was generated by applying the mapping rules to the collected data. The specification information was collected and updated periodically from internal and external data sources. The internal specification data were accessed through a relational database, and the incremental data, which were automatically updated daily, were stored in a file repository. Thus, the product knowledge graph was updated when incremental data occurred changes. In contrast, external data were collected by crawling web pages and automatically stored in a repository. A set of entities was extracted, and the mapping rules were applied. Subsequently, all entities were mapped into the existing specification entities. All instances were converted to the JSON format, reflecting the ontology model and mapping rules. Then, a process of validating the transformed data is followed. A co-authoring tool was used for experts to manually revise and validate the transformed data by experts. When this process was completed, the modified data were stored in the NoSQL format, and converted into the product knowledge graph in batches. The product knowledge graph had approximately 428,226 entities and 5.2 million facts for about 12,000 products, which were integrated from several data sources. The proposed product knowledge graph supports access by a set of open application programming interfaces, SPARQL protocol and RDF query language endpoints, and some federated queries.

7. Evaluation

The knowledge graph thus established could be used for various purposes, and utility through five use cases was verified. All use cases in Table 8 consisted of SPARQL queries, and were executed in the experimental runtime environment. As shown in Listing 1, the UC5 search for televisions weighing less than 10 kg was as follows.
Listing 1: SPARQL query of the use case 5 (UC5)
   PREFIX rdf: <http://www.w3.org/1999/02/22-rdf-syntax-ns#>
   PREFIX ce: <http://www.example.com/ontology/product#>
   SELECT DISTINCT ?s WHERE {
      ?s rdf:type ce:Product ;
		   rdf:type ce:TV;
      ce:hasSpecSet ?sheet .
      ?sheet ce:hasSpecificationGroup ?specGroup .
      ?specGroup ce:hasSpecSubject cd:SetWeightWithStand ;
      ce:hasValue ?value .
      ?value ce:specValue ?specValue~.
             
      filter(?specValue < 10.0) .
}
Then, UC1 found the ontology definition and function of a specific specification item, and returned the name of the vocabulary and the semantic relationships held in the knowledge model as results. There were seven product types that had a vocabulary. UC2 searched for products that provided a specific function; 1457 of the collected products had ‘WiFi’ functions. UC3 and UC4 investigated the compatibility of different products, and searched for necessary accessories to connect the products. The search result of UC3 corresponded to 869 products in Mobile, Monitor, and TV; further, the result of UC4 required 133 accessories.

8. Conclusions

This study introduced a product knowledge graph that aims to represent consumer electronics product information. The terms and structures of product specifications differ depending on manufactures and retailers. This information is often expressed in the manufactures’ own terms, and not in a standard vocabulary. To effectively develop a machine-interoperable information format for product specifications, a consistent data format should be considered. This study proposes an approach of constructing a knowledge model representing complex product specifications and a set of terms therein. In the proposed method, FCA is used to extract vocabularies common to heterogeneous product specifications. The specification groups and items of heterogeneous products are normalized using common vocabularies. In particular, all common vocabularies are defined as instances of the SpecificationGroup and SpecificationSubject classes in the knowledge model; common attributes and values are also defined. Then, the collected product specifications are transformed into a knowledge graph based on this model. This knowledge graph can play a central role in determining the interoperability and compatibility of heterogeneous products. A machine agent is thus enabled to understand the technical features and capabilities of supporting compatibility between various electronic products.
However, without an effort to standardize product specifications, extracting and unifying specification items from various electronic devices can still be a time-consuming task. The proposed method in this study can be used as a reference for standardizing product specification, including specification groups and items. At the same time, it is necessary to consider machine learning techniques to refine and cluster various vocabularies.
Although existing vocabularies for consumer electronics provide a set of classes, properties, and their relationships, there is a lack of detailed ontologies describing various products and their technical characteristics. This study proposes an approach to build a knowledge model of product specifications. However, this model does not primarily use existing vocabularies such as Schema.org. Thus, interlinking existing vocabularies is a topic for future research. For example, as an extension of proposed knowledge model, we may consider linking Schema.org and investigating the simultaneous mapping of relevant vocabularies. Moreover, automatic approaches to identify entities and establish knowledge enrichment techniques should be studied because of the increasing number of integrated electronic devices.

Funding

This research received no external funding.

Institutional Review Board Statement

Not applicable.

Informed Consent Statement

Not applicable.

Data Availability Statement

Not applicable.

Conflicts of Interest

The author declares no conflict of interest.

References

  1. The Global Market for Technical Consumer Goods Looks Optimistic for 2020. Available online: https://www.gfk.com/press/the-global-market-for-technical-consumer-goods-looks-optimistic-for-2020 (accessed on 30 November 2020).
  2. Are Our Household Appliances Getting Too Complicated? Available online: https://www.theguardian.com/technology/2013/feb/27/household-appliances-too-complicated (accessed on 30 November 2020).
  3. Kim, H. Towards a sales assistant using a product knowledge graph. J. Web Semant. 2017, 46–47, 14–19. [Google Scholar] [CrossRef]
  4. Ng, W.K.; Yan, G.; Lim, E.P. Heterogeneous product description in electronic commerce. SIGecom Exch. 2000, 1, 7–13. [Google Scholar] [CrossRef] [Green Version]
  5. Dong, X.L. Challenges and Innovations in Building a Product Knowledge Graph. In Proceedings of the 24th ACM SIGKDD International Conference on Knowledge Discovery & Data Mining, London, UK, 19–23 August 2018; Guo, Y., Farooq, F., Eds.; ACM: New York, NY, USA, 2018; p. 2869. [Google Scholar]
  6. Noy, N.; Gao, Y.; Jain, A.; Narayanan, A.; Patterson, A.; Taylor, J. Industry-scale knowledge graphs: Lessons and challenges. Commun. ACM 2019, 62, 36–43. [Google Scholar] [CrossRef] [Green Version]
  7. Vandic, D.; Nederstigt, L.; Aanen, S.; Frasincar, F.; Hogenboom, F. Ontology Population from Web Product Information. In Proceedings of the International Conference on Conceptual Modeling, Atlanta, GA, USA, 27–29 October 2014; Springer: Cham, Switzerland, 2014; pp. 391–392. [Google Scholar] [CrossRef] [Green Version]
  8. Wille, R. Formal Concept Analysis as Applied Lattice Theory; Springer: Berlin/Heidelberg, Germany, 2008; pp. 42–67. [Google Scholar] [CrossRef]
  9. Cole, R.J.; Eklund, P.W. Analyzing an Email Collection using Formal Concept Analysis. In Lecture Notes in Computer Science, Proceedings of the European Conference on Knowledge and Data Discovery, PKDD’99, Prague, Czech Republic, 15–18 September 1999; Springer: Berlin/Heidelberg, Germany, 1999; pp. 309–315. [Google Scholar]
  10. Zhao, M.; Zhang, S.; Li, W.; Chen, G. Matching biomedical ontologies based on formal concept analysis. J. Biomed. Semant. 2018, 9, 11:1–11:27. [Google Scholar] [CrossRef] [PubMed] [Green Version]
  11. She, Y.; He, X.; Qian, T.; Wang, Q.; Zeng, W. A theoretical study on object-oriented and property-oriented multi-scale formal concept analysis. Int. J. Mach. Learn. Cybern. 2019, 10, 3263–3271. [Google Scholar] [CrossRef]
  12. Bogatyrev, M. Conceptual Modeling with Formal Concept Analysis on Natural Language Texts; DAMDID/RCDL; Kalinichenko, L.A., Manolopoulos, Y., Kuznetsov, S.O., Eds.; CEUR-WS.org; RWTH Aachen University: Aachen, Germany, 2016; Volume 1752, pp. 16–23. [Google Scholar]
  13. Poelmans, J.; Kuznetsov, S.O.; Ignatov, D.I.; Dedene, G. Formal Concept Analysis in knowledge processing: A survey on models and techniques. Expert Syst. Appl. 2013, 40, 6601–6623. [Google Scholar] [CrossRef]
  14. Bizer, C.; Lehmann, J.; Kobilarov, G.; Auer, S.; Becker, C.; Cyganiak, R.; Hellmann, S. DBpedia—A crystallization point for the Web of Data. Web Semant. Sci. Serv. Agents World Wide Web 2009, 7, 154–165. [Google Scholar] [CrossRef]
  15. Allison-Cassin, S.; Scott, D. Wikidata: A platform for your library’s linked open data. Code4Lib J. 2018, 40. Available online: https://journal.code4lib.org/articles/13424 (accessed on 30 November 2020).
  16. Uyar, A.; Aliyu, F.M. Evaluating search features of Google Knowledge Graph and Bing Satori: Entity types, list searches and query interfaces. Online Inf. Rev. 2015, 39, 197–213. [Google Scholar] [CrossRef]
  17. Fensel, D.; Şimşek, U.; Angele, K.; Huaman, E.; Kärle, E.; Panasiuk, O.; Toma, I.; Umbrich, J.; Wahler, A. Knowledge Graphs: Methodology, Tools and Selected Use Cases; Springer International Publishing: Cham, Switzerland, 2020. [Google Scholar] [CrossRef]
  18. Hepp, M. The Web of Data for E-Commerce: Schema.org and GoodRelations for Researchers and Practitioners. In Lecture Notes in Computer Science, Proceedings of the International Conference on Web Engineering, Rotterdam, The Netherlands, 23–26 June 2015; Springer: Cham, Switzerland, 2015; Volume 9114, pp. 723–727. [Google Scholar] [CrossRef]
  19. Stolz, A.; Hepp, M. Integrating Product Classification Standards into Schema.org: ECl@ss and UNSPSC on the Web of Data. In Lecture Notes in Computer Science, Proceedings of the OTM Confederated International Conferences “On the Move to Meaningful Internet Systems”, Rhodes, Greece, 23–28 October 2017; Springer: Cham, Switzerland, 2017; pp. 103–113. [Google Scholar] [CrossRef]
  20. Selvam, R.K.; Kejriwal, M. On using Product-Specific Schema.org from Web Data Commons: An Empirical Set of Best Practices. arXiv 2020, arXiv:2007.13829. [Google Scholar]
  21. Zhu, M.; Ye, X.; Xiang, T.; Ma, Y.; Chen, X. Runtime Knowledge Graph Based Approach to Smart Home Application Development. In Proceedings of the 2018 IEEE International Congress on Internet of Things (ICIOT), San Francisco, CA, USA, 2–7 July 2018; pp. 110–117. [Google Scholar] [CrossRef]
  22. Mitsubishi. Mitsubishi Electric Develops Compact AI Knowledge Representation and Reasoning Solution for Human-Machine Interfaces. 2020. Available online: https://us.mitsubishielectric.com/en/news/releases/global/2020/0128-a/index.html (accessed on 30 November 2020).
  23. Xu, D.; Ruan, C.; Korpeoglu, E.; Kumar, S.; Achan, K. Product Knowledge Graph Embedding for E-commerce. In Proceedings of the 13th International Conference on Web Search and Data Mining, Houston, TX, USA, 3–7 February 2020; pp. 672–680. [Google Scholar] [CrossRef] [Green Version]
  24. Cao, K.; Fairbanks, J. Unsupervised Construction of Knowledge Graphs From Text and Code. arXiv 2019, arXiv:1908.09354. [Google Scholar]
  25. Ganter, B.; Wille, R. Formal Concept Analysis: Mathematical Foundations; Springer: Berlin, Germany; New York, NY, USA, 1999. [Google Scholar]
  26. Tilley, T.; Cole, R.; Becker, P.; Eklund, P. Formal Concept Analysis; Chapter A Survey of Formal Concept Analysis Support for Software Engineering Activities; Springer: Berlin/Heidelberg, Germany, 2005; pp. 250–271. [Google Scholar]
  27. Wille, R. Restructuring Lattice Theory: An Approach Based on Hierarchies of Concepts. In Ordered Sets; NATO Advanced Study Institutes Series; Rival, I., Ed.; Springer Netherlands: Dordrecht, The Nethlands, 1982; Volume 83, pp. 445–470. [Google Scholar] [CrossRef]
  28. Münster, G.; Walzl, M. Lattice Gauge Theory—A short Primer. arXiv 2000, arXiv:hep-lat/0012005. [Google Scholar]
  29. Ignatov, D. Introduction to Formal Concept Analysis and Its Applications in Information Retrieval and Related Fields. In Communications in Computer and Information Science, Proceedings of the Russian Summer School in Information Retrieval, Nizhniy Novgorod, Russia, 18–22 August 2014; Springer: Cham, Switzerland, 2015; Volume 505. [Google Scholar] [CrossRef]
  30. Cimiano, P.; Hotho, A.; Stumme, G.; Tane, J. Conceptual Knowledge Processing with Formal Concept Analysis and Ontologies. In Lecture Notes in Computer Science, Proceedings of the International Conference on Formal Concept Analysis, Sydney, Australia, 23–26 February 2004; Springer: Berlin/Heidelberg, Germany, 2004; Volume 2961. [Google Scholar] [CrossRef] [Green Version]
  31. Obitko, M.; Snasel, V.; Smid, J. Ontology Design with Formal Concept Analysis. CLA 2004, 128, 1377–1390. [Google Scholar]
  32. Formica, A. Ontology-based concept similarity in Formal Concept Analysis. Inf. Sci. 2006, 176, 2624–2641. [Google Scholar] [CrossRef]
  33. Mireya, T.; Pinto, D.; Rendón, A.; Serna, J.G.; Vilariño, D. Identification of Ontological Relations in Domain Corpus Using Formal Concept Analysis. Eng. Lett. 2015, 23, 72–76. [Google Scholar]
  34. M Priya, C.A.K. A novel approach for merging ontologies using formal concept analysis. Int. J. Cloud Comput. 2020, 9, 189. [Google Scholar] [CrossRef]
  35. González, L.; Hogan, A. Modelling Dynamics in Semantic Web Knowledge Graphs with Formal Concept Analysis. In Proceedings of the 2018 World Wide Web Conference, Lyon, France, 23–27 April 2018; pp. 1175–1184. [Google Scholar] [CrossRef] [Green Version]
  36. Dürrschnabel, D.; Hanika, T.; Stubbemann, M. FCA2VEC: Embedding Techniques for Formal Concept Analysis. arXiv 2019, arXiv:1911.11496. [Google Scholar]
  37. Li, G. DeepFCA: Matching Biomedical Ontologies Using Formal Concept Analysis Embedding Techniques. In Proceedings of the 4th International Conference on Medical and Health Informatics, Kamakura City, Japan, 14–16 August 2020. [Google Scholar]
  38. Kim, H.; Breslin, J.; Decker, S. Mining and Representing User Interests: The Case of Tagging Practices. IEEE Trans. Syst. Man Cybern. Part A Syst. Hum. 2011, 41, 683–692. [Google Scholar] [CrossRef]
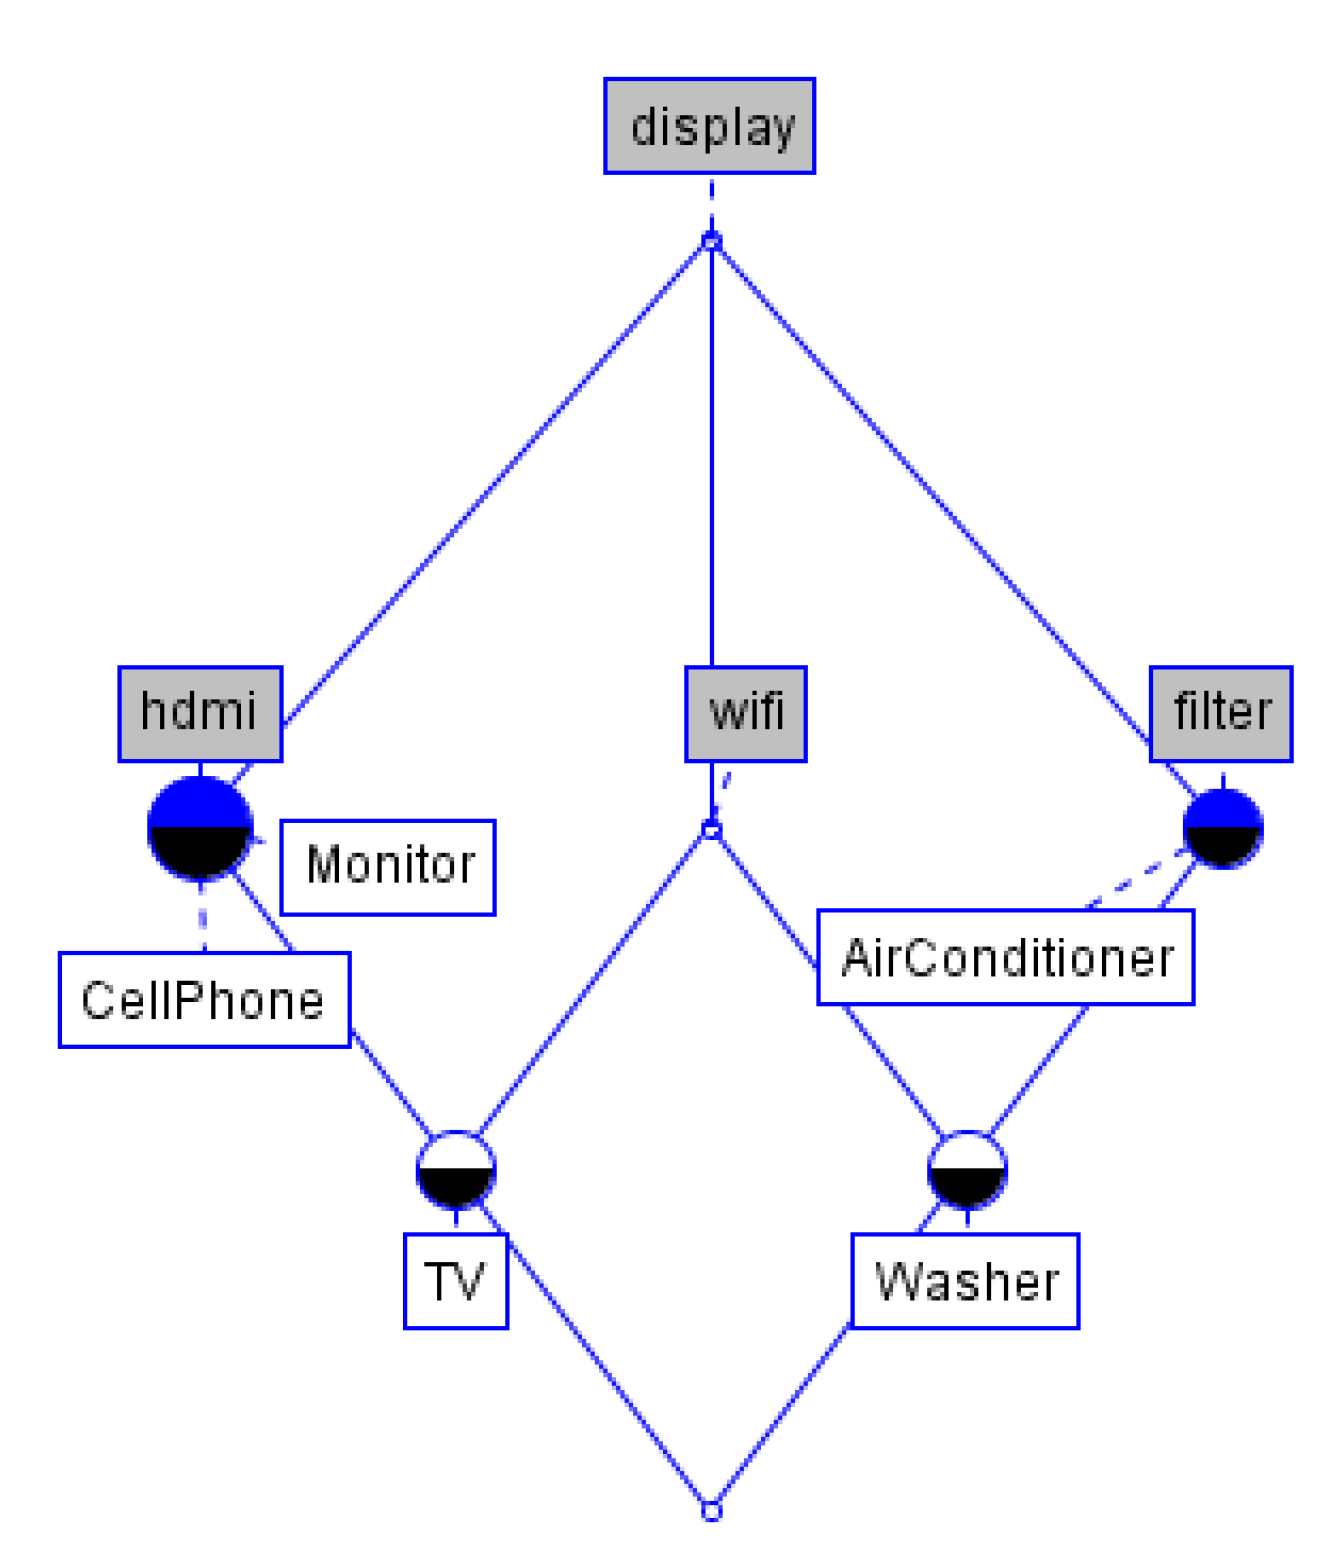
 [Green Version]
Figure 1. Specification group and specification items of a product specification.
Sustainability 13 01722 g001
Figure 2. Overall process of analyzing formal concepts from collected specifications and transforming a product knowledge graph.
Sustainability 13 01722 g002
Figure 3. Concept lattice for Table 1.
Sustainability 13 01722 g003
Figure 4. A concept lattice of (original) specification items.
Sustainability 13 01722 g004
Figure 5. A concept lattice of revised specification items.
Sustainability 13 01722 g005
Figure 6. The meta-model of consumer electronics.
Sustainability 13 01722 g006
Table 1. Formal context C .
C DisplayFilterHdmiWifi
Air conditioner××
Cell phone× ×
Monitor× ×
TV× ××
Washer×× ×
Table 2. Formal concept generated from Table 1.
ConceptsExtensionsIntensions
C 1 {display, filter, hdmi, wifi}
C 2 {TV}{display, filter, hdmi }
C 3 {Washer}{display, filter, wifi}
C 4 {Cell phone, Monitor, TV}{display, hdmi}
C 5 {TV, Washer}{display, wifi}
C 6 {Air conditioner, Washer}{display, filter}
C 7 {Air conditioner, Cell phone, Monitor, TV, Washer}{display}
Table 3. Occurrences of each keyword.
DisplayFilterHdmiWifi
Air conditioner35120047
Cell phone37028065
Monitor49037086
TV50018472
Washer101001636
Table 4. Statistics of analyzing specification groups and items by FCA.
TypesContentSpecification GroupsSpecification Items
OriginalRevised
Formal contextThe number of objects15159
The number of attributes9627831902
Formal conceptThe number of concepts5017949
Average number of extents44.67
Average number of intents33.33
The number of edges108474110
Lattice height7117
Table 5. Statistics from formal concept analysis (FCA) of specification groups.
Product TypesThe Number of Specification GroupsThe Number of Distinct Specification Groups
Original GroupsRevised Groups
Air Conditioner2221014
Dish washer901116
Mobile1511816
Monitor4183034
Oven1981117
Refrigerator2382025
TV2561517
Vacuum cleaner1331617
Washing machine19679
Total1902138165
Table 6. Status of original and revised specification groups.
Original GroupRevised Group
Specification GroupsThe Number of Specification ItemsSpecification GroupsThe Number of Specification Items
Air Flow12Air Flow12
Air Purification26Air Purification25
Capacity24Capacity24
Convenience28Convenience28
Electrical Data15Electrical Data15
Energy Efficiency27Energy Efficiency27
Noise Level17Noise Level16
Operating Mode27Operating Mode27
Physical specification23Physical specification22
Technical Information23Technical Information20
--Exterior Feature1
--General Feature3
--Performance1
--Robotic1
Total222Total222
Table 7. A list of selected specification groups and items for representing the product knowledge model. Three or four items of each products are randomly selected.
Product typesExtracted specification informationRevised specification information
Specification groupsSpecification itemsSpecification GroupSpecification Subjectrelated Product TypeRange
Air conditionerAir PurificationIndicator (Cleanliness)ConvenienceIndicator CleanlinessAir ConditionerLiteral
Noise LevelNoise (dBA)PerformanceNoise LevelAir Conditioner, Refrigerator, Vacuum Cleaner,
Dish washer
Literal
Technical InformationRefrigerant (Charging, g)General FeatureRefrigerantAir ConditionerNumber
Dish washerPerformanceEnergy Efficiency ClassEcoEnergy Efficiency ClassDish washer, Monitor, Oven, Refrigerator, TV,
Vacuum Cleaner, Washing Machine
Resource
General FeatureLeakage SensorFeatureLeakage SensorDish washer, Washing MachineResource
DimensionNet WeightPhysicalspecificationNet WeightDish washer, Vacuum Cleaner, Washing Machine,
Air Conditioner, Refrigerator, Oven
Number
MobileNetwork/Bearer (NAL Certification)2G CDMANetwork BearerCdma2gMobileEnumeration
Network/Bearer (International Roaming)3G CDMANetwork BearerCdma3gMobile, TVEnumeration
LensFocal LengthCameraFocal LengthMobile, Monitor, TVLiteral
MonitorGeneral FeatureAnalog Clean ViewAdditional FeatureAnalog Clean ViewMonitor, TVLiteral
Eco FeatureEnergy Efficiency ClassEcoEnergy Efficiency ClassDish washer, Monitor, Oven, Refrigerator, TV,
Vacuum Cleaner, Washing Machine
Resource
General FeatureMHLConnectivityMhlMobile, Monitor, TVResource
General FeatureMobile High-Definition Link (MHL)ConnectivityMhlMobile, Monitor, TVEnumeration
OvenFeaturesChild LockFeatureChild LockDish washer, Oven, Washing MachineResource
Materials/FinishesDisplay TypeExterior FeatureDisplay TypeOven, RefrigeratorLiteral
Power/RatingsEnergy Efficiency ClassEcoEnergy Efficiency ClassDish washer, Monitor, Oven, Refrigerator, TV,
Vacuum Cleaner, Washing Machine
Resource
Weights/DimensionsLoading QuantityPhysicalspecificationLoading QuantityOven, Vacuum CleanerLiteral
RefrigeratorRefrigerator FeatureAnti-BacteriaAir PurificationAnti BacteriaAir Conditioner, RefrigeratorResource
PerformanceEnergy Efficiency ClassEcoEnergy Efficiency ClassDish washer, Monitor, Oven, Refrigerator, TV,
Vacuum Cleaner, Washing Machine
Resource
EnergyEnergy Star RatingEnergy EfficiencyEnergy StarRatingAir Conditioner, RefrigeratorResource
TVConnectivityAudio Out (Mini Jack)InterfaceAudio Out Mini JackTV, MonitorResource
Eco FeatureEnergy Efficiency ClassEcoEnergy Efficiency ClassDish washer, Monitor, Oven, Refrigerator, TV,
Vacuum Cleaner, Washing Machine
Resource
Smart ConvergenceWiFi DirectConnectivityWifi DirectMonitor, TVEnumeration
Vacuum Cleaner General Information Charging Time Power Charging Time Vacuum Cleaner Number
AccessoryDust SensorCleaning ModeDust SensorVacuum CleanerResource
Cleaning ModeTurbo ModeOperating ModeTurbo ModeAir Conditioner, Vacuum CleanerResource
Washing machineFeatureAuto RestartConvenienceAuto RestartAir Conditioner, Washing MachineResource
PerformanceEnergy Efficiency ClassEcoEnergy Efficiency ClassDish washer, Monitor, Oven, Refrigerator,
TV, Vacuum Cleaner, Washing Machine
Resource
FeaturePower WashCyclePower WashWashing MachineResource
Table 8. Use cases for evaluating capability of the knowledge graph.
Use CasesSupportsSearched ResultsRelevant Product Types
UC1:
Search for the meaning of the ‘Noise level’ function.
Yes7Air conditioner, Dish washer, Mobile, Refrigerator,
TV, Vacuum cleaner, Washing machine
UC2:
Search for products that provide ‘Wi-fi’ function
Yes1457Air conditioner, Mobile, Refrigerator, TV
UC3:
Search for products that support ‘MHL’ and ‘HDMI’
Yes869Mobile, Monitor, TV
UC4:
Search for accessories related to HDMI
Yes133Monitor, TV
UC5:
Search for TVs under 10 kg
Yes511TV
Publisher’s Note: MDPI stays neutral with regard to jurisdictional claims in published maps and institutional affiliations.

