Article

Green Infrastructure in the Time of Social Distancing: Urban Policy and the Tactical Pandemic Urbanism

by
Krzysztof Herman
1,2,* and
Łukasz Drozda
3
1
Department of Landscape Art, Institute of Environmental Engineering, Warsaw University of Life Sciences (WULS-SGGW), 02-787 Warsaw, Poland
2
School of Architecture, Victoria University of Wellington, Wellington 6140, New Zealand
3
Department of Applied Social Sciences and Resocialization, Institute of Social Prevention and Resocialization, University of Warsaw, 00-927 Warsaw, Poland
*
Author to whom correspondence should be addressed.
Sustainability 2021, 13(4), 1632; https://doi.org/10.3390/su13041632
Submission received: 18 January 2021 / Revised: 29 January 2021 / Accepted: 30 January 2021 / Published: 3 February 2021

Abstract

:
The COVID-19 pandemic generated a number of changes in the functioning of urban areas all over the world and had a visible impact on the use of green infrastructure, including city parks. The study discusses and compares operation and use of two such parks located in Wellington, New Zealand and Warsaw, Poland by adopting “pandemic urban ethnography”, an approach that includes autoethnography, interviews with users, non-participant observation, and analysis of social media content. As indicated by the findings of the study, the importance of less rigidly designed, multifunctional spaces that give their users freedom of “tactical” adjustments, significantly grows during times of lockdown and “social distancing”. During such a crisis, the management and everyday use of urban parks are highly related to urban policies. The article provides insight into how those policies impact the functional values of green infrastructure confronting it with user-generated adaptations and the landscape design itself. The global health emergency showed how access to green areas becomes a crucial determinant on environmental justice while proving the significance of “tactical pandemic urbanism” as both a design and management method.

1. Introduction

1.1. Health Benefits of Green Infrastructure during Pandemics

COVID-19 pandemic is not the first and presumably not the last pandemic in which cities and their inhabitants turn to green spaces as a means to alleviate the crisis. It is well documented how the cholera pandemic and the sanitary urges spurred the development of both Olmsted’s Central Park in New York City and Haussmann’s green and spacious promenades in Paris [1,2,3,4,5]. Urban rejuvenation plans, new parklands and open, recreational spaces were created in Mumbai and Melbourne as a response to WWI and Spanish Flu epidemic hardships [5]. Existing urban open spaces often acted as open-air hospitals [6]. Exposure to fresh air, sunshine and gentle exercise were official treatment methods in the influenza pandemic [7] reducing the number of infections and deaths reported at open-air hospitals [8]. Medical research showed that regular meals, warmth, and plenty of fresh air and sunlight helped severely ill patients recover better than indoor nursed patients [8].
Due to benefits of exposure to natural environments, green spaces are not only useful during a health crisis’ but also play an invaluable role in helping people to prepare for times of societal disruption physically and mentally [9]. Greater amounts and size of urban green space can be associated with fewer days of mental health complaints in urban areas [10]. The positive impact of close residential access to urban green space on self-reported health was confirmed both before [11] and during COVID-19 pandemic [12] By providing access to green spaces, places and areas that encourage physical and social activity, cities can play their part in improving citizens’ resilience and the ability to cope with new pathogens [9,13].
City parks, community gardens, urban conservation areas, and other types of natural spaces will emerge as indispensable to urban dwellers, especially if the need to physically distance from one another becomes the “new normal” in this and possible future pandemics. It is an important role of municipal decision-makers to develop innovative but simple, low-budget strategies to increase the usability of urban nature so that it is possible to enjoy these settings while respecting physical distance guidelines [14]. Rodgers [15] advocates that the pandemic urges a refocus on policy-making and government action to protect remaining open spaces and create new green spaces. This will require a special emphasis in the times of crisis and austerity when local authorities will be under more pressure to sell off or develop public land due to budget shortages.
There is evidence that during lockdowns greenspaces become a significant source of welfare for urban dwellers, as other leisure opportunities were halted [16]. Moreover, the lockdown rules caused a reduced number of car trips to green spaces and increased emphasis on walking in the United Kingdom [16] as well as increased recreational use of green spaces in Oslo, Norway [17]. It is also speculated that green spaces acted as a substitute for prohibited indoor fitness and sports activities, and a refuge from stress during the COVID-19 lockdown [17].

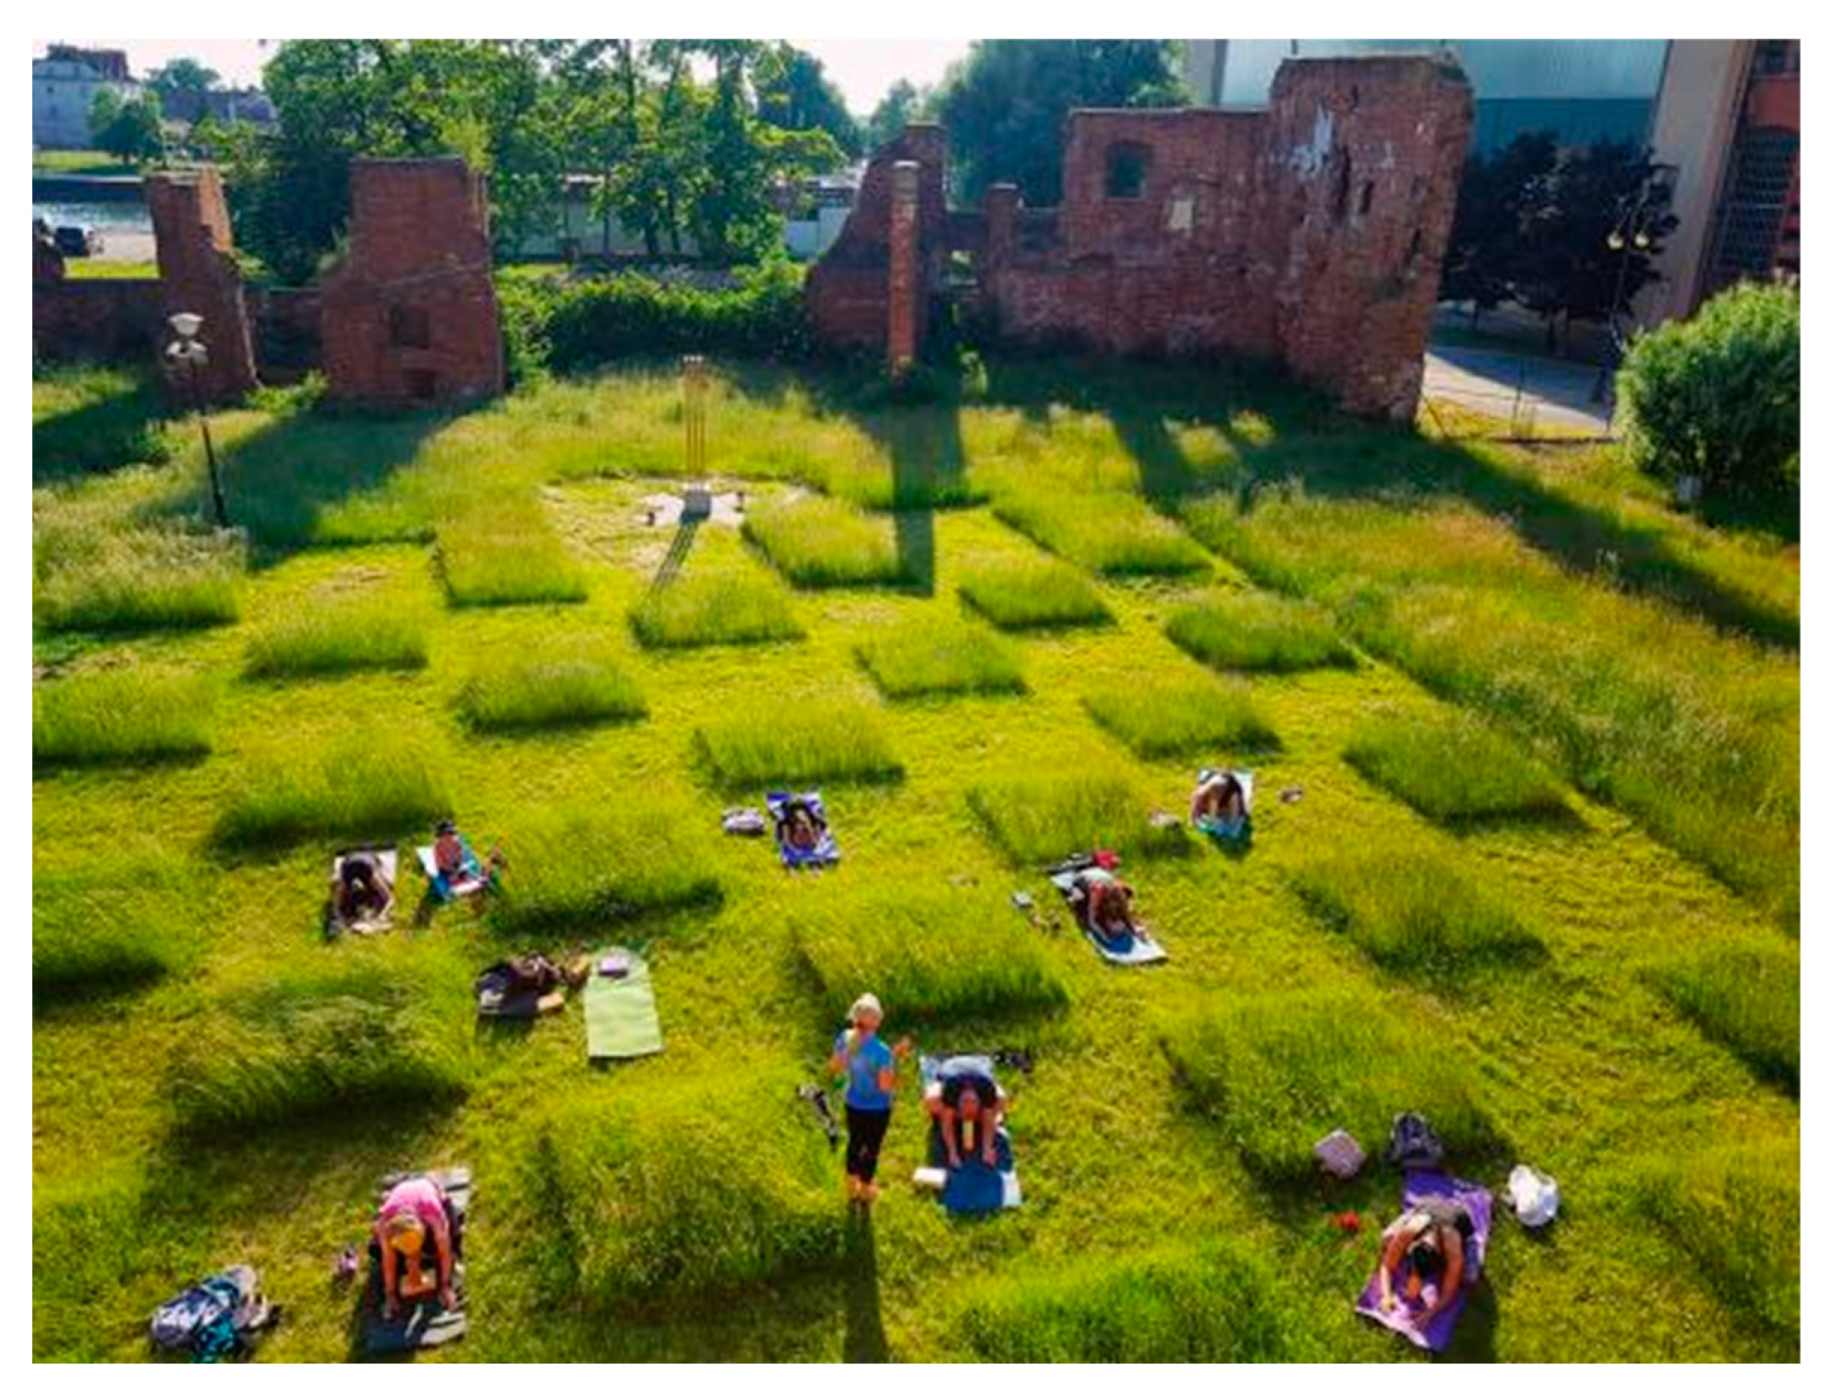
1.2. Tactical Urbanism Interventions in Public and Green Space during COVID-19 Pandemic

COVID-19 pandemic has an impact on the shape and use of public spaces today and will presumably leave a trace on how we approach urban planning, design and management in the future [18]. An international group of scholars led by Jordi Honey-Rosés (University of British Columbia) has reviewed and gathered 17 emerging questions on the impact of COVID-19 on public space, these included: “Will green space planning need new designs, uses and practices? What is the future of large public spaces?; Will the temporary transformations seen during the crisis inspire more permanent changes? Will we observe fewer people in public? Will we change what we do in public?” [19].
Cities around the world looked into both temporary and more permanent adjustments that would provide new walkable spaces during the pandemic and time of physical distancing requirements [19,20]. This included tactical urbanism actions such as extensions of sidewalks, provisional bike lanes, street closures in favour of “new” and accessible public space, parklets, temporary gardens and others [21]. For example, municipal authorities of Bogota added 76 km of additional temporary bike lanes, while Vienna, Boston, Oakland, Philadelphia, and Minneapolis temporarily closed roads to give more space to pedestrians and cyclists [19]. Tactical urbanism has made it possible to implement 67 km of new cycle lanes in Mexico City [22]. COVID-19 outbreak has in many cases accelerated transformations in urban environments and mobility models [23], by adopting, inter alia, “open/slow street initiatives” to improve the accessibility of green spaces [24]. Other initiatives include solutions such as: keeping parks open, modifying policies on the use of public transit and adoption of consistent messaging (clear communication on the policies and rules).
New Zealand has claimed to be the first country to provide funding to make tactical urbanism into official government policy during the coronavirus pandemic [25]. Safer and easier walking and cycling in the city was supported by pop-up and interim treatments financed through the “Innovating Streets for People Pilot Fund” program [26,27]. Similar light and low-scale interventions are planned in urban green spaces. An informal group of urban sustainability researchers and teachers at Victoria University of Wellington and University of Otago, Wellington in proposed “Green covid-19 recovery programme” outlines such activities ensuring enhanced maintenance and clearance of urban walking and cycling trails including “clearing vegetation from trail edges, creating small passing bays and minor resurfacing of trails to provide maximum safety and easy physical distancing” [28]. The recovery programme also promises new pocket parks in the dense urban fabric of the Wellington centre. Partnership with private developers and the private sector could assure some low-budget, tactical and often temporary green developments, providing small “doses” of green on vacant lots, street corners and suitable road reserve areas [28].
While most urban green spaces and regional parks were open and targeted with some tactical improvements in New Zealand, the same areas were closed for most of the lockdown period in Poland. As of April 1st 2020, the Polish government prohibited the use of parks, beaches, boulevards, promenades, forests, national parks, playgrounds, botanical and zoological gardens as a result of these areas being a common space for large public gatherings [29,30]. Most of these restrictions were lifted 3 weeks later [31]. Playgrounds were locked for a longer period (April–June) in Poland and were one of the few public recreational facilities, along with skate and cycle parks closed for a level 3 and 4 lockdowns in New Zealand (23rd March to 14th May) [32].
Late April Warsaw City Council announced that several streets will be redesigned with parking spaces being moved from sidewalks onto the street [33]. One of the central squares in Warsaw (Zbawiciela Sq.) saw a temporary, test (prototype) closure of street lanes that allowed extensions of open-air bars and cafes over the last weeks of summer [34]. These changes were not quite ad hoc actions, but rather accelerated or intensified activities that were planned and necessary anyway, before the pandemic.
An impromptu design by an architect and the director of Galeria EL Art Centre, Ada Kotynska, transformed a green space outside the gallery building (Figure 1). What used to be a monastic garden in front of a former gothic Dominican church was transformed into a ‘social distancing lawn’—a green checkerboard, pattern that provides individual social isolation zones. The simple geometric design, fitting for a gallery known for exhibiting abstract art, offers a place to gather “separately but together” [35]. The idea was simple—each mowed square is big enough to fit a standard picnic blanket and the space between them provides necessary distancing in accordance with local lockdown guidelines. Lawns in between are unmowed, providing micro meadows, which are desirable for keeping moisture, lowering the temperature and increasing biodiversity [36]. This tactical and site-specific, temporary design for a garden in Elbląg (Poland) is just one of several similar ideas that were created in green spaces as a response to the need of “social distancing”. In Bristol, large heart shapes have been sprayed on the grass to outline safe distances; in New York City, white circles dotted New York’s public parks and leaf shapes appeared on the lawns of Boston Commons, just to name a few [37].

1.3. The Structure of the Article

The article is divided into five parts: introduction; material and methods, where we describe our research approach and selected case study areas; results in which we compare both case studies using the unified methodology, discussion where we provide a context to our research findings and possible expansions of the study, and finally conclusions. This study aims to analyse the functioning of green infrastructure during the COVID-19 pandemic on selected examples that take into account the geographical and spatial diversity of these areas. This goal will be achieved by seeking answers to the following research questions: What is the importance of green spaces during pandemic caused lockdowns? Are there new types of uses and users specific to pandemic lockdown? How did the use and functionality of parks change as compared to times before (and after) lockdown? And finally, how did the policies of the public authorities influence the use of green spaces during the pandemic?

2. Material and Methods

2.1. Research Area

The study covers two parks located in geographically, spatially, and socially diverse urban areas. Their common features are a similar function, size (especially the identical dimension of the internal multifunctional area), location in a residential area of a nation’s capital city, as well as the presence of changes in use due to the COVID-19 pandemic. Some other features of the two places are clearly distinctive.
Miramar Park is located centrally on the “flat” of Miramar Peninsula in Wellington, New Zealand. The “flat” is a levelled land that was uplifted during the 1855 earthquake [38,39]. This low-lying, drained lagoon is one of few large flat areas in Wellington and as such became suitable for the location of the Wellington airport, large warehouses and industrial sites (currently increasingly occupied by creative and film industries) as well as sports fields.
The peninsula became a residential area in the early 20th century. 32 residential sections were sold in 1902 and the Miramar Borough Council was established in 1904 [40]. As for the 2018 census, Miramar is inhabited by 9831 people (on 287 ha land) with 3597 occupied private dwellings, 162 unoccupied private dwellings and 12 occupied non-private dwellings [41].
Beginnings of Miramar Park can be traced right to the very beginning of Miramar’s residential history, with “Plan of the town of Miramar North, Wellington’’ from 1906 [42] showing the outlines of what would be primarily tennis courts at the beginning of its existence. Subsequent plans show the development of larger fields catering towards team sports [43]. Miramar Park includes buildings and facilities that historically are a part of the green space, namely Miramar Bowling Club (est. 1946), Miramar Tennis Club and Miramar North Kindergarten. Today Miramar Park is the largest of three public recreation areas within the boundaries of the suburb. All three are predominantly designed and used for sports activities (Crawford Green Park—Football, softball; Polo Ground Park—Rugby, softball and Miramar Park—Football, cricket) but also serve the role of neighbourhood parks [44]. It is surrounded by single-family detached houses from the north, east and south and some larger, industrial buildings and warehouses from the west side. The park has four entrances (3 pedestrian and one for both pedestrians and vehicles) but is rather hidden from the view and removed from the main streets.
The second examined green area is Polińskiego Park in Warsaw, Poland. The park is located in the neighbourhood of Grochów, which is part of the Praga-South district. This neighbourhood had a bad reputation as poor and dangerous in the past but nowadays undergoes moderate gentrification, which has made it increasingly popular among the middle class. Therefore, the area around the park is both socially and spatially diverse. There are both social housing and private apartments here—from luxurious single-family houses to post-socialist 20-story blocks of flats. This diverse urban fabric reflects the high level of social mixing of the area. There are several parks in Grochów, providing residents with reasonably equal access to public green infrastructure. However, based on the identified urban edges [45], the area that can be described as the parks “neighbourhood” is approximately 160 ha, inhabited by over 20,000 people (The exact number of inhabitants is unknown as part of the population is not registered and data on the population are aggregated at the level of 18 city districts. These are large spatial units with even over 200,000 inhabitants. The estimated number of inhabitants of the Polińskiego Park’s “neighbourhood” is based on the National Electoral Commission’s [46] data on polling districts and Statistics Poland’s [47] data about non-adult inhabitants of the entire Praga-South district.). This area is bound by the railway line from the north and Grochowska Street (the main artery of the neighbourhood) from the south. The western and eastern edges are less clear and for this study have been traced along the larger streets used by public transport buses, and polling districts. On the other hand, the parks ‘neighbourhood’ is also wider for some users, especially dog owners, as Polińskiego Park has the largest paddock for dogs in the district.
Established in 1962, the park underwent a major modernization in 2016 and became one of the best-maintained parks in the entire city. During this renovation, Polińskiego park was also fenced and its spatial structure was arranged with a clear separation of individual functions such as a fenced sports field, a playground for children, and a paddock for dogs. The official area of the park is 5.52 ha, although the common area after installing the fence is slightly smaller (3.9 ha) The rest of the park is still available, but due to the adopted design solutions it is rarely used by people other than dog owners and the undesirables [48]. The latter uses of the park during the pandemic have not changed and are therefore not significant for the study. Table 1 summarises basic data on both research sites.

2.2. Pandemic Urban Ethnography as a Research Method

The urban parks that we chose for the case studies vary widely but are not representative of all types of green infrastructure affected by the COVID-19 pandemic. The instrumental case study method, that is used in this research, calls for an analysis of two examples. The aim is not to describe all possible occurrences, but to provide a broad spectrum of valuable information by choosing cases that are as diverse as possible [51]. The case study method is also used broadly in landscape architecture research, where it is understood as “a well-documented and systematic examination of the process, decision-making and outcomes of a project, which is undertaken to inform future practise, policy, theory and/or education.” [52] (p. 16). According to Francis “most successful case studies incorporate a variety of methods such as site visits; site analysis; historical analysis; design process analysis; behavioural analysis; interviews with designer(s), developer(s), manager(s) and public officials; interviews with users and non-users; archival material searches including project files, newspaper articles, public records; bibliographic searches; and internet searches.” [52] (p. 21). This research focuses less on green spaces as a result of the work of a professional landscape designer, and more on the way selected parks are used by local residents.
In our study, we use techniques characteristic for urban ethnography [53]. Ethnographic methods in urban studies are rooted in the great traditions of urban sociology and the Chicago School [54]. They are recurringly used today, thanks to their predominance in describing contemporary urban areas as complex political, economic, and sociocultural organisms [55]. Certain types of ethnographic techniques can also be successfully used in research conducted in conditions as unusual as the times of a global pandemic. The uniqueness of this situation is both fascinating and hindering for researchers due to sanitary requirements, the need of social distancing, as well as other possible pandemic restrictions. Thus we describe our own approach to ethnographic research as pandemic urban ethnography. This procedure consists of:
  • Autoethnography.
  • Individual semi-structured interviews with green infrastructure users.
  • Non-participant observation.
  • Digital ethnography based on social media content.
The autoethnography method [56] used in this study is often related to the dissent against conservative approaches and top-down narratives in the classical scientific methodology. It seems to be well-fitted with an analysis of responses that are developed in opposition to official (top-down) design logic. This logic becomes even more vulnerable, debatable in pandemic circumstances. “In autoethnography, the focus of generalizability moves from respondents to readers and is always being tested by readers as they determine if a story speaks to them about their experience or about the lives of others they know” [57] (p. 283). Such “reading” can be referred not only to the reader’s reflectiveness but also to the way researchers “read” urban space themselves. Autoethnography is already used in public spaces research [58]. This human-oriented study complements more conventional methods of research in urban studies such as analysis of secondary data (e.g., public statistics) or GIS spatial analysis.
This research focuses on the reception of space among its users. Therefore, 11 semi-structured, in-depth interviews with users (n = 12) of selected parks were conducted—6 in Wellington, and 5 in Warsaw (one interview in Warsaw was carried out with two interlocutors at once). The applied sampling covered several types of respondents, representing “units” related not to individual persons, but various types of households and ‘generic’ categories of users: dog owners, seniors, youth and precariat representatives (Table 2). They are a reflection of the diverse patterns of space use rather than the entire social structure of the local community. It was an intentional decision of the researchers not to carry out the interviews in parallel in Warsaw and Wellington, mainly due to seasonal differences in weather and the contrasting dynamics of the pandemic. The interviews were conducted in various ways to best match the preferences and well-being of the respondents, e.g., their fear of social distancing. Therefore, the contact was obtained by phone or directly in the analysed space (Warsaw) and inside a private apartment or in the local community hub (Wellington). The interview scenario is included in Appendix A.
The interviews were supplemented with non-participant observation and behavioural desk research analysis [59] based on the content posted on Instagram. From a practical standpoint, such digital ethnography can be a research tool particularly useful in the conditions of a pandemic and social distancing. This allows one to study the natural reactions of users (posts they publish on the web independently) without direct contact between researchers and respondents. Digital ethnography approach is used by different urban studies scholars and is often carried out with the same social media platform we selected (Instagram) [59,60,61].

3. Results

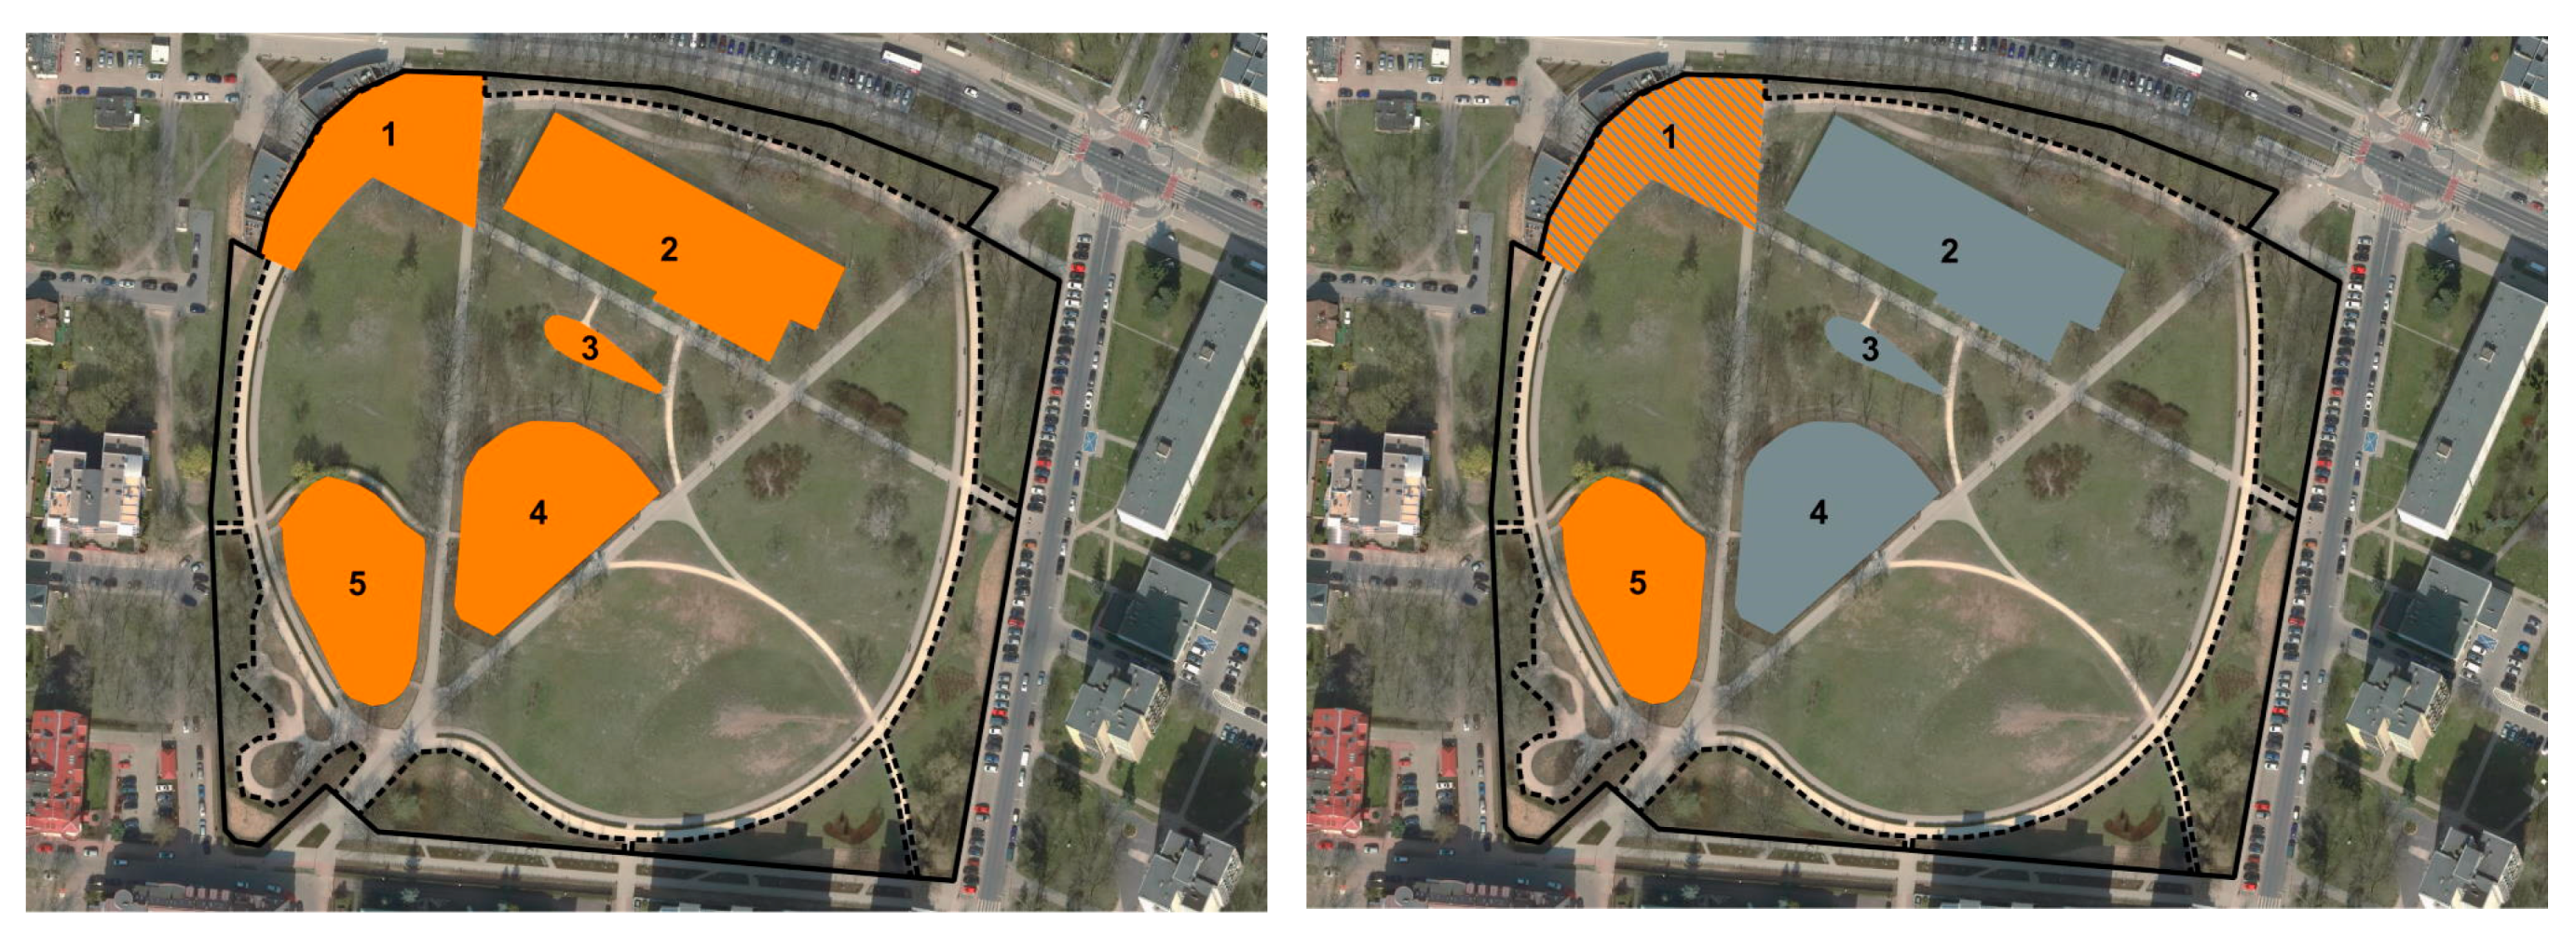
3.1. Functional Changes

The COVID-19 pandemic dynamics in the two analysed case studies were different. Its scale in New Zealand was relatively moderate, thanks to which this state began to remove almost all of its sanitary restrictions already in the second half of 2020. Poland relatively gently passed the first phase, but in late 2020, it was one of the most severely affected European states. Exact figures on the scale of the pandemic there are not known, but the number of reported deaths was nearly 80,000 more than the year before [62]. The latter more than doubled the number officially reported as a result of Covid-19. However, there were also some similarities between the two selected cases (Figure 2). In the case of the New Zealand government COVID-19 information campaign, one of the key messages encouraged people to socially distance themselves from other urban dwellers [63] or to shut off to prevent the spread of germs [64]. For example, the Dunedin City Council informed park users on the closure of some recreational areas [64,65]. Due to similar restrictions in Wellington, Miramar Park lost much of its usual functionality during lockdown (level 4 and 3 restrictions). All team sports and practices ceased. Bowling and Tennis clubs, as well as the kindergarten, were closed, with all the fenced areas (courts, greens) inaccessible. What was left from parks’ functional areas was the central large lawn and paved roads that lead to it. The size of the field attracted users who needed to stay within a regulatory “social” distance from other “bubbles”. Miramar Park lawn turned out to serve as a large green canvas where each family, “bubble” or individuals can paint, invent their own, tactical response to the need of “alternative” pandemic recreation (Figure 3). Asphalt roads became occupied with smaller kids practising biking and riding scooters, while slightly older children were climbing the pohutukawa trees. Edges of the lawn were commonly used as a running and walking track, while the field itself as a universal, multifunctional space that was spontaneously, informally and intuitively divided into smaller “bubble” areas, proving more than enough distancing between small groups of users. Centrally located 3 cricket pitches (approx. 60 square meters each) lined with artificial turf served as sitting picnic “mats” while the grass was slightly wet or for infants learning to crawl and walk. Aside from “typical” park uses (ball and frisbee play, picnics, running, walking and biking) some “pop-up” uses were observed during level 3 and 4 pandemic emergency included: setting up training grounds with equipment brought from home (cones, poles, portable mini-goals, etc.), flying kites and drones. Many of these behaviours were not observed, or rare in the park before or after COVID-19 pandemic. One could notice general reluctance in using benches that are situated along the park’s fence, with sitting on grass being the preferred way to rest. Spontaneous and ‘tactical’ behaviours that were observed in the park were consistent with what took place in the public space. People of Miramar showed their involvement in the common effort to stop the virus spreading by marking the pavement with chalk-drawn feel-good messages, games for kids but also exhibiting toy bears and notes (‘Stay home. Stay safe’) in their windows.
Observations of Miramar park central lawn included simple headcounts that were performed at 11 AM and 5 PM during and after lockdown, on ‘good weather’ days (temperature between 15 and 25 °C, no rain and none to moderate strength wind). Total of 36 headcounts were carried out, 18 during the lockdown and 18 at level 1 (lowest) restrictions after lockdown concluded (Figure 4). The headcounts indicated that during the lockdown the park lawn was occupied by a maximum number of 31 people in 14 “social bubbles” (groups of people that live in the same household, often families). Median number of users for that period in time was 13 people in 6 bubbles, with marginal difference between weekday and weekend use. There was a notable contrast between morning (11AM) and afternoon (5 PM) numbers with double the amount of users attracted to the park after typical (8 AM–4 PM) office hours. Biggest observed ‘social bubble’ in the park was made out of 6 people. The 18 headcounts that were carried out after lockdown showed that outside of team play and organised sports (cricket, lawn bowling and tennis) (The post-lockdown headcounts were deliberately conducted outside of team playtimes. We wanted to compare the use of the park as a neighbourhood recreation area (as it functioned during lockdown) rather than a sports field for organised team play. The number of people during weekend sports events often exceeds 100 people (including spectators).) the lawn is visibly less used with a maximum number of 10 people in 3 “bubbles” and a median of 3 people in 2 “bubbles”.
Figure 5 shows the usual spatial division of the lawn into 12 pitches of various sizes [44] in Miramar Park. This division is in place during the winter season (lockdown was implemented during this period) and practically only effective on the weekends and some weekday evenings during team practice and games. The same space is used for cricket play during the summer season. At other times the large lawn is open for any other public use with dog walking as one of the main activities. But there is very little use of the lawn outside of the weekend.
The Polish anti-virus strategy was initially very restrictive and focused on, inter alia, limitations of freedom of movement and closure of public amenities. The youth could not leave home without being supervised and accompanied by adults. Seniors were discouraged from leaving the house, except to do grocery shopping during “seniors” hours, when stores were open for people aged 60 plus. All types of green infrastructure were out of order at some point. In Warsaw, decisions on this matter were first taken by individual districts, then by the overall city authorities (different levels of administration manage individual squares and parks). On 31 March 2020, the bans were additionally tightened by the state authorities—at this time not only all parks but also forests were closed in the entire Poland. The first period of lockdown caused the closure of the entire Polińskiego Park. The spatial structure of the park allows for easy distinguishing of its functional zones (Figure 6). Their boundaries are clearly marked with varied surfaces or a metal fence. After the restrictions were partially loosened (the most rigid phase lasted 3 weeks), only some parts of the park remained closed. These were both areas separated by fences (sports field, children’s playground) as well as open areas (a square with a fountain used for local festivals, an outdoor gym, benches). They were either fully locked, taped off or, in the least, limited in their functions. For instance, the public square was still accessible but devoid of any community gatherings or events. Among the designed functional areas, only the dog paddock remained opened, as it was less important from the point of view of social distancing requirements. The area hidden behind the bushes (the dashed line in Figure 6) did not change its function either. The latter was used informally also before the pandemic by dog owners, homeless people and those who illegally consume alcohol.
Polińskiego Park’s attractiveness for users seemed not to decline during the post-closure lockdown. The number of accessible areas and hence the amount of available ‘pre-designed’ functions decreased, but at the same time, there was a greater quantity of the informal, user-generated, non-designed functions. Moreover, the intensity of these informal uses has often also increased. Some activities or exercises previously performed with the use of pre-designed park equipment (e.g., the outdoor gym) were now carried out in places that were originally not intended for this purpose by the designers of the park. The park, though quite rigidly planned and formal, was flexibly adapted to the existing situation. It happened despite the limitation of the space available to users. The closure of the vast majority of formal functions resulted in a reduction of commonly used space by as much as 19%. By the same token, it seems that in pandemic conditions, non-designed functions compensate to some extent for pre-designed ones, despite the loss of available space.
Similar trends were visible in both analysed parks, as Table 3 indicates. However, we are fully aware that the uses that were observed by the researchers might not represent the entity of the behaviours/functions on display in the park. Some of them are also confirmed mostly by the authorial observations or the interview findings from quite a modest sampling. For example, in the case of Polińskiego Park, it was not possible to obtain exact headcount results due to the spatial structure of this green area. The park has more than one urban interior preventing precise observation from one point.

3.2. Social Media Monitoring

The social media monitoring of the two selected case study areas is based on Instagram data. Due to unequal data availability, we have decided to introduce some intended variations in our analysis. Polinskiego Park was well represented on Instagram (81 posts), but in the case of Miramar Park, there was a very low number (6) of posts that included photos taken in the space. This is why the Miramar Park analysis was extended to all public and green areas in Miramar. This sample included 63 posts provided by 50 individual users during Level 3 and 4 lockdown (23 March to 13 May). These posts were selected using a location-based search. We applied 3 search cues: Miramar, New Zealand (523 posts found); Miramar peninsula (43); Polo ground (20). From these 583 Instagram posts, we manually picked 64 posts that both depicted natural landscape, green space or public space and included description or hashtags that referred to lockdown, pandemic or restrictions. The six photographs taken in Miramar Park showed: time spent with family (1 post, Figure 7); return to individual tennis practice after level 4 restrictions were lifted (2) and dog walking (3).
The most common picture themes in the 63 chosen posts included: Distant beautiful views of the landscape, often of green hills and water (31); spending time with family, the “social bubble” (6); exercise and sport (6); dogs (6); sings of community kindness and support such us bears in windows and outside houses (5); biking (4), views of park or sports grounds (4) and beach or water play (3). Some other, less common themes involved: empty streets (3); closed playground and recreational infrastructure (2); sculptures (2); graffiti (1) and wearing masks in public (1). Text descriptions and hashtags provided insight into public and green space users mindsets during the lockdown. Frequent themes in the text included: thankfulness, joy, gratefulness and kindness (15); lockdown movement and travel restrictions (11); Isolation hardship/solitude/social distancing (10); count of lockdown days (7); fun activity and exercise (6) and spending time with family or the “bubble” (5) (Other less common descriptions were focused on the empty city, closed, unused infrastructure (4); remedy, relief, keeping sanity and self-care (3); “Stay in bubble”, “Stay safe”, “Stay local” cautionary messages (3) and coronavirus, COVID-19 (2). Post included a great variety of attached hashtags with many of them quite descriptive: #remedy, #stayhome, #kiakaha #lockdowndoesnthavetobeboring, #lockdown, #bubblebuddies, #lockdowndiscovery, #covid #selfcare, #dayX (a count of lockdown days, example: #day7)). This limited social media analysis revealed that, in the case of Miramar, people preferred to share scenic, sweeping views of landscapes, possibly seeking serenity connecting to nature and water, while dealing with the lockdown hardships. Miramar parks were depicted as places for individual exercise, family leisure and dog-walking.
The social media analysis of the use of the Polińskiego Park is based on photos published by Instagram users and was conducted from the beginning of March to the end of June 2020. The selected sample includes 81 photos. However, thanks to the fact that they were posted from 63 different Instagram accounts, it ensures quite a large representation of park users.
COVID-19 hit public awareness in Poland in mid-March. This was the first time when the pandemic became the subject of user-posted photos (Figure 8). It occurred 12 days after the first case of infection in Poland was recorded (4th March). Two days earlier, the number of infections in Poland began to exceed 100 cases a day, and SARS-CoV-2 impact became widely felt due to the introduction of lockdown, including the particularly distressing closure of schools. Since then, the pandemic became clearly present in the online usage representation of Polińskiego Park. In the analysed period, it became the subject of 1 in 4 photos, although twice as often COVID-19 was present in text descriptions (19.8%) as compared to the theme of the photos themselves. Only 11.1% of them showed an image directly connected to the pandemic: masks, official announcements, signs in public space or gates closed due to the lockdown. “Covid photos” were published systematically until the beginning of June when the number of daily cases decreased slightly and school activities began to resume. On the other hand, those photos were published much less often (23.5%) than the photos that showcased the positive attitude of users towards the park (59.3%), expressed in photographing general views of space, urban details, various people in specific context or drawings and other types of graphic representation of the park [59]. The pandemic, however, was clearly visible—its traces were photographed with almost the same frequency as people in an unspecified spatial context, including the so-called selfies (21%), or animals (25.9%). Meanwhile, these are typical traces of the use of this space on the Internet—a meeting place and a popular destination for dog owners.

3.3. Declarative Use of Parks—Conclusions from the Interviews

The analysis of the content of the interviews with park users shows that the user activity clearly increased in both described places. Although some people declared a lower frequency of visits, the reason was not related to the changes in the green space itself (e.g., closures of part of the park). A student from Wellington (WEL5) visited the park less frequently due to the cancellation of sports activities in which he participated. A young mother (WAR1) and a retired woman (WAR3) from Warsaw explained that the safety/health concerns related to the pandemic were the main reason for less frequent visits in the park. However, these respondents still infrequently used the Polińskiego park, and what is more, a new group of users also started to appear there. The latter group has so far overlooked green spaces near their home, and now, without an alternative for past time activities, choose to use them with an increased frequency. For example, a retired man from Wellington (WEL4), “had not been there for years’’ before the lockdown.
Some users also come to the parks for an extended amount of time. For these respondents, what initially discouraged longer visits was the policy introduced by the authorities (the lockdown itself) rather than the reluctance to stay in public space during the pandemic. In the phase of hardest restrictions in Poland, parks were shut down. After they partially reopened, visits to these places were accompanied by an incentive to avoid close contacts with other people. This has been similarly reported by mothers of children playing in parks in different parts of the world. One of them (WEL1) wanted to respect the privacy of other people and “was scanning space to decide where it’s safe to be, not to interfere with their activities”. The second (WAR1) reduced the previously extensive use of many facilities of the park, limiting herself to “following the alleys”. Similarly, the dog owner (WAR2) started “avoiding contacting” other people. Because of that she even decided to avoid the aforementioned walking paths. Respondents that represent other types/groups of users noted that they could not use the playground or have to resign from team sports, which reduced the number of reasons for spending time in the park.
As the pandemic continued, parks began to be used more and more often. In Miramar various people started “using it more, for walking but also for picnics, which didn’t happen often before. There were definitely more people there and they used it at different times of the day then normally” (WEL3). Exactly the same process has been observed in Warsaw, where “is more people now, entire families […] who occur there in swarms” (WAR2). This increased presence of families was also indicated by almost all respondents, despite the closure of playgrounds during the lockdown. More frequent use of green spaces by older residents was indicated in both places as well.
The respondents quite consistently praised the high discipline of park users, their compliance with sanitary standards, wearing masks, or sticking to an allowed group of social contacts—”bubbles” (regulation specific to New Zealand). This trend was visible despite the distinctive dynamics of the pandemic, cultural differences, and particular policies implemented in both states.

4. Discussion

The COVID-19 pandemic brought unfamiliar challenges in urban policy worldwide, irrespectively of existing policies and strategies that outlined influenza pandemic frame for action [67,68]. Many responses, including these from policymakers, were spontaneous, transitory and burdened with great risks of errors. Cities had to respond quickly, and the reactions were triggered by often uncoordinated restrictions introduced by the national governments [69]. The response to the pandemic crisis is an obvious example of the “garbage can model” of policymaking. It is a situation in which policymaking becomes the result of a rather random and chaotic constellation of limited knowledge about a problem/phenomenon and limited possibilities of counteracting it with the public intervention [70]. In 2020, in all parts of the world, the decision-makers not only had to make unpopular decisions but moreover, they were “not necessarily surrounded by timely scientific evidence or reasonable evidence in the initial stages of a pandemic” [71] (p. 708). Closure of parks, recreation areas and urban forests during strict lockdown periods became highly contested and questioned as a mistake during the time of overwhelming health crisis and general social distress. This tension was only amplified by the general contemporary trend of the lack of trust in the public sector and its interventions. The latter are not perceived by citizens as institutions entitled to commit mistakes or to the convenience of trial and error periods (characteristic rather for start-up companies, where provisory actions are associated with the acceptable risk of their innovativeness) [72].
A growing body of research shows a scientific consensus on the importance of parks and urban greenery for health and well-being [73,74,75,76,77]. At the same time, the COVID-19 pandemic underlined the importance of informal, semi-natural spaces in the city and their ecological services provisioning [78,79,80,81,82,83]. Informal green space (overgrown brownfields, ‘wild’ riverbanks, road reserves etc.) became crucial for pandemic recreation as these areas operate outside the official park and urban forest register and could not be subject to the same restrictions. Closures of smaller public green spaces, crowded and equipped with a large number of urban furniture/facilities, such as pocket parks and playgrounds, is understandable during the pandemic. Meanwhile, large open areas, including (horse, car) race-tracks, airports and cemeteries (already functioning as multifunctional spaces [84]) seem ideally suited for exercise and other open-air activities during pandemics. Tempelhofer Feld in Berlin, the former airport turned into an informal public park was popular during lockdowns, providing more than enough space for adequate social distancing [9,85]. The interviews showed that during the time of first lockdown restrictions, people felt that, when provided enough space, most park users were behaving responsibly when it comes to distancing and limiting contacts outside of “bubbles”.
This shines a light on highly developed and perhaps “over-designed” green spaces with an excess of amenities and formal functions. Green spaces can be created and programmed with a more flexible approach, allowing spontaneous and bottom-up, tactical use [21]. Green spaces that are lighter in pre-designed function, created with a low-budget mindset can be seen by both the experts and active users as equally successful and valuable to resource-heavy, expensive designs [86]. This urge to arrange every last bit of each green space is well visible in the amount of new amenities built through participatory budget mechanisms in Warsaw [87]. On the opposite side of the spectrum, allotment gardens, as partitioned green spaces, preassigned to “social bubbles” (mostly families), might be fitting to the challenges of a pandemic as well [88]. An increasing interest in local food production, food security [89], and self-sufficiency, particularly in the times of crisis, adds to allotment gardens popularity, that resulted in a great demand and gardens’ price increase [90].
The threat of future pandemics adds yet another reason to promote and plan for quality public green space in the city [91]. The way we, in the post-pandemic world, rethink and reshape access to green infrastructure will be the greatest test of urban resilience [92]. As urban populations increase, cities globally need to provide new, accessible and multifunctional green infrastructure as a conscious investment in the health of its citizens and resilience against future environmental change and challenges [93,94]. As of today, exposure to parks and recreation grounds often is beneficial to the health of those living in gentrified or gentrifying neighbourhoods. It is clear that future planning of green infrastructure needs to be evaluated within the context of urban social inequity and change [95]. This pandemic has emphasized that access to green space needs to be increasingly recognized as an environmental justice issue [96].

5. Conclusions

The exploratory character of this study and its limited scope does not enable to draw universal conclusions on the complex pandemic situation in all green infrastructure in its tremendous diversity. Nevertheless, trends visible in two geographically distant and varied cases seem to confirm some possible conclusions on the operation and use of urban parks in COVID-19 pandemic.
Green spaces play a crucial role during pandemic lockdowns, providing ecosystem services related to health, well-being, recreation and (temporarily constrained) social life. This is consistent throughout the literature review, case studies, observations and collected data analysis and allows us to positively answer the first research question. The increased intensity of green space use in 2020 clearly corroborates this conclusion (Figure 9). Right after the pandemic’s outbreak the number of visits in various green infrastructure facilities significantly decreased (in an average year this indicator should rather follow the opposite trend due to a warming of temperature typical for the period after March in global north countries). After the inhabitants got used to the pandemic conditions, the use of green infrastructure has significantly increased. The reopening of parks and forests in Poland in the second half of April is clearly reflected in these quantitative data. Similar properties can be seen in the example of various European countries. New Zealand, in turn, follows the trend typical of the global south. The first months of the pandemic’s development there were not correlated with the advent of warmer seasons.
To answer research question 2, we found that amongst the larger number of ‘pandemic users’ there were both new and returning users, some who did not use their local parks in years. The parks were used by the representatives of different social groups and were critical to children for whom the lockdown conditions and limited peer contact seem particularly burdensome, as well as for seniors who seek physical activity during the time of forced home isolation.
The answer to research question 3 seems to be positive. While playgrounds, swimming pools, cinemas, libraries, restaurants and almost all other types of recreational amenities were shut down, past-time activities migrated to backyards, parks, reserves, urban forests (although some of them became temporarily closed as well). This “pandemic” park use is “tactical”, spontaneously customised and fitted in accordance with the new rules, policies that demand specific social behaviour such as physical distancing. It is also largely independent from and unlimited to designed elements (furnishing, equipment) and park facilities that became unavailable due to restrictions. Areas of “designed” or “equipped” space becomes limited or inaccessible in many ways, and this often leads to user-led modifications to the accessible, “left-over” space.
Large, open spaces such as park lawns functioned as the primary place for outdoor activities, often assuming the role of major public spaces. Such areas are suitable for recreation and social life while limiting infection risks and complying with lockdown regulation (e.g., staying in social “bubbles”). This strengthens the role of green areas as nodes and local centres important for their communities, therefore in our opinion, there is a clear impact of urban parks on the wider phenomenon of urban planning adjustments to pandemic conditions. Interviews and social media analysis show that urban greenery and natural landscapes are in great demand, and are associated with some ‘healing’ potential. Families were at home, often with more flexible, remote work schedules, seeking occasional refuge and rest from lockdown hardship.
To address question 4, one could observe that the research revealed that urban policies and restrictions could have (temporarily) a greater impact on the use of green space use than landscape/architectural design. This was confirmed by the decrease in the number of visits to green infrastructure facilities in the initial stages of the pandemic—quantified both by official statistics and primary sources obtained through our research as well as on the base of the findings of qualitative interviews. The tactical use and new uses popping up while some, designed and ‘equipped’ parts of the parks were inaccessible, are also a testimony to the changes in use spurred by the restrictive, pandemic related, urban policies.

Author Contributions

Equal contribution K.H. and Ł.D. All authors have read and agreed to the published version of the manuscript.

Funding

This study did not receive external funding.

Institutional Review Board Statement

Not applicable.

Informed Consent Statement

Informed consent was obtained from all subjects involved in the study.

Data Availability Statement

Data is contained within the article or referenced.

Conflicts of Interest

The authors declare no conflict of interest.

Appendix A

Table A1. Interview scenario for the in-depth semi-structured interview of park users.
Interview Scenario
PART 1.Introduction to the interview: self-introduction and clarification of the purpose of the conversation (a scientific study of the use of Miramar/Polińskiego Park; questions about the respondent’s needs or doubts).
PART 2.Research questions:
  • How often do you visit the park and has the intensity of these visits changed after the lockdown was introduced?
  • Has the way you use the park changed due to pandemic limitations? (and optional clarification of questions, if respondents do not answer themselves about the length of time spent in the park, time of the day, and any new behaviours)
  • From the point of view of your presence in the park, do you see anything that particularly irritates you, or are there any good consequences of the lockdown visible in the ways other people behave in the park?
  • Did new people appear in the park after the lockdown who were not present here before?
PART 3.Thanks for the conversation and collecting any additional comments.

References

  1. Szczygiel, B.; Hewitt, R. Nineteenth-century medical landscapes: John H. Rauch, Frederick Law Olmsted, and the search for salubrity. Bull. Hist. Med. 2000, 74, 708–734. [Google Scholar] [CrossRef] [PubMed]
  2. Klein, C. How Pandemics Spurred Cities to Make More Green Space for People. Available online: https://www.history.com/news/cholera-pandemic-new-york-city-london-paris-green-space (accessed on 16 November 2020).
  3. Rybczynski, W. A Clearing in the Distance: Frederick Law Olmsted and America in the 19th Century; Scribner: New York, NY, USA, 1999; ISBN 9780684824635. [Google Scholar]
  4. Fisher, T. Frederick Law Olmsted and the Campaign for Public Health. Places 2010. [Google Scholar] [CrossRef]
  5. Allam, Z.; Jones, D.S. Pandemic stricken cities on lockdown. Where are our planning and design professionals [now, then and into the future]? Land Use Policy 2020, 97, 104805. [Google Scholar] [CrossRef] [PubMed]
  6. Shribman, D. Revisiting an Old Treatment for Infectious Disease: Fresh Air. The Boston Globe. 2020. Available online: https://www.bostonglobe.com/2020/04/04/opinion/revisiting-an-old-treatment-infectious-disease-fresh-air/ (accessed on 1 May 2020).
  7. Hobday, R.A.; Cason, J.W. The open-air treatment of pandemic influenza. Am. J. Public Health 2009, 99 (Suppl. 2), S236–S242. [Google Scholar] [CrossRef] [PubMed]
  8. Roberts, J.D.; Tehrani, S.O. Environments, Behaviors, and Inequalities: Reflecting on the Impacts of the Influenza and Coronavirus Pandemics in the United States. Int. J. Environ. Res. Public Health 2020, 17, 4484. [Google Scholar] [CrossRef]
  9. Kleinschroth, F.; Kowarik, I. COVID-19 crisis demonstrates the urgent need for urban greenspaces. Front. Ecol. Environ. 2020, 18, 318–319. [Google Scholar] [CrossRef]
  10. Akpinar, A.; Barbosa-Leiker, C.; Brooks, K.R. Does green space matter? Exploring relationships between green space type and health indicators. Urban For. Urban Green. 2016, 20, 407–418. [Google Scholar] [CrossRef]
  11. Coppel, G.; Wüstemann, H. The impact of urban green space on health in Berlin, Germany: Empirical findings and implications for urban planning. Landsc. Urban Plan. 2017, 167, 410–418. [Google Scholar] [CrossRef]
  12. Xie, J.; Luo, S.; Furuya, K.; Sun, D. Urban Parks as Green Buffers During the COVID-19 Pandemic. Sustain. Sci. Pract. Policy 2020, 12, 6751. [Google Scholar] [CrossRef]
  13. Braubach, M.; Egorov, A.; Mudu, P.; Wolf, T.; Ward Thompson, C.; Martuzzi, M. Effects of Urban Green Space on Environmental Health, Equity and Resilience. In Nature-Based Solutions to Climate Change Adaptation in Urban Areas: Linkages between Science, Policy and Practice; Kabisch, N., Korn, H., Stadler, J., Bonn, A., Eds.; Springer International Publishing: Cham, Switzerland, 2017; pp. 187–205. ISBN 9783319560915. [Google Scholar]
  14. McCunn, L.J. The importance of nature to city living during the COVID-19 pandemic: Considerations and goals from environmental psychology. Cities Health 2020, 1–4. [Google Scholar] [CrossRef]
  15. Rodgers, C. Nourishing and protecting our urban “green” space in a post-pandemic world. Environ. Law Rev. 2020, 22, 165–169. [Google Scholar] [CrossRef]
  16. Day, B.H. The Value of Greenspace under Pandemic Lockdown. Environ. Resour. Econ. 2020, 1–25. [Google Scholar] [CrossRef] [PubMed]
  17. Venter, Z.S.; Barton, D.N.; Gundersen, V.; Figari, H.; Nowell, M. Urban nature in a time of crisis: Recreational use of green space increases during the COVID-19 outbreak in Oslo, Norway. Environ. Res. Lett. 2020, 15, 104075. [Google Scholar] [CrossRef]
  18. Sharifi, A.; Khavarian-Garmsir, A.R. The COVID-19 pandemic: Impacts on cities and major lessons for urban planning, design, and management. Sci. Total Environ. 2020, 749, 142391. [Google Scholar] [CrossRef] [PubMed]
  19. Honey-Roses, J.; Anguelovski, I.; Bohigas, J.; Chireh, M.; Vincent, K.; Daher, C.; Konijnendijk, C.; Litt, J.; Mawani, V.; McCall, M.; et al. The Impact of COVID-19 on Public Space: A Review of the Emerging Questions. Cities Health 2020. [Google Scholar] [CrossRef]
  20. Combs, T. Local Actions to Support Walking and Cycling During Social Distancing Dataset. 2020. Available online: http://pedbikeinfo.org/resources/resources_details.cfm?id=5209 (accessed on 1 October 2020).
  21. Herman, K.; Rodgers, M. From Tactical Urbanism Action to Institutionalised Urban Planning and Educational Tool: The Evolution of Park(ing) Day. Land 2020, 9, 217. [Google Scholar] [CrossRef]
  22. Tactical Urbanism as a Response during the Pandemic. Available online: https://www.metropolis.org/news/tactical-urbanism-response-during-pandemic (accessed on 26 January 2021).
  23. Barbarossa, L. The Post Pandemic City: Challenges and Opportunities for a Non-Motorized Urban Environment. An Overview of Italian Cases. Sustain. Sci. Pract. Policy 2020, 12, 7172. [Google Scholar] [CrossRef]
  24. Slater, S.J.; Christiana, R.W.; Gustat, J. Recommendations for Keeping Parks and Green Space Accessible for Mental and Physical Health during COVID-19 and Other Pandemics. Prev. Chronic Dis. 2020, 17, E59. [Google Scholar] [CrossRef]
  25. Reid, C. New Zealand First Country to Fund Pop-Up Bike Lanes, Widened Sidewalks During Lockdown. Forbes Magazine. Available online: https://www.forbes.com/sites/carltonreid/2020/04/13/new-zealand-firstcountry-to-fund-pop-up-bike-lanes-widened-sidewalks-during-lockdown/ (accessed on 5 May 2020).
  26. NZ Transport Agency Innovating Streets—All Updates | Waka Kotahi NZ Transport Agency. Available online: https://www.nzta.govt.nz/roads-and-rail/innovating-streets/ (accessed on 4 May 2020).
  27. Govt to Fund Temporary Cycleways and Footpaths Post COVID-19 Lockdown. Available online: https://www.beehive.govt.nz/release/govt-fund-temporary-cycleways-and-footpaths-post-covid-19-lockdown (accessed on 4 May 2020).
  28. Wellington. A Green Covid-19 Recovery Programme for Wellington. Available online: http://wellington.scoop.co.nz/?p=127717 (accessed on 17 November 2020).
  29. Kolejne kroki w walce z koronawirusem–w sklepie mniej osób, ograniczenia w poruszaniu nieletnich, a parki, plaże i bulwary zamknięte—Koronawirus: Informacje i zalecenia—Portal Gov.pl. Available online: https://www.gov.pl/web/koronawirus/kolejne-kroki (accessed on 1 December 2020).
  30. Miejskie parki, lasy, bulwary, plaże i zieleńce niedostępne. Available online: http://www.um.warszawa.pl/aktualnosci/miejskie-parki-bulwary-pla-e-i-ziele-ce-niedost-pne (accessed on 1 December 2020).
  31. Lasy i parki narodowe otwarte—Regionalna Dyrekcja Ochrony Środowiska w Gorzowie Wielkopolskim—Portal Gov.pl. Available online: https://www.gov.pl/web/rdos-gorzow-wielkopolski/lasy-i-parki-narodowe-otwarte (accessed on 1 December 2020).
  32. Alert Level 3 Means Stay Home and Stay Local. Available online: https://ourauckland.aucklandcouncil.govt.nz/articles/news/2020/08/alert-level-3-means-stay-home-and-stay-local/ (accessed on 1 December 2020).
  33. Bezpieczne chodniki. Przenosimy parkowanie na jezdnię. Available online: https://www.um.warszawa.pl/aktualnosci/bezpieczne-chodniki-przenosimy-parkowanie-na-jezdni (accessed on 1 December 2020).
  34. Więcej miejsca dla pieszych na placu Zbawiciela. Available online: https://www.um.warszawa.pl/aktualnosci/wi-cej-miejsca-dla-pieszych-na-placu-zbawiciela (accessed on 1 December 2020).
  35. Horton, R.P. Lawn Mowed into Checkerboard Becomes Natural Social Distancing Space—Urban Gardens. Available online: https://www.urbangardensweb.com/2020/06/26/lawn-mowed-into-checkerboard-becomes-natural-social-distancing-space/ (accessed on 1 December 2020).
  36. Elblag: Social Distancing Lawn Brings People Together. Available online: https://www.ubc.net/content/elblag-social-distancing-lawn-brings-people-together (accessed on 1 December 2020).
  37. Traverso, V. How Social-Distancing Symbols Are Changing Our Cities; BBC. Available online: https://www.bbc.com/worklife/article/20200909-how-social-distancing-symbols-are-changing-our-cities (accessed on 1 October 2020).
  38. Pillans, B.; Huber, P. New Zealand. Earthquake and War Damage Commission Earthquakes and Uplift History of Miramar Peninsula, Wellington: By Brad Pillans & Phil Huber; Report to the Earthquake & War Damage Commission; Research School of Earth Sciences Victoria University of Wellington: Wellington, New Zealand, 1992. [Google Scholar]
  39. Grapes, R.; Campbell, H.; Eagar, S.; Ruthven, J. A history of the geology of Wellington Peninsula, New Zealand: An analysis of nineteenth to early twentieth century observations and ideas. J. R. Soc. N. Z. 2011, 41, 167–204. [Google Scholar] [CrossRef]
  40. A Sneaky Peek at Miramar’s History. Available online: https://wellington.govt.nz/wellington-city/about-wellington-city/history/throwbackthursday/miramar (accessed on 10 December 2020).
  41. 2018 Census Place Summaries. Available online: https://www.stats.govt.nz/tools/2018-census-place-summaries/ (accessed on 10 January 2021).
  42. Plan of the Town of Miramar North, Wellington 1906. Alexander Turnbull Library. Available online: https://ndhadeliver.natlib.govt.nz/delivery/DeliveryManagerServlet?dps_pid=IE439969 (accessed on 1 February 2021).
  43. Archives Online Miramar Park. Available online: https://archivesonline.wcc.govt.nz/nodes/view/116477 (accessed on 1 February 2021).
  44. Sportsground Locations. Available online: https://wellington.govt.nz/recreation/sports/sportsgrounds/strategy (accessed on 12 December 2020).
  45. Lynch, K. The Image of the City; MIT Press: Cambridge, MA, USA, 1960; ISBN 9780262620017. [Google Scholar]
  46. Wybory Samorządowe 2018. Available online: https://wybory2018.pkw.gov.pl/ (accessed on 23 December 2020).
  47. GUS—Bank Danych Lokalnych. Available online: https://bdl.stat.gov.pl/BDL (accessed on 23 December 2020).
  48. Whyte, W.H. The Social Life of Small Urban Spaces. 1980. Available online: https://www.academia.edu/download/55908872/thesociallifeofsmallurbanspacesmohddanish-150407042346-conversion-gate01.pdf (accessed on 1 February 2020).
  49. UM. st. Warszawy, Mapa Warszawy. Available online: http://mapa.um.warszawa.pl (accessed on 9 January 2021).
  50. GUS Stratyfikacja dochodowa mieszkańców miast. Available online: https://stat.gov.pl/statystyki-eksperymentalne/jakosc-zycia/stratyfikacja-dochodowa-mieszkancow-miast,5,1.html?fbclid=IwAR0Lt9pYpu4tDJZwaM_syjWQWQKTje9M7NWkDaqlqdw71GL9cmM5LLVwchU (accessed on 28 January 2021).
  51. Stake, R.E. Qualitative Case Studies. In The Sage Handbook of Qualitative Research, 3rd ed.; SAGE Publishing: Thousand Oaks, CA, USA, 2005; Volume 3, pp. 443–466. [Google Scholar]
  52. Francis, M. A Case Study Method for Landscape Architecture. Landsc. J. 2001, 20, 15–29. [Google Scholar] [CrossRef]
  53. Duneier, M.; Kasinitz, P.; Murphy, A. The Urban Ethnography Reader; Oxford University Press: Oxford, UK, 2014; ISBN 9780199743575. [Google Scholar]
  54. Jackson, P. Urban Ethnography. Prog. Hum. Geogr. 1985, 9, 157–176. [Google Scholar] [CrossRef]
  55. Pardo, I.; Prato, G.B. Introduction: Urban Ethnography Matters—Analytical Strength, Theoretical Value and Significance to Society. In The Palgrave Handbook of Urban Ethnography; Pardo, I., Prato, G.B., Eds.; Springer International Publishing: Cham, Switzerland, 2018; pp. 1–19. ISBN 9783319642895. [Google Scholar]
  56. Holman Jones, S. Autoethnography. In The Blackwell Encyclopedia of Sociology; John Wiley & Sons, Ltd.: Hoboken, NJ, USA, 2007. [Google Scholar]
  57. Ellis, C.; Adams, T.E.; Bochner, A.P. Autoethnography: An Overview. Hist. Soz. Forsch. 2011, 36, 273–290. [Google Scholar]
  58. Hayes, T.A. “I Thought… I Saw… I Heard…”: The Ethical and Moral Tensions of Auto/Biographically Opportunistic Research in Public Spaces. In The Palgrave Handbook of Auto/Biography; Palgrave Macmillan: London, UK, 2020; pp. 285–303. [Google Scholar]
  59. Drozda, Ł. The behavioural desk research in urban space analysis as a policy tool: The case of Instagram. KSzPP 2020, 61–77. [Google Scholar] [CrossRef]
  60. Boy, J.D.; Uitermark, J. How to study the city on Instagram. PLoS ONE 2016, 11, e0158161. [Google Scholar] [CrossRef] [PubMed]
  61. Zappavigna, M. Social media photography: Construing subjectivity in Instagram images. Vis. Commun. 2016, 15, 271–292. [Google Scholar] [CrossRef]
  62. GUS Weekly Deaths. Available online: https://stat.gov.pl/en/topics/population/population/weekly-deaths,12,2.html (accessed on 28 January 2021).
  63. Leaving Your House. Available online: https://covid19.govt.nz/travel-and-the-border/travel-within-new-zealand/leaving-your-house/ (accessed on 15 January 2021).
  64. Playground Equipment “Must Not Be Used”: DCC. Available online: https://www.odt.co.nz/news/dunedin/dcc/playground-equipment-%E2%80%98must-not-be-used%E2%80%99-dcc (accessed on 15 January 2021).
  65. Facebook. Available online: https://www.facebook.com/DunedinCityCouncil/photos/a.226655984046754/2904489596263366/?type=3 (accessed on 15 January 2021).
  66. Sportsground Locations. Available online: https://wellington.govt.nz/recreation/sports/sportsgrounds/sportsground-locations (accessed on 12 December 2020).
  67. Ministry of Health. New Zealand Influenza Pandemic Plan: A Framework for Action, 2nd ed.; Ministry of Health: Wellington, New Zealand, 2017. [Google Scholar]
  68. World Health Organization. Others Communicating Risk in Public Health Emergencies: A WHO Guideline for Emergency Risk Communication (ERC) Policy and Practice; World Health Organization: Geneva, Switzerland, 2017. [Google Scholar]
  69. Grochowicz, M.; Salata-Kochanowski, P. Działania miast podczas pandemii marzec 2020. In Instytut Rozwoju Miast I Regionów: Ekspertyzy i Opracowania Badawcze Obserwatorium Polityki Miejskiej; IRMiR: Warsaw, Poland, 2020. [Google Scholar]
  70. Kingdon, J.W.; Stano, E. Agendas, Alternatives, and Public Policies; Little, Brown: Boston, MA, USA, 1984; Volume 45. [Google Scholar]
  71. Yang, K. What Can COVID-19 Tell Us About Evidence-Based Management? Am. Rev. Public Admin. 2020, 50, 706–712. [Google Scholar] [CrossRef]
  72. Mazzucato, M. The Value of Everything: Making and Taking in the Global Economy; Hachette: New York, NY, USA, 2018. [Google Scholar]
  73. Annerstedt, M.; Nielsen, B.; Maaruthaveeran, S.; Konijnendijk, C. Benefits of urban parks: A systematic review. IFPRA World 2012, 6, 10–12. [Google Scholar]
  74. Kruize, H.; van der Vliet, N.; Staatsen, B.; Bell, R.; Chiabai, A.; Muiños, G.; Higgins, S.; Quiroga, S.; Martinez-Juarez, P.; Aberg Yngwe, M.; et al. Urban Green Space: Creating a Triple Win for Environmental Sustainability, Health, and Health Equity through Behavior Change. Int. J. Environ. Res. Public Health 2019, 16, 4403. [Google Scholar] [CrossRef] [Green Version]
  75. Kondo, M.C.; Fluehr, J.M.; McKeon, T.; Branas, C.C. Urban Green Space and Its Impact on Human Health. Int. J. Environ. Res. Public Health 2018, 15, 445. [Google Scholar] [CrossRef] [Green Version]
  76. Twohig-Bennett, C.; Jones, A. The health benefits of the great outdoors: A systematic review and meta-analysis of greenspace exposure and health outcomes. Environ. Res. 2018, 166, 628–637. [Google Scholar] [CrossRef]
  77. van den Berg, M.; Wendel-Vos, W.; van Poppel, M.; Kemper, H.; van Mechelen, W.; Maas, J. Health benefits of green spaces in the living environment: A systematic review of epidemiological studies. Urban For. Urban Green 2015, 14, 806–816. [Google Scholar] [CrossRef]
  78. Rupprecht, C.D.D.; Byrne, J.A. Informal urban greenspace: A typology and trilingual systematic review of its role for urban residents and trends in the literature. Urban For. Urban Green 2014, 13, 597–611. [Google Scholar] [CrossRef] [Green Version]
  79. Kowarik, I. Urban wilderness: Supply, demand, and access. Urban For. Urban Green. 2018, 29, 336–347. [Google Scholar] [CrossRef]
  80. Sikorska, D.; Łaszkiewicz, E.; Krauze, K.; Sikorski, P. The role of informal green spaces in reducing inequalities in urban green space availability to children and seniors. Environ. Sci. Policy 2020, 108, 144–154. [Google Scholar] [CrossRef]
  81. Przybysz, A.; Wińska-Krysiak, M.; Małecka-Przybysz, M.; Stankiewicz-Kosyl, M.; Skwara, M.; Kłos, A.; Kowalczyk, S.; Jarocka, K.; Sikorski, P. Urban wastelands: On the frontline between air pollution sources and residential areas. Sci. Total Environ. 2020, 721, 137695. [Google Scholar] [CrossRef]
  82. Gawryszewska, B.J.; Wilczyńska, A.; Łepkowski, M.; Nejman, R.; Cziszewska, M. The recreational potential for wastelands as well as users’ preferences for wasteland aesthetics. Case study of Warsaw, Poland. E3S Web Conf. 2018, 45, 00018. [Google Scholar] [CrossRef] [Green Version]
  83. Nejman, R.; Łepkowski, M.; Wilczyńska, A.; Gawryszewska, B.J. The right to wild. Green urban wasteland in the context of urban planning. Urban Dev. Issues 2018, 59, 43–53. [Google Scholar] [CrossRef]
  84. Anna, D.; Ewa, K.-B. How to Enhance the Environmental Values of Contemporary Cemeteries in an Urban Context. Sustain. Sci. Pract. Policy 2020, 12, 2374. [Google Scholar] [CrossRef] [Green Version]
  85. Casey, R. Germany: Will Authorities Crack Down on “Corona Parties”? Available online: https://www.aljazeera.com/news/2020/3/19/germany-will-authorities-crack-down-on-corona-parties (accessed on 8 January 2021).
  86. Herman, K.; Sbarcea, M.; Panagopoulos, T. Creating Green Space Sustainability through Low-Budget and Upcycling Strategies. Sustain. Sci. Pract. Policy 2018, 10, 1857. [Google Scholar] [CrossRef] [Green Version]
  87. Kimic, K.; Maksymiuk, G. “Green Projects” in Participatory Budgets—Inclusive initiatives for creating city’s top quality public spaces. Warsaw case study. In Inclusive/Exclusive Cities; Ministry of Health: Skopje, Slovenia North Macedonia, 2016; ISBN 9783952397299. [Google Scholar]
  88. The Importance of Allotments and Gardens in the Pandemic. Available online: https://www.qcs.co.uk/coronavirus/the-importance-of-allotments-and-gardens-in-the-pandemic/ (accessed on 8 January 2021).
  89. Khan, M.M.; Akram, M.T.; Janke, R.; Qadri, R.W.K.; Al-Sadi, A.M.; Farooque, A.A. Urban Horticulture for Food Secure Cities through and beyond COVID-19. Sustain. Sci. Pract. Policy 2020, 12, 9592. [Google Scholar] [CrossRef]
  90. Polacy rzucili się na ogródki działkowe przez koronawirusa. Ceny wystrzeliły. Available online: https://spidersweb.pl/bizblog/ogrodki-dzialkowe-cena-koronawirus/ (accessed on 8 January 2021).
  91. Liu, L.; Zhong, Y.; Ao, S.; Wu, H. Exploring the Relevance of Green Space and Epidemic Diseases Based on Panel Data in China from 2007 to 2016. Int. J. Environ. Res. Public Health 2019, 16, 2551. [Google Scholar] [CrossRef] [Green Version]
  92. Surico, J. The Power of Parks in a Pandemic. Bloom. News 2020. Available online: https://www.bloomberg.com/news/articles/2020-04-09/in-a-pandemic-the-parks-are-keeping-us-alive (accessed on 1 February 2021).
  93. Sturiale, L.; Scuderi, A. The Role of Green Infrastructures in Urban Planning for Climate Change Adaptation. Climate 2019, 7, 119. [Google Scholar] [CrossRef] [Green Version]
  94. Lovell, S.T.; Taylor, J.R. Supplying urban ecosystem services through multifunctional green infrastructure in the United States. Landsc. Ecol. 2013, 28, 1447–1463. [Google Scholar] [CrossRef]
  95. Cole, H.V.S.; Triguero-Mas, M.; Connolly, J.J.T.; Anguelovski, I. Determining the health benefits of green space: Does gentrification matter? Health Place 2019, 57, 1–11. [Google Scholar] [CrossRef] [PubMed]
  96. Wolch, J.R.; Byrne, J.; Newell, J.P. Urban green space, public health, and environmental justice: The challenge of making cities “just green enough”. Landsc. Urban Plan. 2014, 125, 234–244. [Google Scholar] [CrossRef] [Green Version]
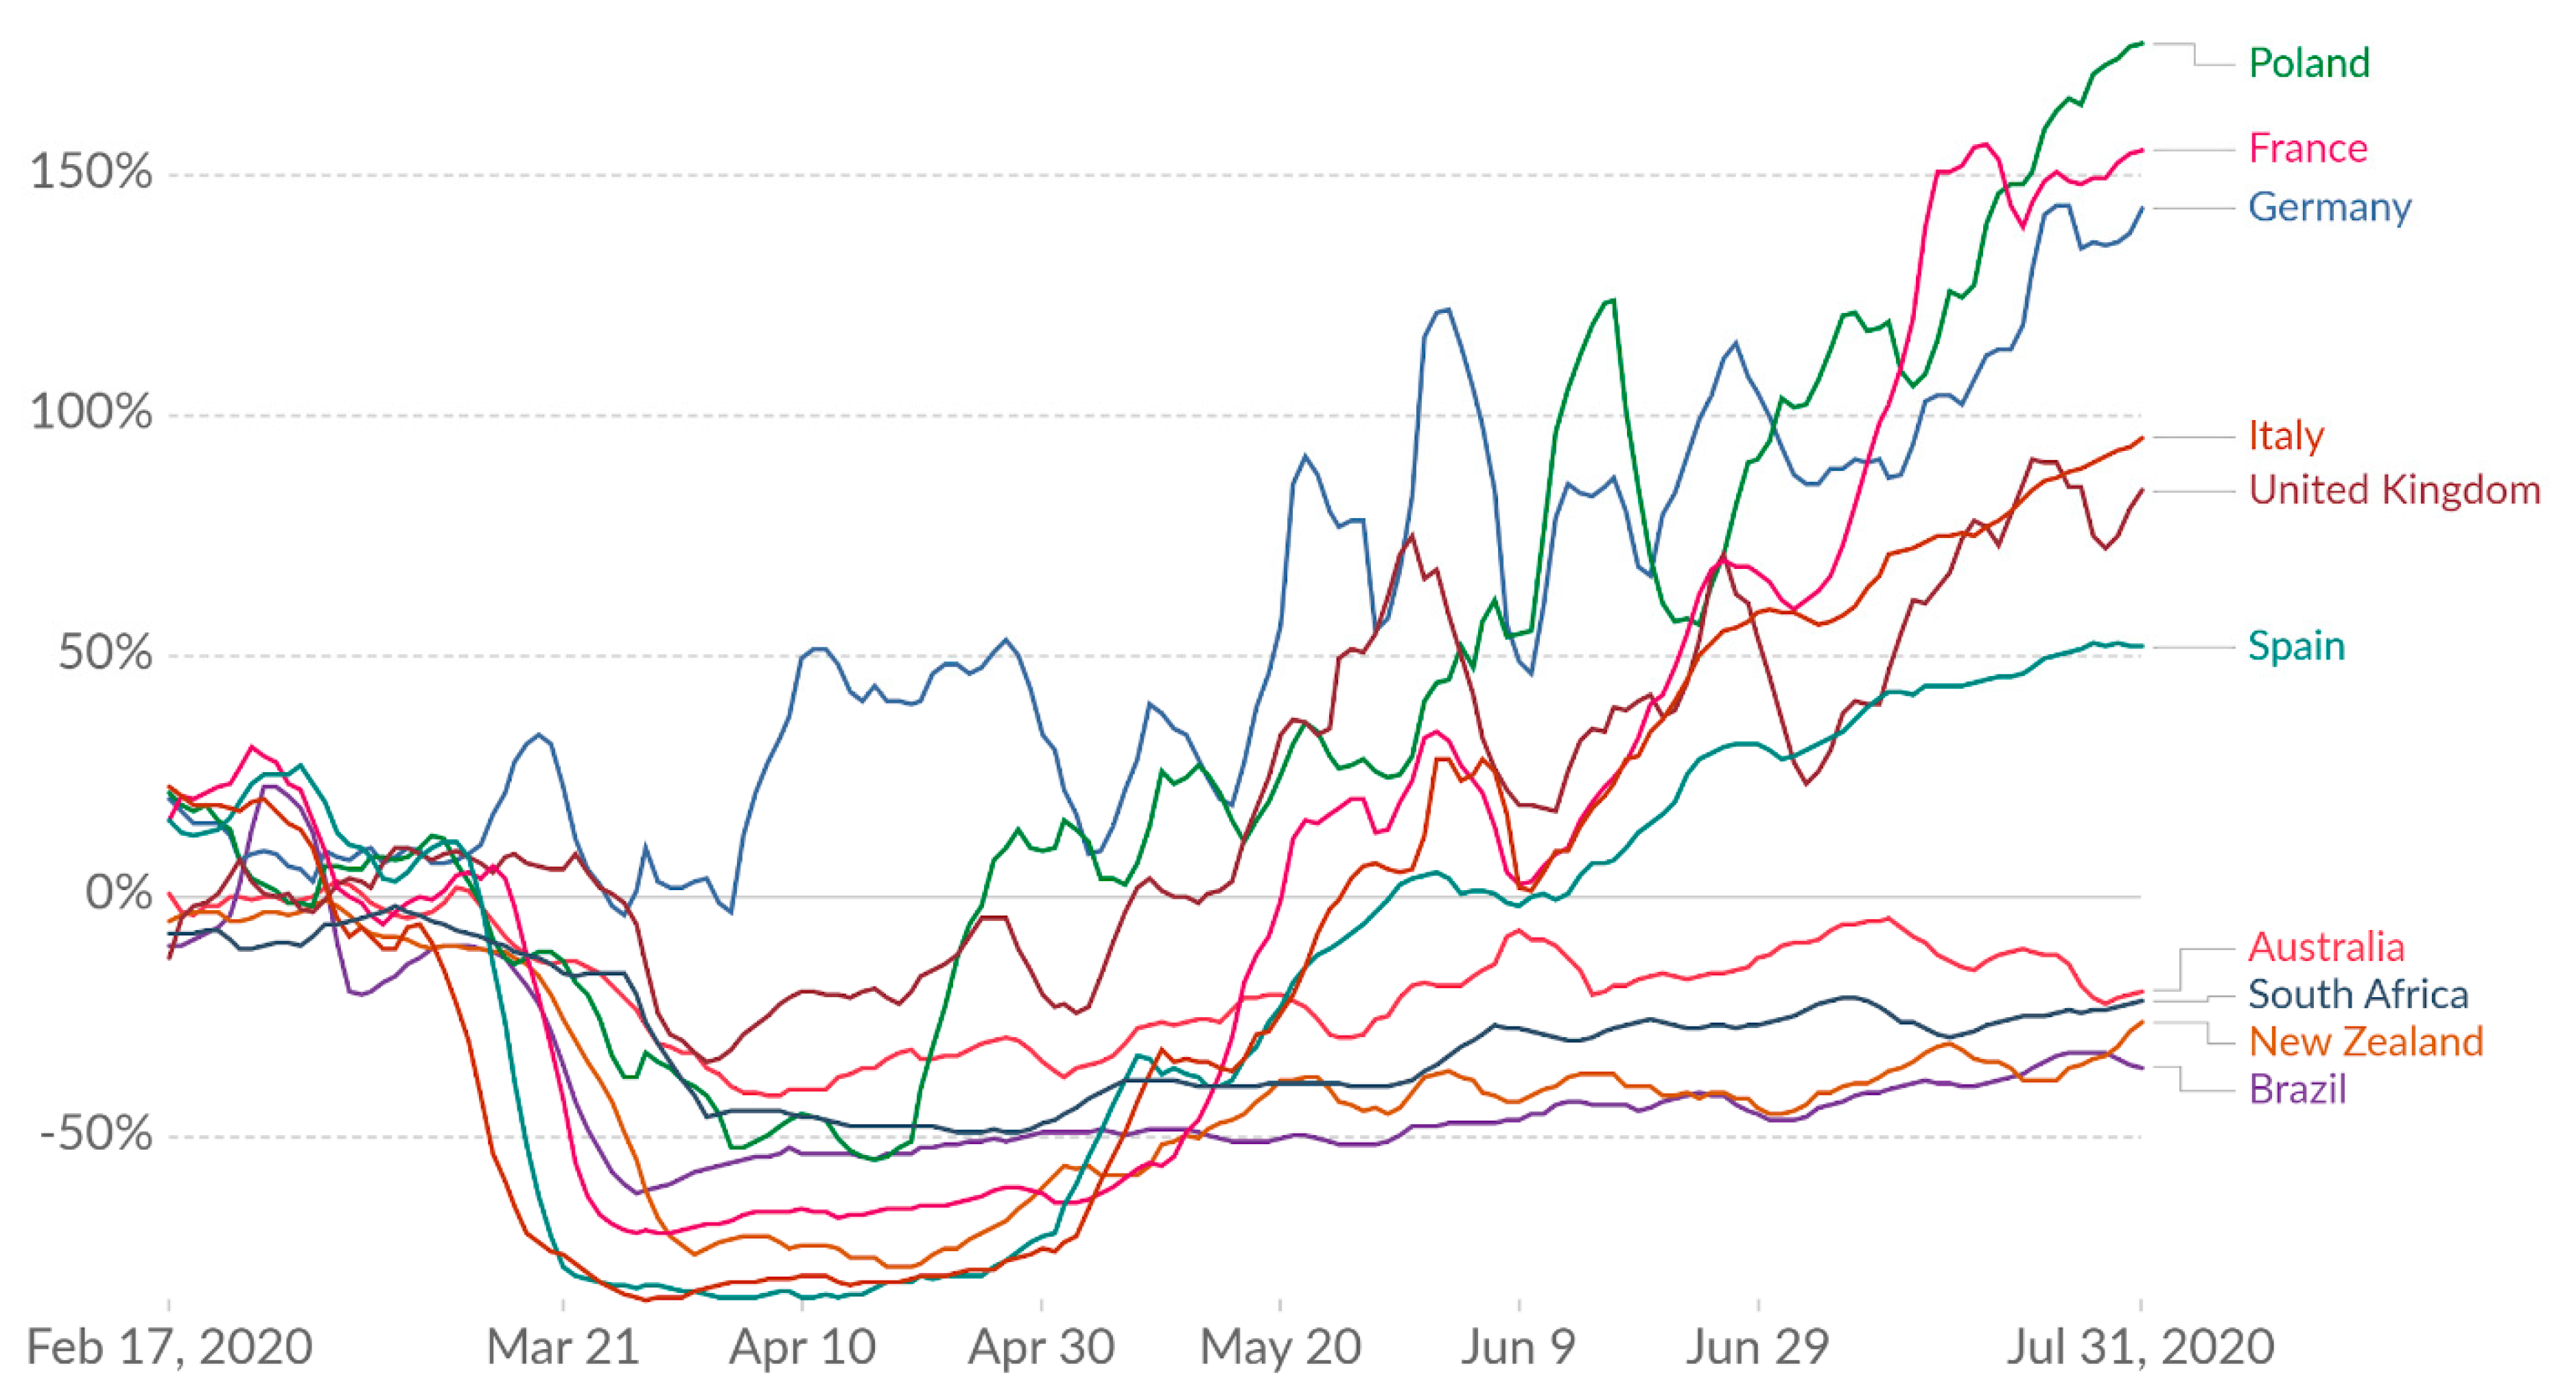
  97. Parks and Outdoor Spaces: How Did the Number of Visitors Change Since the Beginning of the Pandemic? Available online: https://ourworldindata.org/grapher/change-visitors-parks-covid?tab=chart&stackMode=absolute&time=earliest..2020-07-31&country=AUS~BRA~FRA~DEU~ITA~NZL~POL~ESP~GBR~ZAF&region=World (accessed on 28 January 2021).
Figure 1. “Social distancing lawn” by the Galeria EL Art Centre in Elbląg, Poland. Photograph reproduced with permission from author, Łukasz Kotyński.
Sustainability 13 01632 g001
Figure 2. Timeline for key events for New Zealand (red) and Poland (blue) COVID-19 Pandemic (February–October 2020), including closures of recreational areas and parks.
Sustainability 13 01632 g002
Figure 3. Lockdown and post-lockdown use of Miramar Park and public space in Miramar Wellington (fot. Krzysztof Herman). 1. Message informing about the closure of facilities on the ground of Miramar Central School (including a popular playground and bike track); 2. Dog owners meeting during lockdown (people respecting 2 m “social distancing rule”, dogs not); 3. Messages and games on the pavement in Miramar; 4. “Tactical” use of the park. Cones as goals for a father-son football game; 5. Traces of usage—worn out lawn where regular running occurs (more visible during lockdown; 6. “Tactical” use of a cricket pitch (patches of artificial grass as a picnic area and scooter/bike “track” for little kids.
Sustainability 13 01632 g003
Figure 4. Comparison of the number of people and number of social “bubbles” using Miramar Park during lockdown (levels 3 and 4 restrictions) and post-lockdown (level 1, no restrictions). “Weekend” marks headcounts performed during the weekend, “am”—morning (11 am) and “pm”—afternoon (5 pm). All headcounts were carried on during “good-weather” days (temperature between 15 and 25 °C, no rain and none to moderate strength wind).
Sustainability 13 01632 g004
Figure 5. Miramar Park. Left: A sports grounds layout for the winter season: 1 April–30 September (football training and match fields for various age groups). Source: Wellington City Council [66]. Right: schematic and simplified diagram of pandemic use of the park lawn. Yellow—walking and running path (“track”), blue—social distancing picnic “bubbles’’, orange—asphalt road (bike/scooter track), light green—artificial turf cricket pitches (universal play surface), dark green—large Pohutukawa trees (as an alternative for playground equipment). Photo source: Google Earth.
Sustainability 13 01632 g005
Figure 6. The pre-pandemic (left) and the pandemic (right) functional zones of the Polińskiego Park (2020). Source: [49] 1—public square, 2—sports field, 3—outdoor gym, 4—children’s’ playground, 5—paddock for dogs. Orange fields—open zones, grey fields—closed zones, solid line—official borders of the park, dashed line—borders of the ‘functional’ area of the park (outside of this line are infrequently used spaces, often occupied by the “undesirables”).
Sustainability 13 01632 g006
Figure 7. One of the Instagram photos posted during COVID-19 lockdown in Miramar Park. The description reads: “Lockdown together [heart emoji]. FamiliesAreForever [folded hands emoji].” Source: Instagram website.
Sustainability 13 01632 g007
Figure 8. Number of photographs (Instagram posts) of Polińskiego Park (blue) and Miramar Park (red) that present the context of COVID-19 pandemic (March–June 2020).
Sustainability 13 01632 g008
Figure 9. Change of number of parks visitors since the beginning of the pandemic (2020). The “Parks” category (as categorised by Google) includes local and national parks, public beaches, marinas, dog parks, plazas, public gardens. Changes relative to a baseline day (the median value from the 5-week period 3 January–6 February 2020). The index is smoothed to the rolling 7-day average. Source: [97].
Sustainability 13 01632 g009
Table 1. Characteristics of research areas. Sources: [41,46,47,49,50].
Miramar ParkPolińskiego Park
size5.18 ha (4.42 ha open “greens”, tennis courts and preschool area + 0.76 bowling club). Functional, open, accessible area = ~3.9 ha5.52 ha (3.9 ha functional area)
year established~1906 *1962
facilitiesBowling club (building and 3 bowling greens); tennis club (building and 6 courts); preschool with a small garden; large central lawn (team sports field)Multifunctional sports field (football, basketball, volleyball, tennis); children’s playground; outdoor gym; paddock for dogs; artificial hill; fountain; paved square; monuments; service pavilions (currently not used).
locationMiramar, eastern suburb of Wellington. Residential area of single-family detached houses. Grochów (Praga-South), eastern inner-city area of Warsaw.
Residential area: mixed, predominantly multi-family housing.
population (park’s “neighbourhood”)3318 (in 2018), area: 104 ha, 31.9 pers/ha population density.~20,000 (in 2018), area: 160 ha, 125 pers/ha population density.
social structure (park’s ‘neighbourhood’)Mixed, but undergoing rapid gentrification and changing towards domination of creative class. Median property sales price grew 39% over the last 5 years. Median income is slightly lower than in the entire city (34,000 NZD a year as compared to 41,800 NZD for Wellington City).Mixed, undergoes modest gentrification (visible in physical changes of the built environment as well as in the increase of average real estate prices—below 7000 PLN in 2010, and even 11,000 PLN in 2019 per 1 square meter). Median income lower than in the entire city (belongs to the two lowest quartiles). Gini coefficient for income below 0.44 (average for Warsaw = 0.48).
* as noted in “Plan of the town of Miramar North, Wellington’’ from 1906 [42].
Table 2. List of interviews.
RespondentDateGenderAgeProfessionType of User
WAR125 May 2020F34Corporate employeeParent
WAR226 May 2020F29Corporate employeeDog owner
WAR327 May 2020F66RetiredSenior
WAR428 May 2020M21Low-skilled worker (currently unemployed)Parent (precarious)
WAR529 May 2020M12 (both)StudentsYouth
WEL17 August 2020F37TeacherParent
WEL27 August 2020F53Corporate employeeDog owner
WEL39 December 2020F70RetiredSenior
WEL49 December 2020M71RetiredSenior
WEL59 December 2020M13StudentYouth
WEL69 December 2020M11StudentYouth
Table 3. Pre-pandemic and pandemic land use in the Miramar Park and the Polińskiego Park (2020).
Polińskiego ParkMiramar Park
Pre-Pandemic + DesignedPandemic + DesignedPre-pandemic + DesignedPandemic + Designed
Benches
Children’s playground
Local festivals
Local political events
Outdoor gym
Paddock for dogs
Running
Sports field
Strolling
Benches
Paddock for dogs
Running
Strolling
Benches
Team sports (football, cricket)
Lawn bowling
Tennis courts
Benches
Pre-Pandemic + Non DesignedPandemic + Non DesignedPre-Pandemic + Non DesignedPandemic + Non Designed
Alcohol drinking
Children’s games
Family/friends picnics
Riding a bike, skateboard or scooter
Dog walking
Kites/drones flying
Alcohol drinking
Children’s games
Family/friends picnics
Outdoor gym
Riding a bike, skateboard or scooter
Dog walking
Kites/drones flying
Dog walking
Family/friends picnics
Running
Strolling
Individual/”bubble” exercise
Riding a bike, skateboard or scooter
Kites/drones flying
Meetings with friends, social interactions
Dog walking
Family/”bubble” picnics
Individual/”bubble” exercise
Running
Strolling
Riding a bike, skateboard or scooter
Climbing trees
Kites/drones flying
Publisher’s Note: MDPI stays neutral with regard to jurisdictional claims in published maps and institutional affiliations.

