Building Energy Model for Mexican Energy Standard Verification Using Physics-Based Open Studio SGSAVE Software Simulation


Abstract
1. Introduction
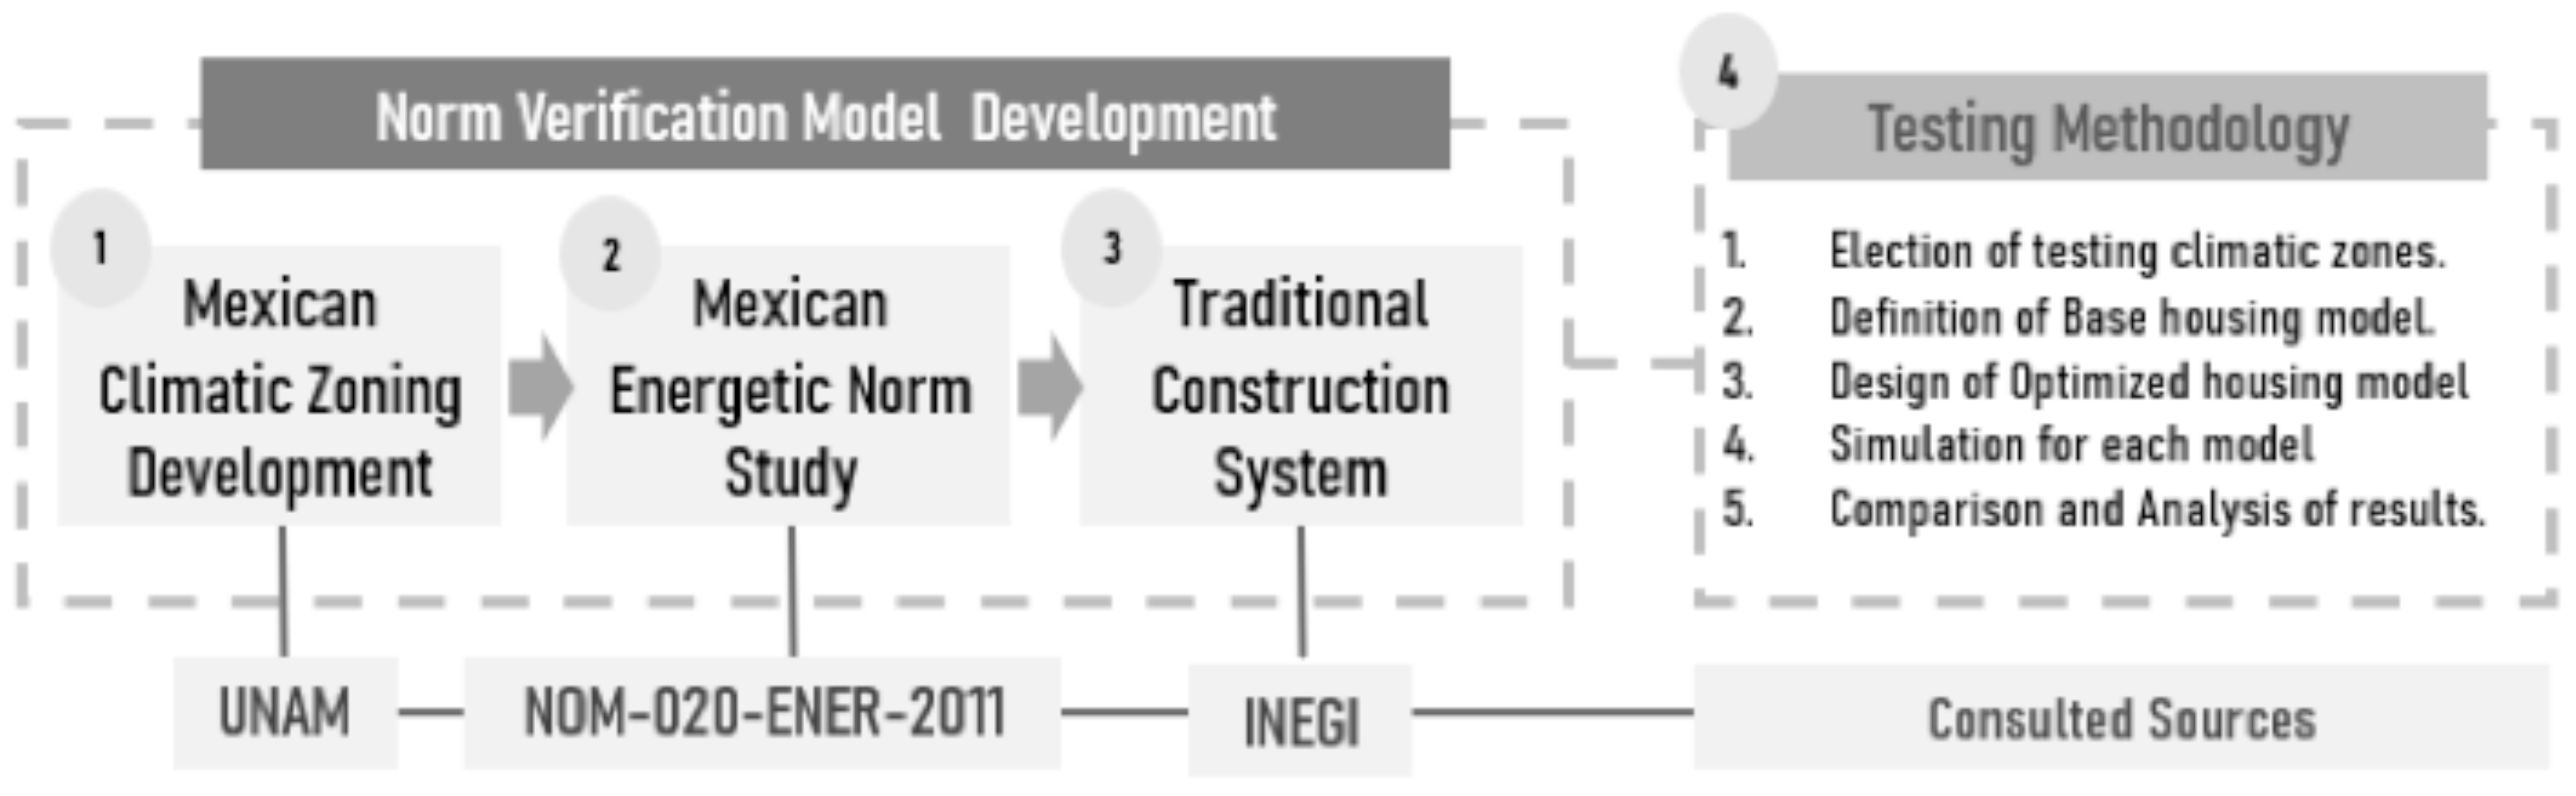
2. Methodology
2.1. Design and Phases
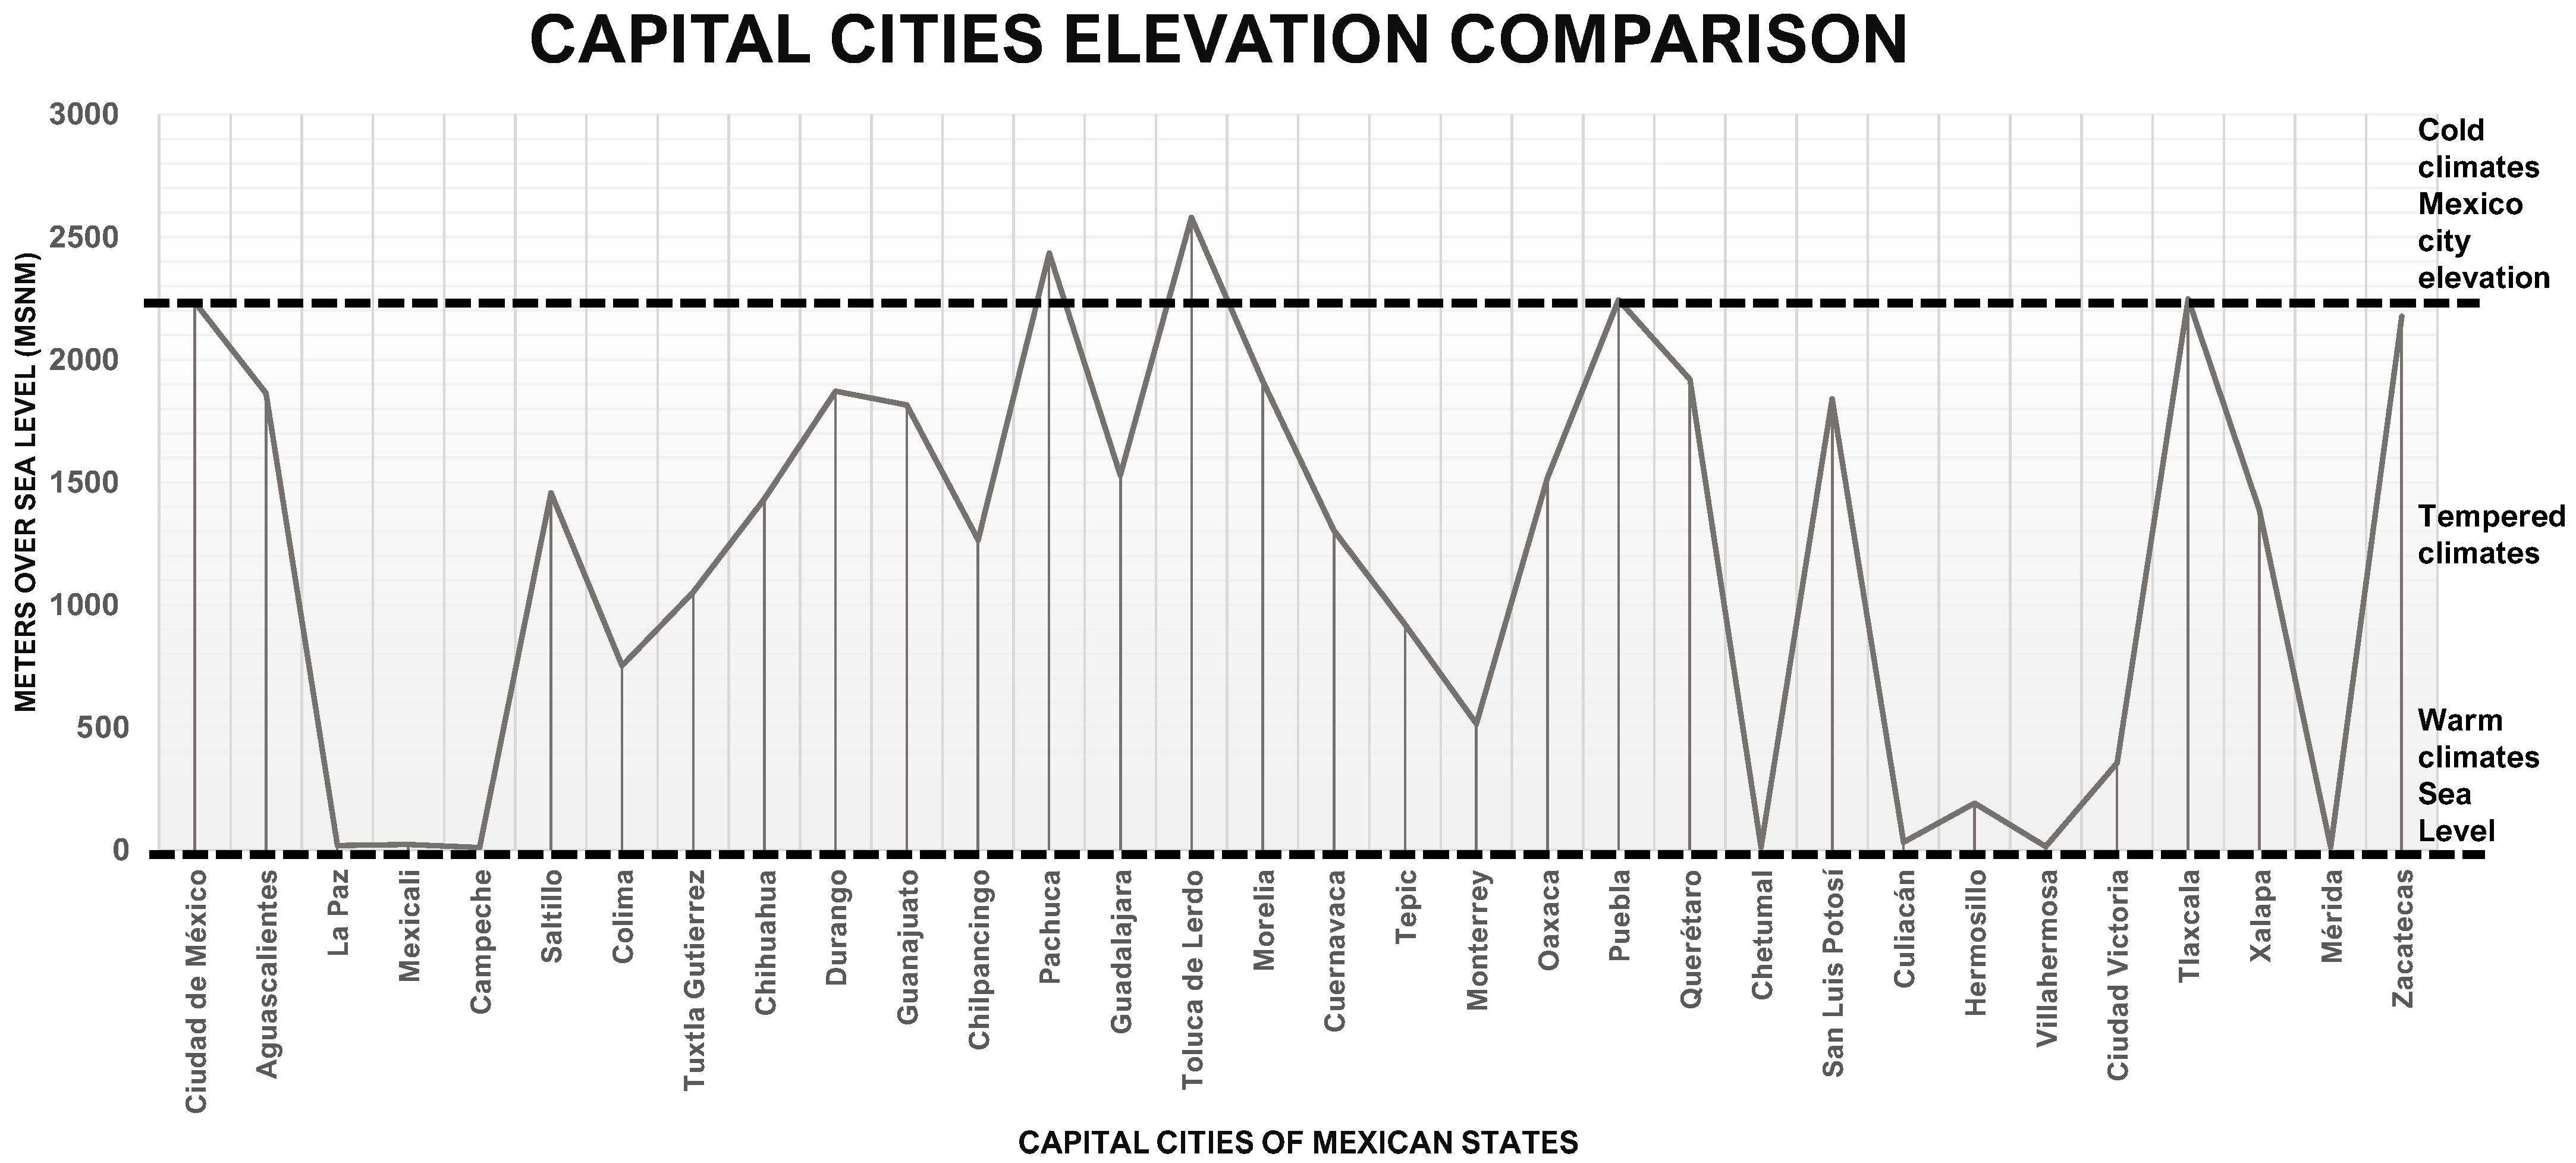
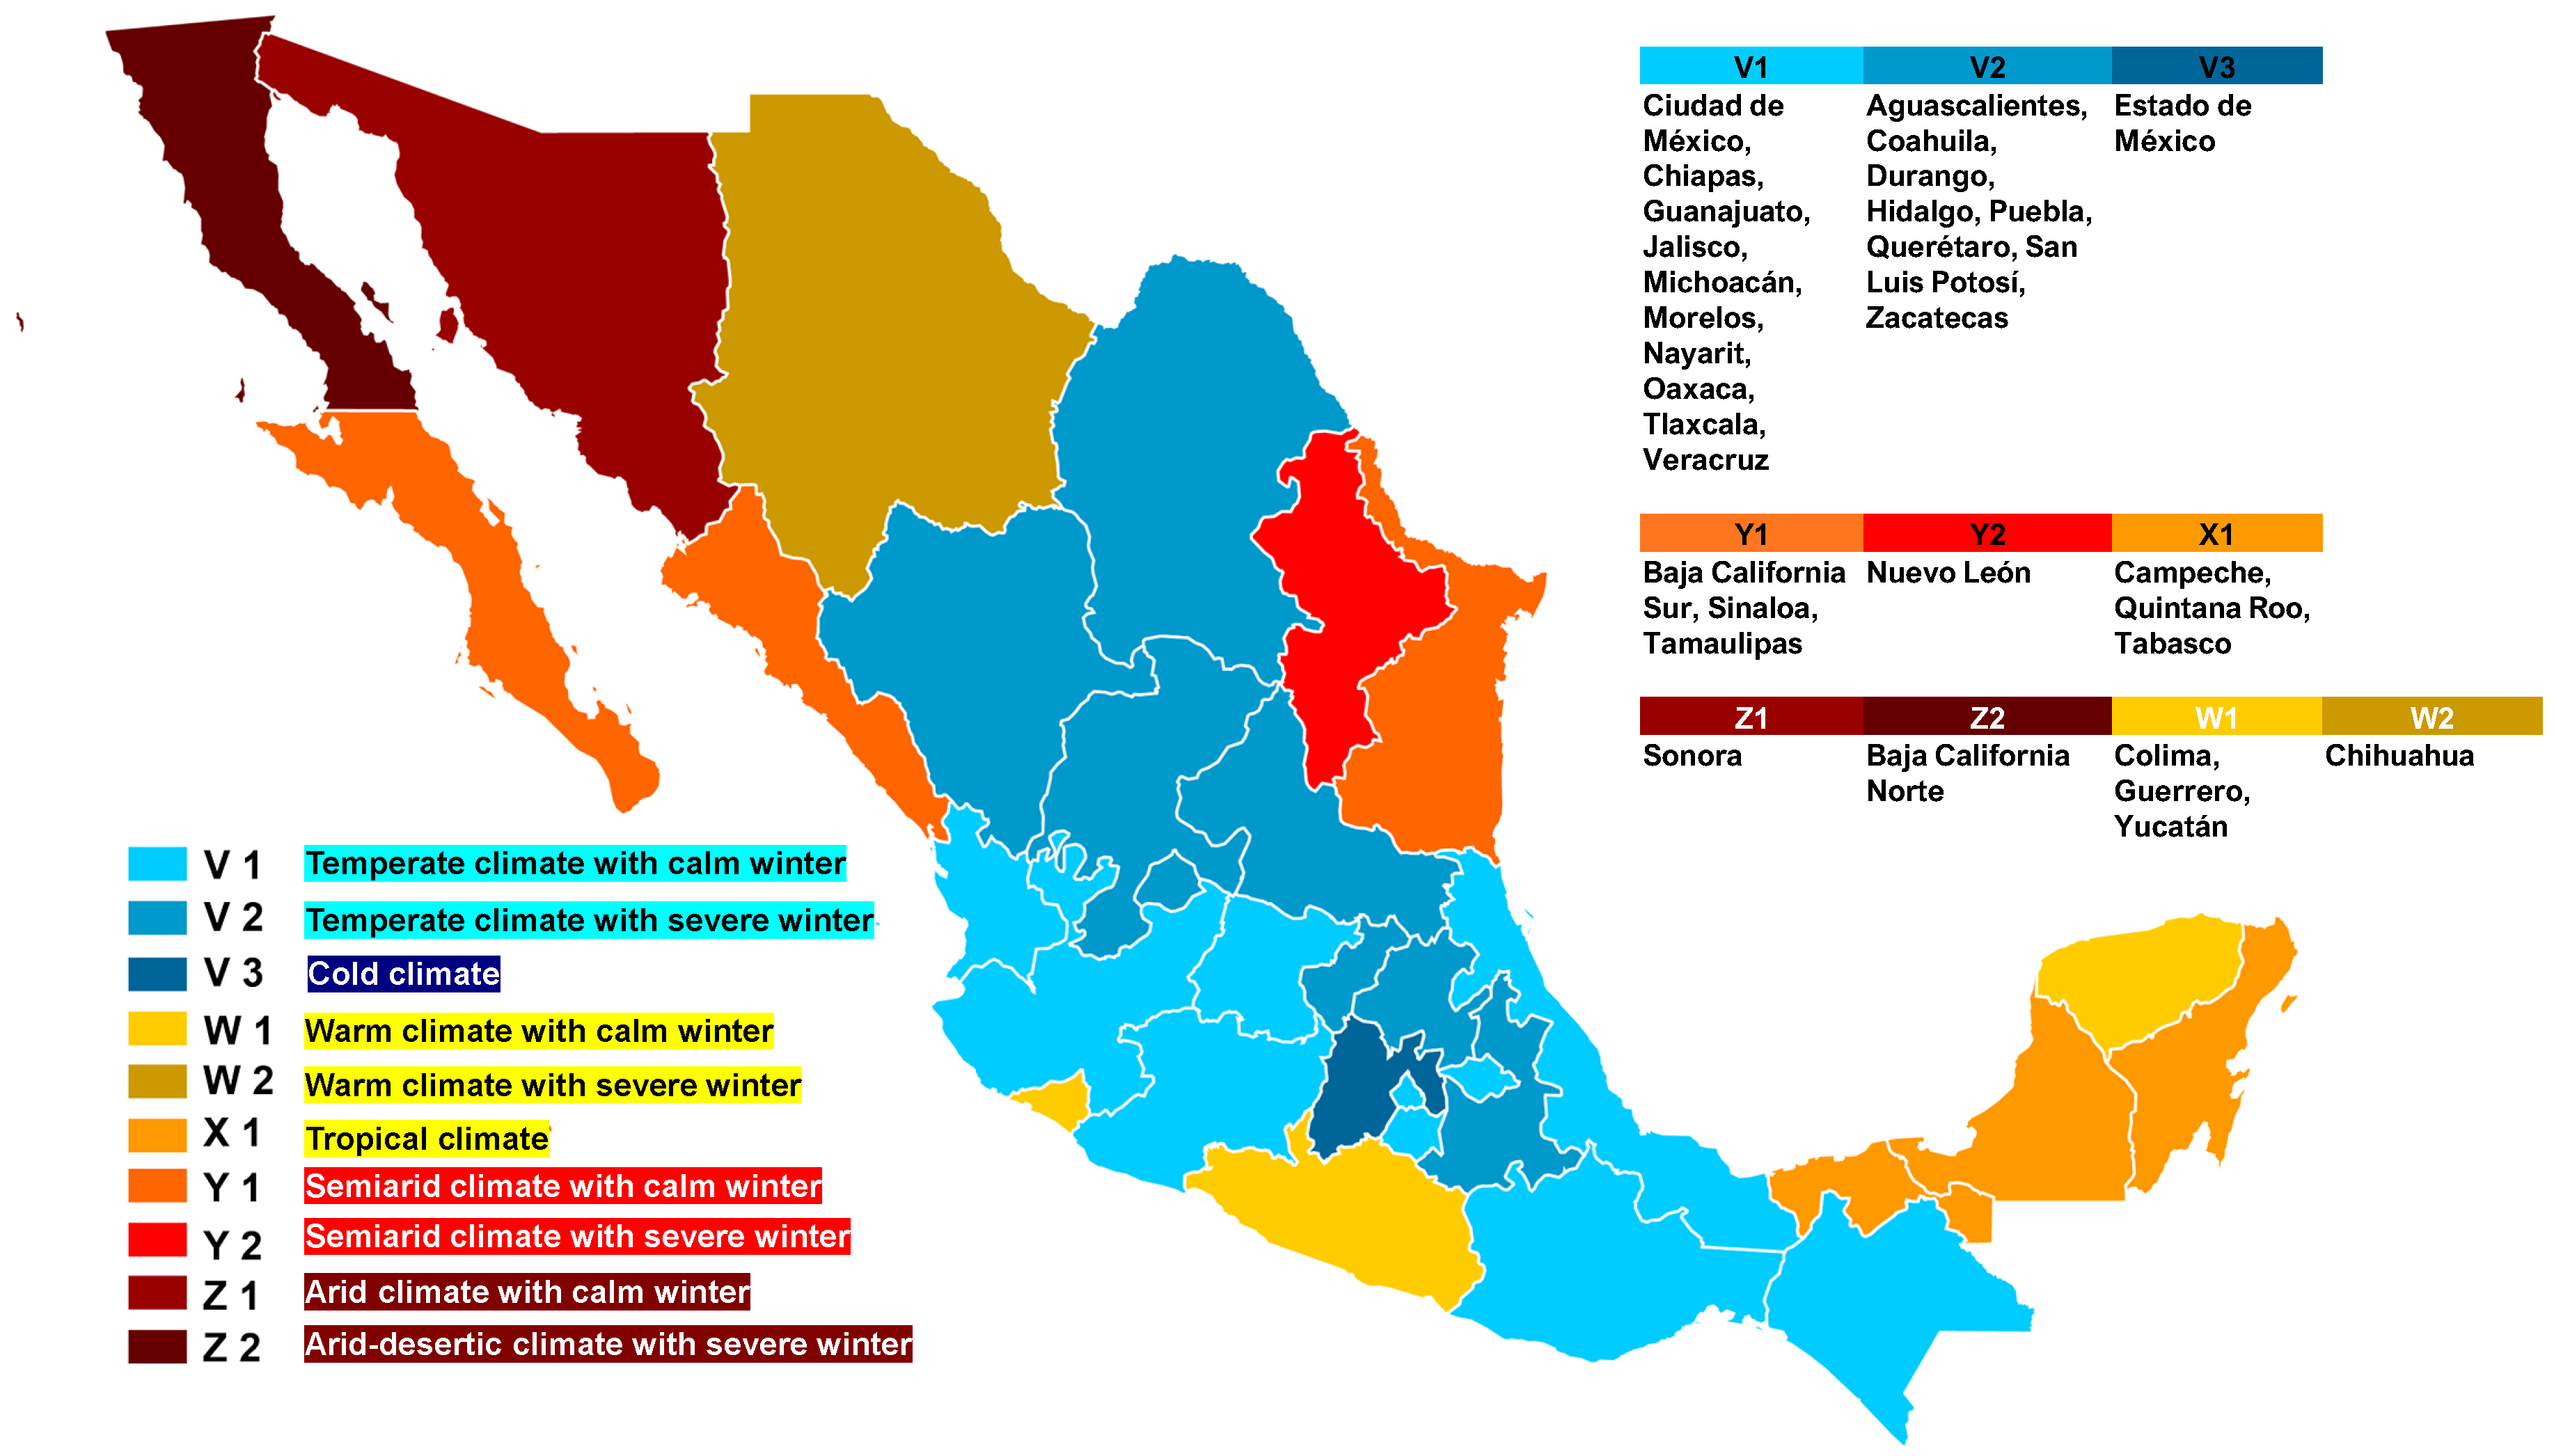
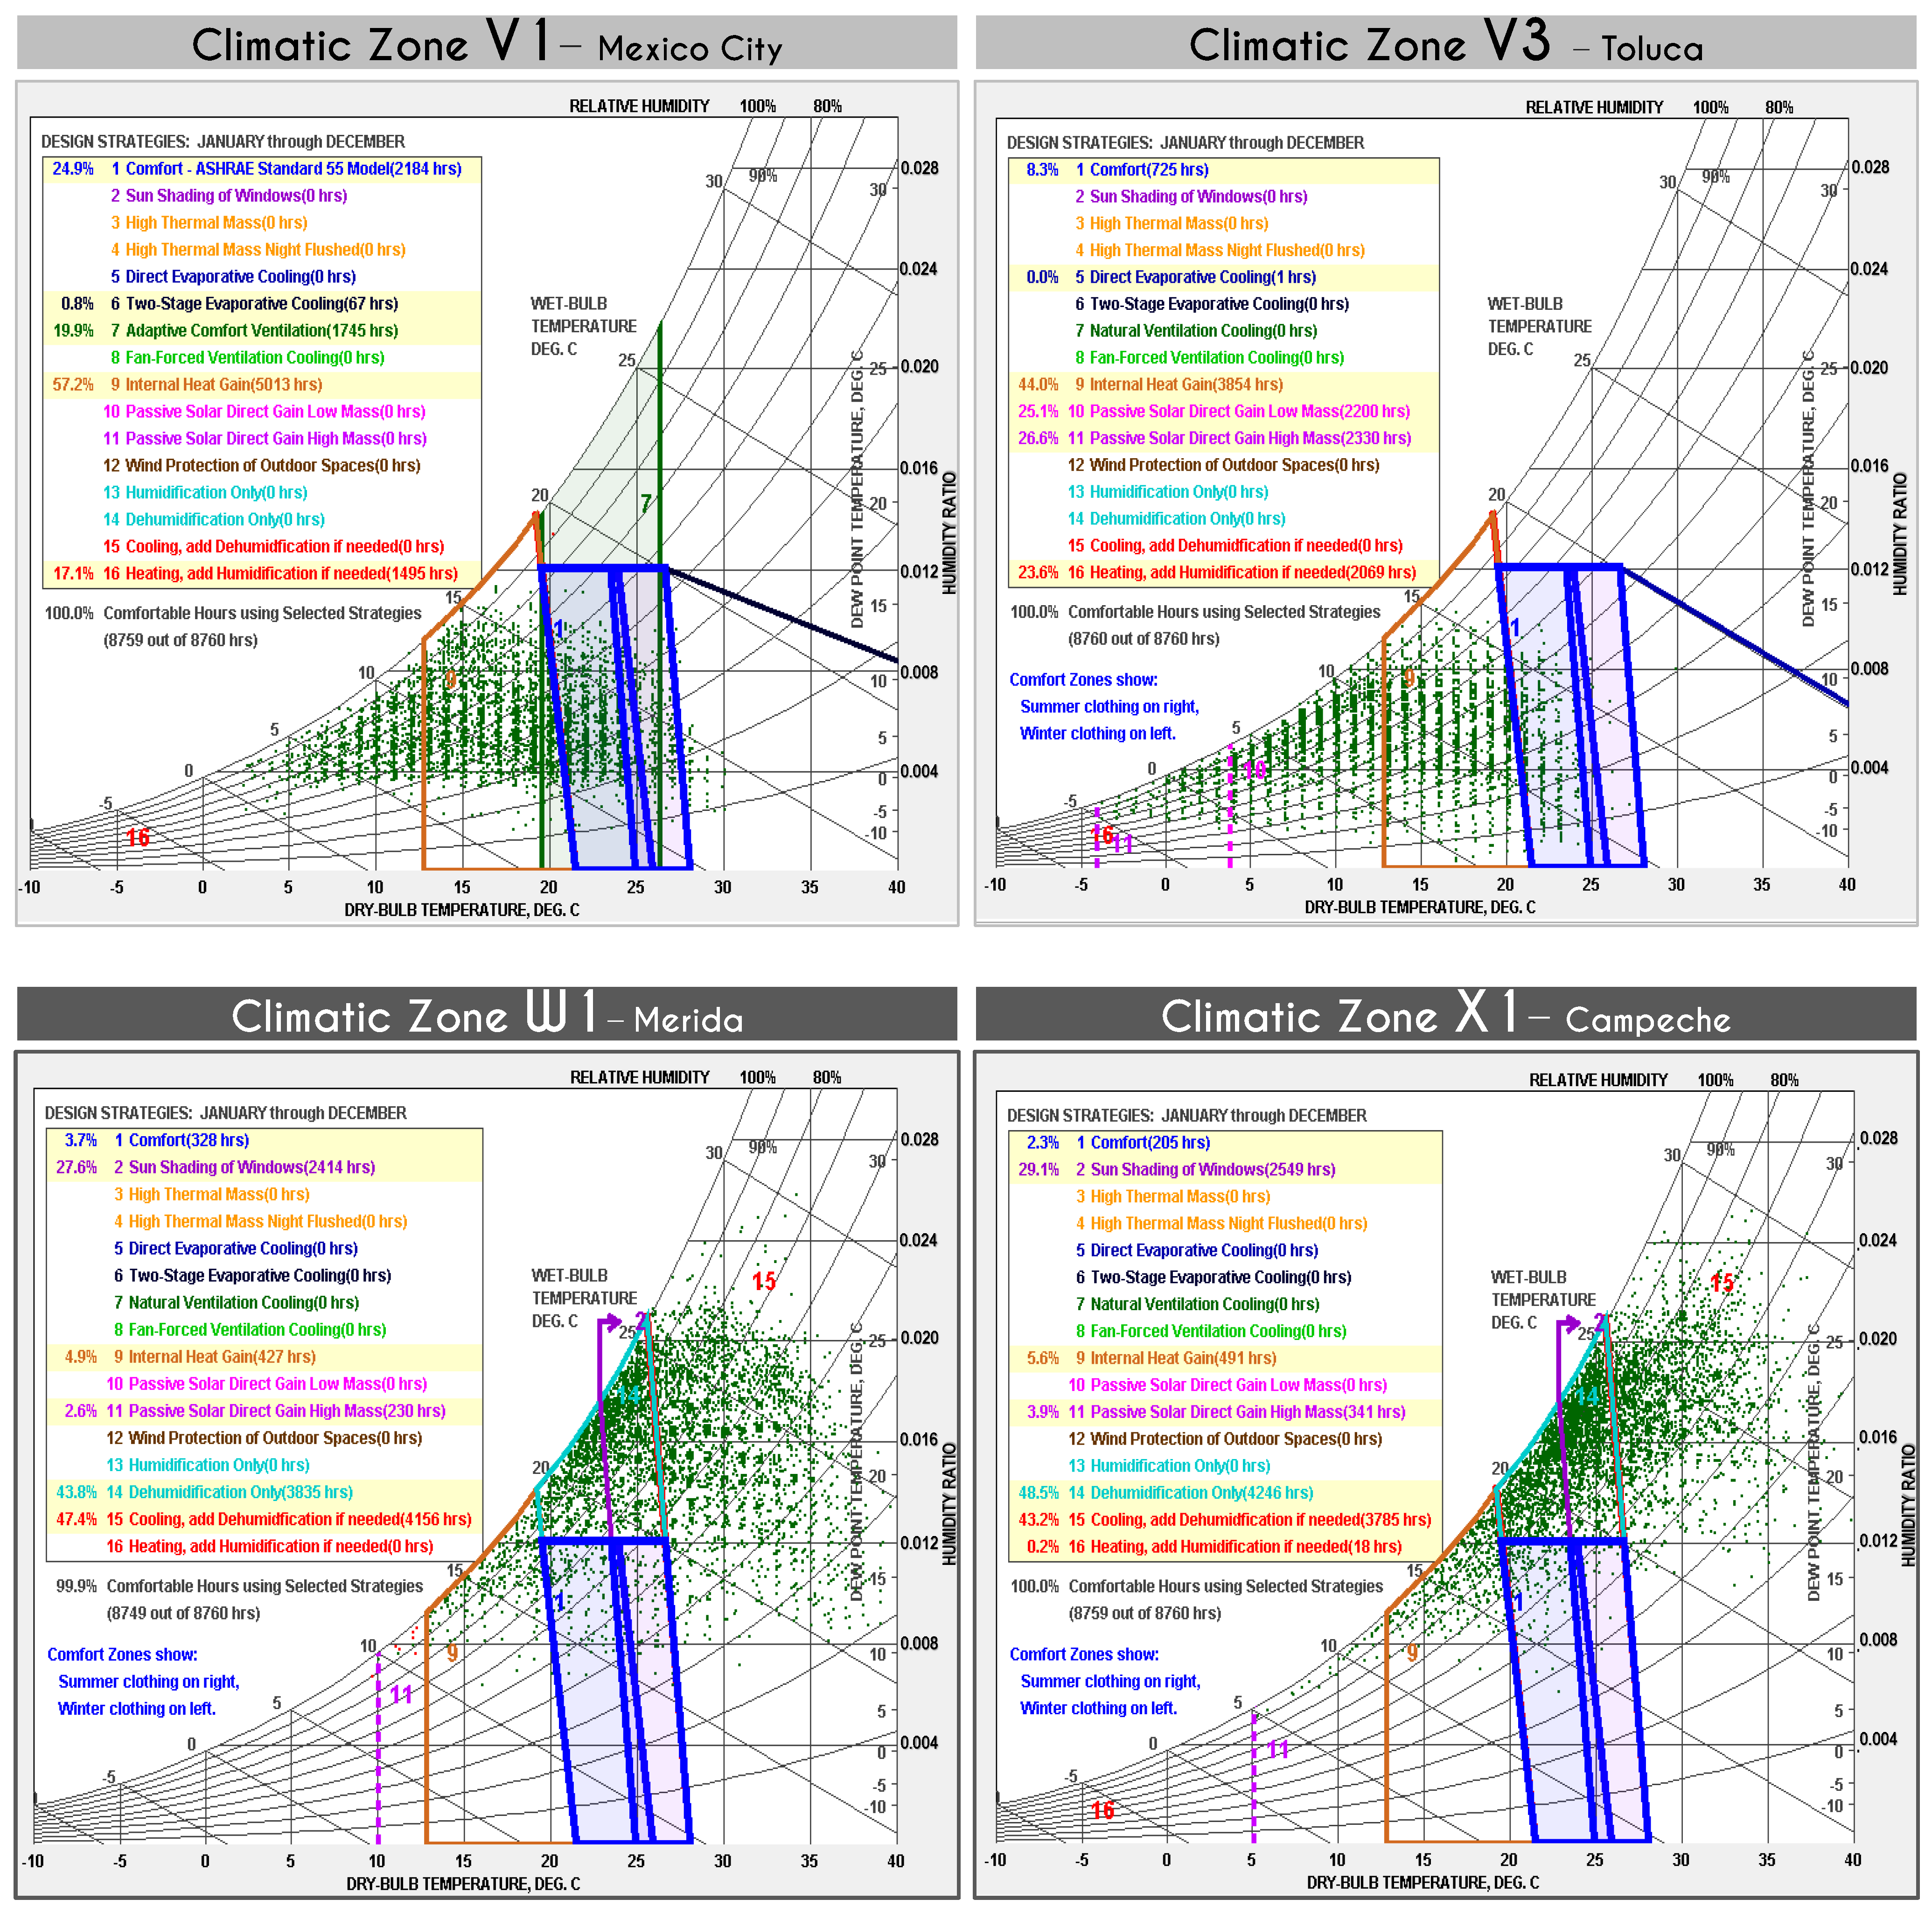
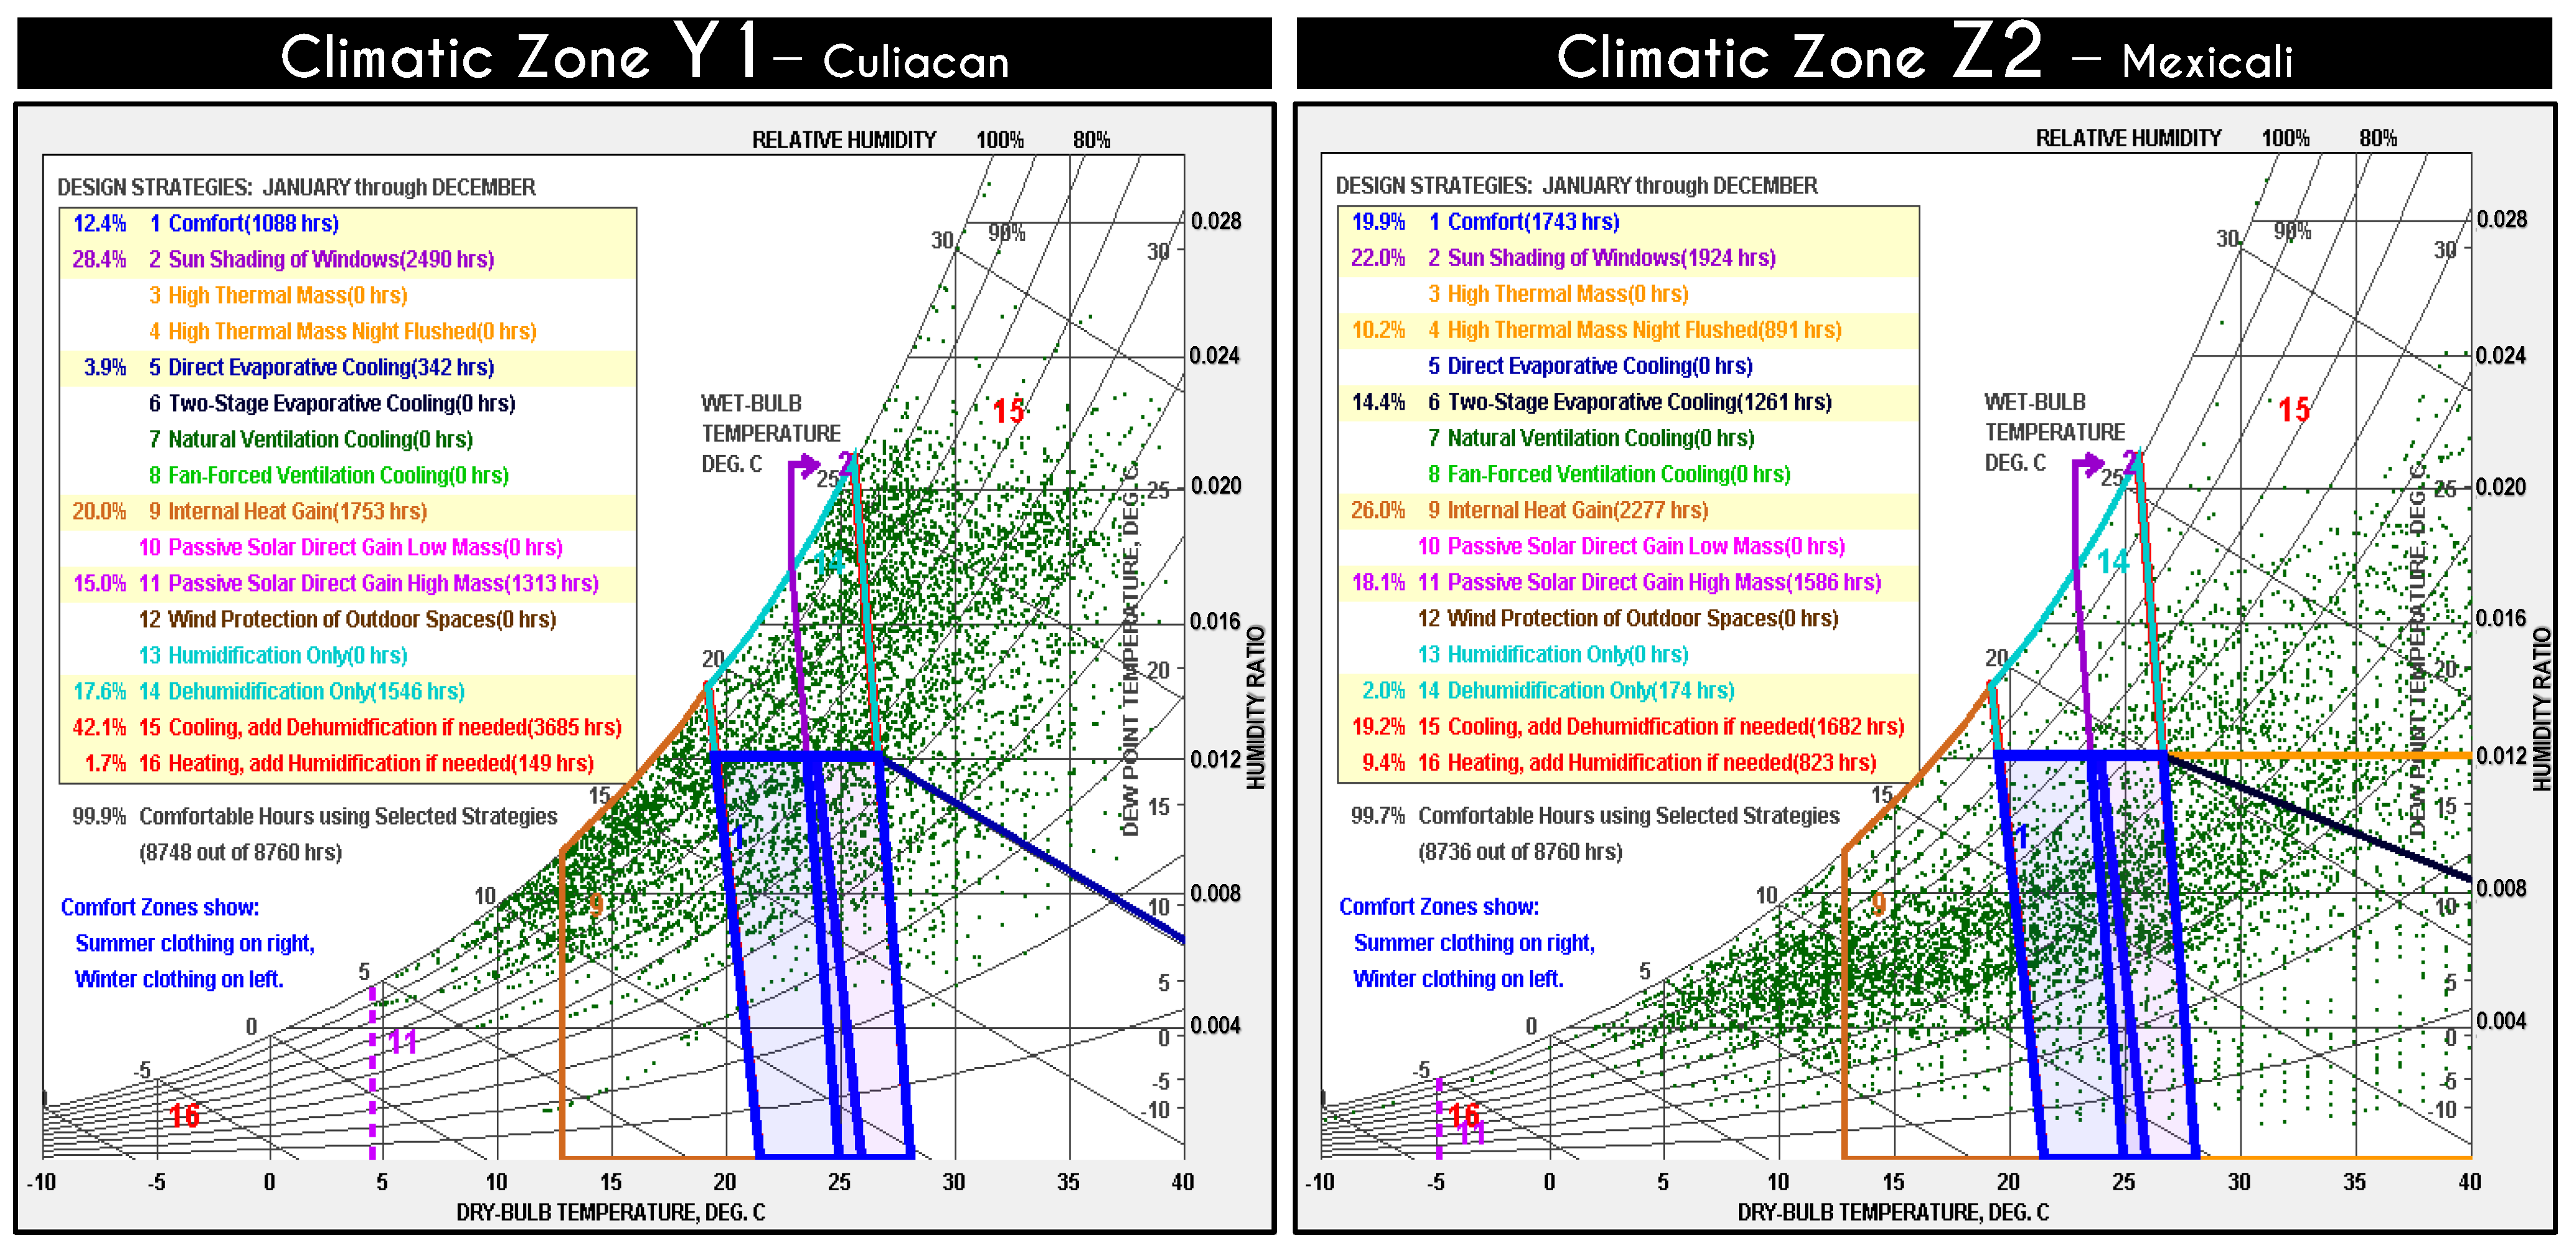
2.2. Climatic Zoning Development
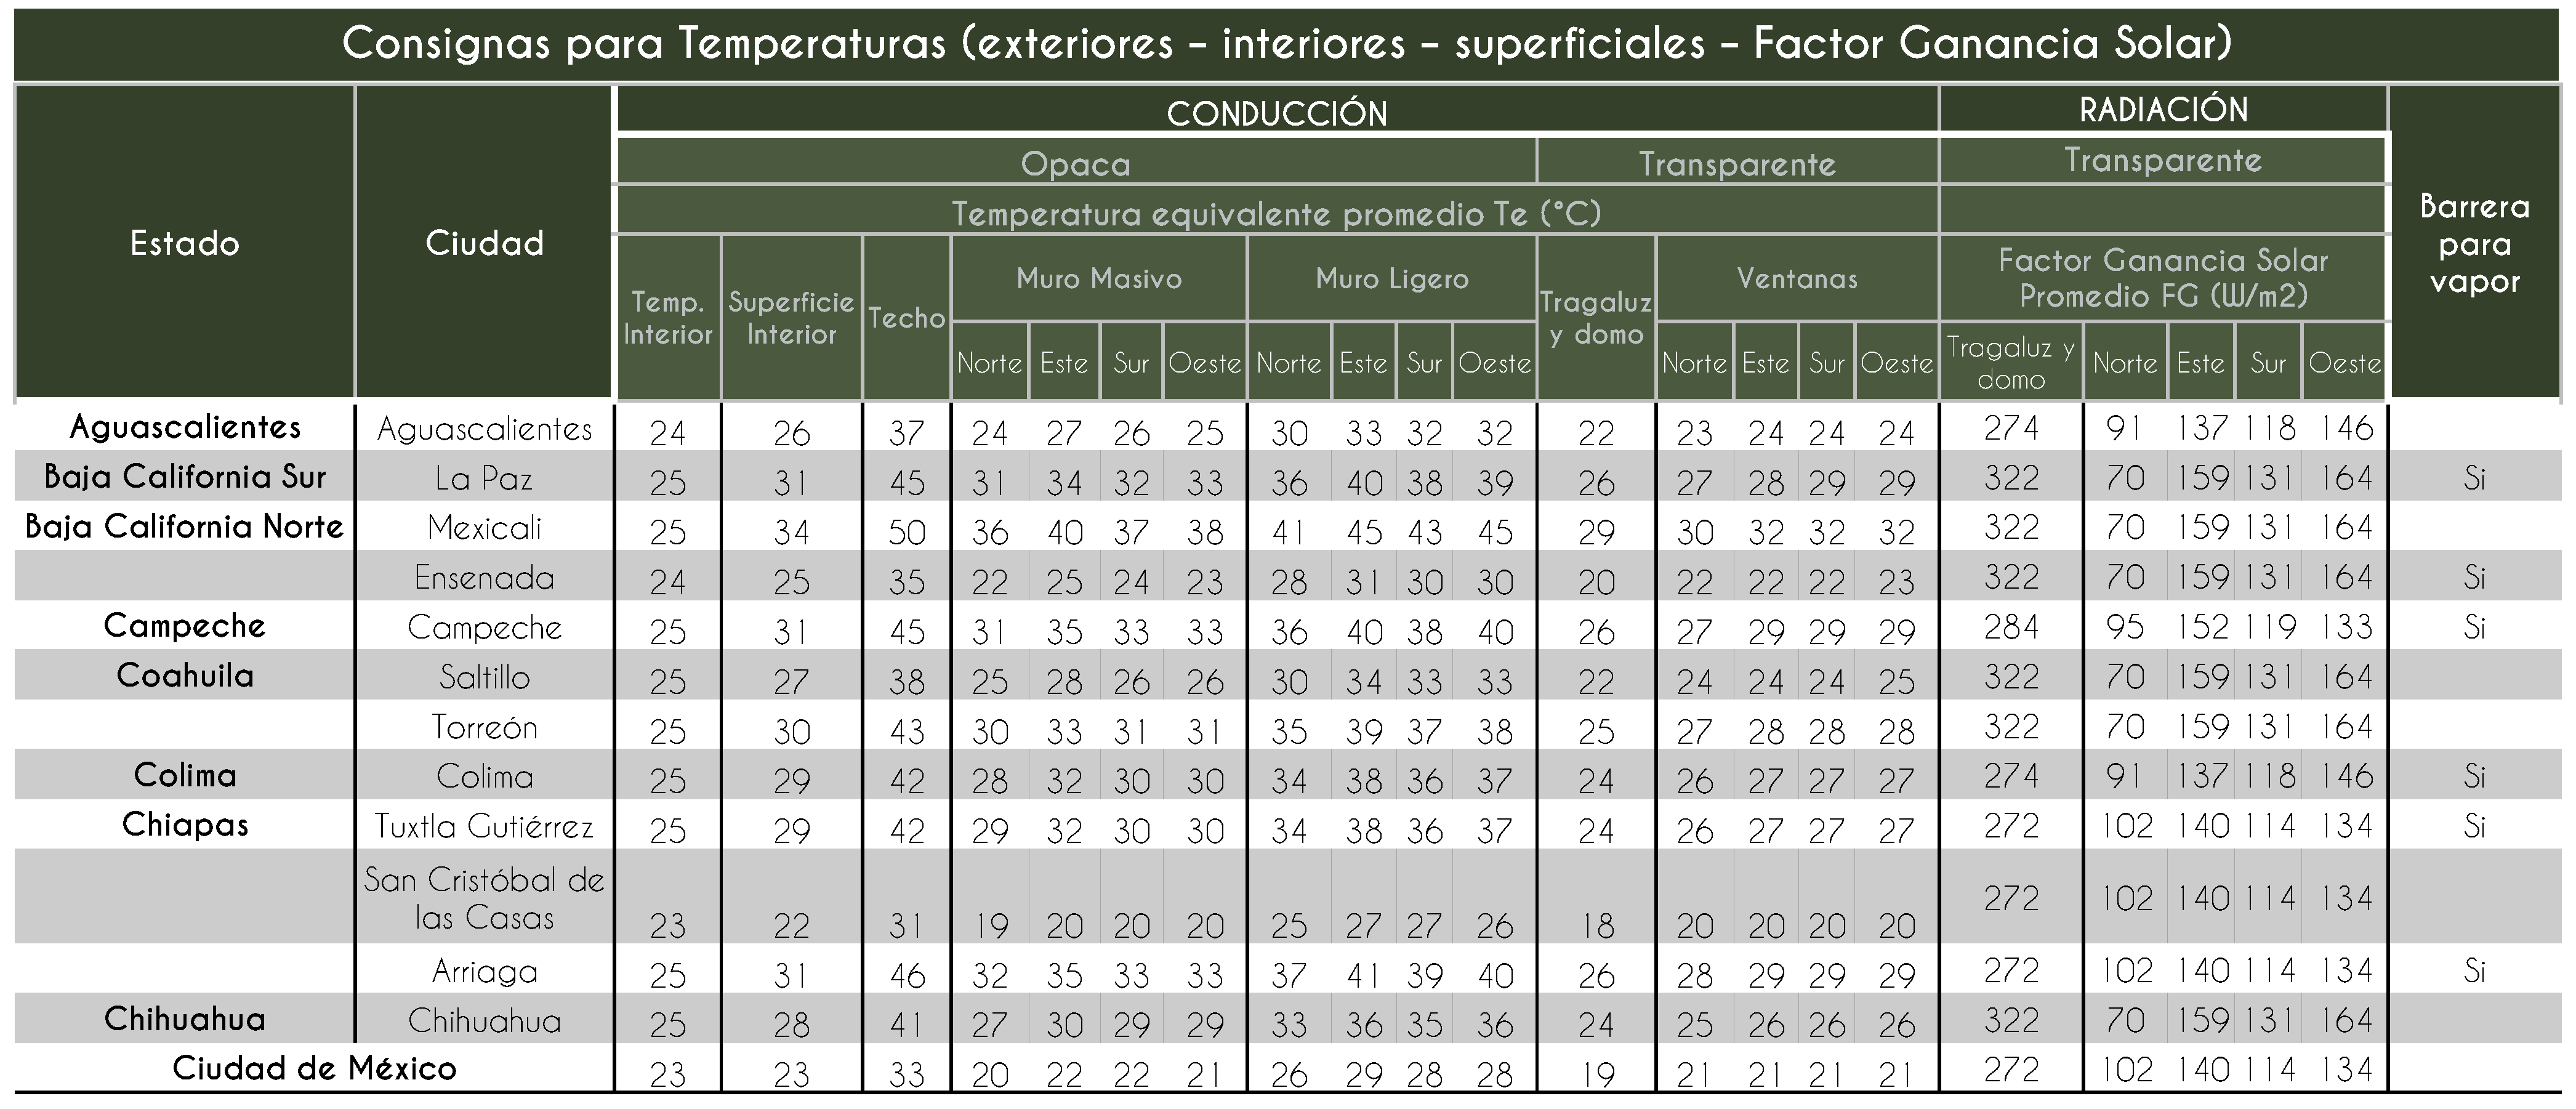
2.3. Study of Mexican Energy Standard
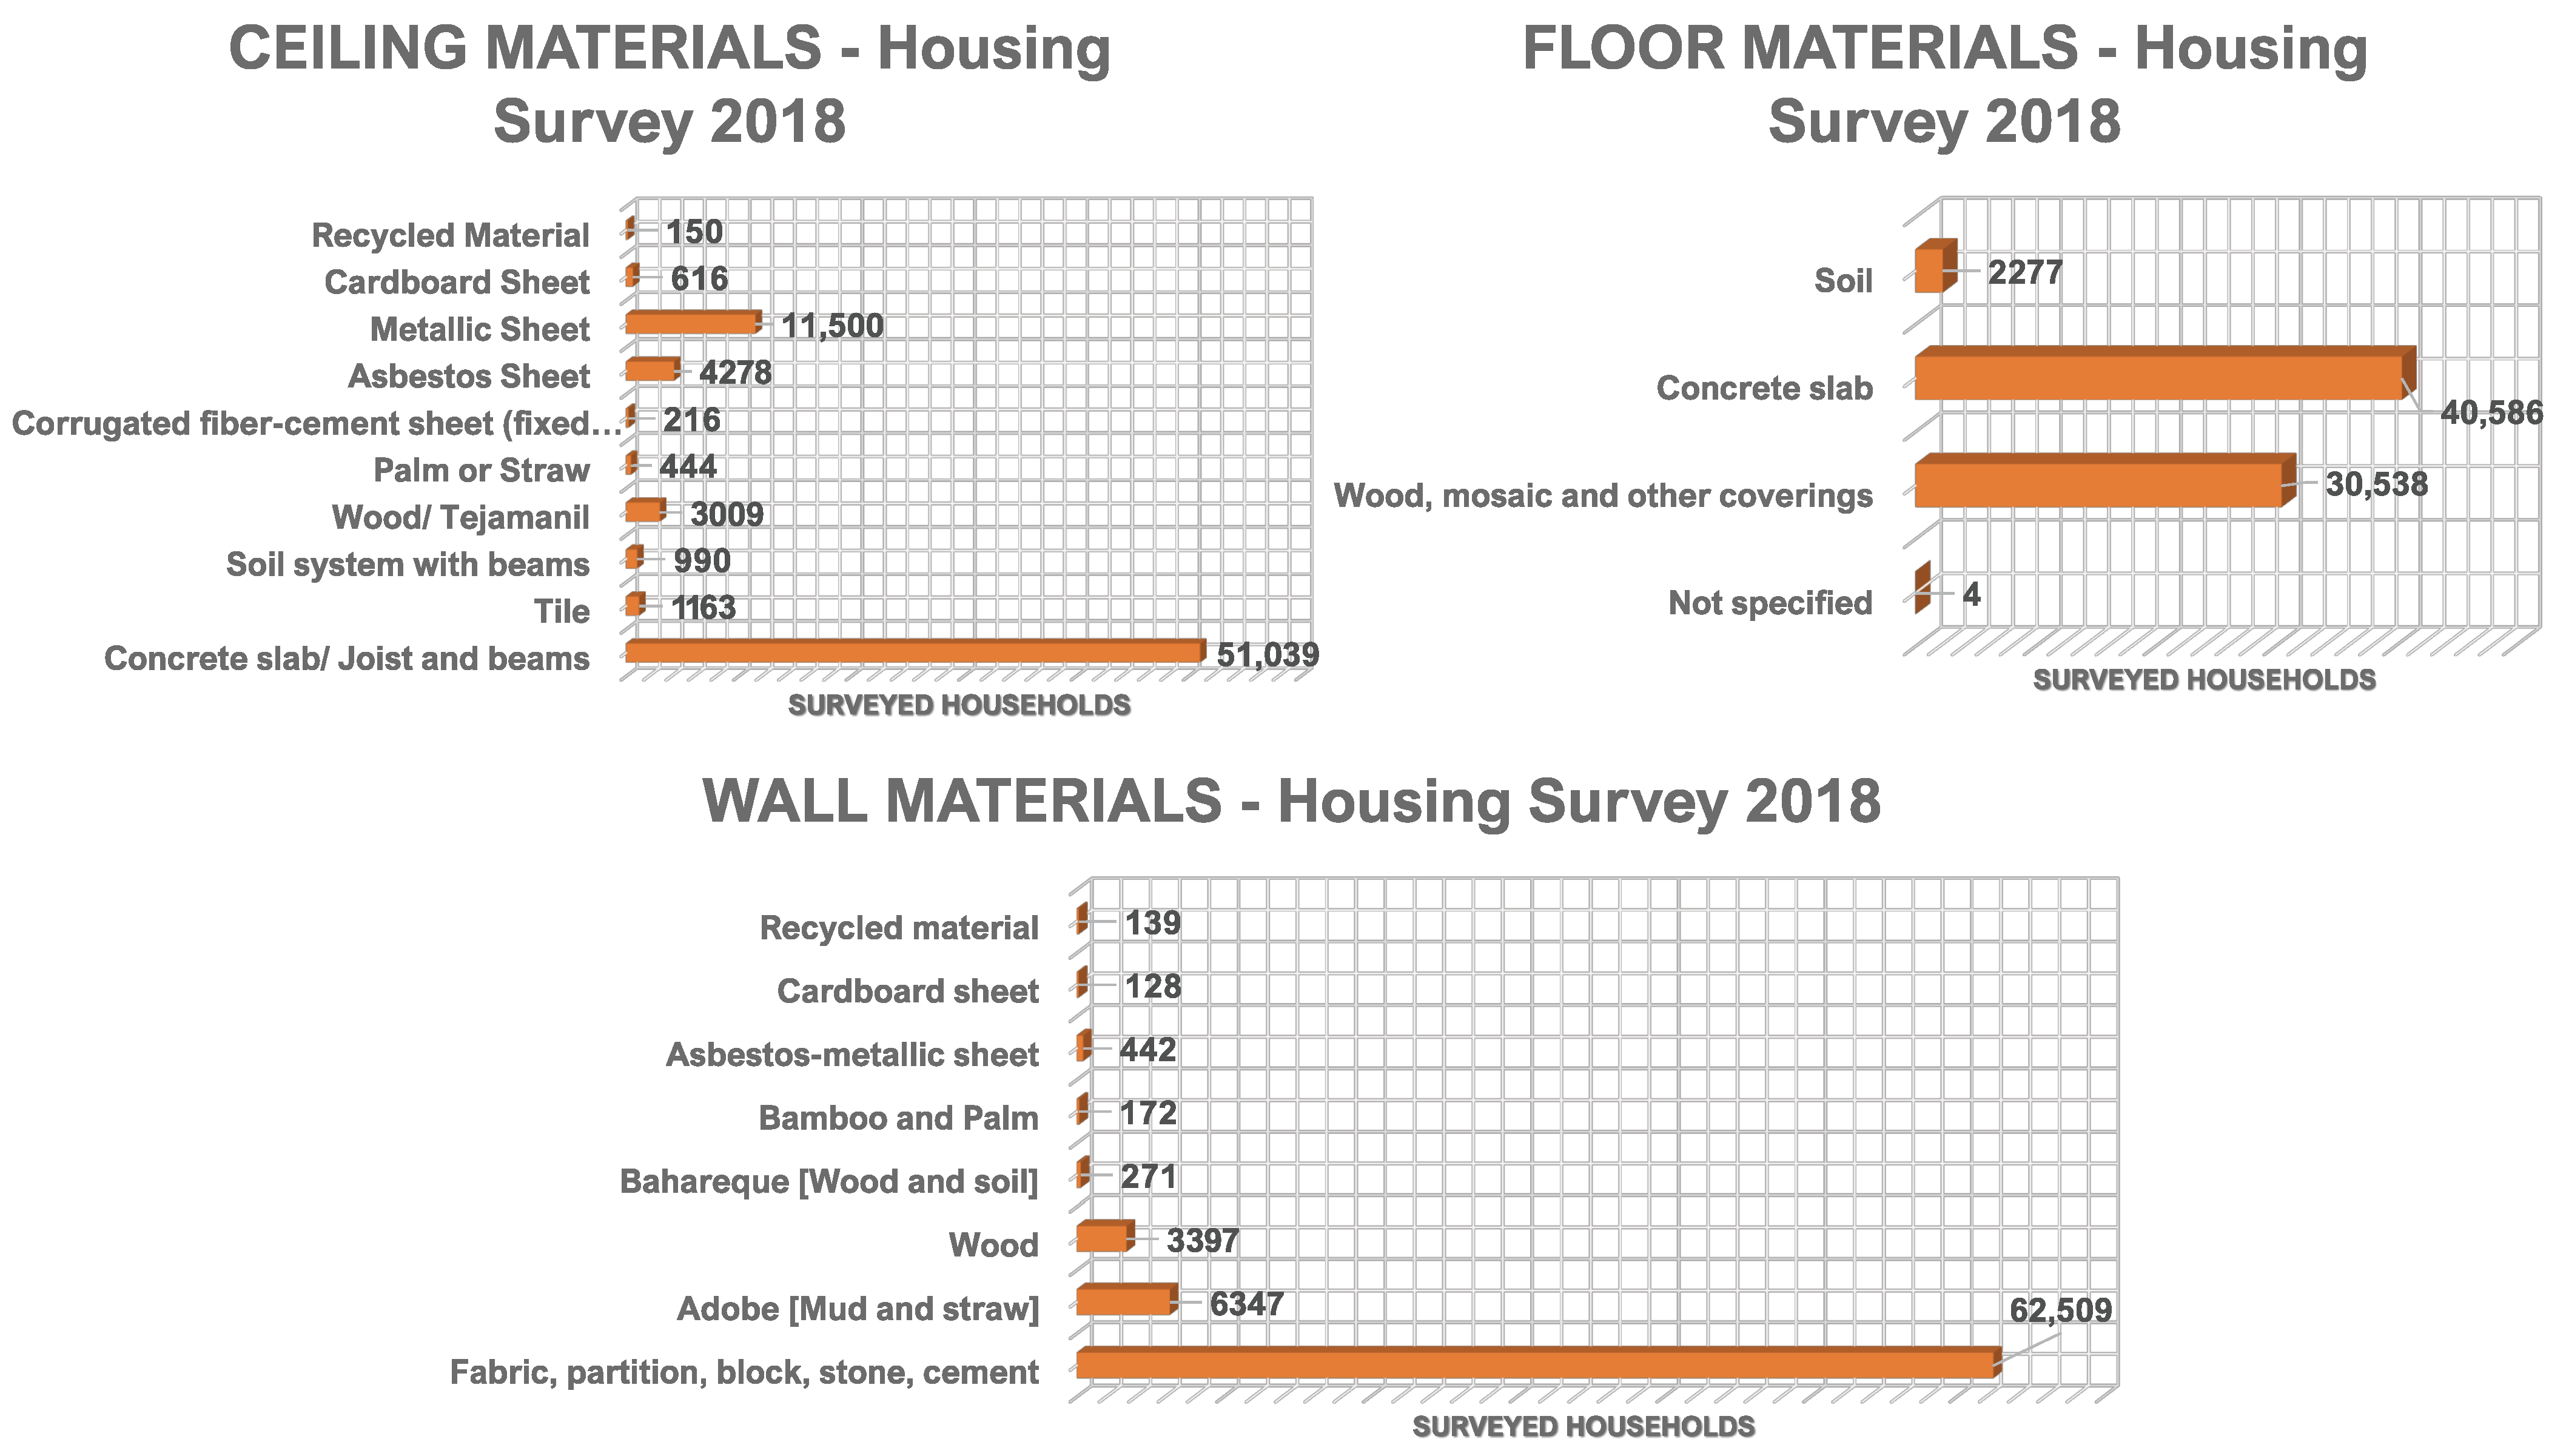
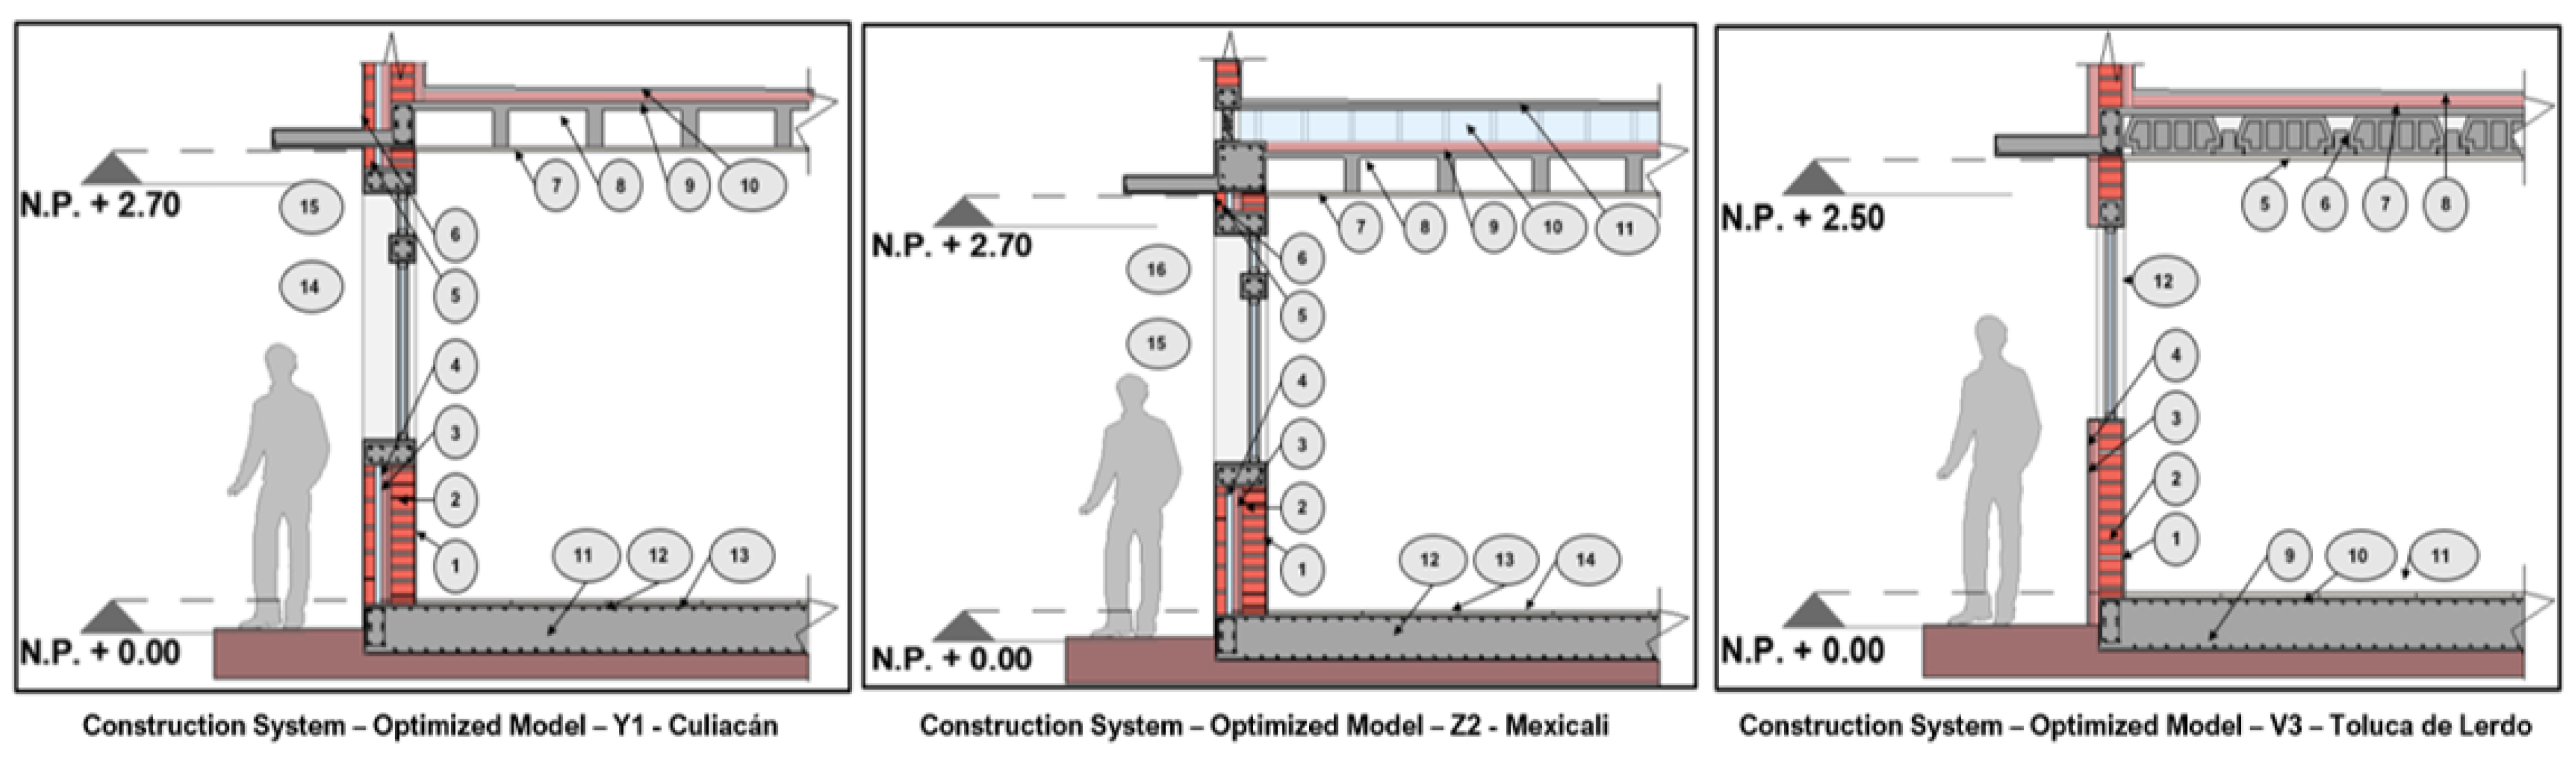
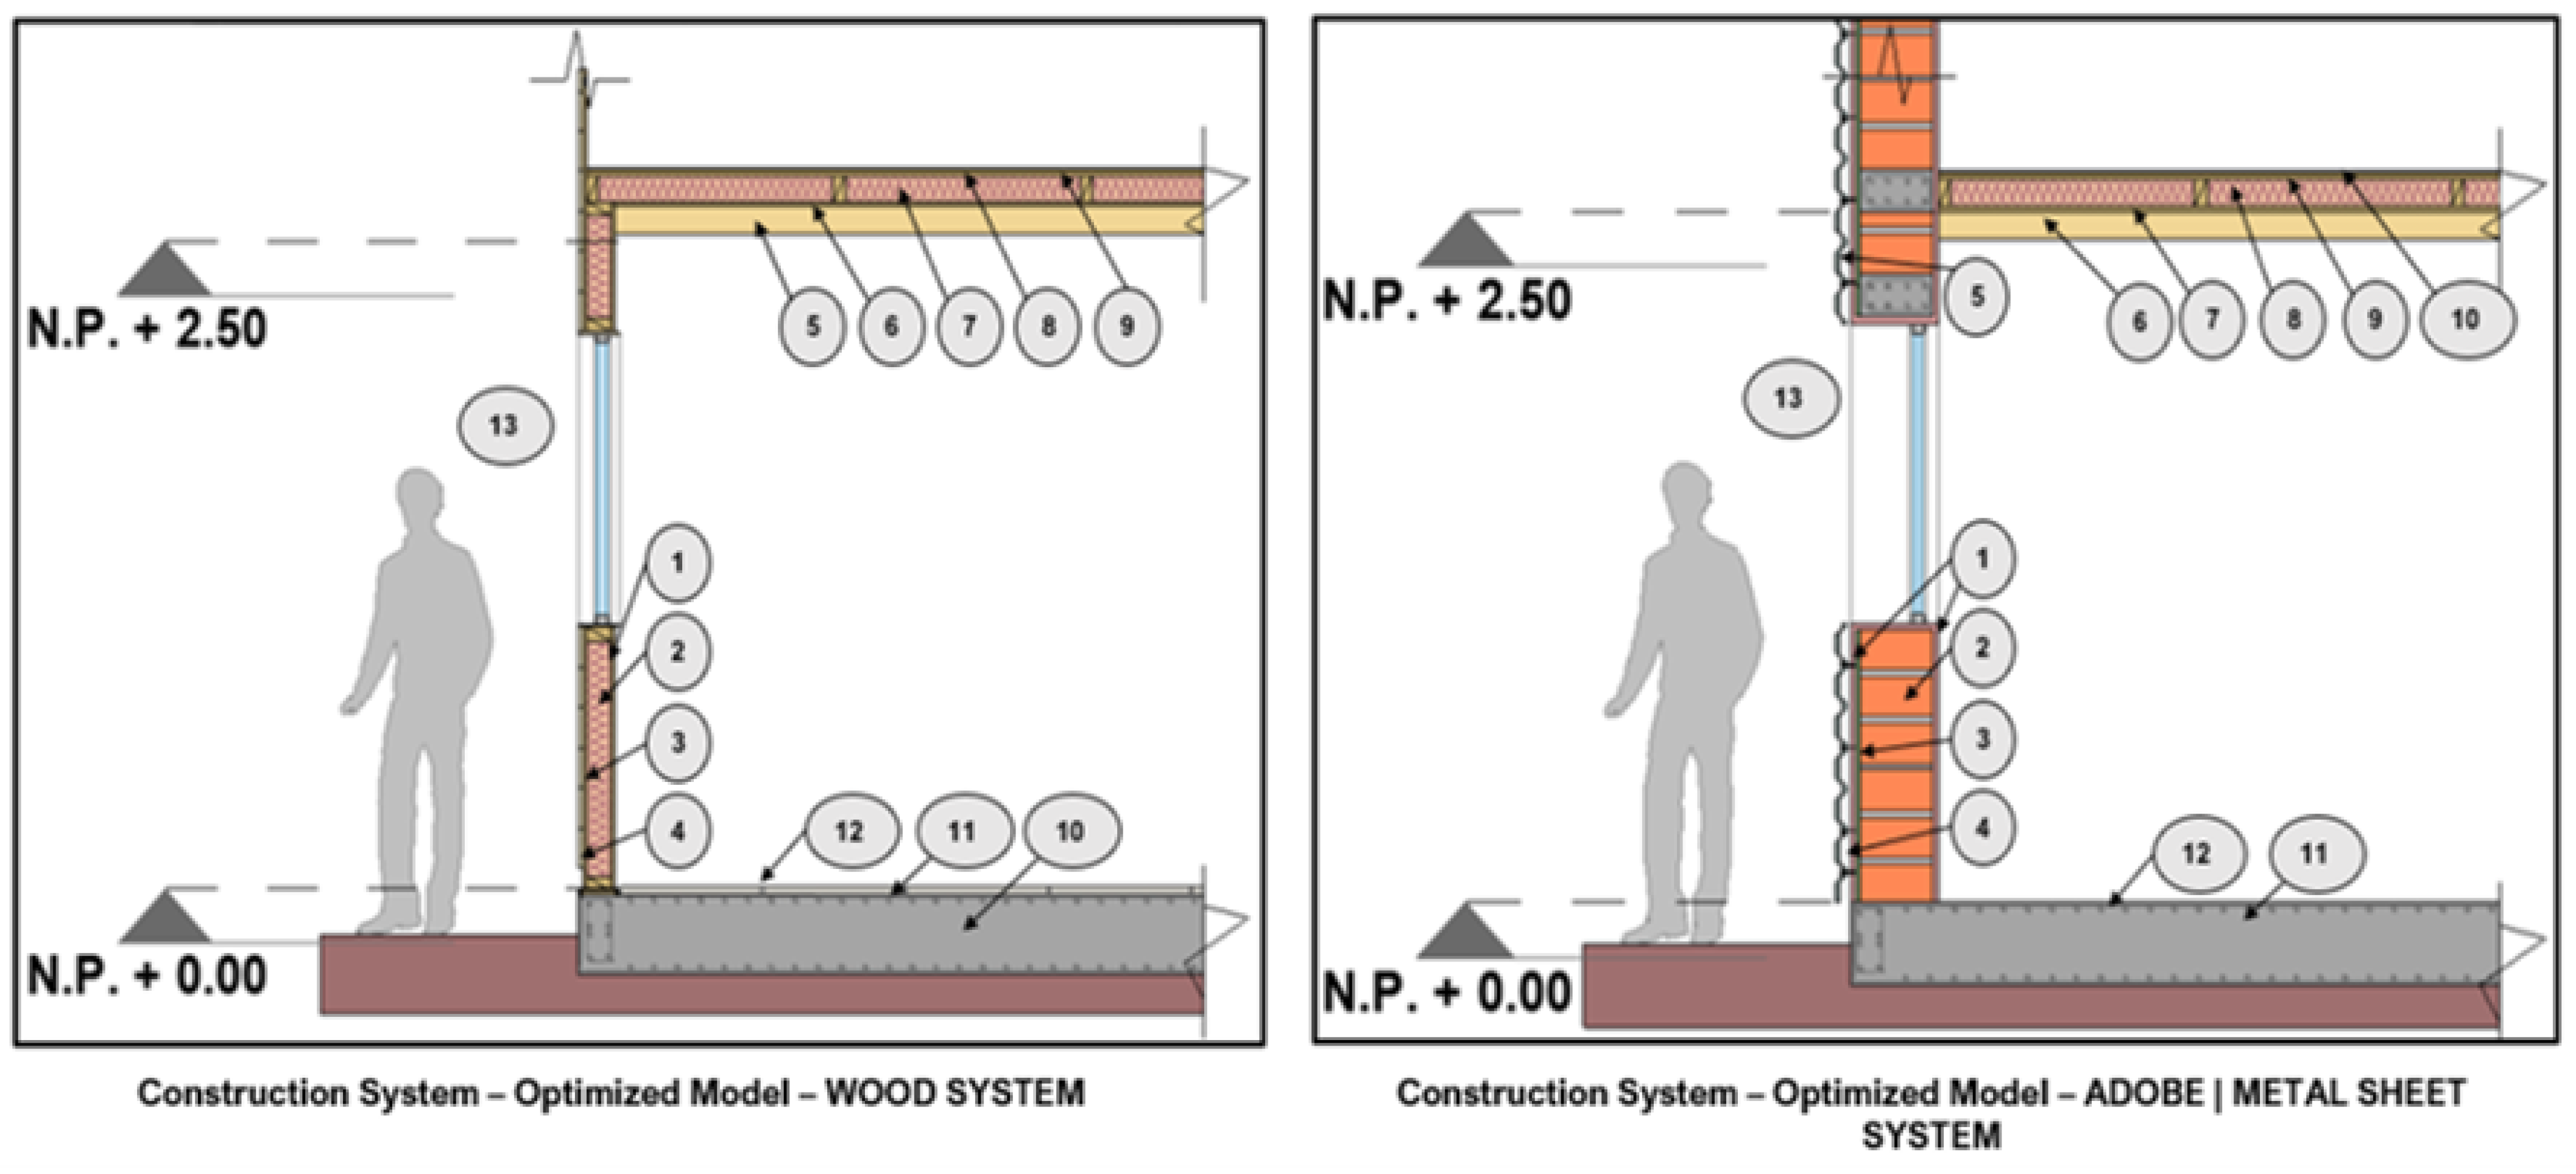
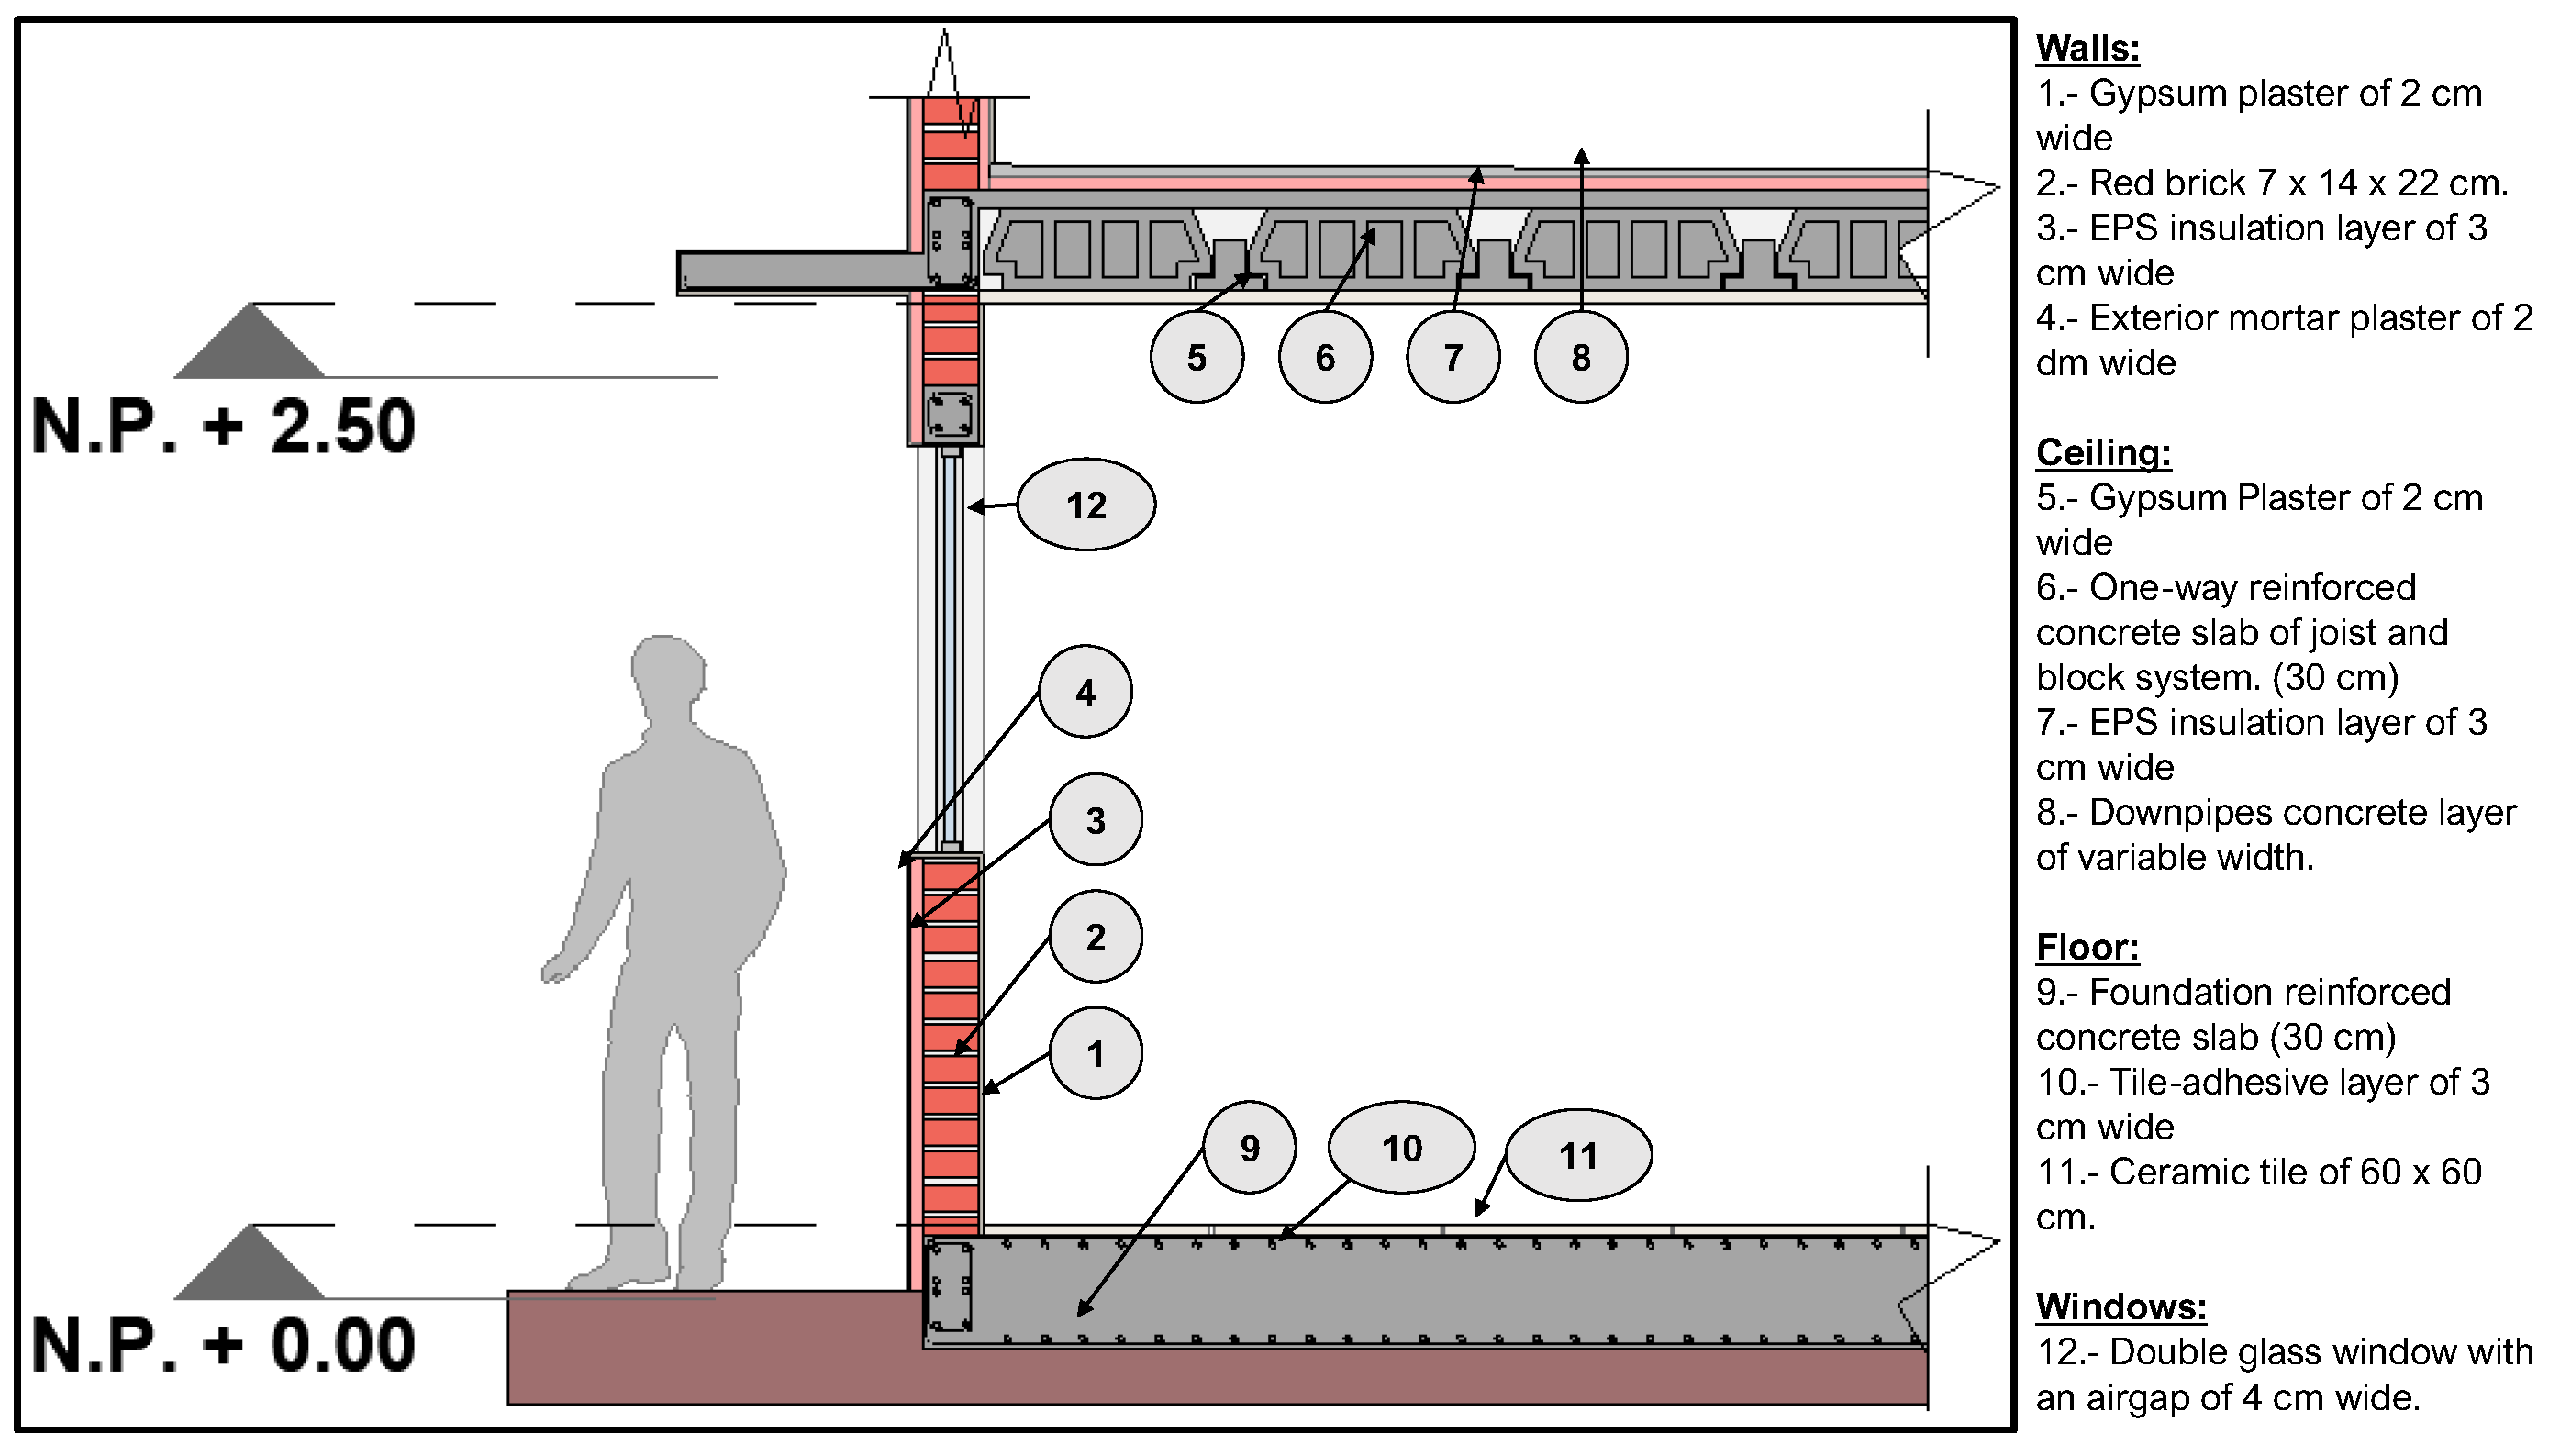
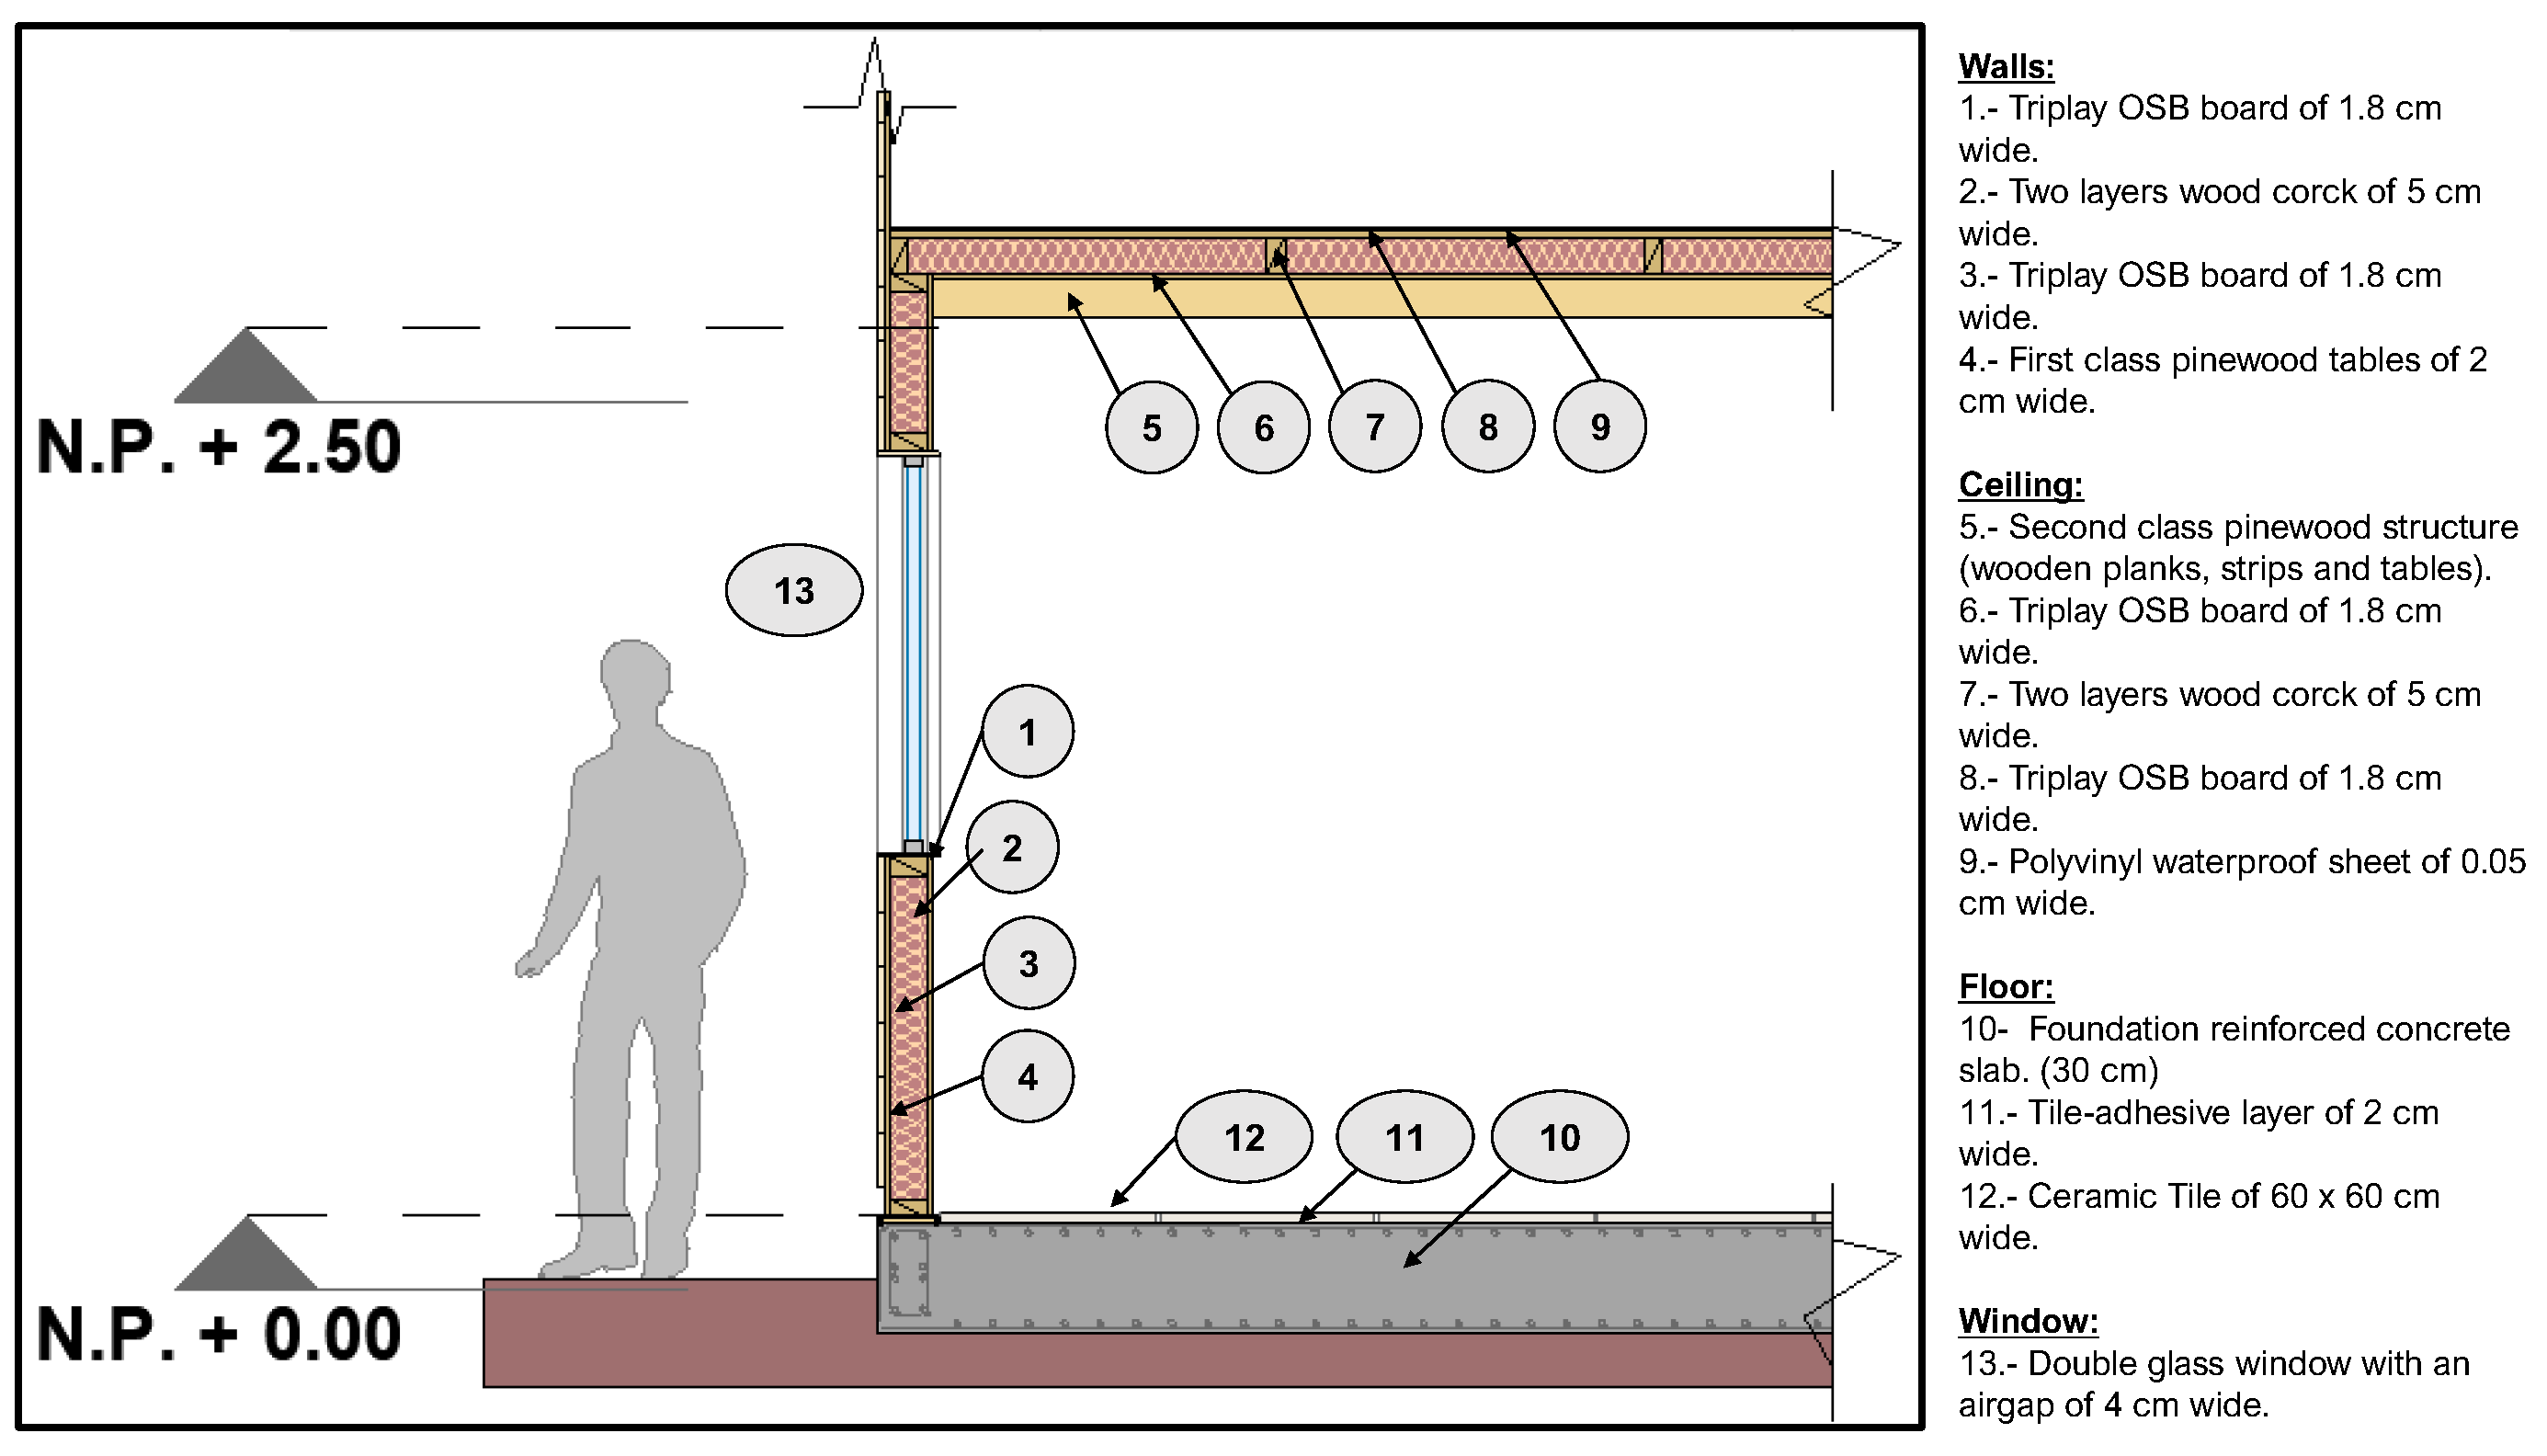
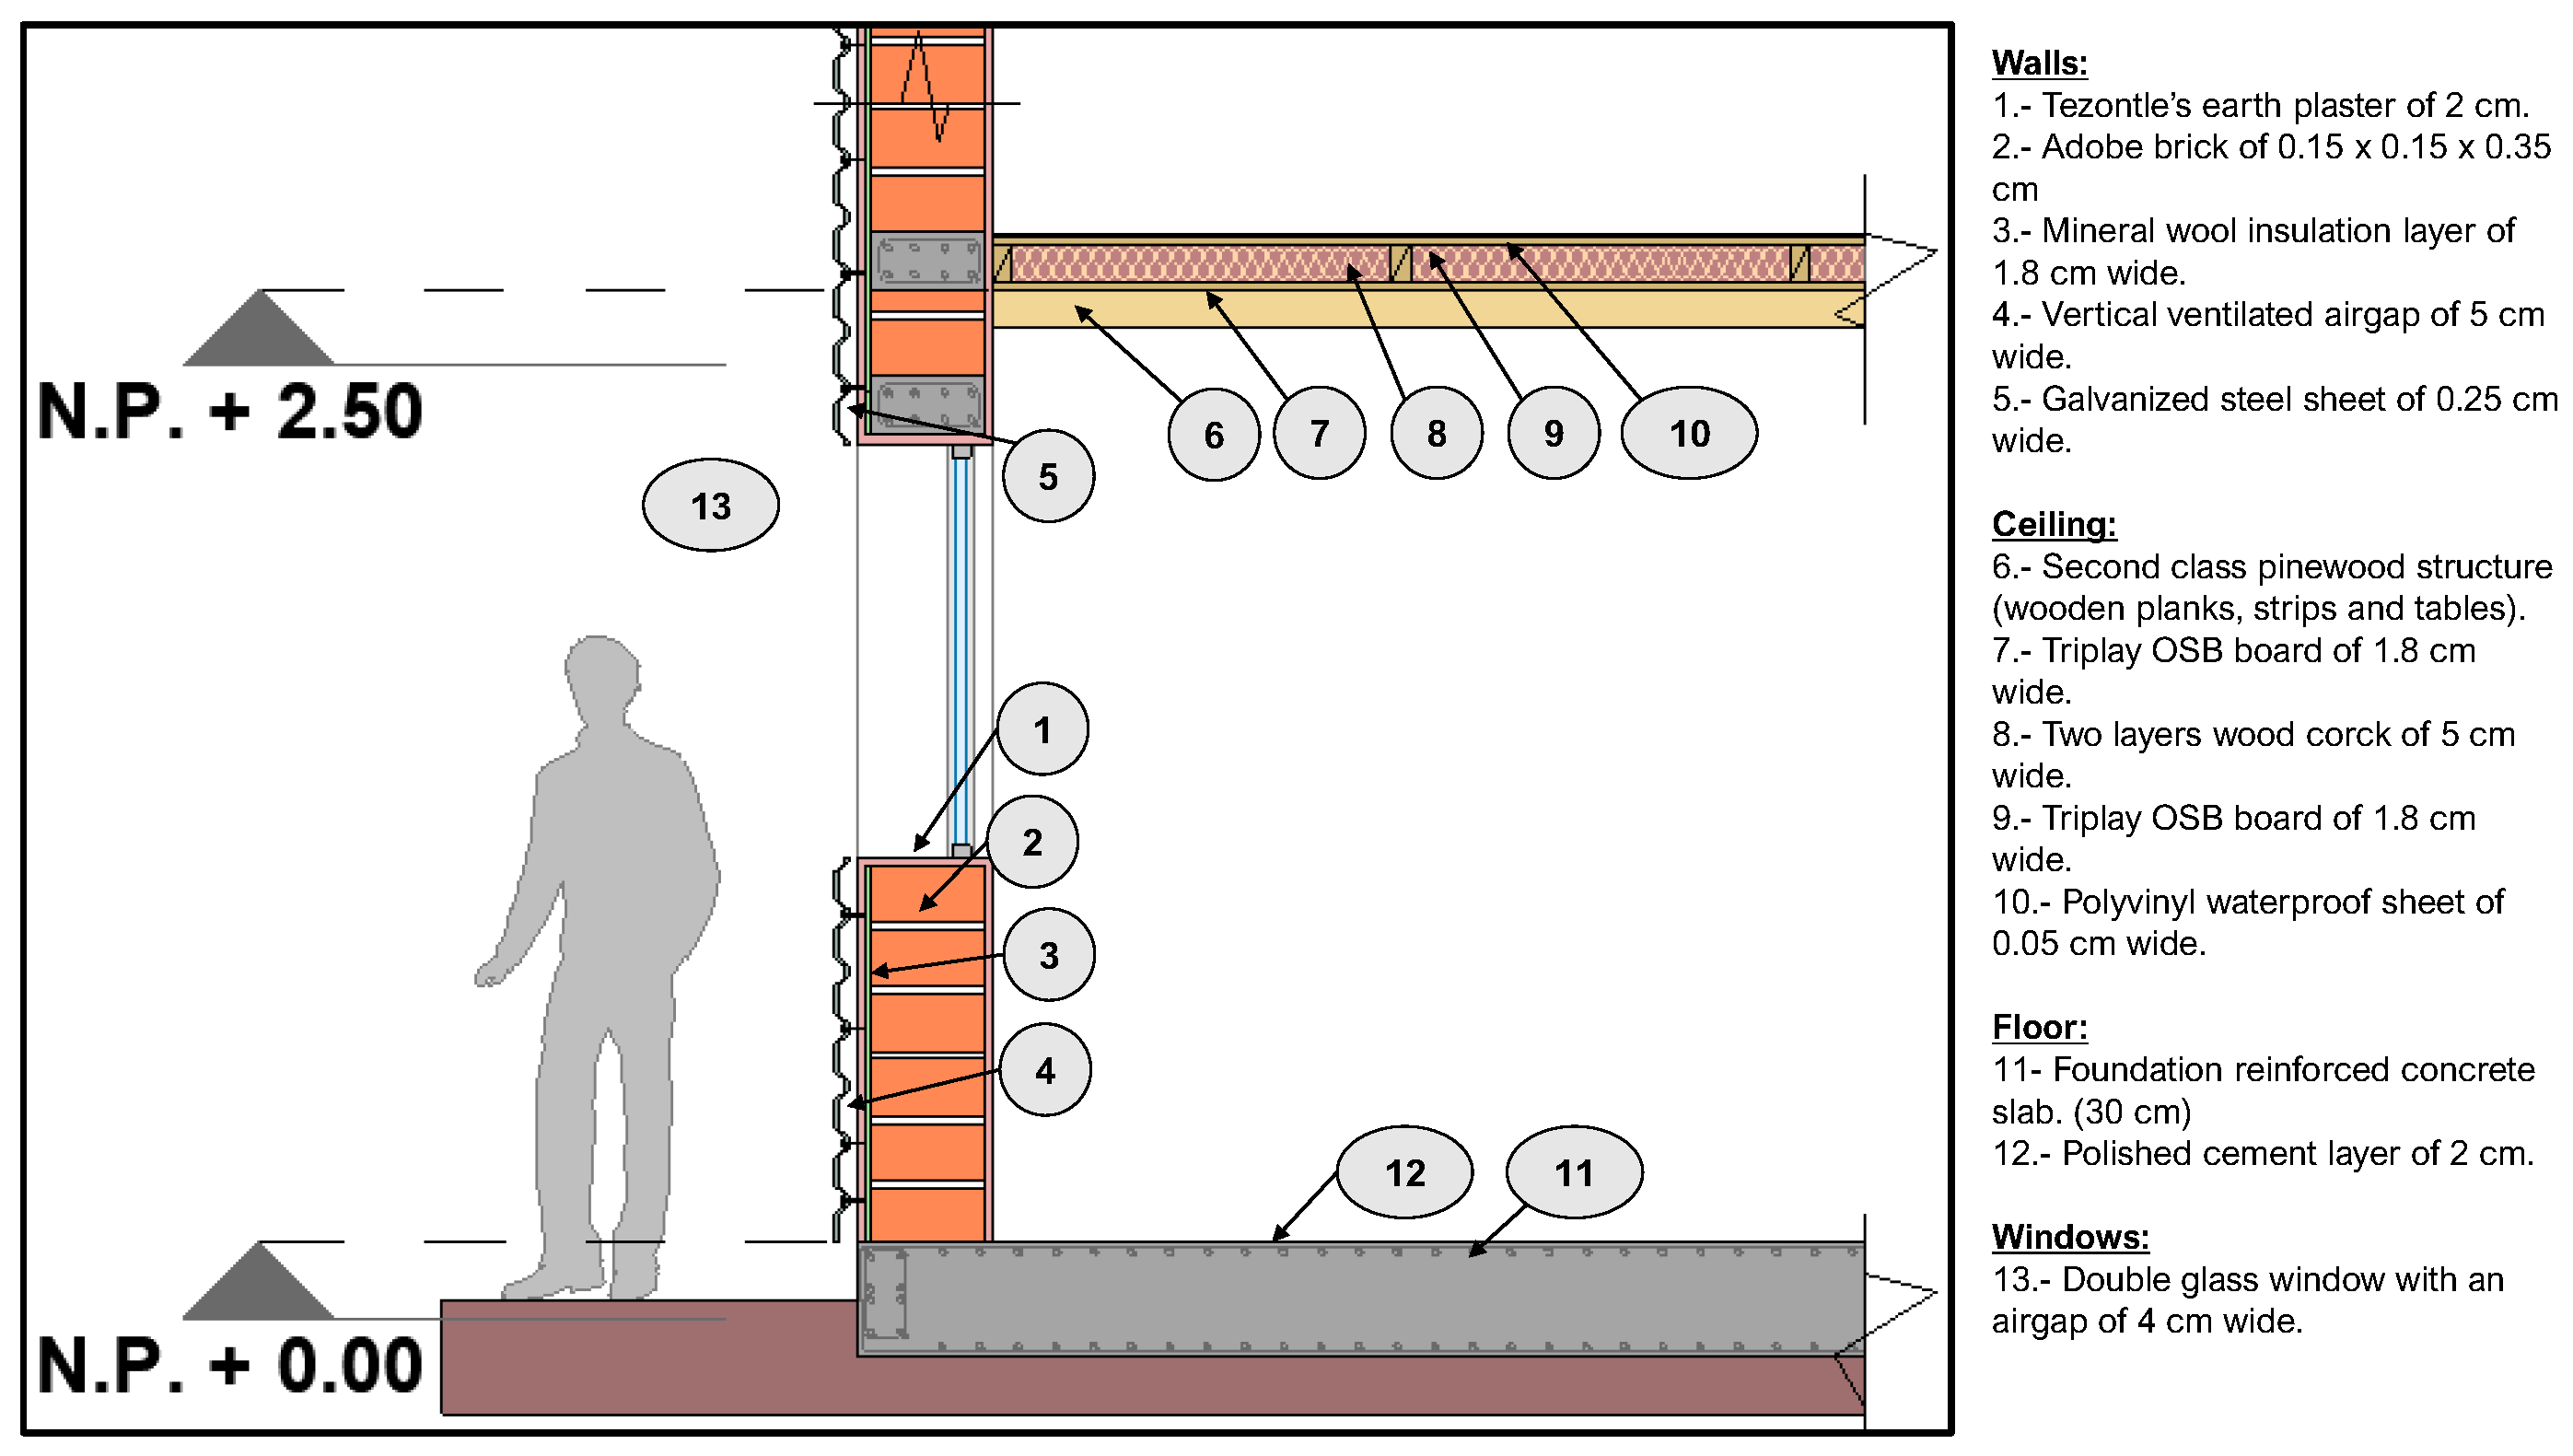
2.4. Traditional Construction Systems
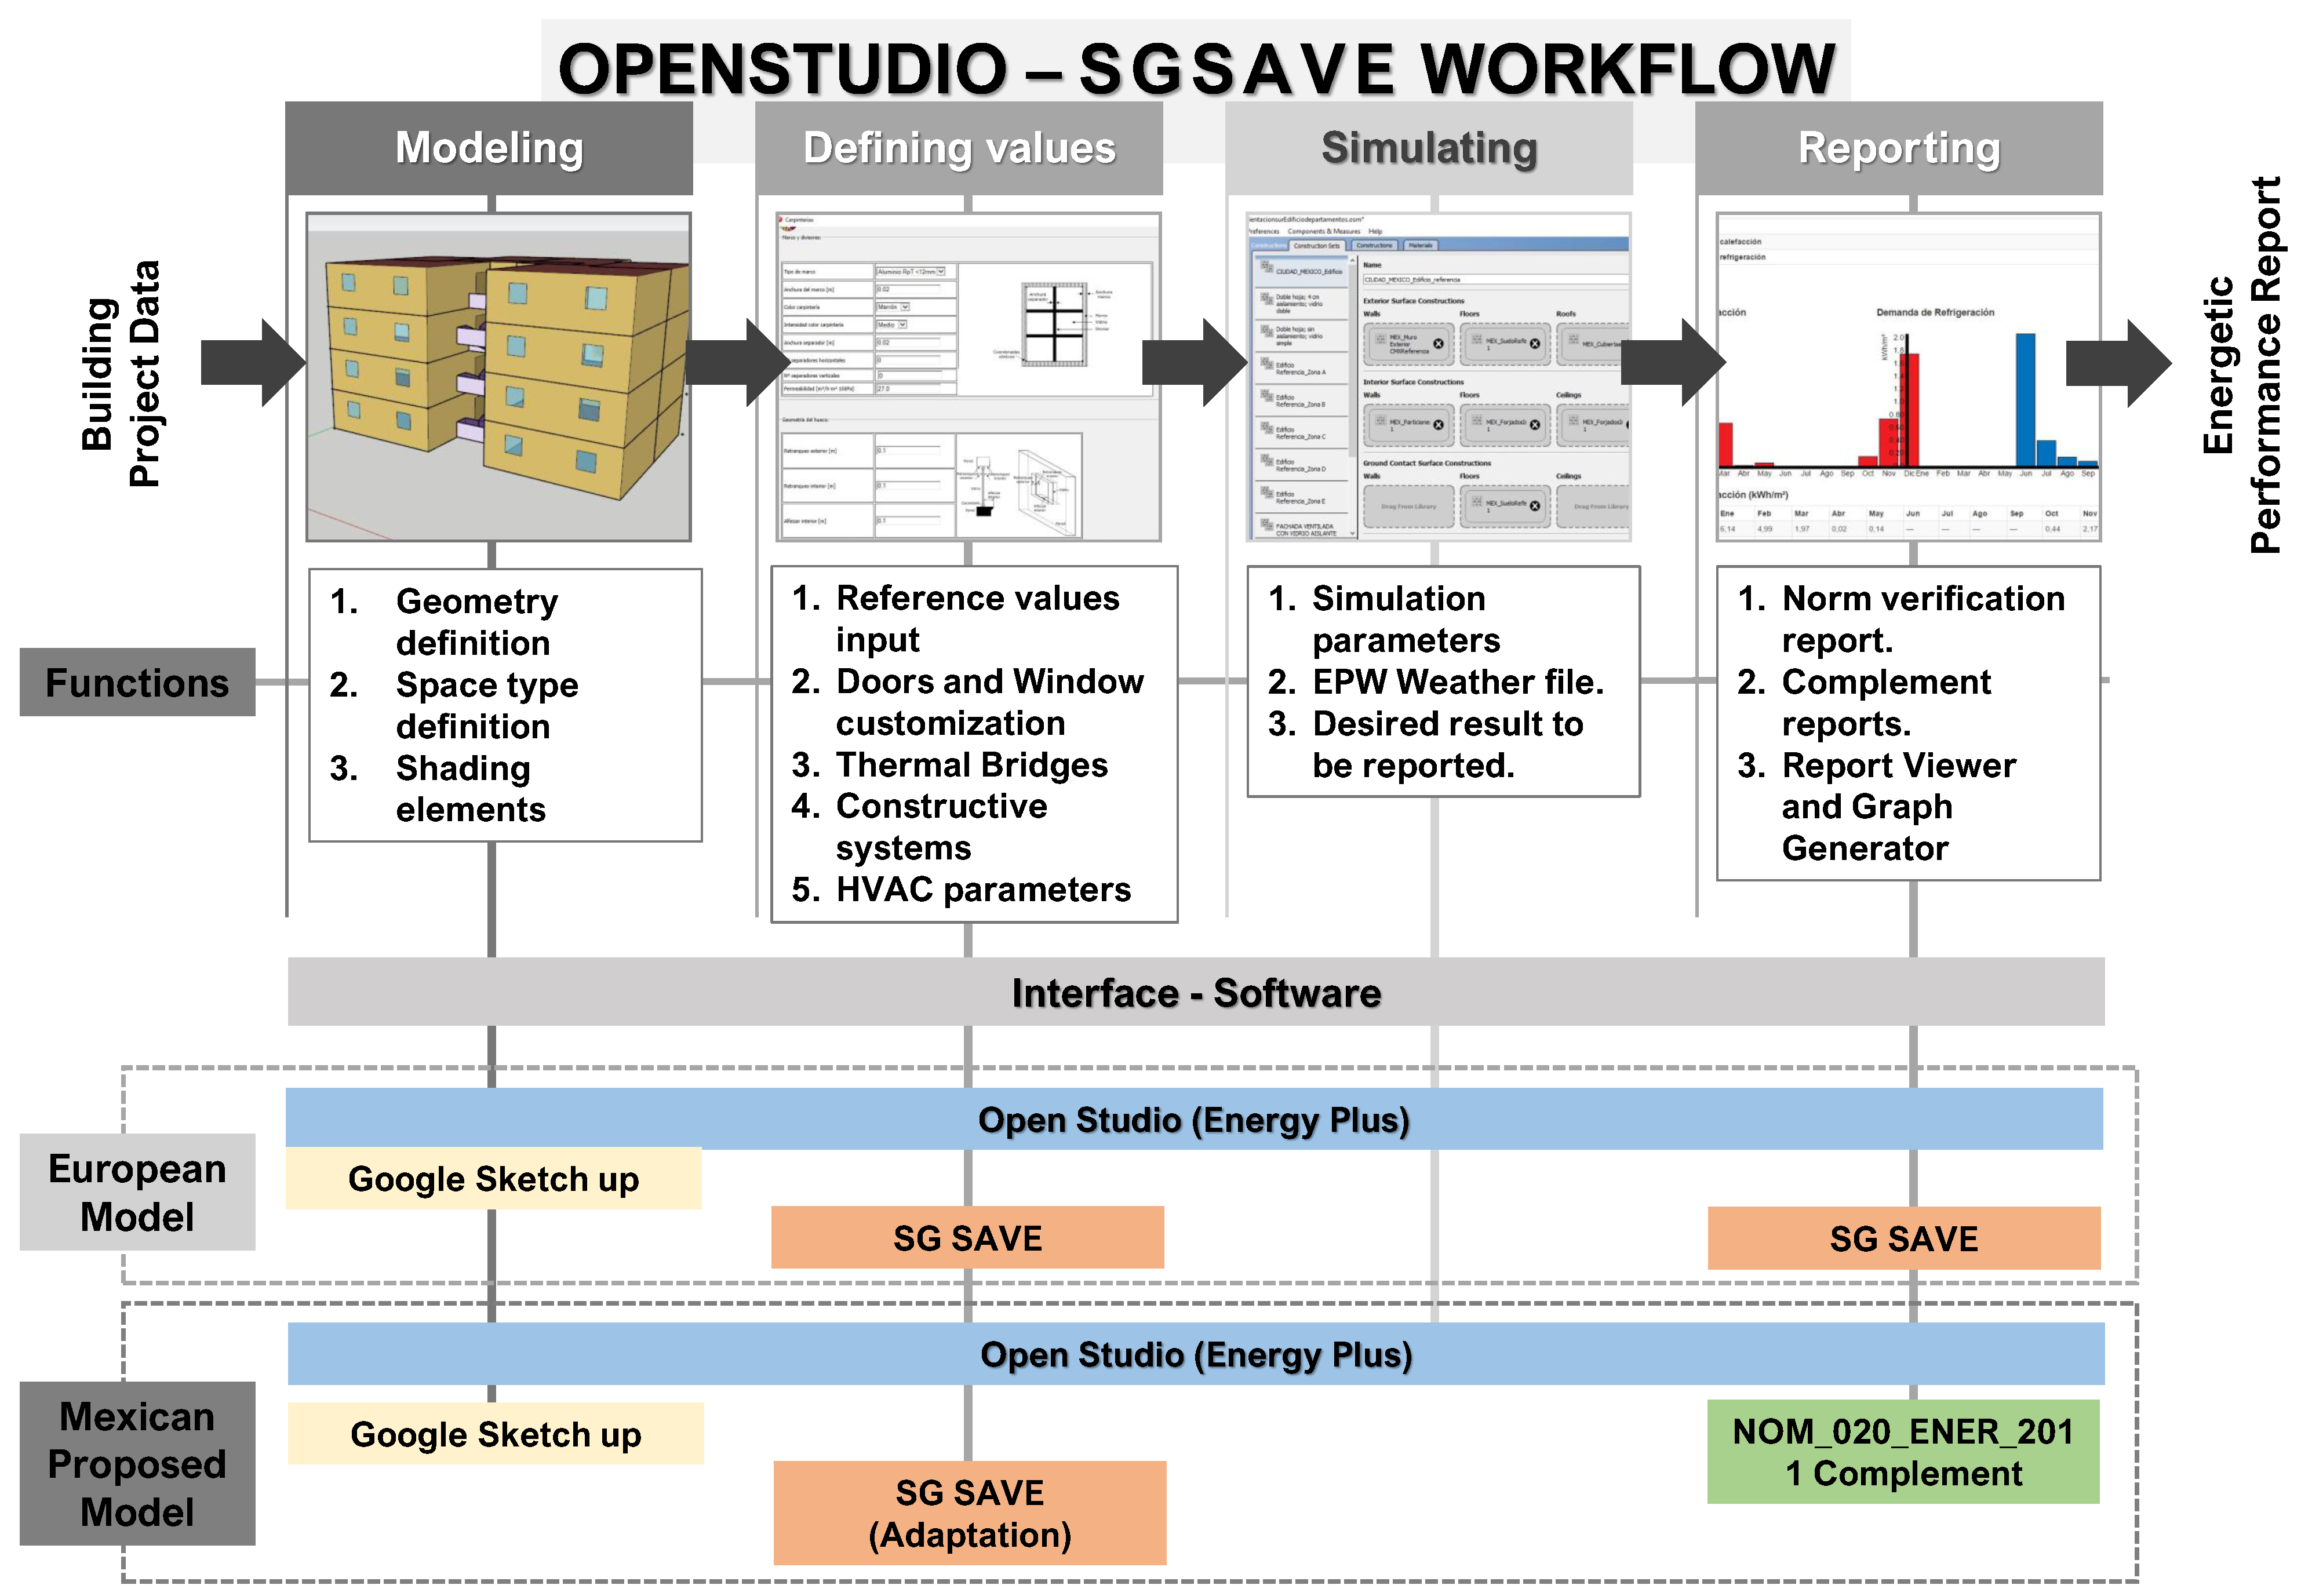
2.5. Testing Methodology
2.6. Testing Application
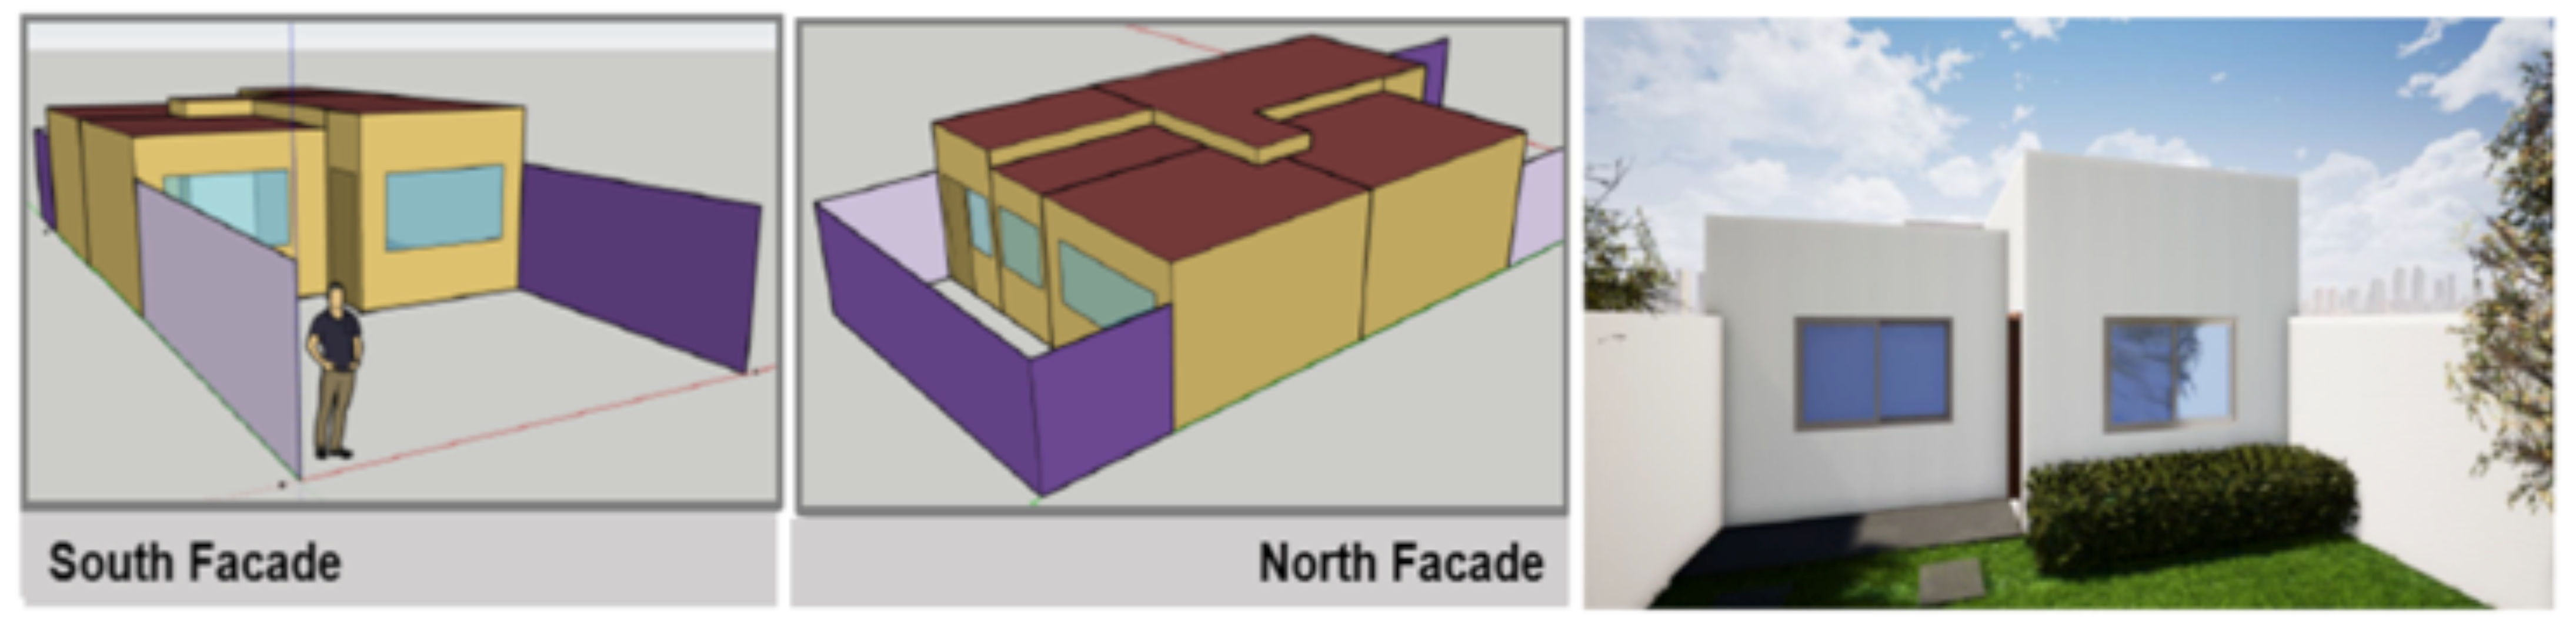
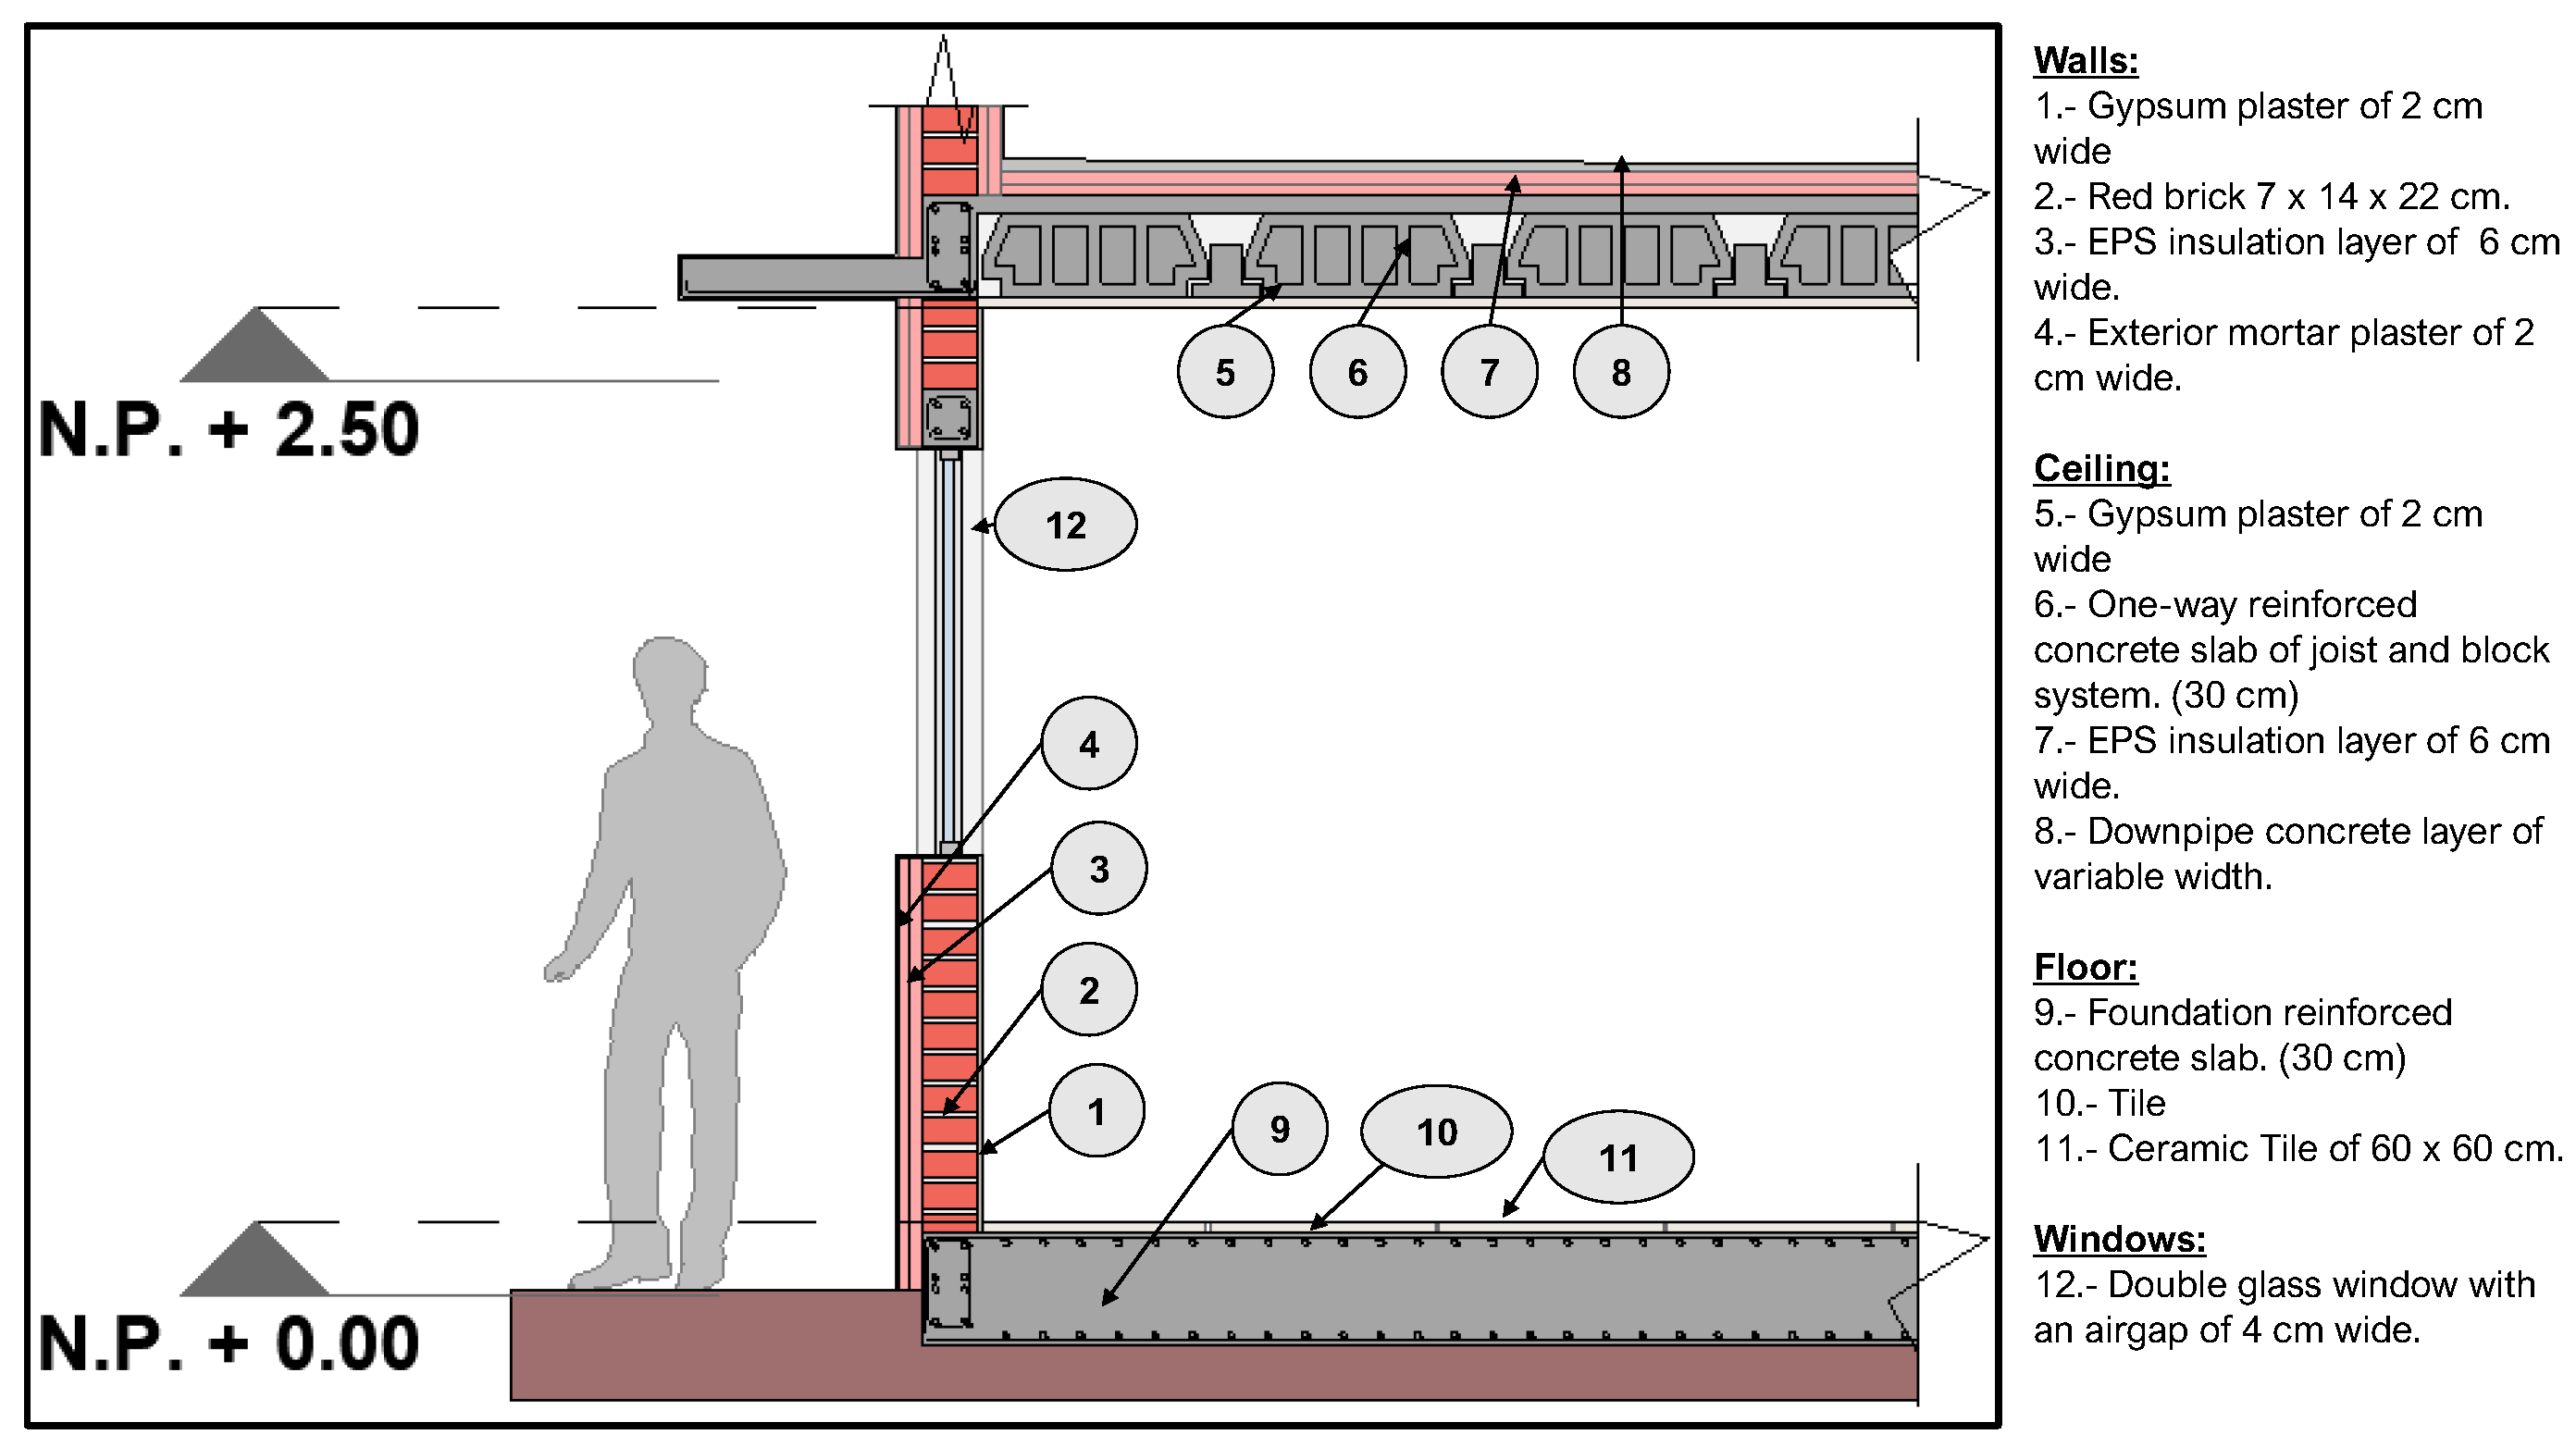
2.6.1. Basic Model: Definition and Test
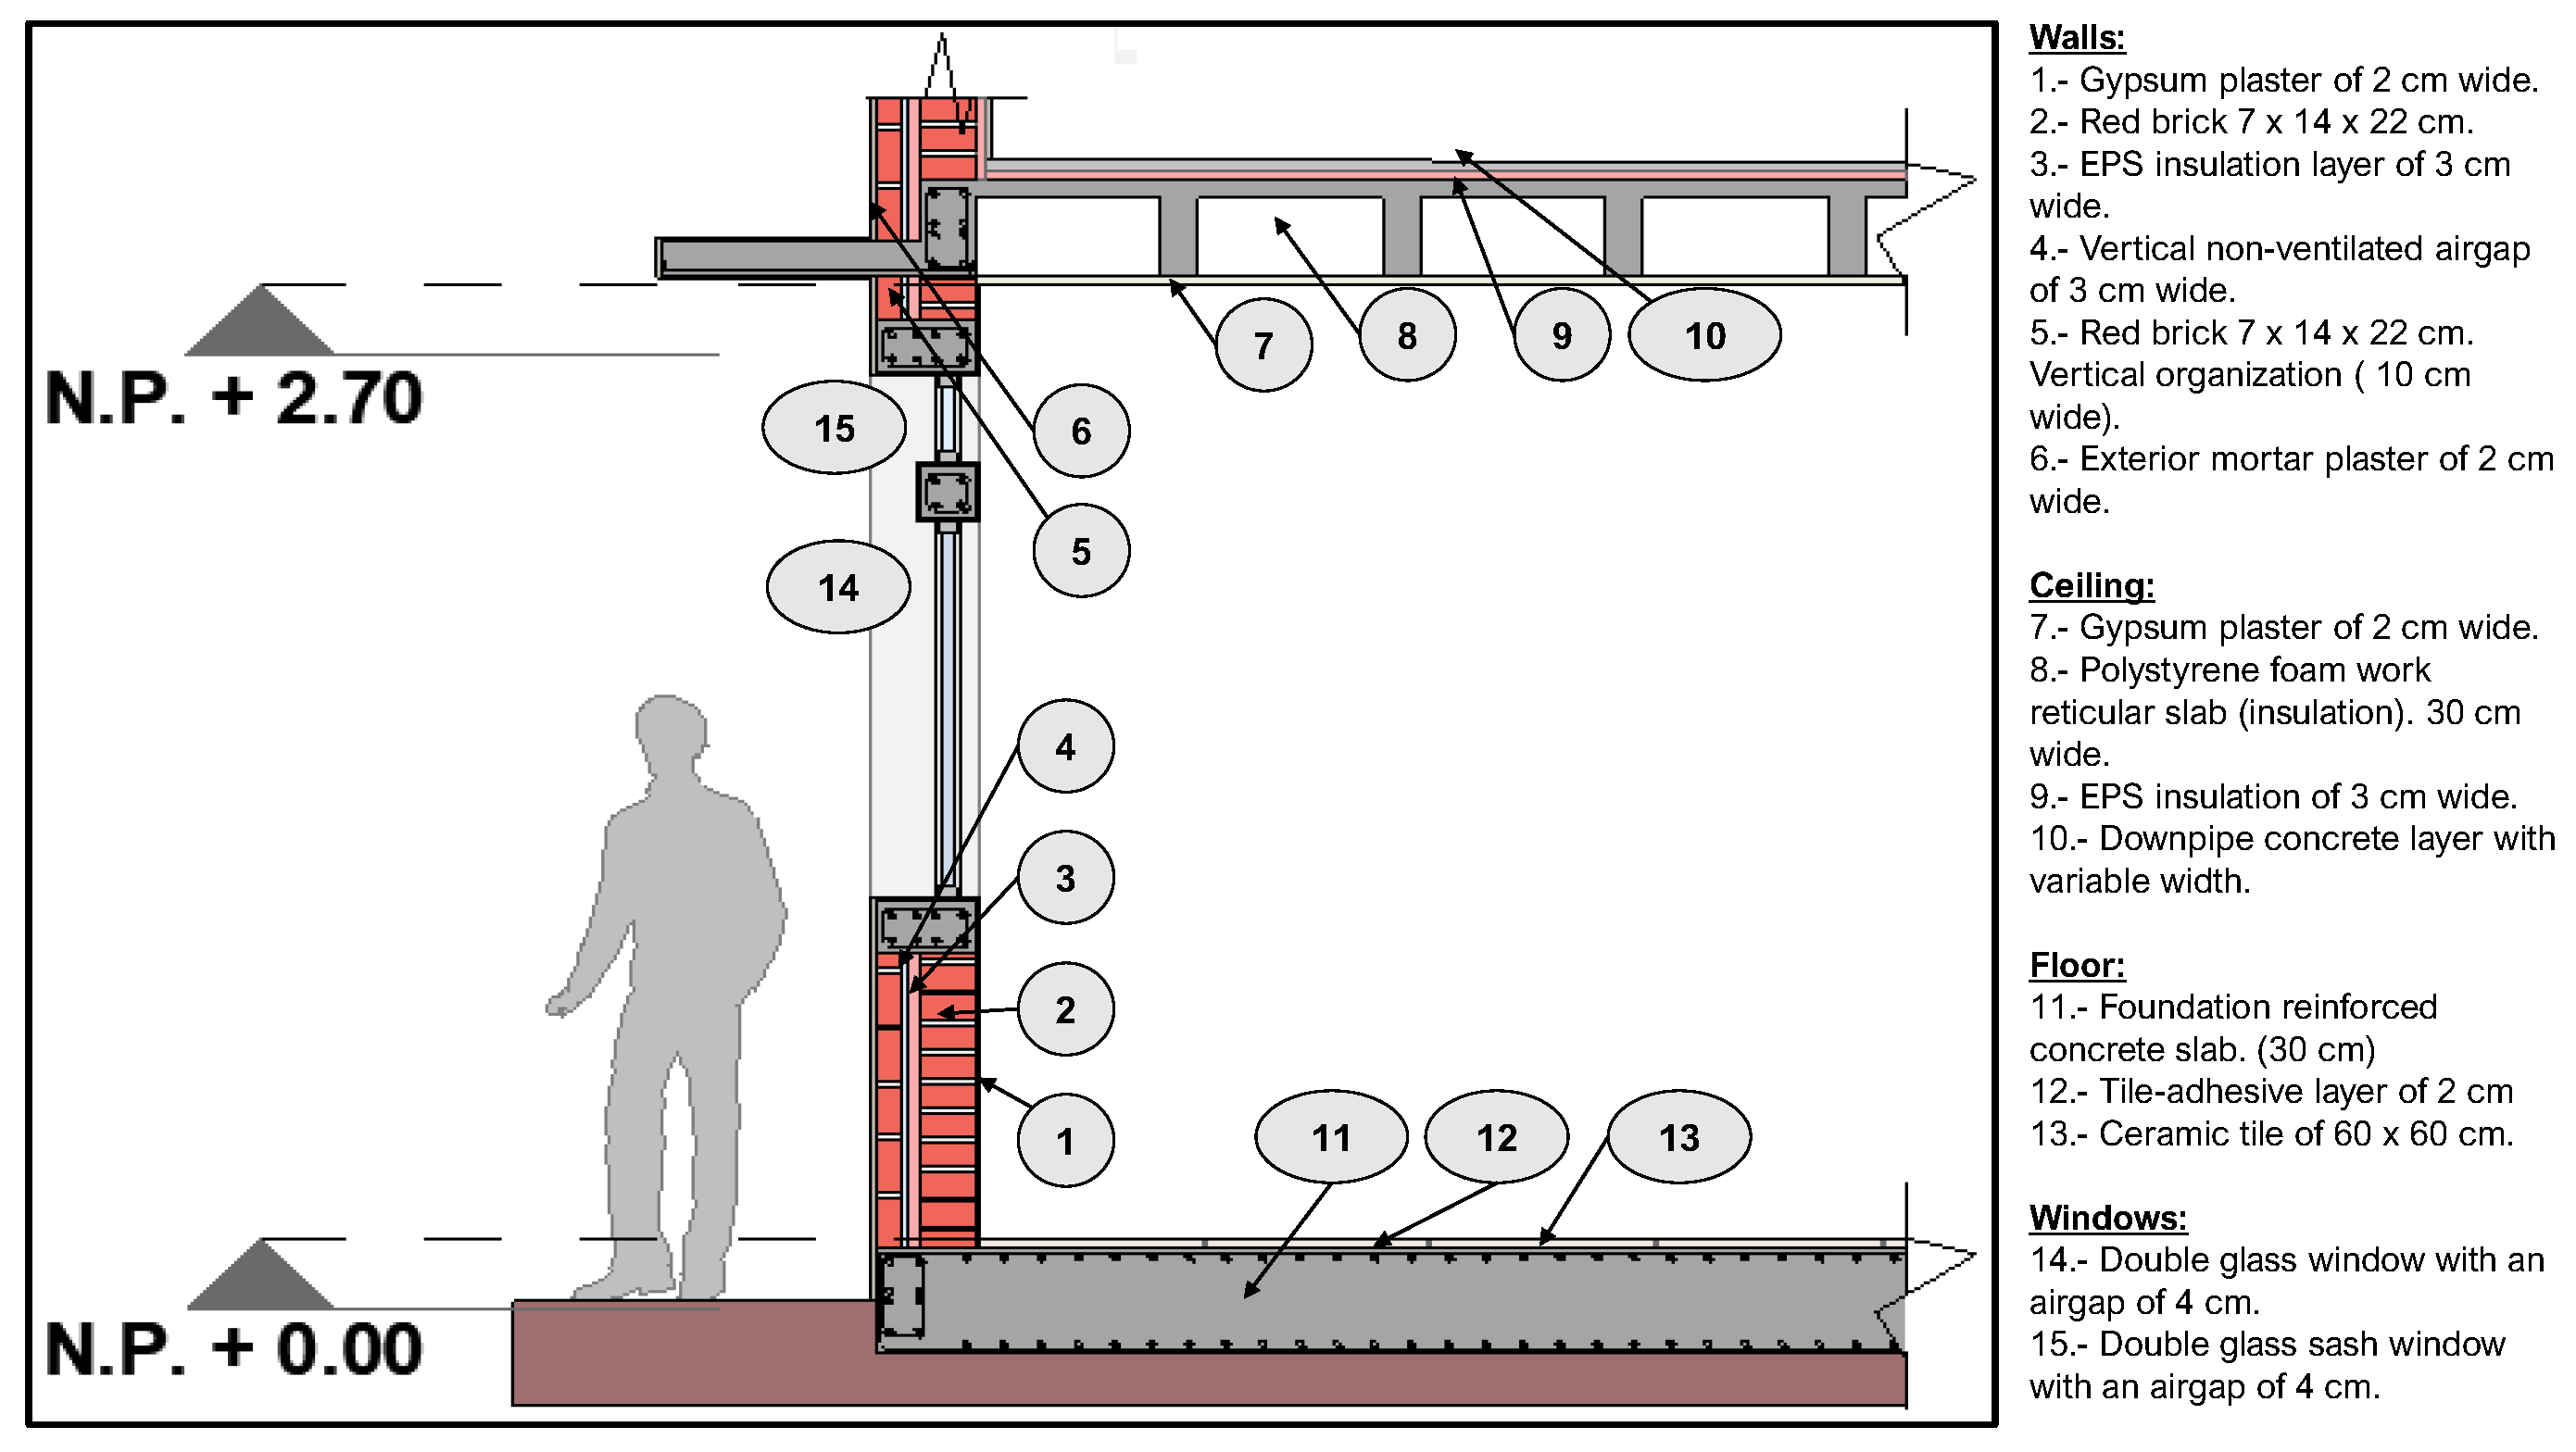
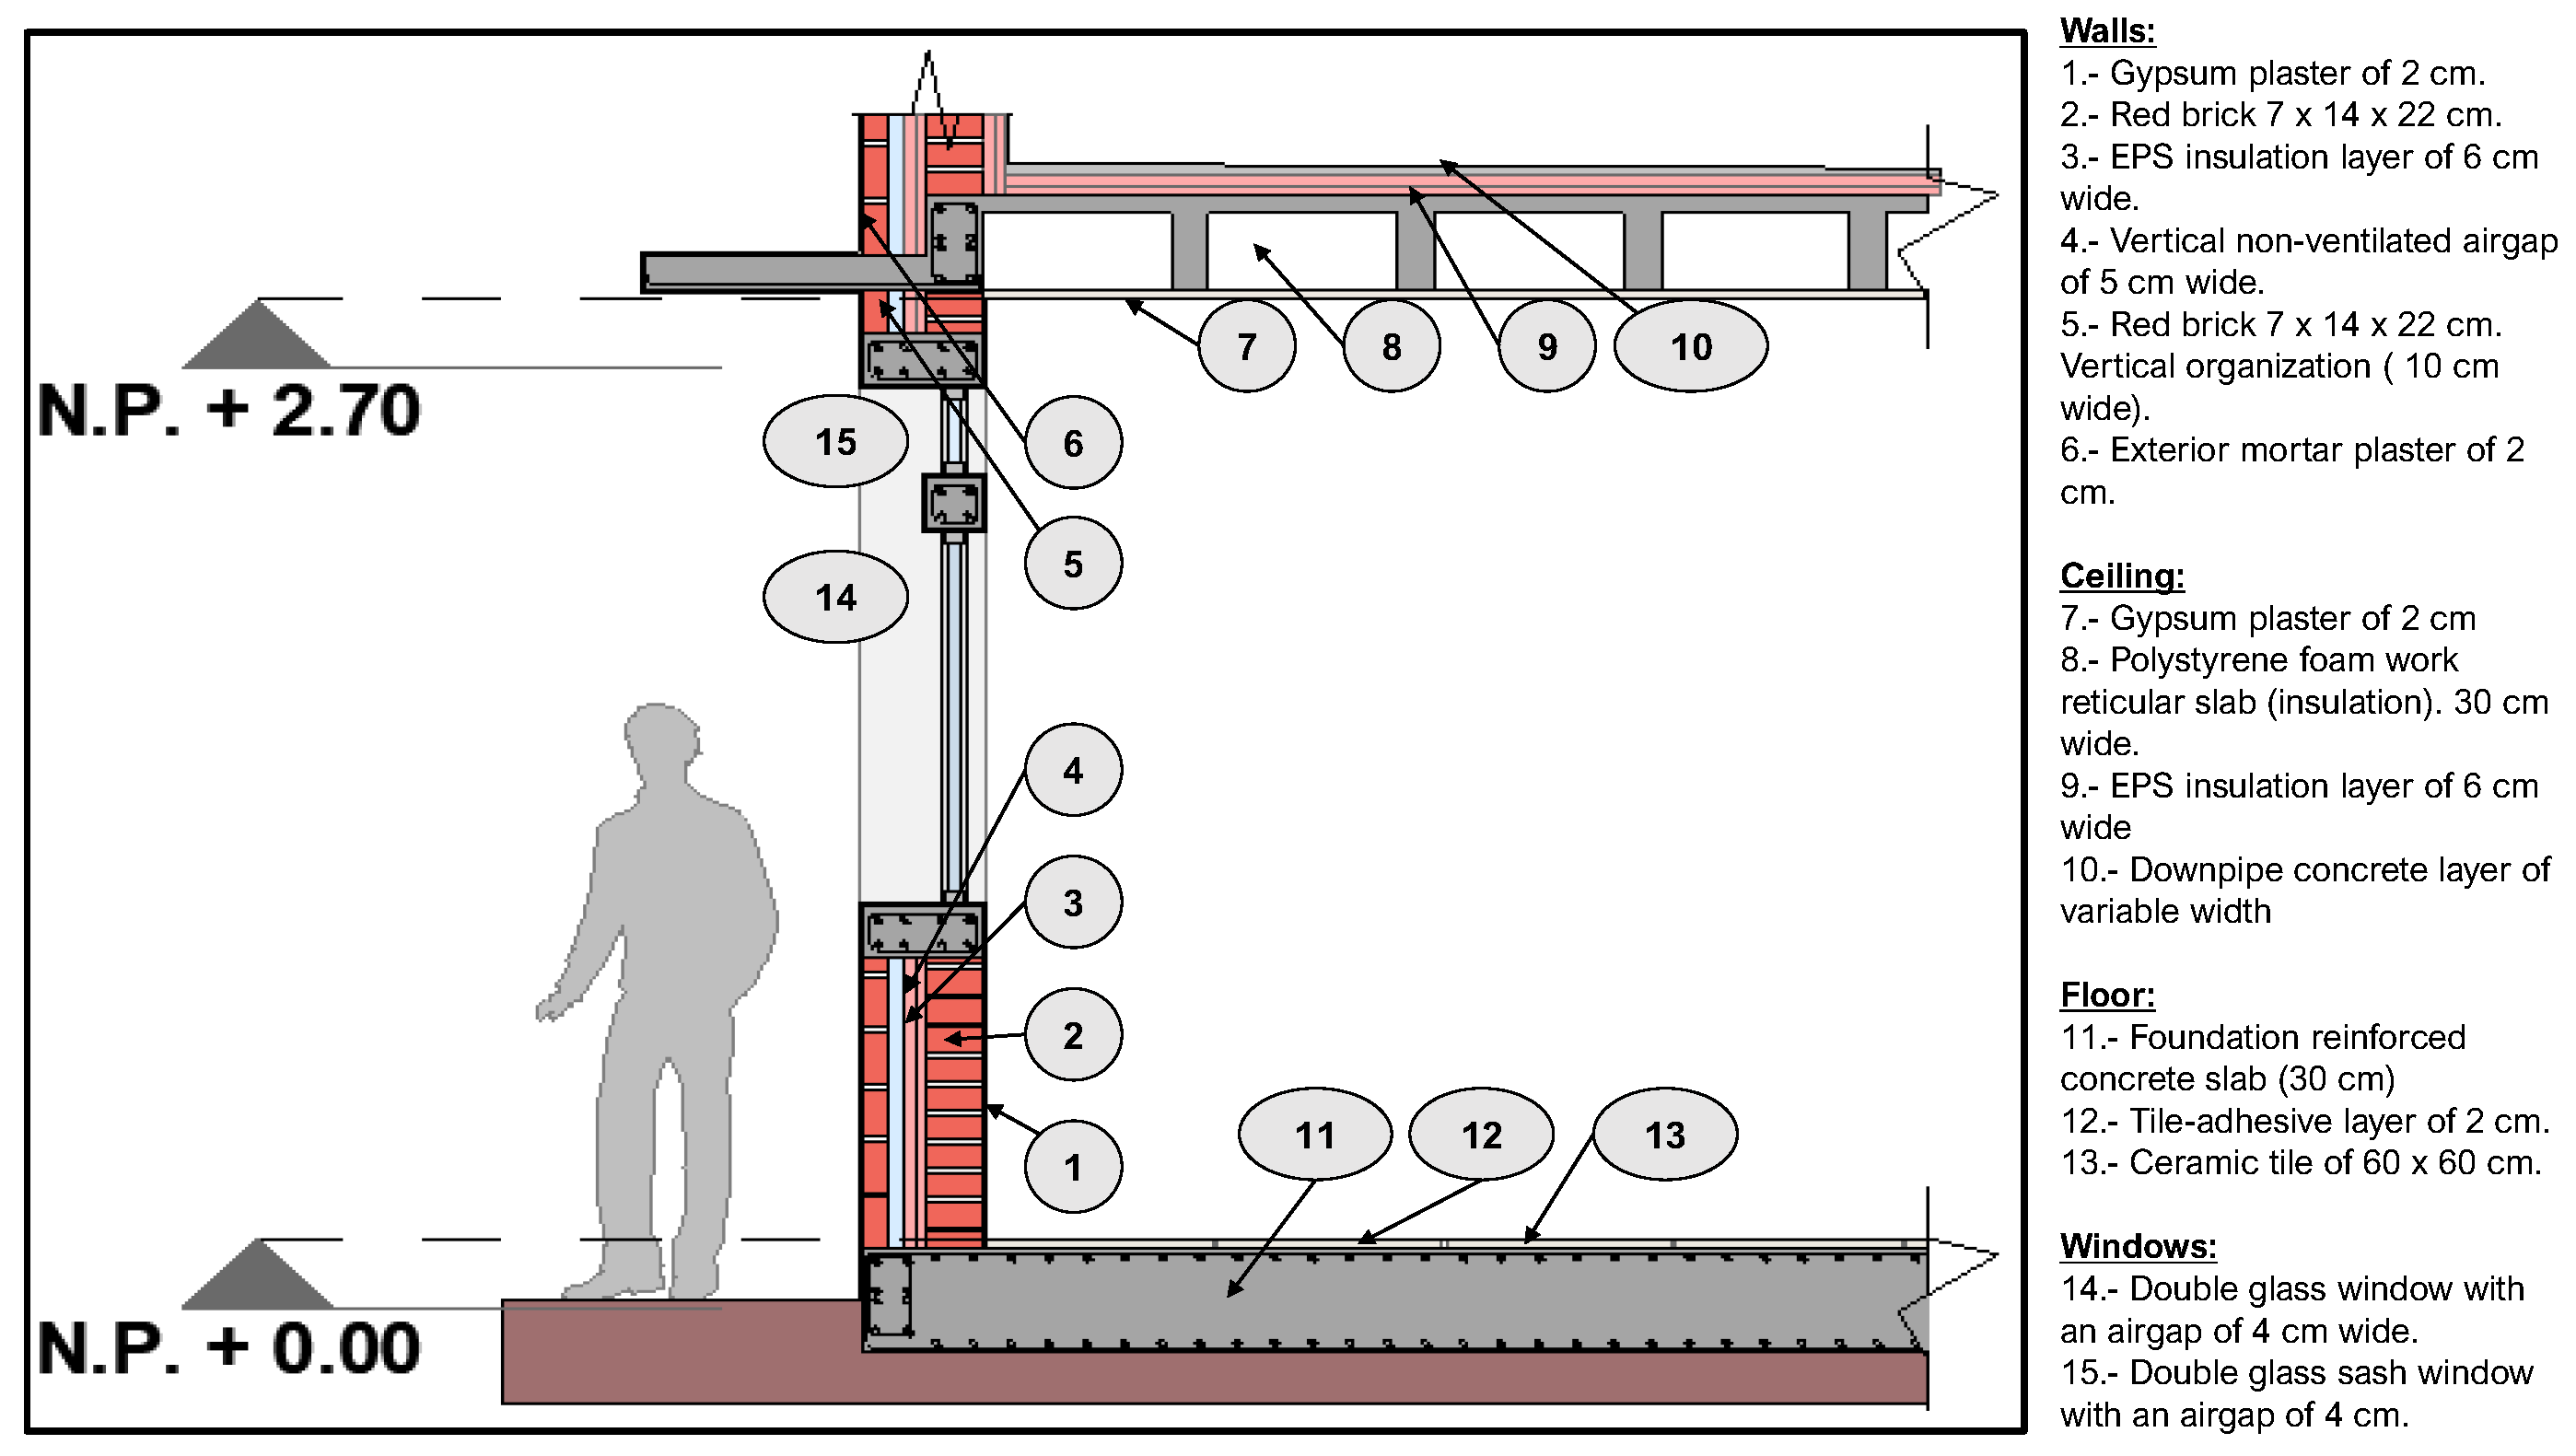
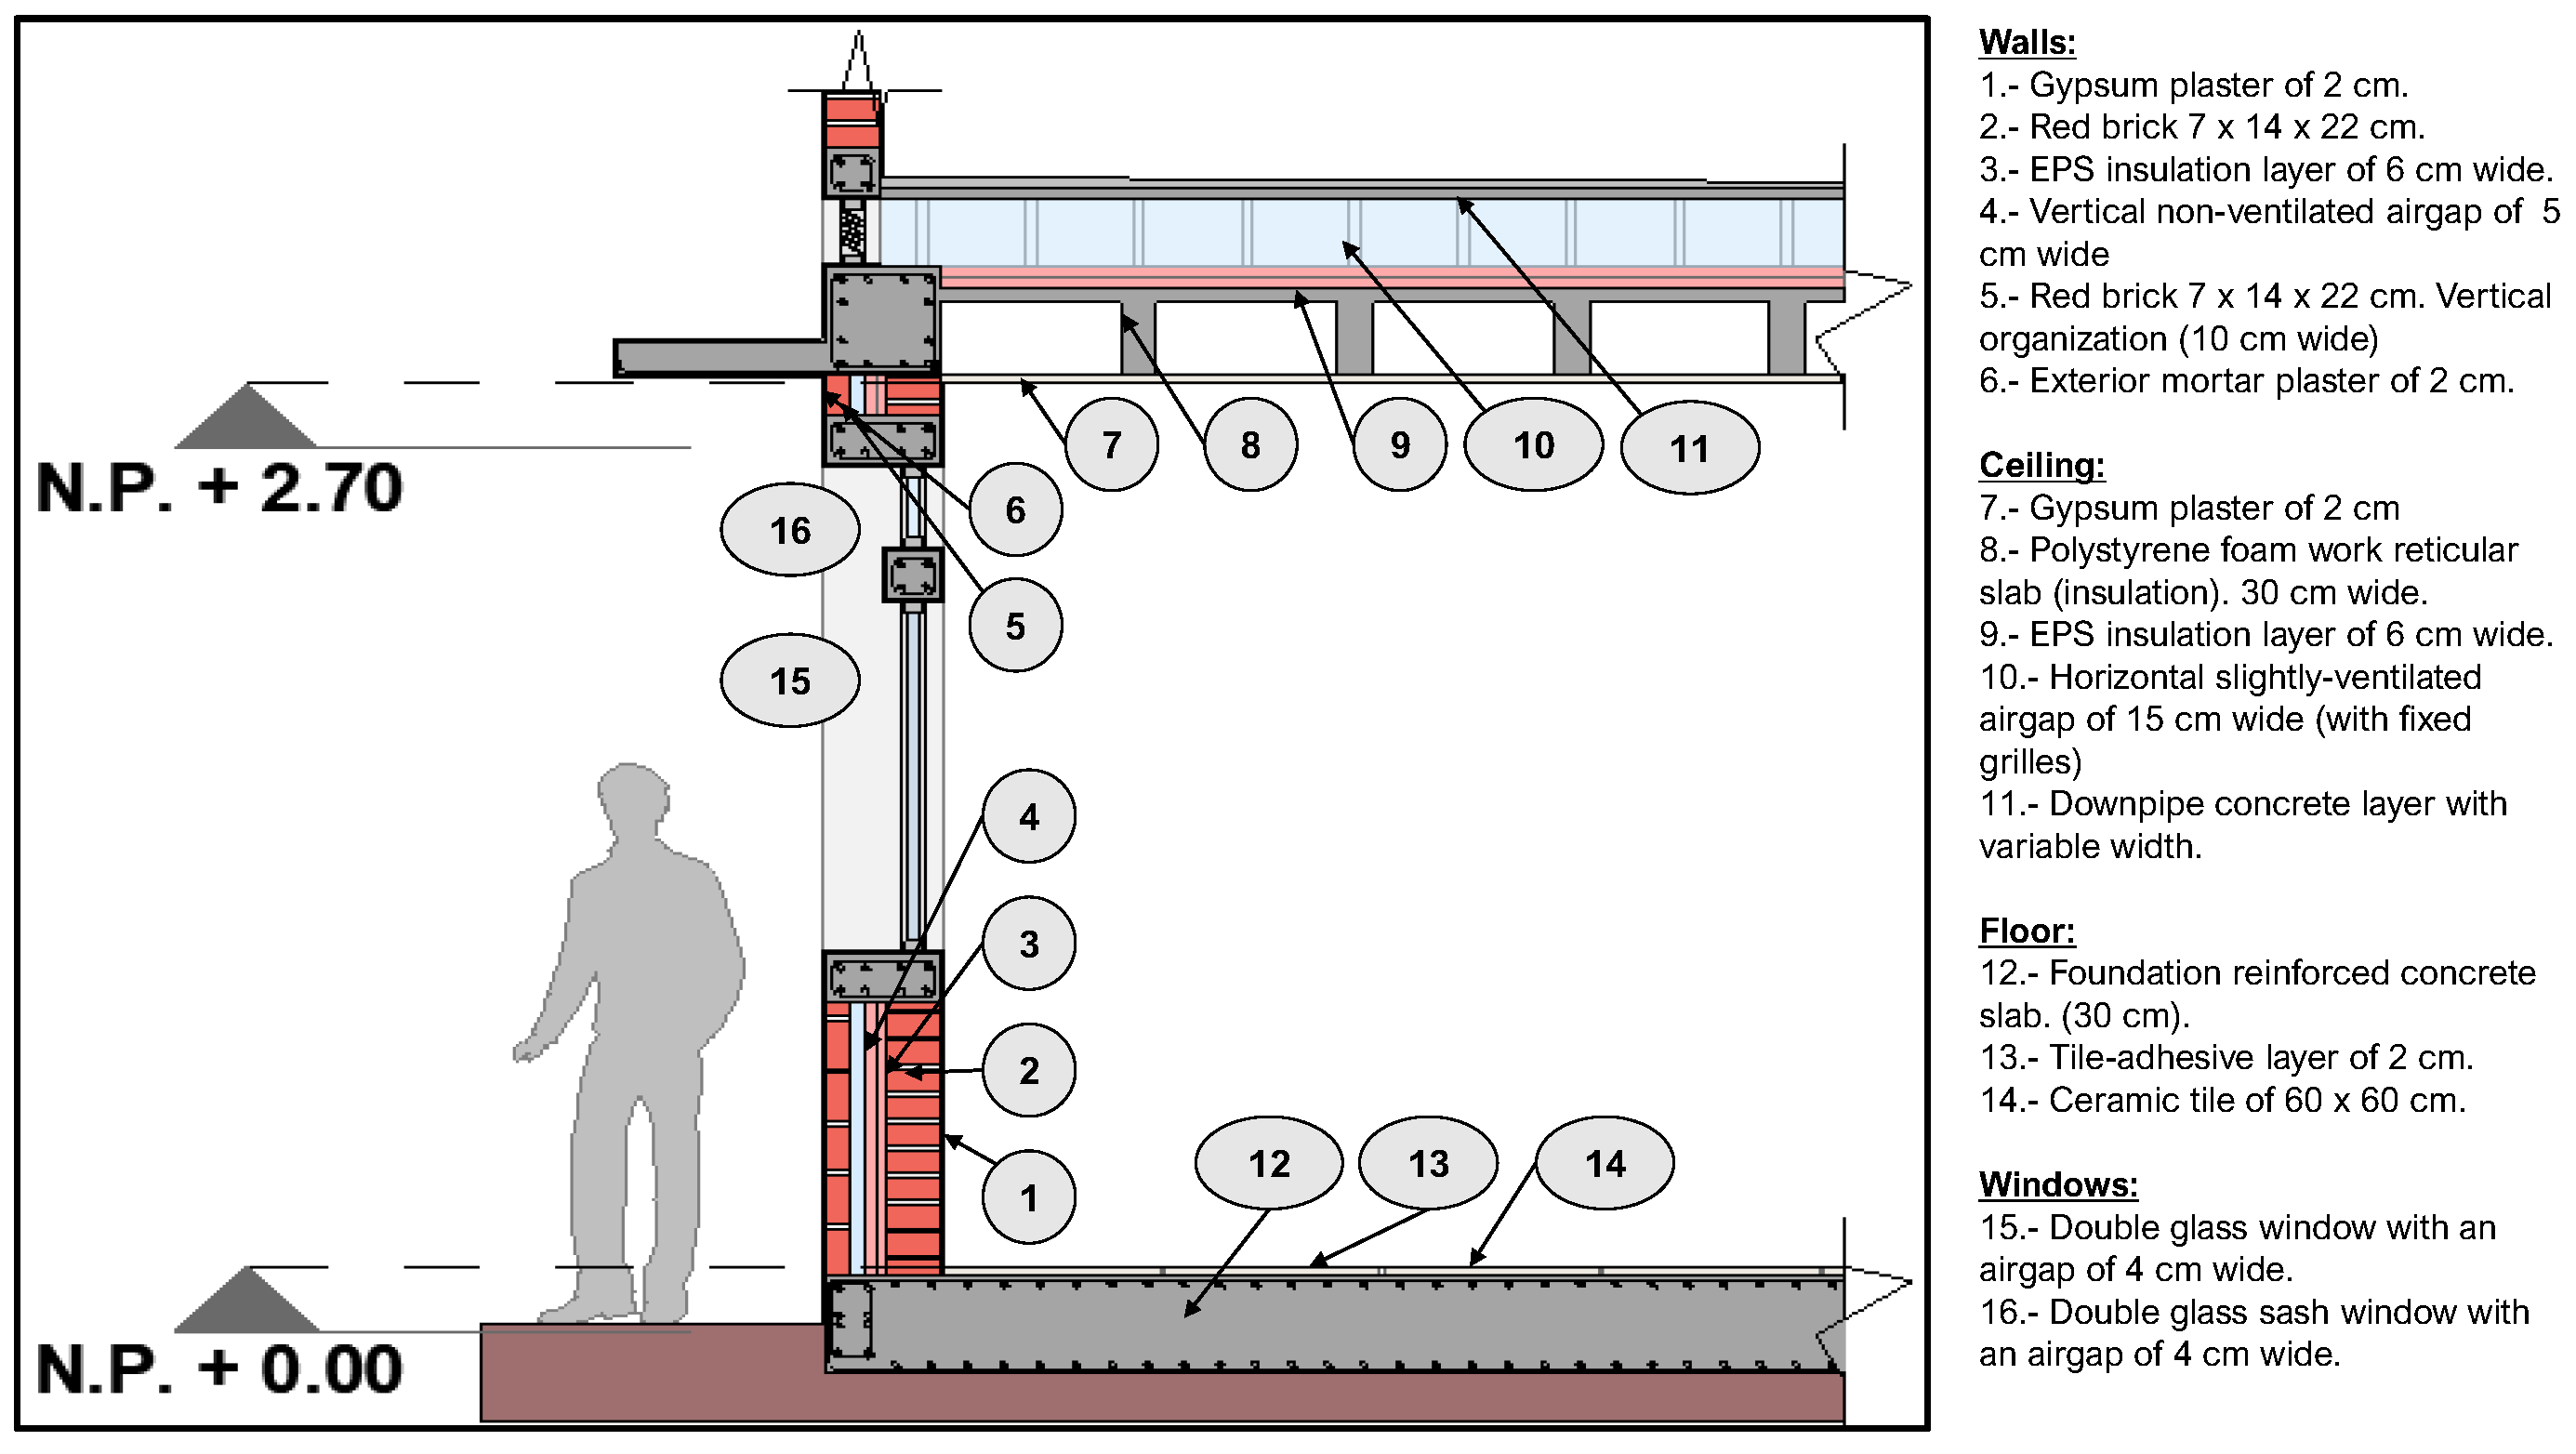
2.6.2. Improved Model: Definition and Test
3. Results
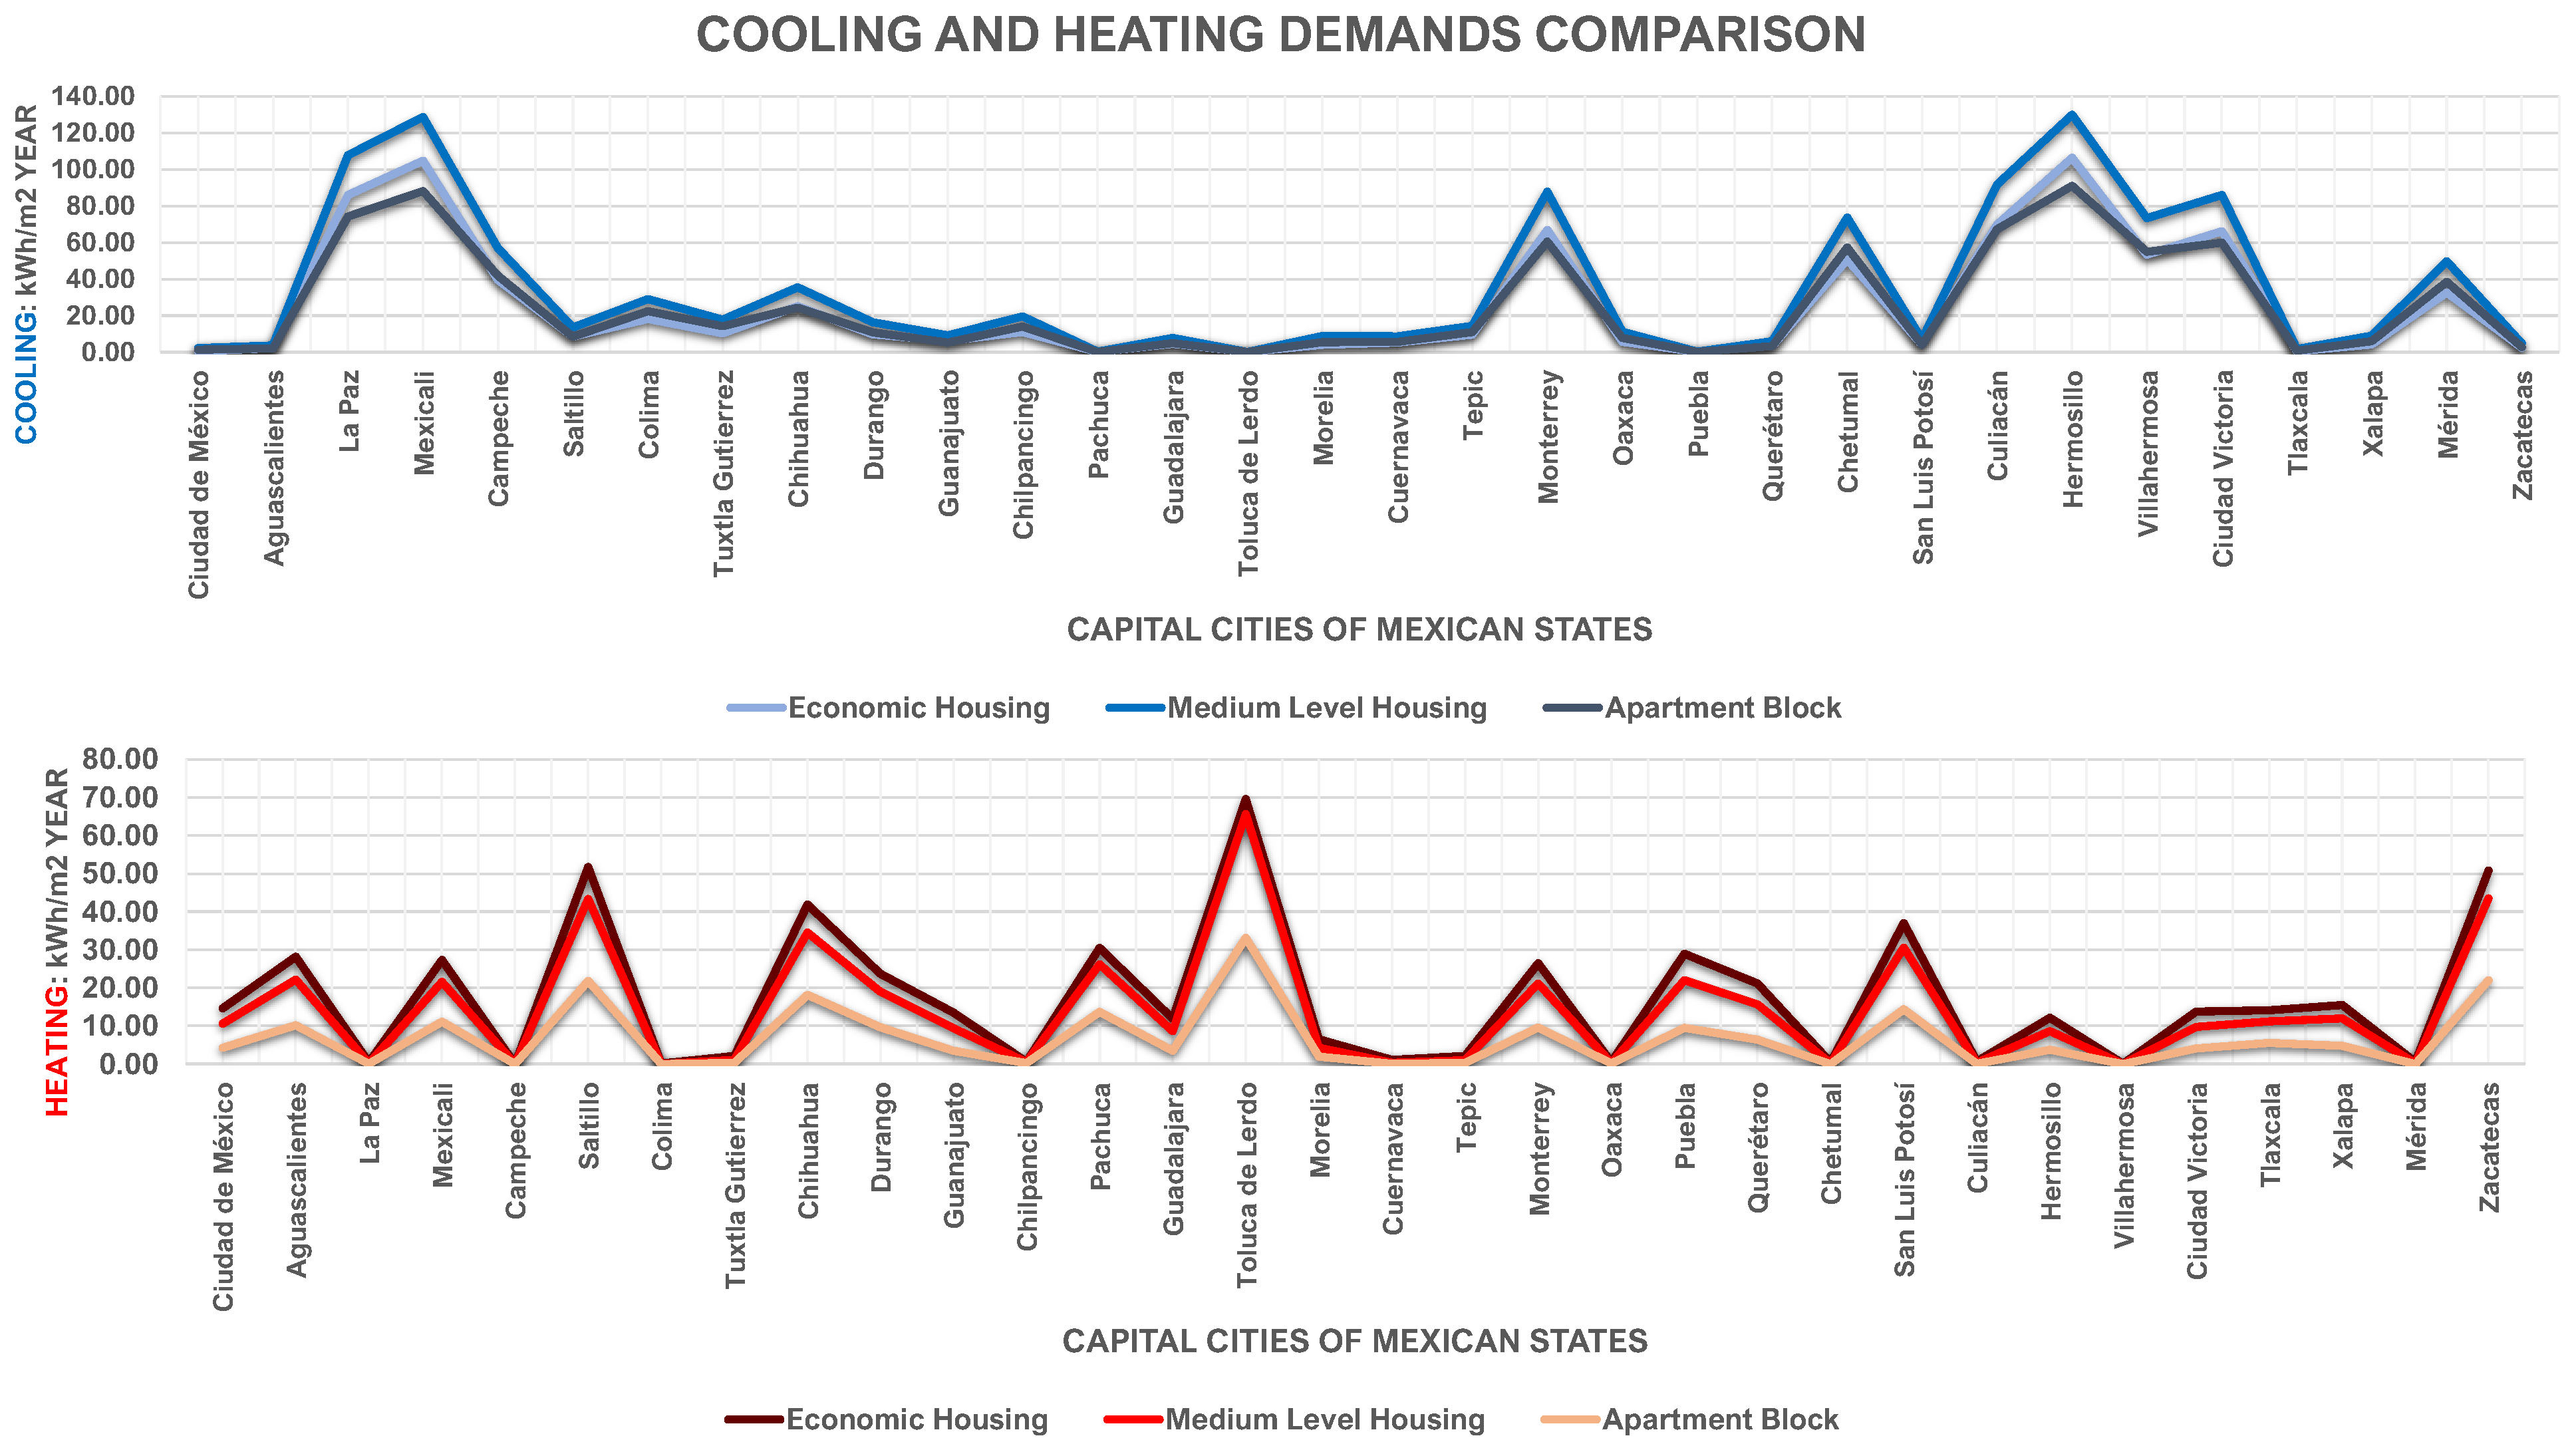
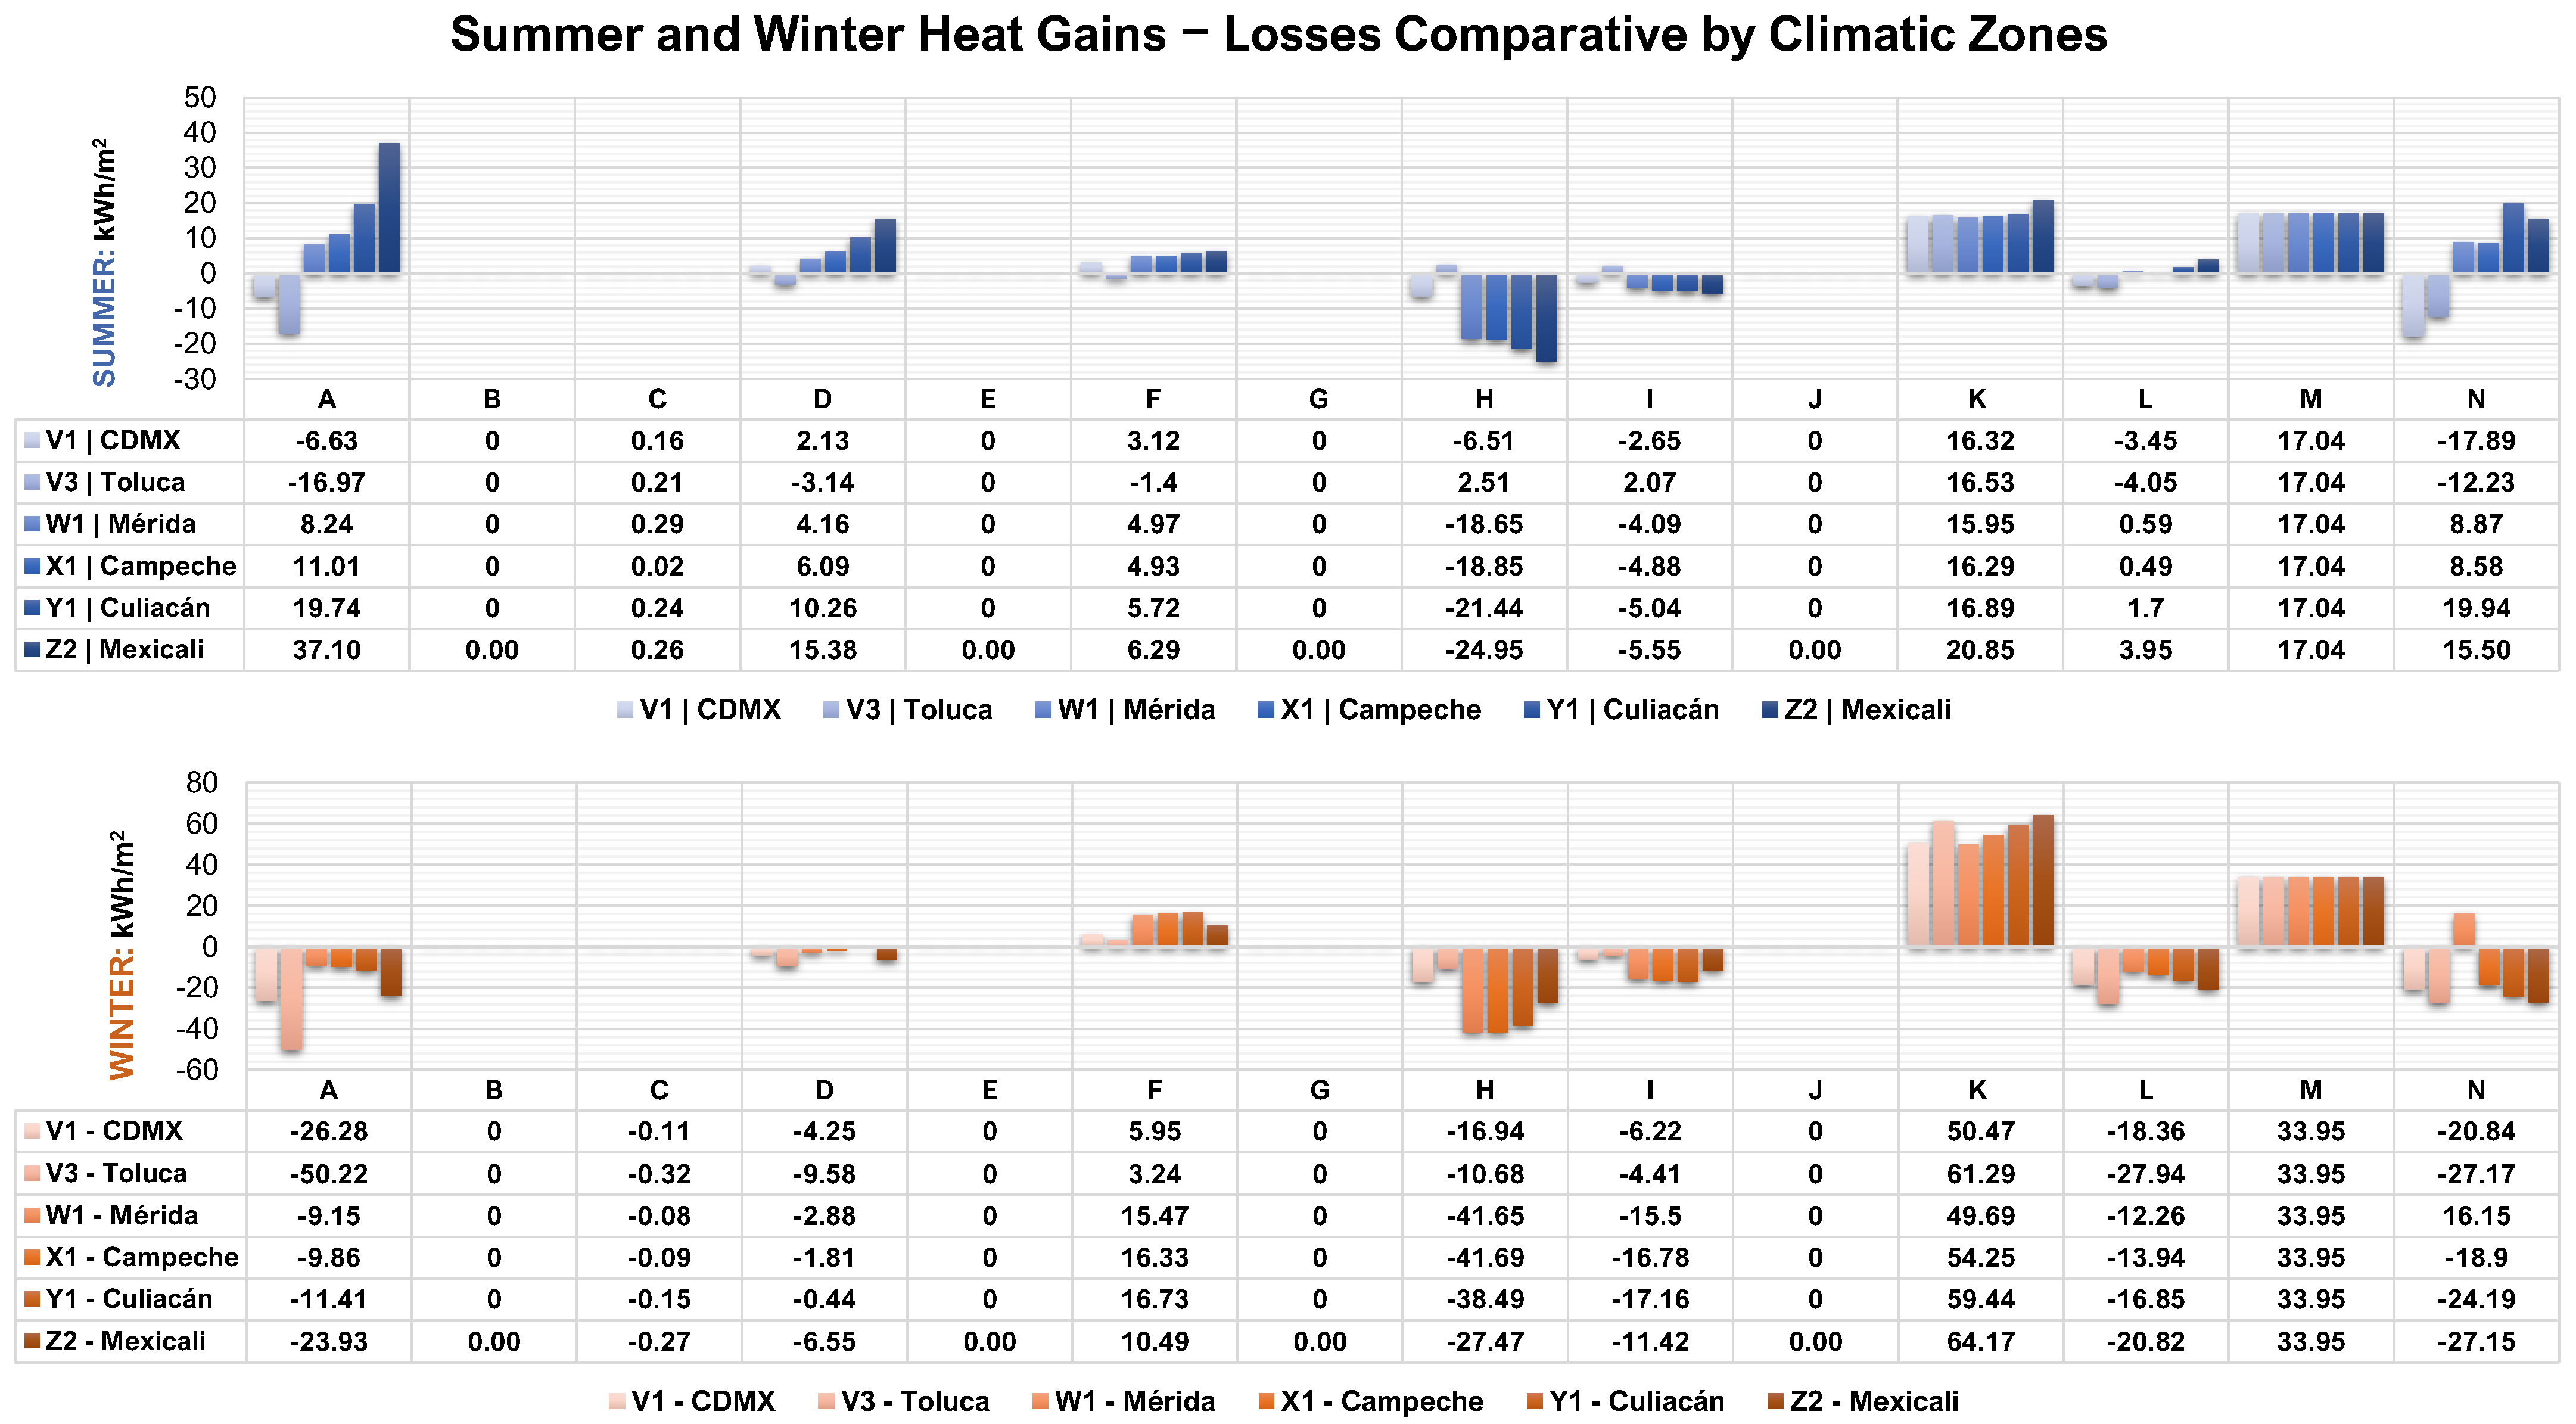
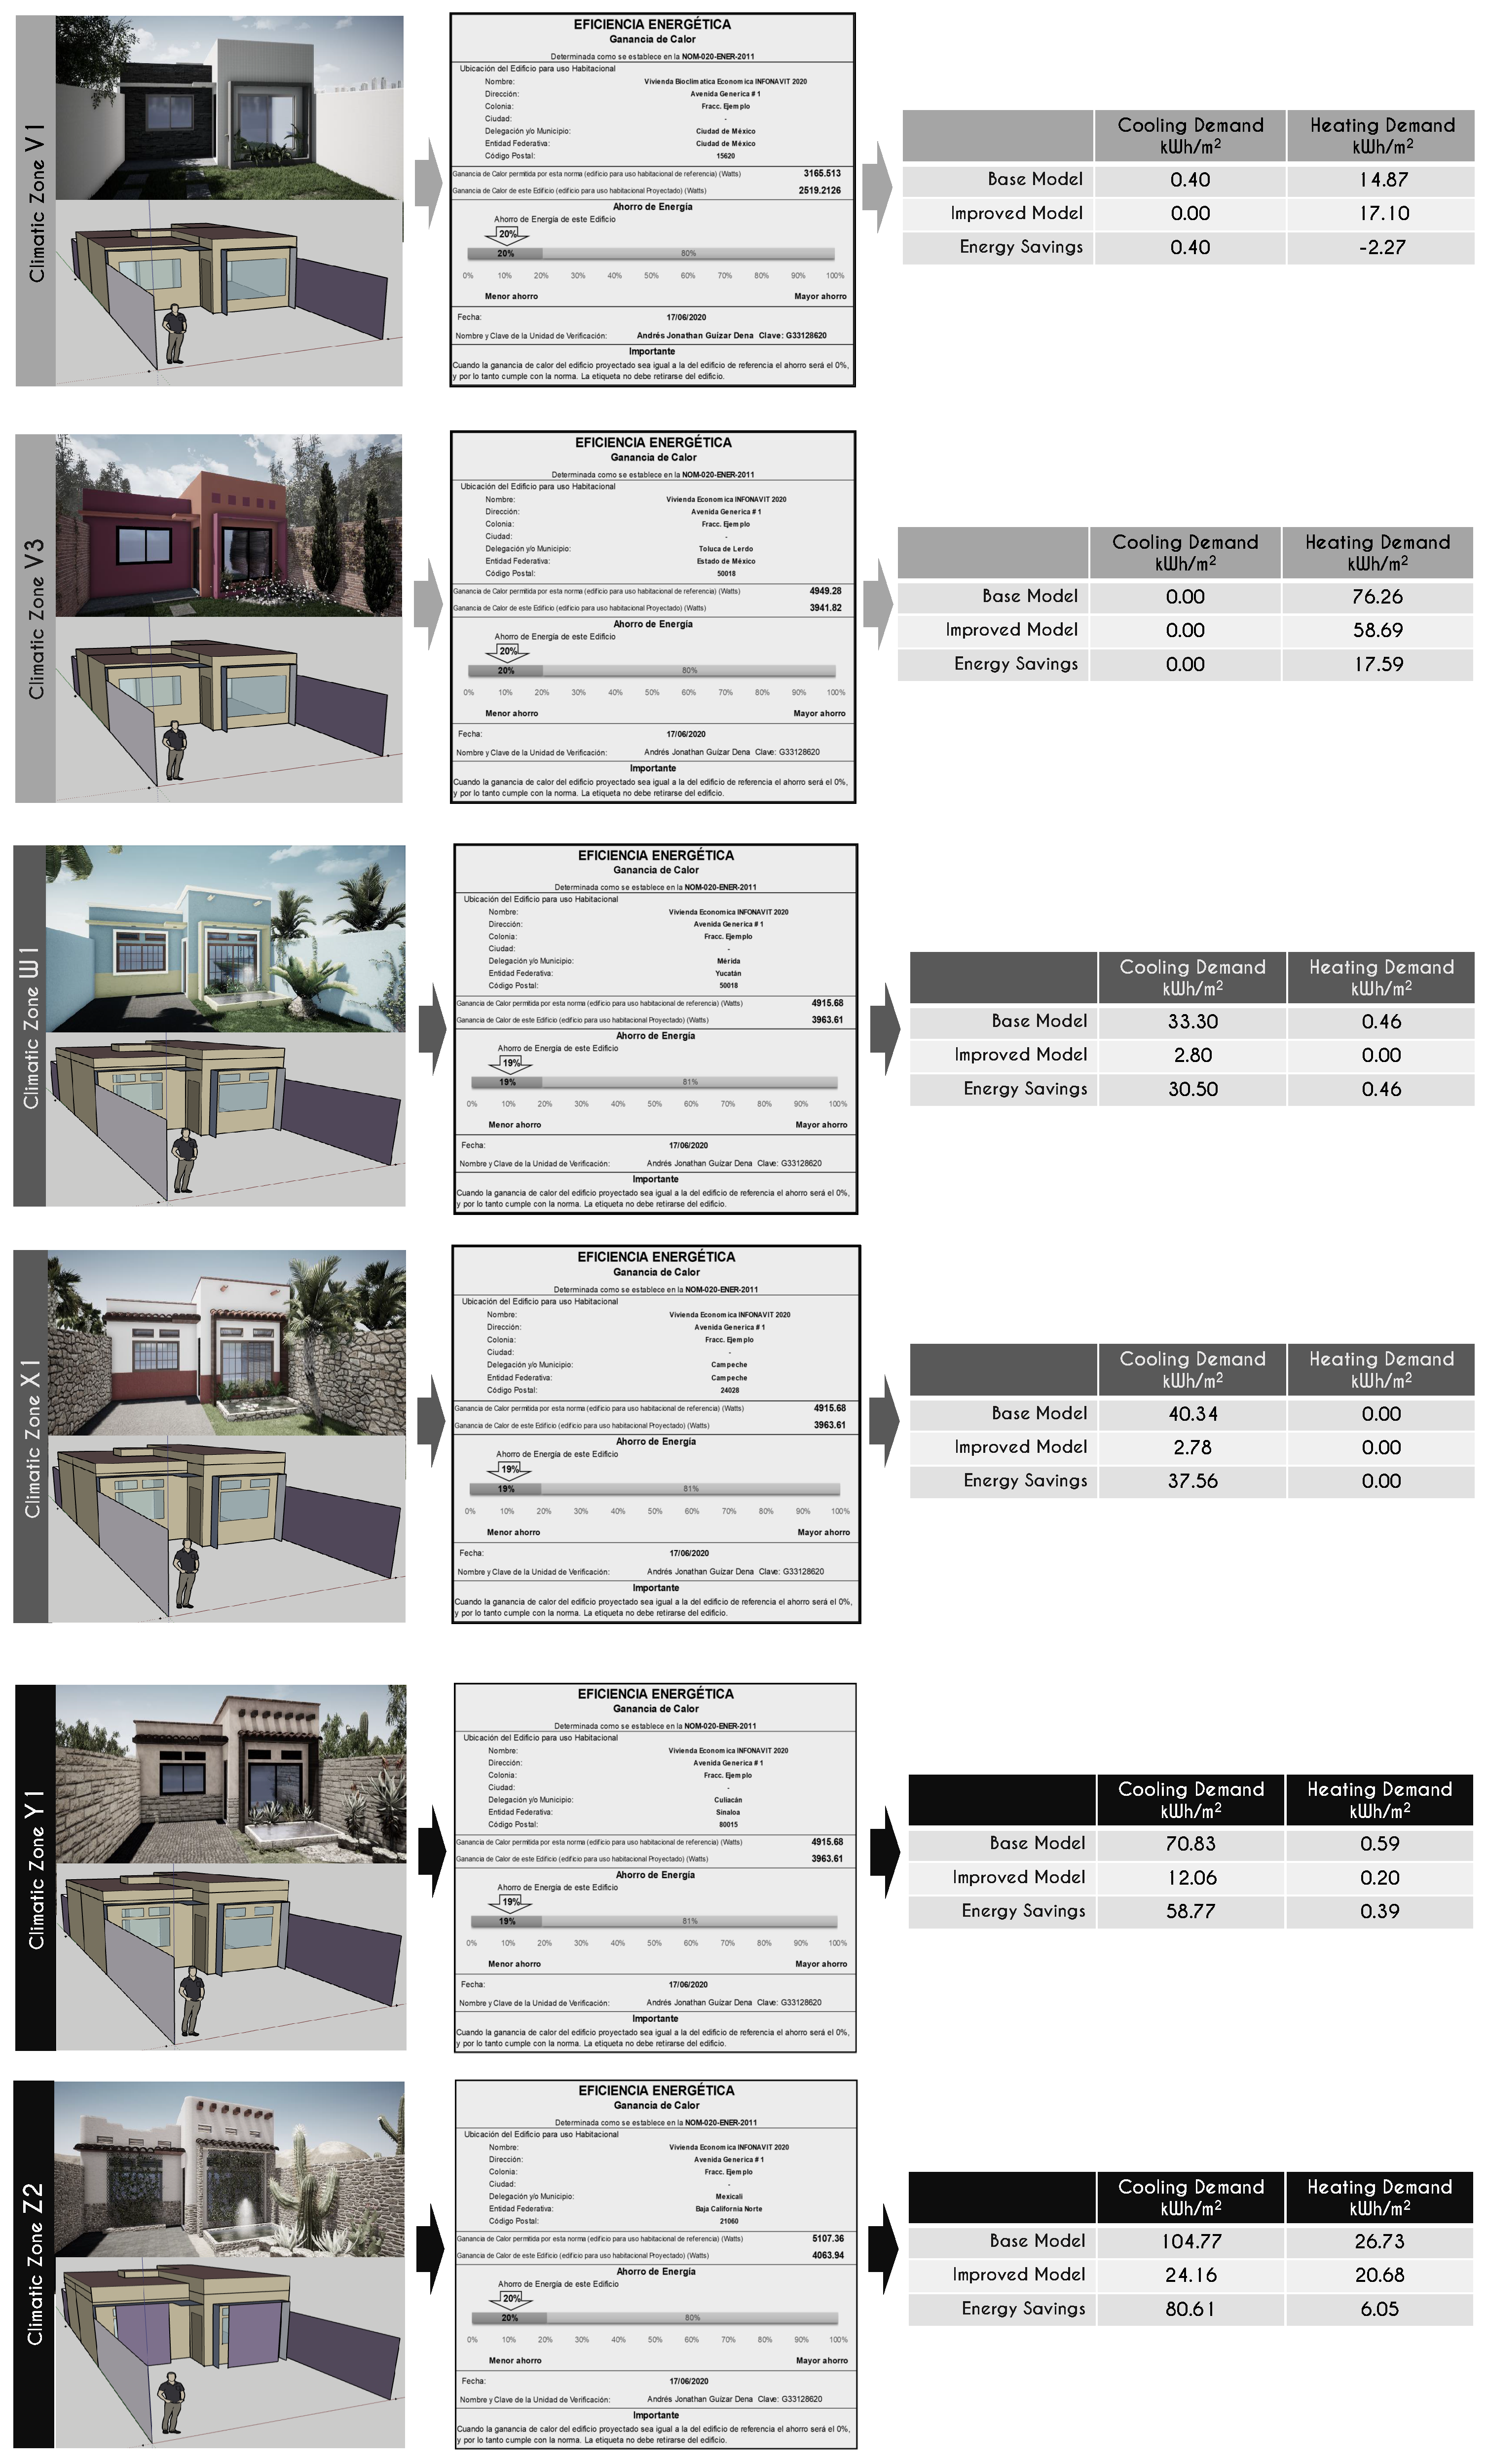
3.1. Testing Results 1: Improved Models for Climatic Zones
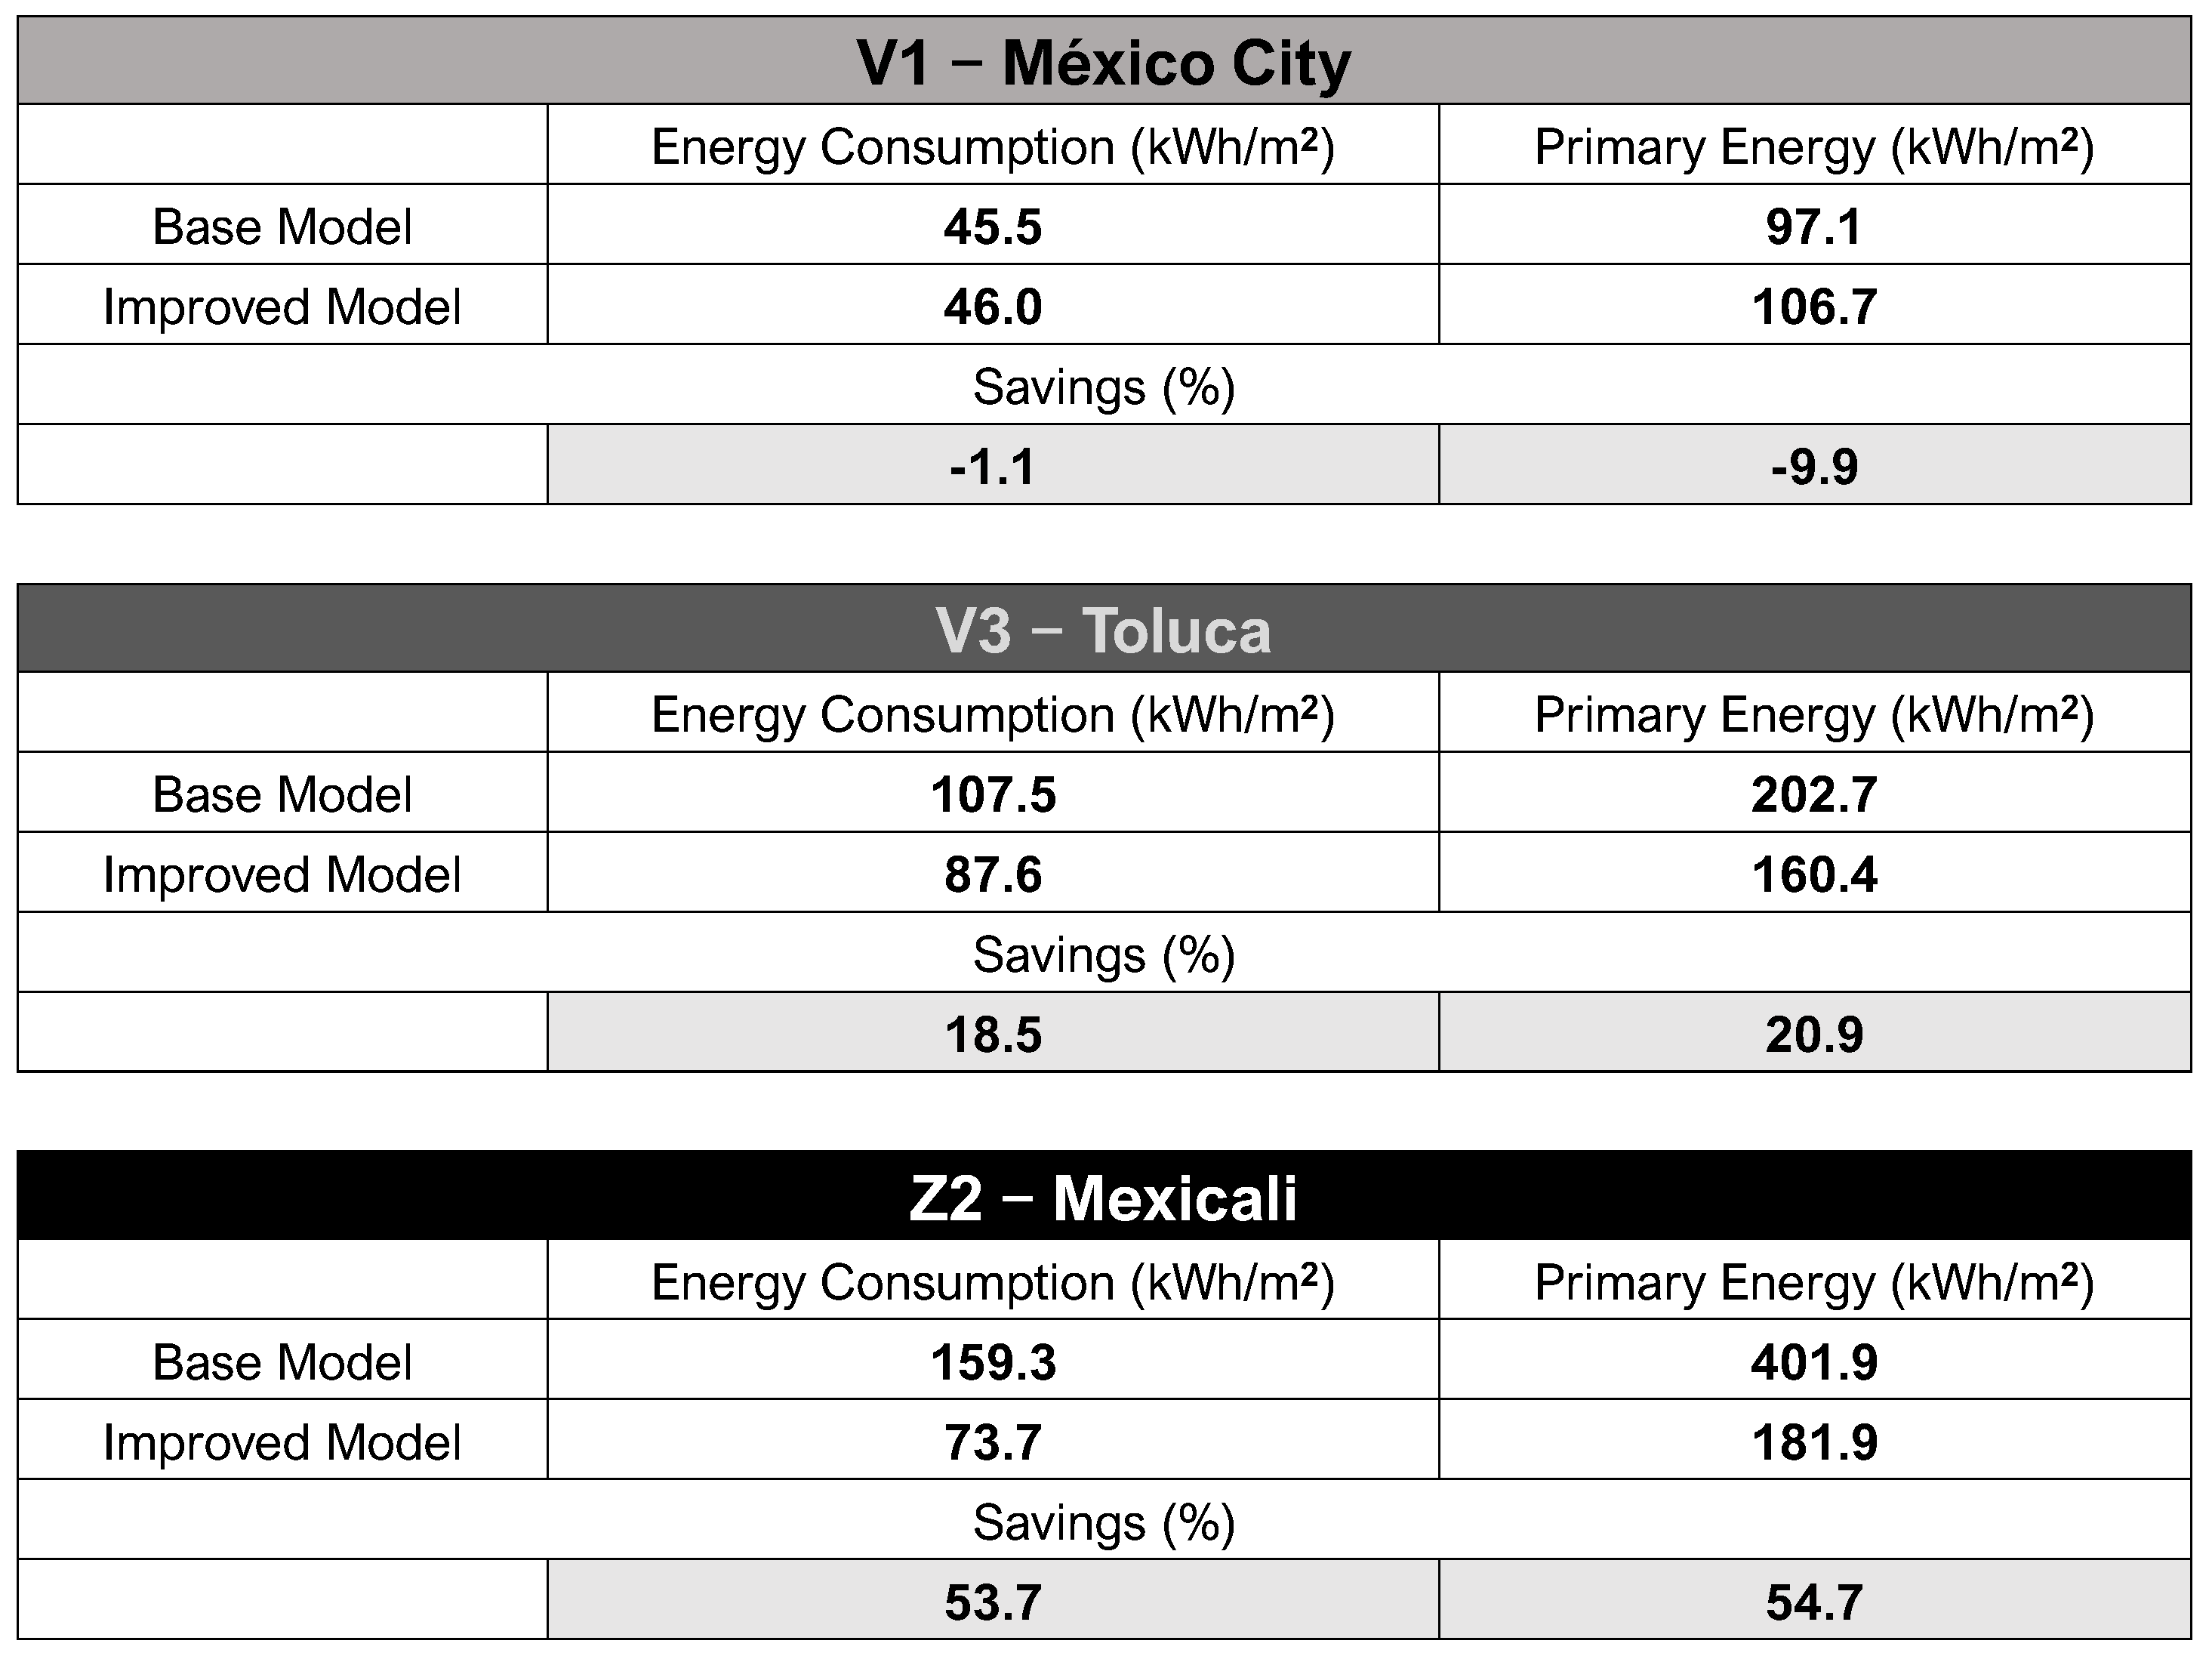
3.2. Testing Results 2: Comparison between Different Construction Systems
4. Discussion
4.1. Benefits of Using Energy Plus vs. Standard Method
4.2. Aims Fulfillment: Why Improved Instead of Optimized?
5. Conclusions
Further Research
- The final development of an SGSAVE version for the Mexican standard and context: At the moment, the complementary script only offers the final verification results, analyzing the heat gains. The SGSAVE Mexican version should include an energy performance verification, including building performance with HVAC ideal loads, detecting the elements that more strongly influence the heat gains report, etc.
- Self-construction energy performance guide: A direct method for conducting the verification in practical use for social benefits is the creation of a self-construction manual with public coverage. This manual should promote the use of vernacular construction systems, and provide the energy performance results for their promotion.
- Economic viability of certified projects: It is important to prove to the market that a certified building meeting the Mexican energy standard is an attractive business, by evaluating possible usable technologies. One of the principal technologies promoted by this guide will be the photovoltaic panel due to the potential the country has for solar energy harvesting. All climatic zones have a high solar energy collection potential (from 1600 to 1900 kWh per year).
Author Contributions
Funding
Institutional Review Board Statement
Informed Consent Statement
Data Availability Statement
Conflicts of Interest
Abbreviations
| ASHRAE | American Society of Heating, Refrigerating and Air-Conditioning Engineers |
| BCL | Building Component Library |
| BEM | Building Energy Model |
| BIM | Building Information Model |
| BMS | Building Management Systems |
| CONAFOR | Comision Nacional de Recursos Forestales |
| CONUEE | Comision Nacional del Uso Eficiente de la Energia |
| CTE | Código Tecnico Español |
| EPS | Expanded Polystyrene |
| EPW | Energy Plus Weather File |
| HP | Heat Pump |
| HVAC | Heating Ventilation and Air Conditioning |
| IEEC | International Energy Conservation Code |
| INEGI | Instituto Nacional de Estadistica y Geografia |
| MPC | Model Predictive Control |
| NZEB | Nearly Zero Energy Building |
| NSGA-II | Non-dominated sorting genetic algorithm II |
| OSB | Oriented Strand Board |
| PM | Project Management |
| PMV | Predicted Mean Vote |
| PV | Photovoltaic |
| PV-T | Photovoltaic–Thermal Module (PV-T) |
| LEED | Leadership in Energy and Environmental Design |
| LCADA | Low Carbon Architecture Danish Agency |
| RES | Renewable Energy Sources |
| ROI | Return on Investment |
| VRF | Variable Refrigerant Flow |
| SC1 | Model without any renewable energy |
| SC2 | Model with the renewable energy consumption but with a fixed set-point of 20 |
| SC3 | Improved model with variable set-points |
| SGSAVE | Saint Gobain Software Avanzado de Verificacion energya (Saint Gobain Advance energy Verification Software) |
Appendix A. Summary of Results


References
- Chávez, V. INFONATIV Tiene 100 mil Viviendas Abandonadas y en Litigio por Falta de Pago. El Financiero. 2017. Available online: https://rebrand.ly/elfinanciero_infonavit100viviendas (accessed on 15 May 2020).
- Griego, D.; Krarti, M.; Hernández-Guerrero, A. Optimization of energy efficiency and thermal comfort measures for residential buildings in Salamanca, Mexico. Energy Build. 2012, 54, 540–549. [Google Scholar] [CrossRef]
- Diario Oficial de la Federación. Norma Oficial Mexicana de Eficiencia Energética en Edificaciones NOM-020-ENER-2011. Mexico. 2011. Available online: https://rebrand.ly/nom020ener2011 (accessed on 15 May 2020).
- Du, H.; Bandera, C.F.; Chen, L. Nowcasting Methods for Optimising Building Performance. 2019. Available online: http://www.ibpsa.org/proceedings/BS2019/BS2019_210777.pdf (accessed on 11 October 2020).
- Fernández Bandera, C.; Pachano, J.; Salom, J.; Peppas, A.; Ramos Ruiz, G. Photovoltaic Plant Optimization to Leverage Electric Self Consumption by Harnessing Building Thermal Mass. Sustainability 2020, 12, 553. [Google Scholar] [CrossRef]
- Lucas Segarra, E.; Du, H.; Ramos Ruiz, G.; Fernández Bandera, C. Methodology for the quantification of the impact of weather forecasts in predictive simulation models. Energies 2019, 12, 1309. [Google Scholar] [CrossRef]
- LCADA. Manual Técnico Para la Aplicacion de la NOM-020-ENER-2015. CONUEE. 2015. Available online: https://rebrand.ly/guiacalculoNOM_020_ENER_2011 (accessed on 5 October 2020).
- Negrete Prieto, R.; Romo Anaya, M. Cuantificando a la clase media en México en la primera década del siglo XXI: Un ejercicio exploratorio. Real. Datos Y Espacio. Rev. Int. Estad. Y Geogr. 2014, 5, 62–95. [Google Scholar]
- Norma Mexicana NMX-AA-164-SCFI-2013: Edificación Sustentable—Criterios y Requerimientos Ambientales Mínimos; SEMARNAP: Mexico, 2013; p. 158. Available online: https://biblioteca.semarnat.gob.mx/janium/Documentos/Ciga/agenda/DOFsr/DO3156.pdf (accessed on 10 October 2020).
- INFONAVIT. Hipoteca Verde. Mexico. 2017. Available online: https://rebrand.ly/INFONAVIThipotecaverde (accessed on 15 May 2020).
- INEGI. ENCEVI 2018: Primera Encuesta Nacional sobre Consumos de Energéticos en Viviendas Particulares. 2019. Available online: https://rebrand.ly/encuestaENCEVI2018 (accessed on 8 May 2020).
- Crawley, D.B.; Lawrie, L.K.; Winkelmann, F.C.; Buhl, W.F.; Huang, Y.J.; Pedersen, C.O.; Strand, R.K.; Liesen, R.J.; Fisher, D.E.; Witte, M.J.; et al. EnergyPlus: Creating a new-generation building energy simulation program. Energy Build. 2001, 33, 319–331. [Google Scholar] [CrossRef]
- ASHRAE. ASHRAE fundamentals handbook. In American Society of Heating Refrigeration and Air-Conditioning Engineers; ASHRAE: Atlanta, GA, USA, 2001. [Google Scholar]
- Segarra, E.L.; Ruiz, G.R.; González, V.G.; Peppas, A.; Bandera, C.F. Impact Assessment for Building Energy Models Using Observed vs. Third-Party Weather Data Sets. Sustainability 2020, 12, 6788. [Google Scholar] [CrossRef]
- Han, J.; Bae, J.; Jang, J.; Baek, J.; Leigh, S.B. The Derivation of Cooling Set-Point Temperature in an HVAC System, Considering Mean Radiant Temperature. Sustainability 2019, 11, 5417. [Google Scholar] [CrossRef]
- Yuan, J.; Emura, K.; Farnham, C. Effects of recent climate change on hourly weather data for HVAC design: A case study of Osaka. Sustainability 2018, 10, 861. [Google Scholar] [CrossRef]
- Zepeda, R.V. Las Regiones Climáticas de México 1.2. 2; Universidad Nacional Autonoma de Mexico: Mexico City, Mexico, 2005; Volume 2. [Google Scholar]
- Liverman, D.M.; O’Brien, K.L. Global warming and climate change in Mexico. Glob. Environ. Chang. 1991, 1, 351–364. [Google Scholar] [CrossRef]
- Bai, L.; Wang, S. Definition of new thermal climate zones for building energy efficiency response to the climate change during the past decades in China. Energy 2019, 170, 709–719. [Google Scholar] [CrossRef]
- Catálogo de Casas INFONATIV. INFONAVIT Web Page. 2020. Available online: https://rebrand.ly/catalogoinfonavit2020 (accessed on 8 May 2020).
- EFINOVATIC: Certificación Energética de Edificios. EFINOVATIC Web Page. 2020. Available online: https://www.efinovatic.es/energyPlus/ (accessed on 15 May 2020).
- Pascual Busain, M.A. SG SAVE Software v.2.8.0.2; EFINOVATIC: Pamplona, Spain, 2019. [Google Scholar]
- Repository of Free Climate Data for Building Performance Simulation. Climate One Building Web Page. 2017. Available online: http://climate.onebuilding.org/ (accessed on 15 May 2020).
- Climate Consultant Software v.6.0.; U.S. Deparment of Energy: Washington, DC, USA, 2016.
- Gavilán Casal, A. Análisis Comparativo de la Eficiencia Energética en Edificios Existentes con Diferentes Herramientas de Simulación Energética. Facultad de Ingenieria Industrial. PhD’s Thesis, Universidad de Valladolid, Valladolid, Spain, 2015. [Google Scholar]
- Forbes. 9 de Cada 10 Mexicanos Quiere Comprar una Casa, 45 no Tiene Recursos. Forbes Economía y Finanzas. 2018. Available online: https://www.forbes.com.mx/9-de-cada-10-mexicanos-quiere-comprar-una-casa-45-no-tiene-recursos/ (accessed on 8 May 2020).
- INEGI. Encuesta Nacional de Ingresos y Gastos de los Hogares 2018: ENIGH. 2019. Available online: https://rebrand.ly/EnighencuestaINEGI (accessed on 8 May 2020).
- Gálligo, P.L. Un Techo Para Vivir: Tecnologías Para Viviendas de Producción Social en América Latina; Univ. Politèc. de Catalunya: Catalunya, Spain, 2005; Volume 1. [Google Scholar]
- Oregon State University. When Is Asbestos Dangerous? Environmental Health and Safety Web Page. 2020. Available online: https://ehs.oregonstate.edu/asb-when (accessed on 28 May 2020).
- García, A.K. 14 Millones de Viviendas en México no Son Dignas. El Economista. 2020. Available online: https://rebrand.ly/economista14mviviendasnodignas (accessed on 28 May 2020).
- National Renewable Energy Laboratory. Openstudio Software v.2.7.0; USA Department of Energy: Washington, DC, USA, 2019.
- EUR-LEX. Council Directive 92:75:EEC of 22 September 1992 on the Indication by Labelling and Standard Product Information of the Consumption of Energy and Other Resources by Household Appliances. 1992. Available online: https://eur-lex.europa.eu/legal-content/EN/ALL/?uri=CELEX%3A31992L0075 (accessed on 20 November 2020).
- Contreras, M. ITOM: Herramienta de Cumplimiento de las NOMs. Youtube Video Platform. 2019. Available online: https://youtu.be/-7GFACJU-wo (accessed on 10 June 2020).
- Bienvenido-Huertas, D. Analysis of the Impact of the Use Profile of HVAC Systems Established by the Spanish Standard to Assess Residential Building Energy Performance. Sustainability 2020, 12, 7153. [Google Scholar] [CrossRef]
- Código Técnico Español: Documento Básico HE—Ahorro de Energía 2019. Secretaria de Estado de Infraestructuras, Transporte y Vivienda. Ministerio de Fomento, Spain. 2019. Available online: https://rebrand.ly/codigotecnicoespanol2019 (accessed on 10 June 2020).
- Gumbarević, S.; Burcar Dunović, I.; Milovanović, B.; Gaši, M. Method for Building Information Modeling Supported Project Control of Nearly Zero-Energy Building Delivery. Energies 2020, 13, 5519. [Google Scholar] [CrossRef]
- Heywood, H. 101 Rules of Thumb for Low Energy Architecture; Routledge: Abingdon-on-Thames, UK, 2019. [Google Scholar]
- CONAFOR. Manual de Auto-Construcción de Vivienda con Madera, Mexico. 2000. Available online: https://rebrand.ly/CONAFORmanualviviendamadera (accessed on 10 June 2020).
- Correa Giraldo, V. El Bahareque, un Sistema Constructivo Sismorresistente y Sustentable Para Soluciones de Vivienda Social en México. Research Gate Web Page. 2014. Available online: https://rebrand.ly/baharequesismoresistente (accessed on 10 June 2020).
- HOME DEPOT Construction Materials Digital Catalogue. Home Depot Web Page. 2020. Available online: https://www.homedepot.com.mx/materiales-de-construccion (accessed on 15 June 2020).
- Turley, C.; Jacoby, M.; Pavlak, G.; Henze, G. Development and Evaluation of Occupancy-Aware HVAC Control for Residential Building Energy Efficiency and Occupant Comfort. Energies 2020, 13, 5396. [Google Scholar] [CrossRef]
- Ahn, J. Improvement of the Performance Balance between Thermal Comfort and Energy Use for a Building Space in the Mid-Spring Season. Sustainability 2020, 12, 9667. [Google Scholar] [CrossRef]
- Zhai, Z.J.; Previtali, J.M. Ancient vernacular architecture: Characteristics categorization and energy performance evaluation. Energy Build. 2010, 42, 357–365. [Google Scholar] [CrossRef]
- Oropeza-Perez, I.; Østergaard, P.A. Energy saving potential of utilizing natural ventilation under warm conditions—A case study of Mexico. Appl. Energy 2014, 130, 20–32. [Google Scholar] [CrossRef]
- Lara, R.A.; Naboni, E.; Pernigotto, G.; Cappelletti, F.; Zhang, Y.; Barzon, F.; Gasparella, A.; Romagnoni, P. Optimization tools for building energy model calibration. Energy Procedia 2017, 111, 1060–1069. [Google Scholar] [CrossRef]
- Soutullo, S.; Giancola, E.; Sánchez, M.N.; Ferrer, J.A.; García, D.; Súarez, M.J.; Prieto, J.I.; Antuña-Yudego, E.; Carús, J.L.; Fernández, M.Á.; et al. Methodology for Quantifying the Energy Saving Potentials Combining Building Retrofitting, Solar Thermal Energy and Geothermal Resources. Energies 2020, 13, 5970. [Google Scholar] [CrossRef]
- Fregonara, E. Methodologies for supporting sustainability in energy and buildings. The contribution of Project Economic Evaluation. Energy Procedia 2017, 111, 2–11. [Google Scholar] [CrossRef]
- Autodesk. About Energy Analysis for Autodesk® Revit®. Autodesk Knowledge Network Webpage. 2017. Available online: https://rebrand.ly/jhg2x (accessed on 15 May 2020).
- García-Alvarado, R.; González, A.; Bustamante, W.; Bobadilla, A.; Muñoz, C. Características relevantes de la simulación energética de viviendas unifamiliares. Inf. Constr. 2014, 66, 005. [Google Scholar] [CrossRef]
- Lolli, N.; Fufa, S.M.; Inman, M. A parametric tool for the assessment of operational energy use, embodied energy and embodied material emissions in building. Energy Procedia 2017, 111, 21–30. [Google Scholar] [CrossRef]
- Mexico, G.B.C. Mexico Green Building Council Webpage: Aims and Projects. 2021. Available online: https://www.gbci.org/mexico (accessed on 20 January 2021).
- Sánchez, C.G. ¿Qué es y Que se Obtiene Con la Edificación Sustentable? CMIC Web Page. 2013. Available online: https://rb.gy/hsqjcw (accessed on 20 January 2021).


| Testing Results for Cooling Demands—Improved Models | |||
|---|---|---|---|
| Climatic Zone | Basic Cooling Demand (kWh/m) | Improved Cooling Demand (kWh/m) | Energy Saving Percentage (%) |
| V1 | 0.40 | 0.00 | 100 |
| V3 | 0.00 | 0.00 | 0 |
| W1 | 33.30 | 2.80 | 91 |
| X1 | 40.34 | 2.78 | 93 |
| Y1 | 70.83 | 12.06 | 83 |
| Z2 | 104.77 | 24.16 | 77 |
| Testing Results Comparison for Heating Demands—Improved Models | |||
| Climatic Zone | Basic Heating Demand (kWh/m) | Improved Heating Demand (kWh/m) | Energy Saving Percentage (%) |
| V1 | 14.87 | 17.10 | –16 |
| V3 | 76.26 | 58.69 | 23 |
| W1 | 0.46 | 0.00 | 100 |
| X1 | 0.00 | 0.00 | 0 |
| Y1 | 0.59 | 0.20 | 66 |
| Z2 | 26.73 | 20.68 | 23 |
Publisher’s Note: MDPI stays neutral with regard to jurisdictional claims in published maps and institutional affiliations. |
© 2021 by the authors. Licensee MDPI, Basel, Switzerland. This article is an open access article distributed under the terms and conditions of the Creative Commons Attribution (CC BY) license (http://creativecommons.org/licenses/by/4.0/).
Share and Cite
Guízar Dena, A.J.; Pascual, M.Á.; Fernández Bandera, C. Building Energy Model for Mexican Energy Standard Verification Using Physics-Based Open Studio SGSAVE Software Simulation. Sustainability 2021, 13, 1521. https://doi.org/10.3390/su13031521
Guízar Dena AJ, Pascual MÁ, Fernández Bandera C. Building Energy Model for Mexican Energy Standard Verification Using Physics-Based Open Studio SGSAVE Software Simulation. Sustainability. 2021; 13(3):1521. https://doi.org/10.3390/su13031521
Chicago/Turabian StyleGuízar Dena, Andrés Jonathan, Miguel Ángel Pascual, and Carlos Fernández Bandera. 2021. "Building Energy Model for Mexican Energy Standard Verification Using Physics-Based Open Studio SGSAVE Software Simulation" Sustainability 13, no. 3: 1521. https://doi.org/10.3390/su13031521
APA StyleGuízar Dena, A. J., Pascual, M. Á., & Fernández Bandera, C. (2021). Building Energy Model for Mexican Energy Standard Verification Using Physics-Based Open Studio SGSAVE Software Simulation. Sustainability, 13(3), 1521. https://doi.org/10.3390/su13031521