
Manufacturer’s Sharing Servitization Transformation and Product Pricing Strategy


1
School of Economics and Management, Shanghai Maritime University, Shanghai 201306, China
2
China Institute of FTZ Supply Chain, Shanghai Maritime University, Shanghai 201306, China
*
Author to whom correspondence should be addressed.
Sustainability 2021, 13(3), 1503; https://doi.org/10.3390/su13031503
Submission received: 16 November 2020
/
Revised: 12 January 2021
/
Accepted: 20 January 2021
/
Published: 1 February 2021
(This article belongs to the Special Issue Sharing for Caring: On the Role of Collaborative Economy in the Sustainable Development Goals (SDGs))
Abstract
:The sharing market includes the idle product sharing by the owner and the firm’s new product sharing. Companies participating in the sharing economy choose to withdraw from the market because it is always difficult to make a profit, due to heavy asset investment, but there is no such worry for owners who do not need cost input. At the same time, we have observed that the sharing products launched by companies are difficult to meet the rental needs of consumers. Based on the above findings, we have constructed a model where there is a market where a monopolistic manufacturer sells and rents out at the same time, and owners who purchased new products can choose to rent out products when they are idle. Because of the uncoordinated supply and demand matching of the sharing market and the excessively high unit cost input, our research found that: (1) the barriers for the manufacturer to enter the sharing market are always high—for example, the manufacturer will choose to enter the sharing market only when consumers have a high rate of availability of sharing products. Only when the cost of products in the sharing market is not low will the manufacturer choose to provide sharing services; (2) the competition between the two products in the sharing market weakens the demand cannibalize in the sales market; (3) the manufacturer enters the sharing market to promote the owner’s income. The owner’s earnings will increase with the rising of sharing products’ availability.
1. Introduction
With the development of information technology and policy support, the sharing economy has achieved sound results over the last few years. According to the PwC (Price Waterhouse Coopers Consulting), five key sharing sectors—travel, car-sharing, finance, staffing, music, and video streaming—have the potential to increase global revenues to around $335 billion by 2025 [1]. Take an example, more than 19% of consumers are involved in sharing in the automotive and transport industry [2]. The boom of the sharing economy has attracted many firms to enter the sharing market. In addition, the huge demand in the sharing market is also an important reason for attracting many companies to join the sharing market. Several carmakers, such as Mercedes-Benz, General Motors, BMW, and Tesla, have introduced a sharing program to increase market share [3]. In China, GoFun, a car-sharing app launched by Shouqi Group, has increased from 1.53 million to 2.13 million during the past year in terms of monthly user activity. According to iiMedia Research, China’s car-sharing market reached ¥5.43 billion in 2019 [4].
Although consumers’ demands and firms’ willingness to participate in sharing are very strong, these manufacturers are retreating from the sharing market. For example, German carmaker Daimler has pulled its car-sharing program (Car2Go) out of China as of 30 June 2019 [5], and ceased operations in London, Brussels, Florence, and North American up to 29 February 2020 [6]. Maven, GM’s sharing travel brand, announced its withdrawal from eight cities, including Chicago, New York, and Boston, on 15 April 2020 [7]. Furthermore, the COVID-19 pandemic has accelerated this trend [8,9]. Due to its intensive asset investment and difficulty to profit in the short term, the car-sharing business has suffered from development restrictions, which is attributable to the following three reasons. The first is the absence of necessary investment and product type. For instance, Daimler only offered some 800 vehicles, basically two-seat smart cars, in Chongqing in China. The second is the rising operation costs, including the fixed costs of production, platform construction, product depreciation, technology upgrade, maintenance, and insurance for the customers’ safety. Sharenow stated in a statement that the service in North America was suspended, due to the lack of stability in the global travel pattern and the high operating costs in North America. Third, it is unable to continue operations in a sustainable manner for product sharing owing to low adoption rates. Although Car2go has only launched 800 vehicles in Chongqing, it has more than 250,000 registered users. Motivated by the above realities and difficulties of the manufacturer’s entering the sharing market, this paper aims to study the product competition between the sales market and the sharing market. In the sharing market, there exists competition between the manufacturer and owner for the sharing products. We develop a game-theoretic model with two markets and three kinds of products. A monopoly manufacturer sells a new product in the sales market. Then, the manufacturer considers to provide a sharing service and meet the consumers’ usage needs in the sharing market. Meanwhile, there exists an idle product provided by an owner in the sharing market. The sharing products’ demand is affected by the consumer’s sharing preference and the availability rate of the sharing product. To meet this demand, the manufacturer launches a certain number of sharing products. The launching size determines the availability of sharing products and affects the manufacturer’s cost investment in entering the sharing market. The purpose of the present research is to study which factors restrict manufacturers from entering the sharing market. In particular, we posed the following research questions. (i) What is the barrier for the manufacturer to enter the sharing market? Or why are these manufacturers exiting the sharing market? (ii) Then, how does the manufacturer’s sharing service affect the competition between the sales market and the sharing market? (iii) How does the manufacturer’s entering the sharing market affect the operation strategies of the manufacturer and the owner? To answer these questions, we develop a simple model in which there exists a sales market with an owner purchasing a new product from a monopoly manufacturer and a sharing market with consumers renting an idle product from the owner or the product from the manufacturer. The manufacturer decides whether to provide a rental service and the launching size of sharing products. The owner decides whether or not to rent out the idle product that they previously purchased from the manufacturer. Consumers make a purchase or rent decision according to the net utility of different products/services. And their decisions affect the manufacturer’s price, demand, and profit. We derived the equilibrium outcome of the manufacturer’s and consumer’s decisions for two scenarios: Without and with manufacturer’s product sharing.
Our analysis has generated several insights. It is found that the entry barrier for the manufacturer’s product sharing is high. The manufacturer can enter the sharing market if consumers’ rental demands are easily met. In other words, as long as the manufacturer launches a certain scale of sharing products to meet consumers’ rental demand, it can enter the sharing market. Otherwise, the manufacturer’s demand for product sharing will be negative. Once the manufacturer enters the sharing market, it can increase the market demands and the manufacturer’s profits. Under providing sharing services, the manufacturer’s profit is affected by the production cost rather than the operation cost and the availability of the sharing product. Another finding is that the high availability of sharing products makes the sharing market seriously cannibalize the sales market. Once the manufacturer enters the sharing market, the competition between two products in the sharing market weakens the cannibalization of the sales market. The owner’s earnings will increase with the rising of sharing products’ availability. Finally, we simulated the special scenario for the COVID-19 period. The rest of this paper is organized as follows. We review the related literature in Section 2. Section 3 introduces our assumptions and explains the decision model. Section 4 analyzes the manufacturer’s and consumer’s decisions for two scenarios, without and with manufacturer’s product sharing. Finally, Section 5 summarizes conclusions and provides directions for future research. All proofs of the results are provided in the Appendix A and Appendix B.
2. Literature Review
Extant research on the sharing economy has been conducted by scholars in recent years [10,11,12,13]. According to Ranjbari et al. [14], the sharing economy was an economic system, whose intermediary companies utilized online platforms to facilitate and lower the cost of the for-profit transactions of giving temporary access—without the transfer of ownership—to idle resources of consumers in the peer-to-peer networks that it had created, because of the trust built among its members, who might be individuals or businesses [15,16]. Besides idle resource sharing, we also considered new product sharing as a kind of sharing economy, the sharing of new products shows consumers the functions of the products and provides services in exchange for profit. Therefore, the sharing economy was broadly divided into two categories in this research. One is C2C (consumer to consumer) or P2P (peer to peer) sharing, such as Uber, Airbnb, Lyft, etc. The other is B2C (business to consumer) sharing, like Car2go, Hellobike, etc.
First, from the perspective of C2C or P2P sharing, scholars considered that the sharing economy was a typical disruptive innovation and often cheaper than those of the traditional industries [17,18,19]. Related research mainly elaborated on the impact of idle product sharing on traditional industries or consumers. Fraiberger and Sundararajan analyzed data from both secondary markets and P2P car-sharing markets and found that the sharing economy improved consumer welfare [20]. Fradkin used the setting of Airbnb to investigate the rental price in the sharing market and the role of search engine design in reducing the transaction costs and improving market matching efficiency [21]. Benjaafa et al. developed an equilibrium model of peer-to-peer product sharing and found that consumers benefited from sharing, with individuals who, in the absence of sharing, were indifferent between owning and not owning, benefitting the most [22]. Abhishek et al. analyzed the interaction of a P2P sharing market and a manufacturer. The analysis highlighted the important role of consumer heterogeneity in usage rates in determining to sell or rent out products that would be preferred by the manufacturer and show that the firm is never better off with P2P when usage rates in the market are too low [23]. However, this study only considered idle products’ consumer heterogeneity. Different from them, we analyzed the consumer heterogeneity of both idle product sharing and new product sharing.
Although these aforementioned studies discuss how the sharing economy affects the traditional industries, scholars have begun to study the impact of the sharing economy on the manufacturer. Then, from the perspective of B2C sharing, some authors have focused on new product sharing [24,25,26,27,28,29]. Compared with idle products, new product sharing involved the manufacturer and the consumer. The manufacturer had to invest more operation costs and could not profit in a short time. The manufacturer would take a series of measures to adjust their operating strategies in response to the changes brought about by the sharing market. Therefore, the authors analyzed the impacts of product sharing with the traditional manufacturer [24,25,26], and whether the manufacturer entered the sharing market [27,28]. For instance, Nishino et al. studied the influence of consumers’ willingness to use on the type of research and the development of sharing products by the manufacturer. It showed that consumers presented the inclination of sharing products actively. The manufacturer should choose a high R&D level to lengthen product durability and set a high price so that the manufacturer could deal with sharing services [30]. Ke et al. studied the comparative analysis of sharing channels and sales channels for an automobile manufacturer. They found that the production cost was sufficiently high, and the introduction of the sharing model would make both sales and sharing markets profitable [27]. Tian and Jiang [25], and Weber [31] showed that manufacturer benefited from high-cost products in the idle product sharing market rather than low-cost products. Based on Tian and Jiang [25], Liu et al. analyzed the effects of the sharing economy on sequential innovation products and revealed that the sharing market increased or decreased the manufacturer’s profit, and this was mainly determined by the moral hazard cost and the salvage value of sharing products [26]. Schmidt exploited a difference-in-difference methodology and obtained that car manufacturer’s participation in the sharing economy would reduce new car sales [32]. Next, the manufacturer adjusted its operation strategies to respond to the sharing economy [3,29]. Li et al. studied the profit maximization factors that the manufacturer chose to cooperate with different platforms. The analysis of this paper showed that the value perception factor was higher or the marginal cost was lower, the manufacturer should choose to cooperate with the B2C platform. If the value perception factor was in the middle range and the marginal cost was higher, the manufacturer should choose the P2P platform. If the value perception factor was low and the marginal cost was high, the manufacturer should not cooperate with any sharing platform. At the same time, the manufacturer coordinated supply-demand matching through the homogeneity of consumer usage [33]. The difference was that our research considered the impact of consumer heterogeneity on the manufacturer’s sharing services and focused on coordinating the supply-demand matching of the sharing market via the availability of sharing products. However, product launching strategy is another important agenda for the manufacturer’s product sharing. Chardon et al. considered that increasing system size did not increase the performance of bike-sharing systems [34]. This means that the system size of sharing products is not as more as possible. In contrast, Kabra et al. estimated the impact of two facets of product launching (accessibility and availability) on bike-sharing ridership [35]. They found that an increase in bike availability can increase bike-sharing system use. Bellos et al. characterized that the carmaker could benefit from providing car-sharing, identified the product type that benefits the most, and determined how car-sharing affects the manufacturer’s product line design [34]. They determined that the launching size of car-sharing was related to the availability of sharing products and customer demand in the sharing market. These studies have provided insights into the model construction of product launching strategy in this research.
Our research is different from previous studies and focuses on the manufacturer’s entry barrier in the sharing market and competition between two markets by combining the sharing products’ availability, the consumer’s sharing preference, and operation costs of sharing products. Furthermore, this research studies the manufacturer’s sales strategies and customers’ behavior. Our research is most related to Jiang et al. [29] and Bellos et al. [36]. They both considered the manufacturer’s pricing decision when choosing a business model, and discussed the relationship between the manufacturer’s sales/sharing strategies and the marginal/transaction costs in the context of the sharing economy. However, different from Jiang et al. [29], we accurately simulated the manufacturer’s launching size of sharing products via the availability and considered supply-demand matching in the sharing market. Then, we focused on the competition between the sharing market and the sales market. We analyzed the impact of sharing products’ availability on the manufacturer’s launching size and market demand in the sharing market. This is also different from Bellos et al. [36].
3. Model
3.1. Assumptions
Before presenting our model, we first discuss key assumptions specific to our product sharing environment. We refer to the firm that produces a new product as the manufacturer and the consumer that rent out an idle product that was purchased and used by her as the owner.
Assumption 1.
The manufacturer considers selling the product priority.
We suppose that a monopoly manufacturer launches a new product at a constant production cost c and sells it at price pB. Considering the manufacturer’s entering the sharing market, we assume that the manufacturer only rents out the new products via the B2C product-sharing platform. Since new product sharing can serve as a form of marketing, promoting the product by allowing the consumer to experience it before making the large purchase is necessary to acquire something [3,36]. For the new product sharing, the manufacturer rents it out to consumers at a rental cost α + g and price p1 (p1 < pB). α represents the moral hazard cost and the hassle cost of delivering and picking up the sharing product [24]. The moral hazard cost refers to some extra cost resulted from a lessor’s concern about damage to a sharing product, due to unobservable actions by a renter [37]. g represents the operation costs, including the sharing product’s maintenance cost and the B2C platform’s management cost during the sharing process.
Assumption 2.
The owner may rent out idle products when their profit not negative.
When owners’ purchased products are lying idle, they might consider renting them out or not. During a period of low self-use value, the owner can earn a rental fee by renting out her idle product through a C2C product-sharing platform, forgoing her self-use of the product [23]. For the idle product, the owner rents it out at a rental cost β and price p2 (p2 < pB). β represents the owner’s transaction cost, including moral hazard cost, platform fee, and the hassle cost of delivering and picking up the product [38,39,40,41,42].
Assumption 3.
Consumer’s valuation is heterogeneous and uniformly distributed in the interval [0, 1].
Without loss of generality, we normalize the total number of consumers to one. We assume that the ith consumer’s valuation is distributed uniformly in the interval [0, 1], i.e., vi~U [0, 1]. We assume that the consumer’s preference for the sharing product is η (η > 0). η refers to the probability that consumers will not purchase, but have needs for using it. Thereinto, the consumer’s preference for manufacturer’s sharing product is denoted η1 and for owner is denoted η2. We assume that the availability rate of the sharing product is φ∈[0, 1]. φ represents the probability that consumers will be able to rent a sharing product in the sharing market to meet their demands when they need to use it [36]. At the same time, the manufacturer can adjust the matching degree of supply and demand in the sharing market according to consumers’ demand. There are two special cases here, too. If φ = 0, consumers have no product to rent, and therefore, sharing does not occur. If φ = 1, consumers can rent sharing products at any time.
3.2. Consumers’ Purchasing/Renting Decisions
In the sales market, there are new products sold by the manufacturer. Besides, there are new products and idle products in the sharing market. A consumer can either buy a new product from the manufacturer or rent a sharing product from the owner instead of buying and owning the product herself. When the consumer purchases the new product in the sales market, she not only obtains the product’s ownership, but also earns the expected income of renting the product out in the sharing market once it is idle. When the consumer rents the product in the sharing market, she just obtains the product’s right to use. We consider a consumer utility model where the net utility is assumed to be of the form uij (j∈{B, 1, 2}). The net utility is related to the consumer’s valuation and the product’s price. Therefore, the consumers’ net utility is as follows.
(1) Purchase the new product.
where the owner’s expected income is .
(2) Rent the new product from the manufacturer.
(3) Share the idle product from the owner.
(4) Do not purchase or rent any product, and the consumer’s net utility is zero.
As a consequence, the manufacturer’s profits are derived from both the sales market and the sharing market.
Owners’ earnings from the sharing market are
Thereinto, consumers’ demand in the market is denoted as dj (j∈{B, 1, 2}). To meet consumers’ demand in the sharing market, the manufacturer’s lunch size of sharing products is S(φ).
The timing of events in the core model is as follows. First, a profit-maximizing manufacturer decides whether to enter the sharing market. Then, the manufacturer sets the product’s price pB and p1, and the number of sharing products S(φ). Third, the owner who previously purchased a new product decides whether to rent it out and sets the idle product’s price p2. Forth, consumers choose one of the products to maximize their net utility.
We summarize the notations in this paper, as shown in Table 1.
4. Equilibrium Analysis
4.1. No Product Sharing for Manufacturer
In this scenario, the manufacturer only sells new products in the sales market. The consumer can either purchase a new product from the manufacturer or rent an idle product from the owner. The sales market and the sharing market exist simultaneously only if uiB ≥ ui2 ≥ 0. Since if uiB < ui2, the consumer will rent the sharing product instead of buying the new product. However, the manufacturer will not adopt such a pricing strategy to encourage the consumer to rent the idle product. Then, we easily obtain from the formula uiB ≥ ui2 ≥ 0. Furthermore, vi is uniformly distributed in the interval [0, 1], so the sales market demand is given as follows.
In the sharing market, we get under . Therefore, the demand for owners’ idle products in the sharing market is obtained as follows.
Substituting dB and d2 in Equations (4) and (5), we obtain
4.2. Product Sharing for Manufacturer
In this scenario, the manufacturer enters the sharing market. Since consumers’ demand is random in the sharing market, S(φ) is assumed to represent the number of the manufacturer’s sharing products required to meet a service level φ. We assume that consumers’ requests do not overlap and refer to Bellos et al. (2017), who calculate the number of sharing products launched by the manufacturer in the sharing market. Then, the number of sharing products is as follows.
Under manufacturer’s entering the sharing market, there exists new products sold in the sales market, as well as new products and idle products in the sharing market. When uiB ≥ ui1 ≥ 0 and uiB ≥ ui2 ≥ 0, consumers will purchase the new product in the sales market. Otherwise, consumers will not purchase any product, so that the sharing market will not exist. Also, to ensure that the consumer prior rent sharing product from the manufacturer instead of the owner, only if ui1 ≥ ui2 ≥ 0. Then, we obtain from the formula uiB ≥ ui1. So sales market demand under manufacturer’s product sharing is given as follows.
Given ui1 ≥ ui2, we get and d1.
Since ui2 ≥ 0, we easily obtain
Substituting d1 in Equation (10), we obtain
When the manufacturer enters the sharing market, the total profit comes from the manufacturer’s selling products and renting out products. Substituting dB, d1, and d2 in Equations (4) and (5), we obtain
Equation (10) shows that the sharing products launched in the sharing market by the manufacturer are positively correlated with the availability rate of sharing products, which increases the manufacturer’s launching costs c∙S(φ) in the sharing market. Thus, we mainly analyze the impact of availability rate φ and product cost c on the manufacturer’s decision-making.
4.3. Main Results
To ensure the maximization of all players’ profits, we obtain the feedback equilibrium solutions by using backward induction (see Appendix A for details).
We obtain Proposition 1 and Lemma 1 through analyzing the subgame equilibrium solution of scenario NR (see Appendix B for details, similarly hereinafter). In the NR scenario, the manufacturer does not provide sharing services and only sells the new products to compete with the rental of idle products in the sharing market. If one of two products’ demands is negative, the duopoly will degenerate to a monopoly with either the new product or the idle product.
Proposition 1.
When the manufacturer does not enter the sharing market:
- (1)
- Only ifanddo consumers purchase new products in the sales market or rent idle products in the sharing market.
- (2)
- Ifand, consumers only rent idle products in the sharing market, but the manufacturer withdraws from the sales market.
The sharing products with high or low production costs have different degrees in cannibalizing the manufacturer’s sales market, which has become a consensus [3,24,26]. When the production cost is low, though the sharing market hurts the manufacturer’s profits [24], the manufacturer is still selling new products in the sales market. And the market demand is not affected by the transaction cost in the sharing market. However, when the production cost is not low, the members’ decision-making is also influenced by the transaction cost. If the transaction cost is high, sharing products with high-rent have no significant impact on the manufacturer’s sales. This makes it difficult for consumers to obtain the expected income of renting out the idle product that was purchased and used by her as the owner. Conversely, if the transaction cost is low, the lower rental price attracts more consumers in the sharing market, which greatly cannibalizes the manufacturer’s sales market. No consumer purchases the product until the manufacturer exits the sales market, as shown in Figure 1a.
Moreover, the availability of the sharing product affects the competition between selling new products and renting idle products. When the consumer’s rental needs are difficult to meet in the sharing market, the impact of product sharing on the manufacturer’s sales is not significant regardless of whether the production cost is high or low. If consumers could easily rent products in the sharing market, they will choose to rent to meet the user needs and give up purchasing products. Thus, the manufacturer will withdraw from the sales market, as shown in Figure 1b.
Lemma 1.
If the manufacturer only sells products and does not provide sharing services.is positively correlated with. , , , andare negatively correlated with.
Lemma 1 shows if the manufacturer does not enter the sharing market, the rental price of the owner’s idle product in the sharing market is positively correlated with the selling price in the sales market. Our general intuition is that the more a consumer pays for a new product, the higher the rental income an owner wants to gain in the sharing market. Since the consumer’s preference for sharing product will increase the demand in the sharing market. The increase in sharing product demand will dramatically cannibalize the manufacturer’s sales market . As a result, this will lower the product’s price to attract consumers. Even so, the manufacturer’s profit is still hurt by the existence of the sharing market. When the sharing market achieves economies of scale, the high usage rate of sharing products will prompt the owner to lower the rental price to attract more consumers to rent sharing products.
Furthermore, we obtain Proposition 2 by analyzing the subgame equilibrium solution of scenario RS.
Proposition 2.
There existsφ1for the availability rate of the sharing products andc1for the production cost, only if 0.7 <η2<η1< 1,, , and do three kinds of products have market demands.
Where .
Whether the manufacturer enters the sharing market is related to consumers’ preferences for two sharing products in the sharing market. The manufacturer is willing to enter the sharing market provided consumers’ preference for the manufacturer’s sharing product is high. The phenomenon is attributable to the following three reasons. First, compared with the owner’s idle product, the manufacturer invests more heavy assets if it enters the sharing market. Only consumers’ higher preferences can drive the manufacturer to share products. Second, the performance, operational status, and platform service level of the manufacturer’s sharing product are better than the owner’s idle product. Third, the manufacturer’s marketing strategies, such as advertising and e-commerce APP and brand loyalty, indirectly improve consumer’s preference for the manufacturer’s sharing product. In particular, only if the consumer’s preference 0.7 < η2 < η1 < 1 does the manufacturer provides sharing services. Therefore, we hereafter assume that η1 = 0.9 and η2 = 0.8.
In Figure 2, we characterize the feasible and unfeasible regions for providing sharing services by the manufacturer. The feasible region shows that the barrier for the manufacturer to enter the sharing market is very high. The manufacturer provides sharing services in the condition where the sharing product’s operation and transaction costs are high and close to production costs. The high operation cost will reduce the owner’s expected earnings and idle products’ market demand, and also weaken the consumer’s willingness to purchase products to obtain the rental income. Thus, the product demand in the sales market is cut down. The decreases of both new product sales and idle product sharing provide market conditions for the manufacturer’s entering the sharing market, as shown in Figure 2a.
As shown in Figure 2b, the manufacturer’s product sharing should also meet consumers’ rental demand in the sharing market. Compared to idle products, new products sharing launched by the manufacturer has a higher barrier, due to the high availability. Since the high availability rate of sharing products means that the manufacturer launches a large number of products in the sharing market. However, in reality, few manufacturers will launch sharing products that can meet consumers’ rental needs. So that the launching size of sharing products by the manufacturer is far smaller than consumers’ actual demand, which leads to the manufacturer’s withdraw from the sharing market. This phenomenon degenerates into NR situations, the competition between the sales market and sharing market. For the manufacturer’s sales market, when consumers are easily able to obtain use demand from the sharing market, they should have a greater competition for the sale of products, but because the manufacturer is also involved in the sharing services. It weakens the encroachment of sharing on the sales market and makes consumers still need to purchase. Therefore, to enter the sharing market, the manufacturer should improve the availability of sharing products. However, limited by the cost of product delivery, most manufacturers participate in the sharing of products far less than the actual demand, so it will lead to the situation that manufacturers cannot gain revenue in the sharing market, one after another out of the market.
We hereafter assume that η1 = 0.9 and η2 = 0.8 and analyze the impact of availability rate φ and product cost c on the manufacturer’s decision-making of entering the sharing market. We obtain Proposition 3 based on the analysis of the revenue of the manufacturer’s sharing market under whether the manufacturer’s entering the sharing market.
Proposition 3.
There exists a thresholdc2for the production cost, and whenc∈(c1, c2), the manufacturer does not profit in the sharing market (i.e.,). Whenc∈[c2, 1], the manufacturer profits in the sharing market (i.e.,).
Where .
The proof of c2 is included in Appendix B.
Different from the owner’s idle goods, the production cost, the operation cost, and the opportunity cost of the sharing products provided by the manufacturer are higher. Our general intuition is, under the condition of equal price, that the lower the production cost of the manufacturer’s sharing product is, the higher its profit is. However, Proposition 3 shows that the manufacturer offers higher-cost sharing products to benefit in the sharing market. This is because the high-cost product raises the barrier for consumers to purchase so that the holding cost is too high. Therefore, consumers are willing to rent sharing products instead of purchasing them, even if there are sharing platform’s operation cost, and transaction cost. Besides, there is no obvious difference in the consumer’s experience between the manufacturer’s low-cost sharing products and the owner’s idle goods. The manufacturer cannot obtain spillover benefits by providing low-cost sharing products, let alone recover the launching cost. As a consequence, the manufacturer tends to share high-cost products for obtaining higher rental income and marginal profit.
Proposition 3 shows that the manufacturer does not enter the sharing market because of launching a large number of products, which results in a high entry barrier and high operation costs. Once the manufacturer enters the sharing market, the availability affects the demand for the sharing products from Proposition 2. However, Proposition 3 shows that whether the manufacturer can obtain a positive profit in the sharing market has no significant impact with the availability rate of the sharing product. The reason is that the high demand and revenue brought by the high availability rate offset the high production cost. Conversely, although the low availability rate reduces the operation cost, the manufacturer cannot meet the rental demand of consumers, and thus, reduces the profit.
Furthermore, we analyze the equilibrium outcomes of the manufacturer’s sales market for two scenarios based on whether the manufacturer’s entering the sharing market, as shown in Proposition 4.
Proposition 4.
(1) There exists the thresholdφ1for the availability rate of the sharing products. Whenφ∈(φ1, 1],, , and.
(2) Under entering the sharing market, the manufacturer’s sales profit increases at the availability rate of the sharing products. Otherwise, the manufacturer’s sales profit decreases (i.e.,).
If the manufacturer does not enter the sharing market, the high availability rate of the sharing product will lead to the sales market being disappeared in Proposition 2. According to Proposition 3, once the manufacturer provides sharing services, the competition between two products in the sharing market weakens the cannibalization of the sales market. Proposition 3 shows, at this time, consumers can still purchase products in the sales market. Therefore, when the manufacturer provides sharing services, it will adopt a high pricing strategy in the sales market to consolidate the demand for high-end consumers. Moreover, when the manufacturer chooses to provide sharing services and if the sharing market runs efficiently (φ∈(φ1, 1]), product sharing is lucrative for the manufacturer who is willing to raise sales price () and make the product more scarce to promote consumers’ renting demands and increase the total revenue of both the sharing market and the sales market. Thus, with the product’s sales price and demand raising, the manufacturer’s sales profit is monotonically increasing with the availability rate of the sharing products, i.e., . However, without providing sharing services, the high availability rate of the sharing products will cannibalize the manufacturer’s sales market, i.e., . Therefore, the manufacturer’s entry in the sharing market is beneficial to the sales market.
Proposition 5.
There exists a thresholdc3for the production cost, and whenc∈(c1, c3], the manufacturer will not benefit from the product sharing (i.e.,). Whenc∈(c3, 1], entering the sharing market will benefit the manufacturer (i.e.,). The manufacturer’s entry is a dominant decision.
The proof of c3 is included in Appendix B.
Proposition 5 shows the manufacturer’s total profits in both the sales market and the sharing market under whether the manufacturer’s entering the sharing market. As we all know in Proposition 3, the manufacturer does not profit in the sharing market if the production cost is low. However, the profit in the sales market increases, making up for the loss in the sharing market. When the production cost is not too high (c∈(c1, c3]), the manufacturer’s equilibrium decision is not to enter the sharing market, i.e., . The manufacturer is willing to enter the sharing market because of the high adoption rate and the low idle cost of the sharing product. When the production cost is high, as shown in Proposition 4, the manufacturer can benefit from both selling products and renting out them. Thus, entering the sharing market is the manufacturer’s dominant decision.
Next, we analyze the owner’s equilibrium outcomes for two scenarios based on whether the manufacturer’s entering the sharing market, as shown in Proposition 6.
Proposition6.
Whenφ∈(φ1, 1], the manufacturer’s entering the sharing market raises the price () and the demand for idle products () and increases the owner’s earnings ().
Proposition 6 shows that the manufacturer’s entering the sharing market will promote the idle product’s sharing. As shown in Proposition 2, the manufacturer is willing to share new products under a higher availability, which also cannibalize the sales demand. In other words, if the sharing market runs efficiently, it has been proved that the sales price would raise the barrier for consumers to purchase in Proposition 4. Consumers are more willing to rent products in the sharing market. The rental price in the sharing market is also raised by the owner.
According to Proposition 6, the idle product’s demands and the owner’s earnings increase with the manufacturer’s entering the sharing market. This is contrary to our general intuition. One may intuit that the manufacturer’s sharing products enhance competition and cannibalize the owner’s earnings in the sharing market. In contrast, the manufacturer’s product sharing expands sharing demands, and the heterogeneity of sharing products provided by both the manufacturer and the owner makes the competition less obvious.
4.4. Numerical Analysis
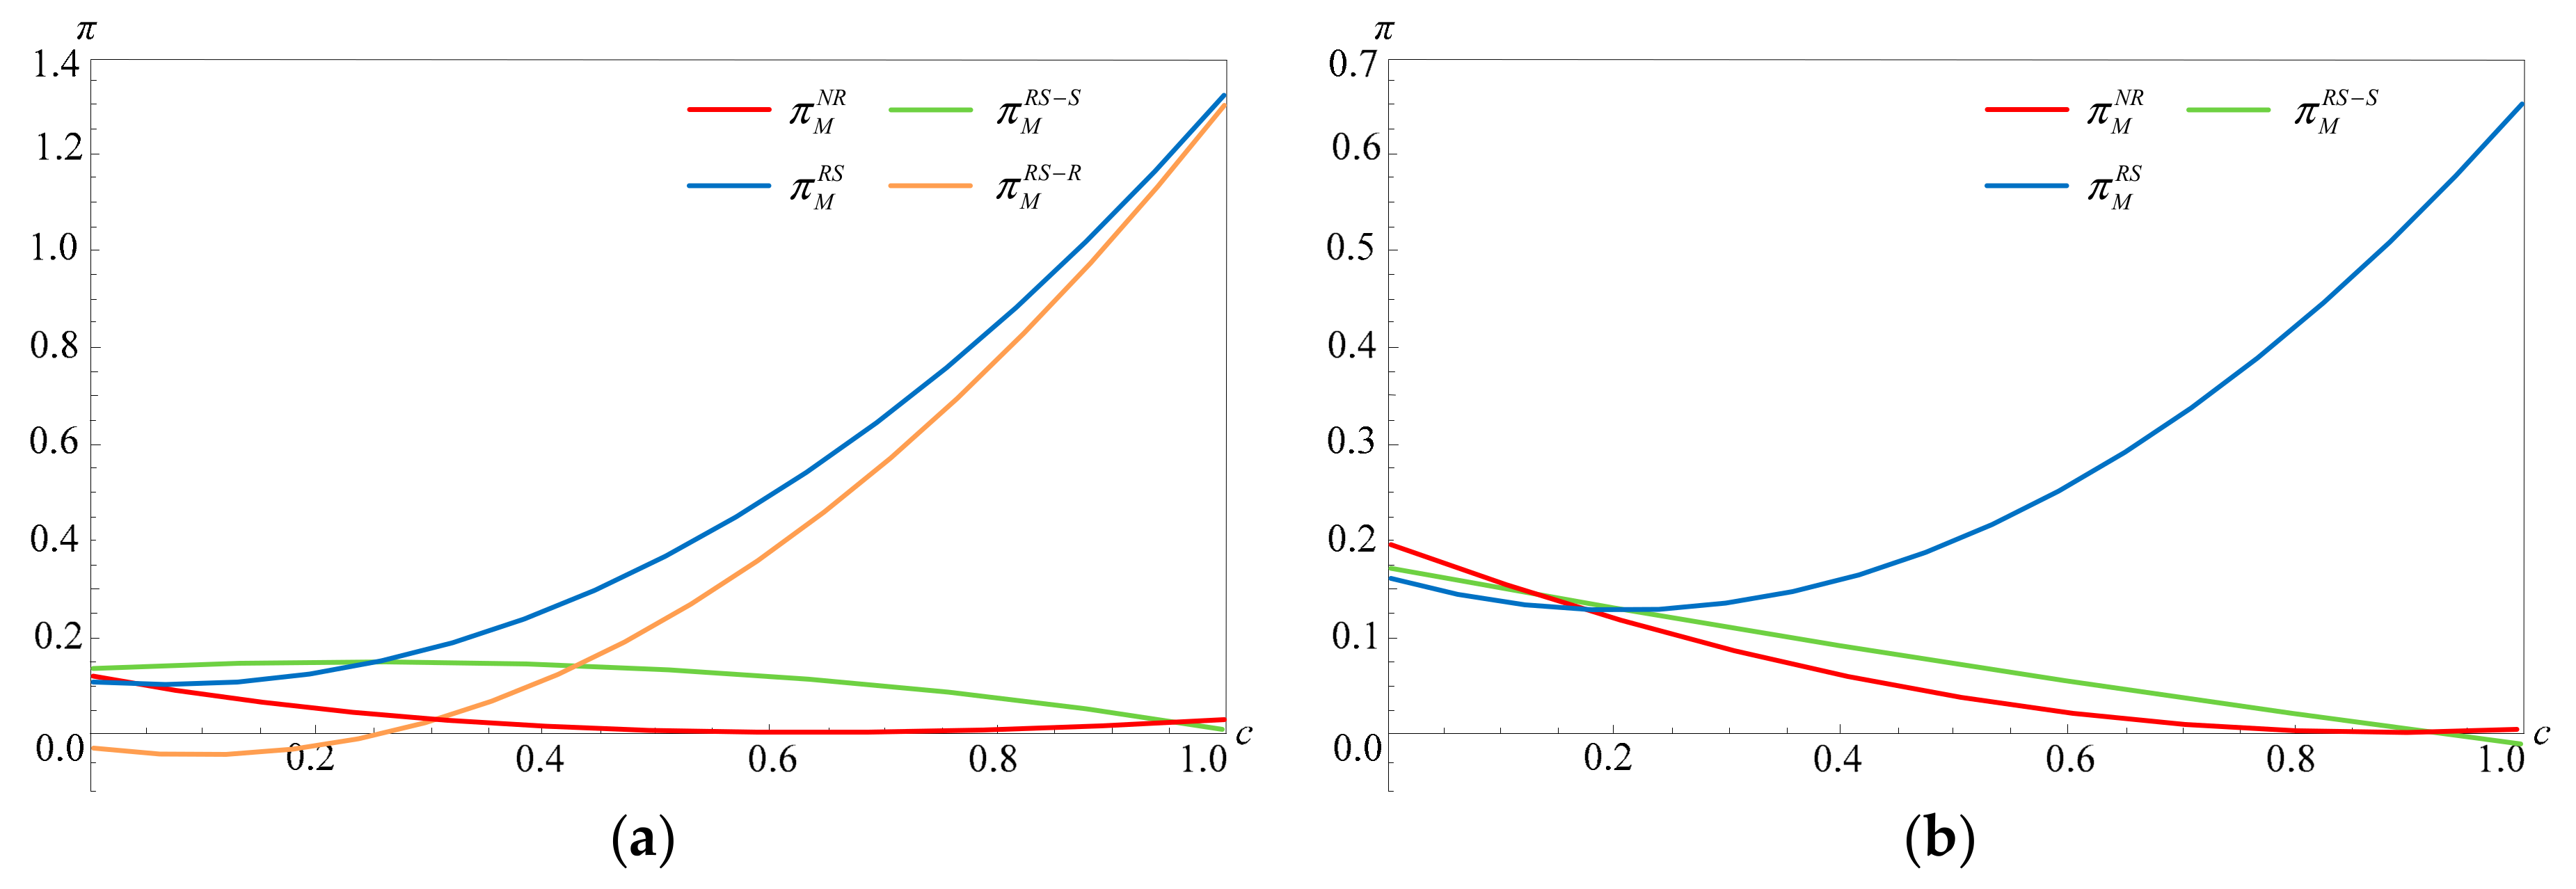
To further compare and analyze the impact of the availability rate of the sharing product on the manufacturer’s profits, we conduct a numerical analysis. In our numerical study, we consider β = α + g = 0.5c and two values of the availability rate of sharing products (φ = 0.6 and φ = 0.9), as shown in Figure 3.
Figure 3a shows the manufacturer’s profits in two markets with different scenarios when the availability of sharing products is high (φ = 0.9). When the manufacturer does not enter the sharing market, the sales profit decreases until the manufacturer exits the sales market. When the manufacturer enters the sharing market, the manufacturer’s profit in the sharing market monotonically increases with the production cost. If the production cost is low, the manufacturer does not profit in the sharing market. Otherwise, the manufacturer profits in the sharing market. In contrast, the manufacturer’s profit in the sales market monotonically decreases with the production cost in the case of the manufacturer’s entry into the sharing market. Even so, providing sharing services increases the manufacturer’s sales profit and improves total profit.
By comparing Figure 3a with Figure 3b, when consumers are not always able to effectively rent products from the sharing market (φ = 0.6), the manufacturer benefits more by not sharing products than by sharing. The manufacturer’s sales profit () increases with the availability rate of the sharing products. The reason is that high operational efficiency will enable the manufacturer to profit in the sharing market and prompt the manufacturer’s return of funds. It proves that the development of the sharing market dramatically cannibalizes the manufacturer’s sales market. Furthermore, by comparing with , the total profit under the manufacturer’s renting out low-cost products is no different from only selling product. Nonetheless, the higher the production cost, the greater the manufacturer’s profit is between two scenarios based on whether sharing products. In other words, sharing high-cost products will make the manufacturer more profitable.
To analyze and verify the above results, as well as the influence of the related parameters on the manufacturer’s decision-making, we use Mathematica 12.0 software to conduct the numerical analysis. Let the production costs be c = 0.3, c = 0.5, and c = 0.8.
It is shown in Table 2, the availability rate of the sharing product does not change all products’ price trends. The manufacturer’s rental price is close to the sales price but has a large difference in the owner’s rental price. Furthermore, we analyze the impact of the transaction cost on the manufacturer’s sharing service decision and assume the availability rate φ = 0.9. Since the high availability rate shows the sharing market runs efficiently and the manufacturer’s sharing servitization transformation is positive. For simplicity, we assume that β = α + g. The manufacturer does not profit in the sharing market if the production cost is low. In contrast, the manufacturer can benefit from product sharing only if the production cost is high. When the production cost is medium, a low transaction cost results in a negative profit for the manufacturer. Whereas, a high transaction cost benefits the manufacturer in the sharing market. This is also contrary to our general intuition. One may intuit that the high transaction cost will prevent the manufacturer from entering the sharing market. However, according to the observed reality, consumers are willing to rent the manufacturer’s sharing product rather than the owner’s idle product once the sharing transaction cost is high. In addition, if the transaction cost is low, consumers are willing to purchase products instead of renting them because of not too high production cost.
4.5. Special Scenario for the Pandemic
Furthermore, to analyze the impact of COVID-19 on the sharing. We assume that consumers’ sharing demand decrease during the pandemic period. Since the policy of home isolation and public health concerns have fundamentally changed consumers’ demands and sharing behaviors during the crisis of this pandemic. Closing sharing services in some cities are not a business decision, but rather a public health decision. Realistically though, private car usage has grown more than 20% during the pandemic. Conversely, the share of public transport decreased from 43% to 18% [43,44]. In China, affected by the pandemic, the use of sharing cars has decreased from 554 million to 368 million [45]. Therefore, to maintain a sustainable operation mode, manufacturers who participated in product sharing need to increase additional operation costs, including health insurance and travel insurance for the safety of drivers and passengers, but the movement has little effect in the past. We lower sharing preferences and let η1 = 0.6, η2 = 0.5. In addition, it’s necessary for the manufacturer who enters the sharing market to increase additional operation costs, including health insurance and travel insurance for the safety of drivers and passengers during COVID-19. We suppose the operation cost is increased from 0.5c to 0.6c. Each equilibrium solution can be obtained as follows.
As shown in Table 3, both the manufacturer’s profits and the owner’s earnings have declined in the sharing market, due to the decrease in sharing demands and increase in operating costs. The sales market and the sharing market are both in a downturn, and the manufacturer’s total profits are lower than before the pandemic. This is consistent with our intuition. In particular, the demand for new products sharing by the manufacturer fell to zero. For the manufacturer who enters the sharing market, the increase in the sales market offsets some of the losses in the sharing market during the pandemic. However, for other manufacturers who do not enter the sharing market, the demand and profit in the sharing market are higher than before the pandemic.
5. Discussion and Conclusions
The sharing economy has grown rapidly in recent years. It has been driven by the global economic downturn and society’s attention to sustainable resource usage. Over the last few years, in response to the sharing economy, many firms from traditional industries have provided sharing services in addition to selling to consumers. Nonetheless, this phenomenon is changing. These firms are exiting the sharing market and ending sharing services because of the rising operation costs and low adoption rates of sharing products. This research developed an analytical framework to examine these influence factors that restrict the manufacturer from providing sharing services and derive the equilibrium outcome of these factors influencing the manufacturer’s and consumer’s decisions for two scenarios: Without and with manufacturer’s providing sharing services.
Our analysis has generated a number of insights. First, this research has treated the sharing market entry decision is equivalent to gaining a nonnegative market share. The manufacturer is facing a higher entry barrier when entering the sharing market and providing sharing services. One factor that affects the manufacturer’s entry into the sharing market is the launching size of sharing products. However, in reality, few manufacturers will launch sharing products that can meet consumers’ rental needs. So that the launching size of sharing products by the manufacturer only accounts for 2–10% of demand and is far lower than consumers’ actual demand, which leads to the manufacturer’ withdrawal from the sharing market. Another factor that affects the manufacturer’s entry is the operation cost in the sharing market. So long as the operation and transaction costs are high and close to the production cost, the manufacturer has positive demand in the sharing market. The high operation cost will reduce the owner’s expected earnings and idle products’ market demand, and also weaken the consumer’s willingness to purchase products to obtain the rental income [24]. Thus, the product demand in the sales market is cut down. The decreases of both new product sales and idle product sharing provide market conditions for the manufacturer’s entering the sharing market. Moreover, once the manufacturer enters the sharing market and provides sharing services, the manufacturer’s market demand and profits have been improved.
Second, the manufacturer’s product sharing decisions change the competition of product sharing for the sales, especially when consumers can easily obtain the satisfaction of rental needs in the sharing market. When the manufacturer does not enter the sharing market, the sharing product’s cost-effectiveness will cause consumers to give up product ownership as the increase in availability and the decrease in transaction cost. No consumer purchases the product until the manufacturer exits the sales market. Once the entry barrier to the sharing market has been crossed, the manufacturer who was forced to withdraw from the sales market will enter the sharing market. Instead, once the manufacturer enters the sharing market, the competition between two products in the sharing market weakens the cannibalization of the sales market. Consumers can still purchase products into the sales market. Therefore, the manufacturer’s entry into the sharing market will achieve sustainable development facing the emerging sharing economy.
Third, the manufacturer’s profits in the sharing market are mainly related to the production cost. Only if the manufacturer rents out the high-cost product can it obtain positive profits [25,26,29]. However, the relationship between the manufacturer’s profits and the launching size of the sharing products is not significant. Since the launching size only determines the manufacturer’s operation cost in the sharing market. The high demand and revenue brought by the high availability rate offset the high production cost. Similarly, both the operation cost and the transaction cost in the sharing market have no significant impact on the manufacturer’s market demands and profits. This is mainly because the high entry barrier to the sharing market weakens the impact of other parameters on the manufacturer.
Finally, the manufacturer’s entering the sharing market can enable firms to obtain sustainable development and also promote the sales market. It has raised the price, maintained the demand, and improved the profit in the sales market. The manufacturer’s entry increases the price of products, maintain the demand for product sales, and also improve the profit of the product sales market. Meanwhile, it is also of positive significance to the owner in the sharing market, increases the product rental price and use demand of the idle product sharing market, and improves the owner’s profit. It is the same for the owner.
The above-mentioned discussion and conclusions show that the sharing economy has changed the way consumers obtain ownership, and affected consumers’ purchase decision-making, and the manufacturer’s operating strategies in traditional industries. Although the entry barrier is high, entering the sharing market can improve the manufacturer’s profits, weaken the threat of the sharing economy on traditional industries, and achieve sustainable development. The development of the sharing economy does not necessarily aim at reducing the operation cost and the transaction cost. The sharing economy lies in improving sharing services to meet consumers’ rental demand to the maximum extent.
In particular, we simulated the special scenario for the COVID-19 period, where both the manufacturer’s profits and the owner’s earnings have declined in the sharing market, due to the decrease in sharing demands and increase in operating costs. The sales market and the sharing market are both in a downturn, the manufacturer’s total profits are lower than before the pandemic. This is consistent with our intuition. For the manufacturer who enters the sharing market, the increase in the sales market offsets some of the losses in the sharing market during the pandemic. However, for other manufacturers who do not enter the sharing market, the demand and profit in the sharing market are higher than before the pandemic.
6. Limitations
We have simplified our model specifications to derive meaningful analytical results. The generalizability of these results is subject to certain limitations and can be relaxed to deal with more complex situations. First, we examined only a monopoly manufacturer that sold products. In reality, multiple manufacturers participating in the sharing economy will produce multi-channel competition. It will be interesting to introduce competitive manufacturers in future research. Second, further research should be undertaken to examine the sharing platforms, including the self-built platform and the third-party platform, and explore the members’ decision-making of the multi-channel supply chain.
Author Contributions
Conceptualization, J.F.; formal analysis, Y.X.; methodology, J.F.; project administration, Z.L.; resources, J.F.; supervision, Z.L.; writing—original draft, Y.X.; writing—review and editing, Z.L. All authors have read and agreed to the published version of the manuscript.
Funding
This research was funded by Innovation Method Fund of China with grant number 2018IM020300, 2019IM020200; and Shanghai Science and Technology Program (Project No. 20040501300).
Institutional Review Board Statement
Not applicable.
Informed Consent Statement
Not applicable.
Data Availability Statement
MDPI Research Data Policies.
Conflicts of Interest
The authors declare that there is no conflict of interest regarding the publication of this paper.
Appendix A
In this appendix, we solve the manufacturer’s or owner’s profit-maximization problems. We obtain feedback equilibrium solutions using backwards induction.
Under manufacturer’s entering the sharing market, the manufacturer’s profits are and the owner’s earnings are .
According to the backwards induction, ; . Let , we obtain ; then we substitute into , we get ., let , we obtain . Next, we substitute into , we get .
We substitute and into , , and , then we obtain , , .
When the manufacturer both sells products and provides sharing services, we describe . We get the owner’s earnings . Then according to the backwards induction, , we set , and obtain . Then we substitude into and obtain , which is a function of and . We obtain , , , . We let , . Then we obtain , . We substitude and into and obtain . Next, we substitude the optimal price , , and into and ; we get , and .
Appendix B
This appendix contains all proofs of the propositions in the paper.
Proof of Proposition 1.
Let , , , . We obtain and . If , and , we obtain and .
Proof of Lemma 1.
, ; ; , <0; .
Proof of Proposition 2.
, , , and . According to Hessian Matrix , , , and . We let and obtain , , c>, and . Let .
Proof of Proposition 3.
We substitude the optimal price into , . We assume and , then . We let and obtain .
Proof of Proposition 4.
, . We let . We let and .
Proof of Proposition 5.
, .
We let and obtain which is omitted hear.
Proof of Proposition 6.
From Appendix A, we get , and . We easily get , .
The proof of relevant transaction costs. We let and obtain .
References
- PwC. “The Sharing Economy.” PwC Consumer Intelligence Series. 2015. Available online: https://www.pwc.com/us/en/technology/publications/assets/pwc-consumer-intelligence-series-the-sharing-economy.pdf (accessed on 12 October 2020).
- PwC. Share Economy 2017: The New Business Model. 2018. Available online: https://www.pwc.de/share-economy (accessed on 12 October 2020).
- Feng, J.; Liu, B.; Liu, Z. Manufacturer’s business strategy: Interaction of sharing economy and product rollover. Complexity 2020, 3, 1–18. [Google Scholar] [CrossRef]
- iiMedia Research. 2018–2019 China Shared Economy Industry Panorama Research Report. 2019. Available online: https://www.iimedia.cn/c400/66502.html (accessed on 15 December 2020).
- Li, F. Daimler Pulls Plug on Car-Sharing Program. Available online: https://global.chinadaily.com.cn/a/201906/03/WS5cf49491a310a4317f1d8073.html (accessed on 15 October 2020).
- SHARE NOW. Service Ending February 29th. Available online: https://www.share-now.com/ca/en/important-update/ (accessed on 15 October 2020).
- Brown, L.S. GM’s Car-Sharing Service, Maven, Shuts Down after Four Years. Available online: https://www.caranddriver.com/news/a32235218/gm-maven-car-sharing-closes/ (accessed on 15 December 2020).
- Hossain, M. The effect of the Covid-19 on sharing economy activities. J. Clean. Prod. 2021, 280, 124782. [Google Scholar] [CrossRef] [PubMed]
- Zhang, D. Pandemic Hinders Growth of Car-Sharing Business. Available online: https://www.chinadaily.com.cn/a/202007/13/WS5f0bc279a310834817258f3b.html (accessed on 15 October 2020).
- Belk, R. You are what you can access: Sharing and collaborative consumption online. J. Bus. Res. 2014, 67, 1595–1600. [Google Scholar] [CrossRef]
- Plewnia, F.; Guenther, E. Mapping the sharing economy for sustainability research. Manag. Decis. 2018, 56, 570–583. [Google Scholar] [CrossRef]
- Laurenti, R.; Singh, J.; Cotrim, J.M.O.; Toni, M.; Sinha, R. Characterizing the sharing economy state of the research: A systematic map. Sustainability 2019, 11, 5729. [Google Scholar] [CrossRef] [Green Version]
- Hossain, M. Sharing economy: A comprehensive literature review. Int. J. Hosp. Manag. 2020, 87, 102470. [Google Scholar] [CrossRef]
- Ranjbari, M.; Morales-Alonso, G.; Carrasco-Gallego, R. Conceptualizing the sharing economy through presenting a comprehensive framework. Sustainability 2018, 10, 2336. [Google Scholar] [CrossRef] [Green Version]
- Sun, J.; Lv, X. Feeling dark, seeing dark: Mind–body in dark tourism. Ann. Tourism Res. 2021, 86, 103087. [Google Scholar] [CrossRef]
- Xiong, Z.; Xiao, N.; Xu, F.; Zhang, X.; Xu, Q.; Zhang, K.; Ye, C. An equivalent exchange based data forwarding incentive scheme for socially aware networks. J. Signal Processi. Syst. 2020, 11, 1–15. [Google Scholar] [CrossRef]
- Laurell, C.; Sandström, C. Comparing coverage of disruptive change in social and traditional media: Evidence from the sharing economy. Technol. Forecast. Soc. Chang. 2018, 129, 339–344. [Google Scholar] [CrossRef]
- Lv, X.; Li, H.; Xia, L. Effects of haptic cues on consumers’ online hotel booking decisions: The mediating role of mental imagery. Tourism Manage. 2020, 77, 104025. [Google Scholar] [CrossRef]
- Lv, X.; Liu, Y.; Luo, J.; Liu, Y.; Li, C. Does a cute artificial intelligence assistant soften the blow? The impact of cuteness on customer tolerance of assistant service failure. Ann. Tourism Res. 2021, 87, 103114. [Google Scholar] [CrossRef]
- Fraiberger, S.P.; Sundararajan, A. Peer-to-peer rental markets in the sharing economy. Work. Paper 2015. [Google Scholar] [CrossRef] [Green Version]
- Fradkin, A. Search, matching, and the role of digital marketplace design in enabling trade: Evidence from Airbnb. Work. Paper 2017. [Google Scholar] [CrossRef] [Green Version]
- Benjaafar, S.; Kong, G.; Li, X.; Courcoubetis, C. Peer-to-peer product sharing: Implications for ownership, usage, and social welfare in the sharing economy. Manag. Sci. 2018, 65, 477–493. [Google Scholar] [CrossRef] [Green Version]
- Abhishek, V.; Guajardo, J.; Zhang, Z. Business Models in the Sharing Economy: Manufacturing Durable Goods in the Presence of Peer-to-Peer Rental Markets. 2020. Available online: https://ssrn.com/abstract=2891908 (accessed on 10 February 2020).
- Jiang, B.; Tian, L. Collaborative consumption: Strategic and economic implications of product sharing. Manag. Sci. 2018, 64, 1171–1188. [Google Scholar] [CrossRef]
- Tian, L.; Jiang, B. Effects of consumer-to-consumer product sharing on distribution channel. Prod. Oper. Manag. 2018, 27, 350–367. [Google Scholar] [CrossRef]
- Liu, Z.; Feng, J.; Wang, J. Effects of the sharing economy on sequential innovation products. Complexity 2019, 2019, 3089641. [Google Scholar] [CrossRef]
- Ke, H.; Chai, S.; Cheng, R. Selling or sharing: Business model selection problem for an automobile manufacturer with uncertain information. J. Intell. Fuzzy Syst. 2018, 36, 1–16. [Google Scholar] [CrossRef]
- Razeghian, M.; Weber, T.A. The advent of the sharing culture and its effect on product pricing. Electron. Commer. Res. Appl. 2019, 33, 100801. [Google Scholar] [CrossRef]
- Jiang, B.; Tian, L.; Xu, Y. Manufacturer’s entry in the product-sharing market. Manuf. Serv. Oper. Manag. 2019. [Google Scholar] [CrossRef] [Green Version]
- Nishino, N.; Takenaka, T.; Takahashi, H. Manufacturer’s strategy in a sharing economy. CIRP Ann. 2017, 1, 409–412. [Google Scholar] [CrossRef]
- Weber, T.A. Product pricing in a peer-to-peer economy. J. Manag. Inf. Syst. 2016, 33, 573–596. [Google Scholar] [CrossRef] [Green Version]
- Schmidt, P. The effect of car sharing on car sales. Int. J. Ind. Organ. 2020, 71, 102622. [Google Scholar] [CrossRef]
- Li, Y.; Bai, X.; Xue, K. Business modes in the sharing economy: How does the OEM cooperate with third-party sharing platforms? Int. J. Prod. Econ. 2020, 221, 107467. [Google Scholar] [CrossRef]
- Chardon, C.M.; Caruso, G.; Thomas, I. Bicycle sharing system ‘success’ determinants. Transp. Res. Part A Policy Pract. 2017, 100, 202–214. [Google Scholar] [CrossRef]
- Kabra, A.; Belavina, E.; Girotra, K. Bike-share systems: Accessibility and availability. Work. Paper 2018. [Google Scholar] [CrossRef] [Green Version]
- Bellos, I.; Ferguson, M.; Toktay, L.B. The car sharing economy: Interaction of business model choice and product line design. Manuf. Serv. Oper. Manag. 2017, 19, 185–201. [Google Scholar] [CrossRef]
- Weber, T.A. Intermediation in a sharing economy: Insurance, moral hazard, and rent extraction. J. Manag. Inf. Syst. 2014, 31, 35–71. [Google Scholar] [CrossRef]
- Liu, Z.; Feng, J.; Liu, B. Pricing and Service Level Decisions under a Sharing Product and Consumers’ Variety-Seeking Behavior. Sustainability 2019, 11, 6951. [Google Scholar] [CrossRef] [Green Version]
- Zhu, J.; Shi, Q.; Wu, P.; Sheng, Z.; Wang, X. Complexity analysis of prefabrication contractors’ dynamic price competition in mega projects with different competition strategies. Complexity 2018, 5928235. [Google Scholar] [CrossRef]
- Qu, S.; Han, Y.; Wu, Z.; Raza, H. Consensus modeling with asymmetric cost based on data-driven robust optimization. Group Decis. Negot. 2020, 1–38. [Google Scholar] [CrossRef]
- Cao, L. Changing port governance model: Port spatial structure and trade efficiency. J. Coastal Res. 2020, 95(S1), 963–968. [Google Scholar] [CrossRef]
- Liu, B.; Yang, G.; Zhang, Q. Pricing decisions and innovation strategies choice in supply chain with competing manufacturers and common supplier. Sustainability 2020, 12, 8855. [Google Scholar] [CrossRef]
- Zhao, X.; Ye, Y.; Ma, J.; Shi, P.; Chen, H. Construction of electric vehicle driving cycle for studying electric vehicle energy consumption and equivalent emissions. Environ. Sci. Pollut. R. 2020, 27, 37395–37409. [Google Scholar] [CrossRef] [PubMed]
- Bucsky, P. Modal share changes due to COVID-19: The case of Budapest. Transp. Res. Interdiscip. Perspect. 2020, 8, 100141. [Google Scholar]
- Aurora Mobile. Report on the Development Trend of Car-Sharing in 2020. 2020. Available online: https://www.jiguang.cn/reports/494 (accessed on 15 December 2020).
Figure 1.
Feasible and unfeasible regions for manufacturer’ no product sharing (Note: (I) Selling new products; (II) renting idle products.). (a) φ = 0.9, η2 = 0.8; (b) β = 0.5c, η2 = 0.8.
Figure 1.
Feasible and unfeasible regions for manufacturer’ no product sharing (Note: (I) Selling new products; (II) renting idle products.). (a) φ = 0.9, η2 = 0.8; (b) β = 0.5c, η2 = 0.8.
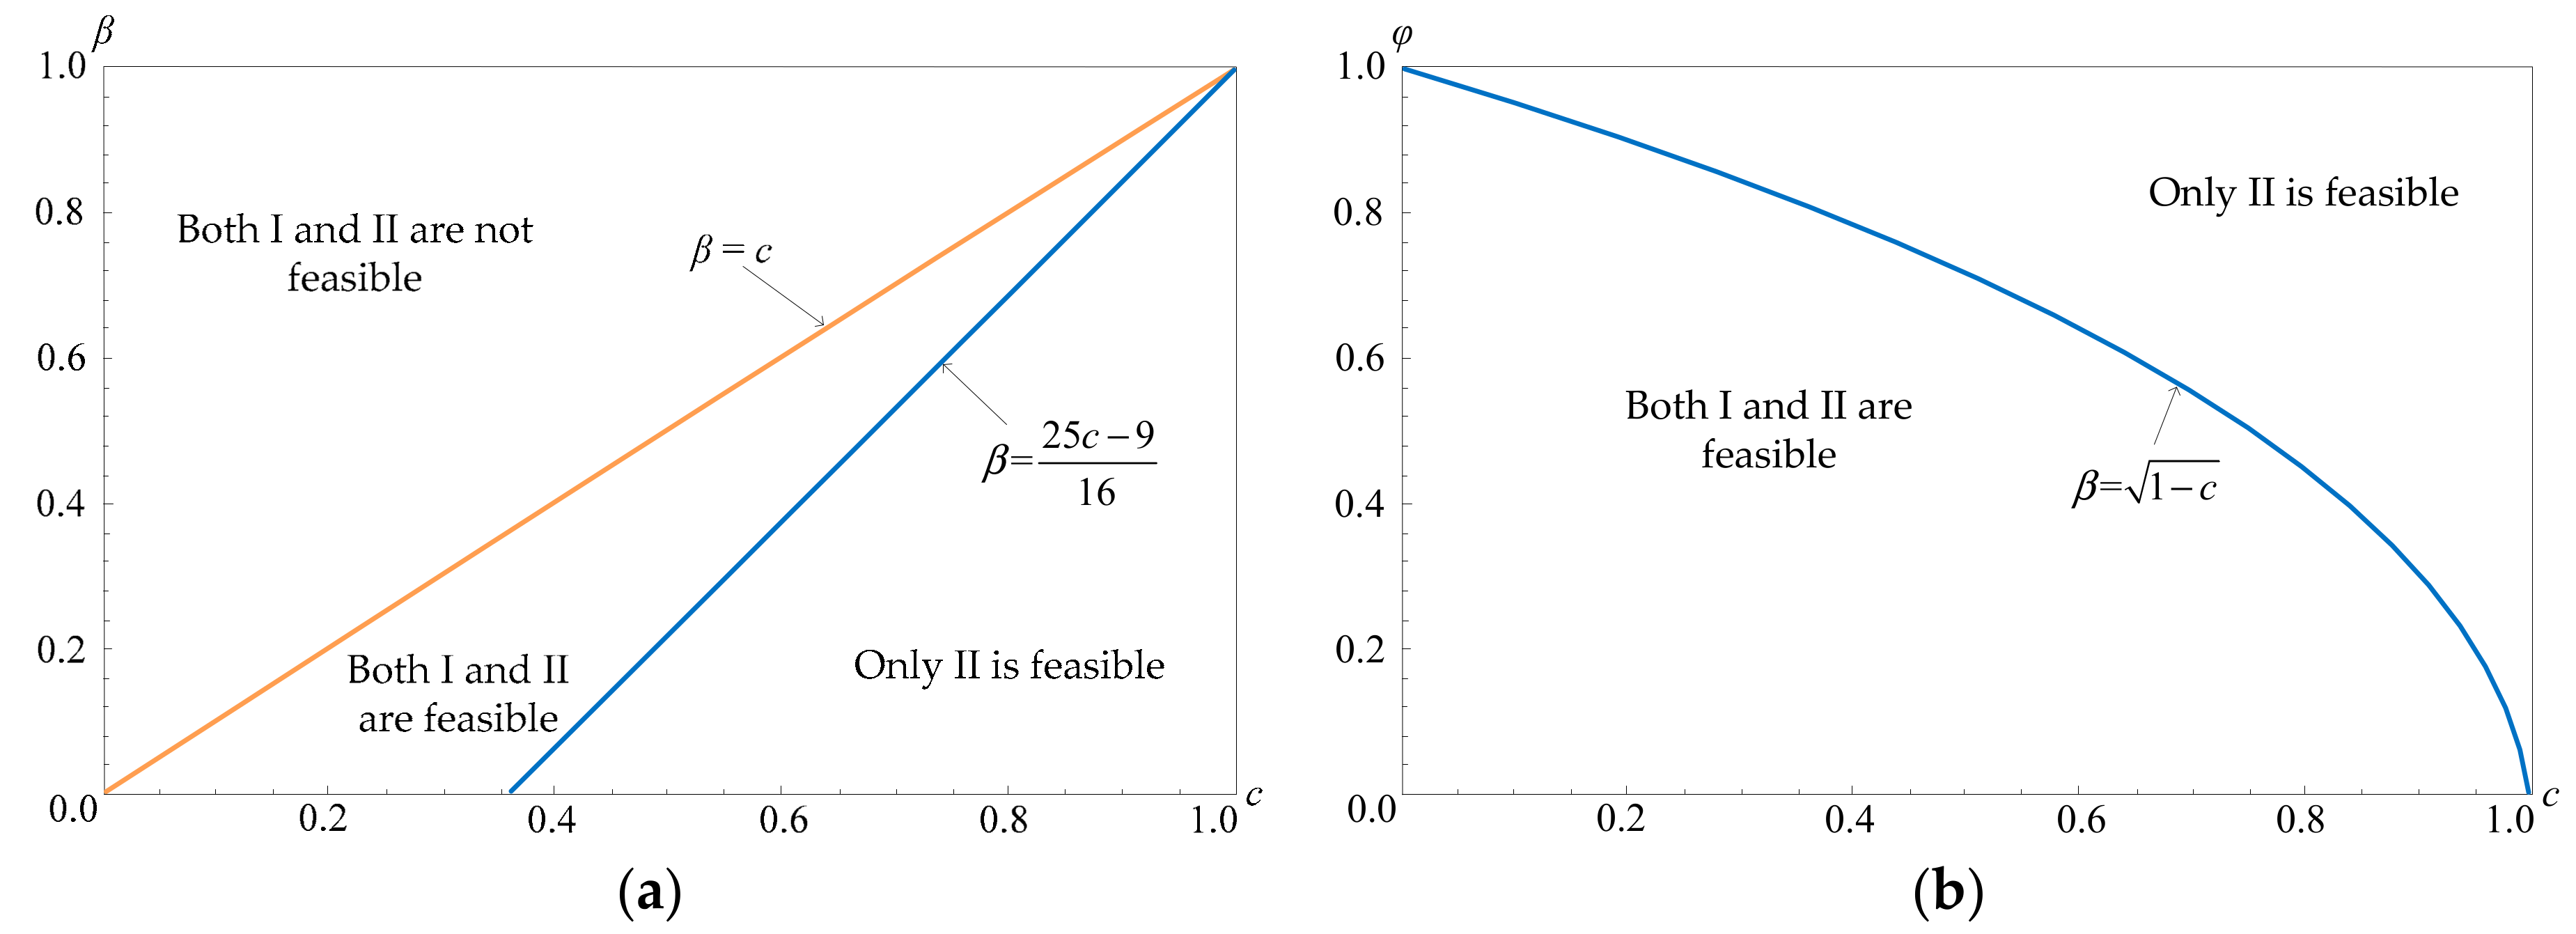
Figure 2.
Feasible and unfeasible regions for manufacturer’ product sharing (Note: (I) Selling new products; (II) renting idle products; (III) renting new products.). (a) φ = 0.9, η1 = 0.9, η2 = 0.8; (b) β = 0.5c, η1 = 0.9, η2 = 0.8.
Figure 2.
Feasible and unfeasible regions for manufacturer’ product sharing (Note: (I) Selling new products; (II) renting idle products; (III) renting new products.). (a) φ = 0.9, η1 = 0.9, η2 = 0.8; (b) β = 0.5c, η1 = 0.9, η2 = 0.8.

Figure 3.
(a) Manufacturer’s profits for two scenarios (φ = 0.9), (b) Manufacturer’s profits for two scenarios (φ = 0.6).
Figure 3.
(a) Manufacturer’s profits for two scenarios (φ = 0.9), (b) Manufacturer’s profits for two scenarios (φ = 0.6).

Table 1.
Notations and definitions are used in the model.
| i | ith Consumer, i = 1, 2, 3… |
| j | Products, j = B (buying a new product from manufacturer), 1 (renting product from manufacturer), 2 (renting product from the owner). |
| Vi | ith consumer’s valuation for purchasing/renting product, vi~U [0, 1]. |
| ui,j | ith consumer’s utility of choosing product j. |
| pj | Price of product j. |
| ηj | Consumer’s preference for sharing product. |
| dj | The demand for product j. |
| c | Product’s production cost. |
| α | The transaction cost of sharing product’s in B2C sharing market. |
| g | The operation cost of sharing product’s in B2C sharing market. |
| β | The transaction cost of sharing product’s in C2C platform. |
| φ | Sharing a product’s availability rate, φ∈[0, 1]. |
| S(φ) | The number of sharing products from the manufacturer. |
| πM | The manufacturer’s total profit. |
| πO | Owner’s earnings. |
| NR | The manufacturer does not enter the sharing market, denoted as a superscript NR. |
| RS | Manufacturer enters the sharing market, denoted as a superscript RS. |
| -S | Sales market, denoted as a superscript -S. |
| -R | Sharing market, denoted as a superscript -R. |
Table 2.
The numerical analysis.
| C | |||||||||||||||||
|---|---|---|---|---|---|---|---|---|---|---|---|---|---|---|---|---|---|
| φ = 0.9, β = 0.5c | 0.3 | 0.426 | 0.458 | 0.288 | 0.231 | 0.430 | - | 0.932 | 1.244 | 0.205 | 0.658 | 0.175 | - | 0.147 | 0.035 | 0.029 | 0.124 |
| 0.5 | 0.616 | 0.626 | 0.438 | 0.339 | 0.556 | 0.07 | 1.139 | 1.690 | 0.008 | 0.810 | 0.360 | 0.228 | 0.132 | 0.006 | 0.035 | 0.229 | |
| 0.8 | 0.852 | 0.924 | 0.662 | 0.500 | 0.744 | 0.045 | 1.449 | 2.360 | - | 1.038 | 0.851 | 0.775 | 0.076 | - | 0.044 | 0.446 | |
| φ = 0.6, β = 0.5c | 0.3 | 0.407 | 0.509 | 0.279 | 0.286 | 0.552 | - | 0.505 | 1.159 | 0.310 | 0.489 | 0.127 | - | 0.106 | 0.083 | 0.018 | 0.040 |
| 0.5 | 0.597 | 0.641 | 0.423 | 0.390 | 0.664 | - | 0.487 | 1.560 | 0.183 | 0.568 | 0.191 | - | 0.069 | 0.035 | 0.018 | 0.065 | |
| 0.8 | 0.880 | 0.839 | 0.640 | 0.546 | 0.831 | - | 0.460 | 2.162 | - | 0.687 | 0.408 | - | 0.018 | - | 0.018 | 0.113 |
Table 3.
The numerical analysis for COVID-19.
| c | |||||||||||||||||
|---|---|---|---|---|---|---|---|---|---|---|---|---|---|---|---|---|---|
| φ = 0.9, β = 0.5c | 0.3 | 0.426 | 0.458 | 0.288 | 0.231 | 0.430 | - | 0.932 | 1.244 | 0.205 | 0.658 | 0.175 | - | 0.147 | 0.035 | 0.029 | 0.124 |
| 0.5 | 0.616 | 0. 626 | 0.438 | 0.339 | 0.556 | 0.07 | 1.139 | 1.690 | 0.008 | 0.810 | 0.360 | 0.228 | 0.132 | 0.006 | 0.035 | 0.229 | |
| 0.8 | 0.852 | 0. 924 | 0.662 | 0.500 | 0.744 | 0.045 | 1.449 | 2.360 | - | 1.038 | 0.851 | 0.775 | 0.076 | - | 0.044 | 0.446 | |
| φ = 0.9, β = 0.6c | 0.3 | 0.479 | 0.542 | 0.329 | 0.312 | 0.567 | - | 0.512 | 0.906 | 0.316 | 0.474 | 0.129 | - | 0.128 | 0.089 | 0.024 | 0.062 |
| 0.5 | 0. 675 | 0.681 | 0.490 | 0.431 | 0.679 | - | 0.490 | 1.159 | 0.193 | 0.549 | 0.165 | - | 0.091 | 0.040 | 0.025 | 0.101 | |
| 0.8 | 0.873 | 0.984 | 0.732 | 0.607 | 0.847 | - | 0.460 | 1.539 | 0.009 | 0.661 | 0.316 | - | 0.037 | 0.010 | 0.027 | 0.178 |
Publisher’s Note: MDPI stays neutral with regard to jurisdictional claims in published maps and institutional affiliations. |
© 2021 by the authors. Licensee MDPI, Basel, Switzerland. This article is an open access article distributed under the terms and conditions of the Creative Commons Attribution (CC BY) license (http://creativecommons.org/licenses/by/4.0/).
Share and Cite
MDPI and ACS Style
Liu, Z.; Xiao, Y.; Feng, J. Manufacturer’s Sharing Servitization Transformation and Product Pricing Strategy. Sustainability 2021, 13, 1503. https://doi.org/10.3390/su13031503
AMA Style
Liu Z, Xiao Y, Feng J. Manufacturer’s Sharing Servitization Transformation and Product Pricing Strategy. Sustainability. 2021; 13(3):1503. https://doi.org/10.3390/su13031503
Chicago/Turabian StyleLiu, Zhenfeng, Ya Xiao, and Jian Feng. 2021. "Manufacturer’s Sharing Servitization Transformation and Product Pricing Strategy" Sustainability 13, no. 3: 1503. https://doi.org/10.3390/su13031503
Note that from the first issue of 2016, this journal uses article numbers instead of page numbers. See further details here.