Evaluating Walkability through a Multi-Criteria Decision Analysis Approach: A Lisbon Case Study
Abstract
1. Introduction
- Qualitative scales: The PROMETHEE method’s ability to evaluate alternatives in qualitative scales can be advantageous when analyzing walkability criteria, as they can present more subjective measures.
2. Literature Review
2.1. Walkability Indicators
2.2. MCDA Applied to Walkability
3. Methodology and Methods
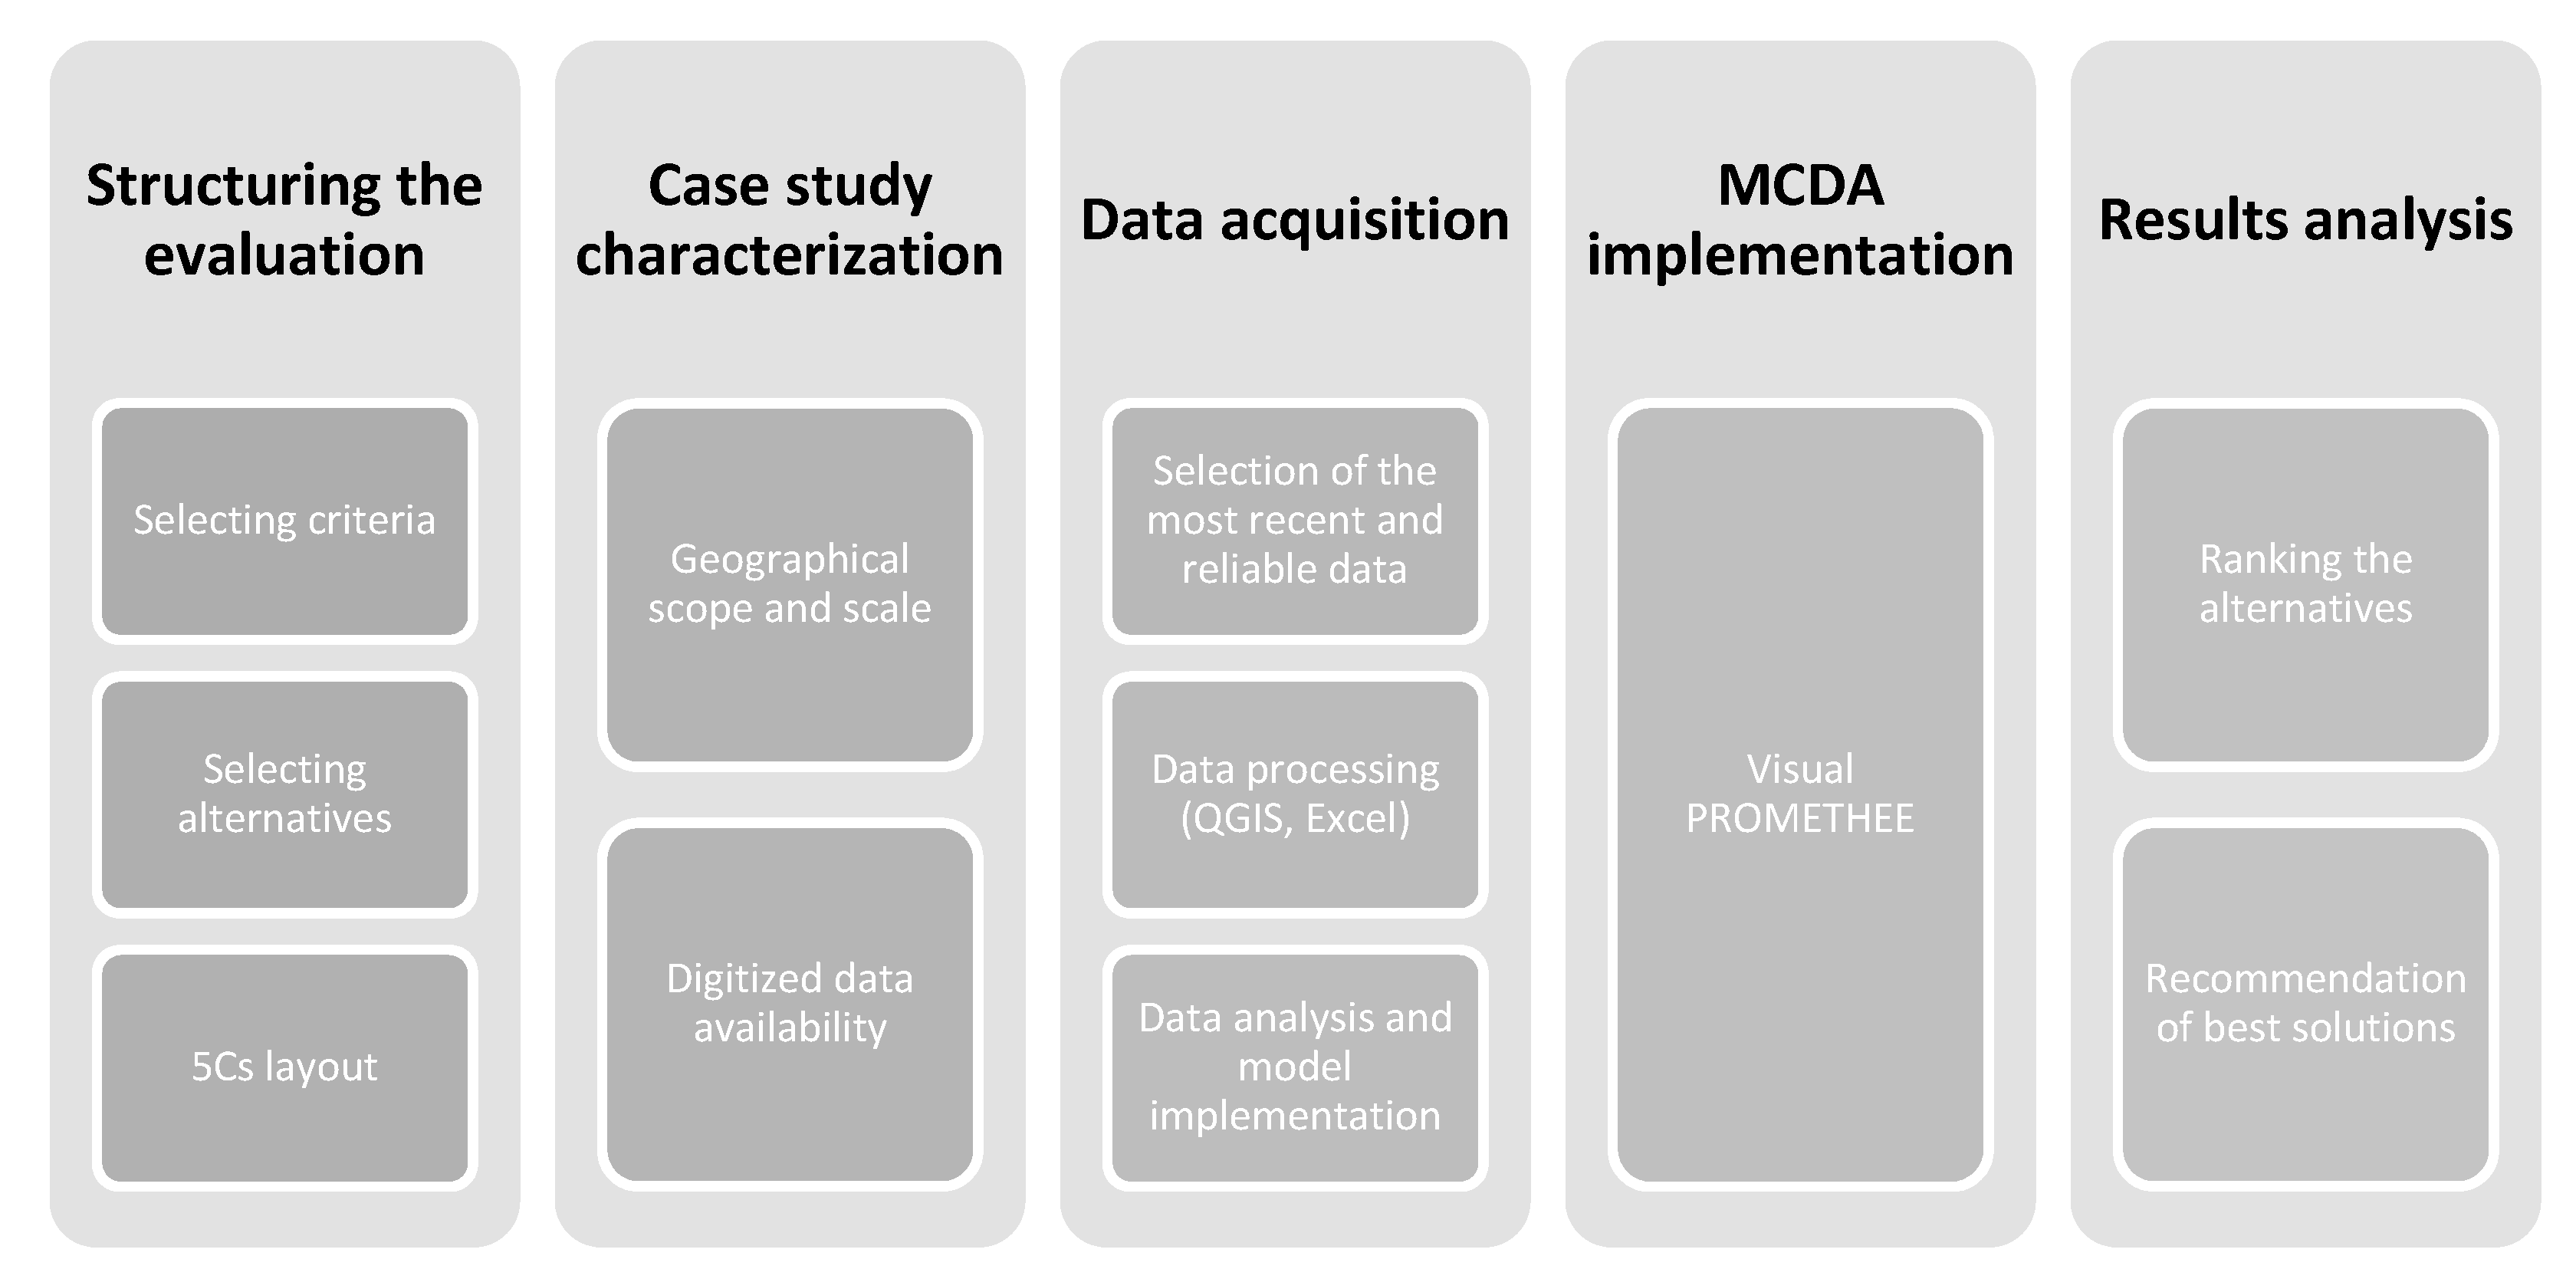
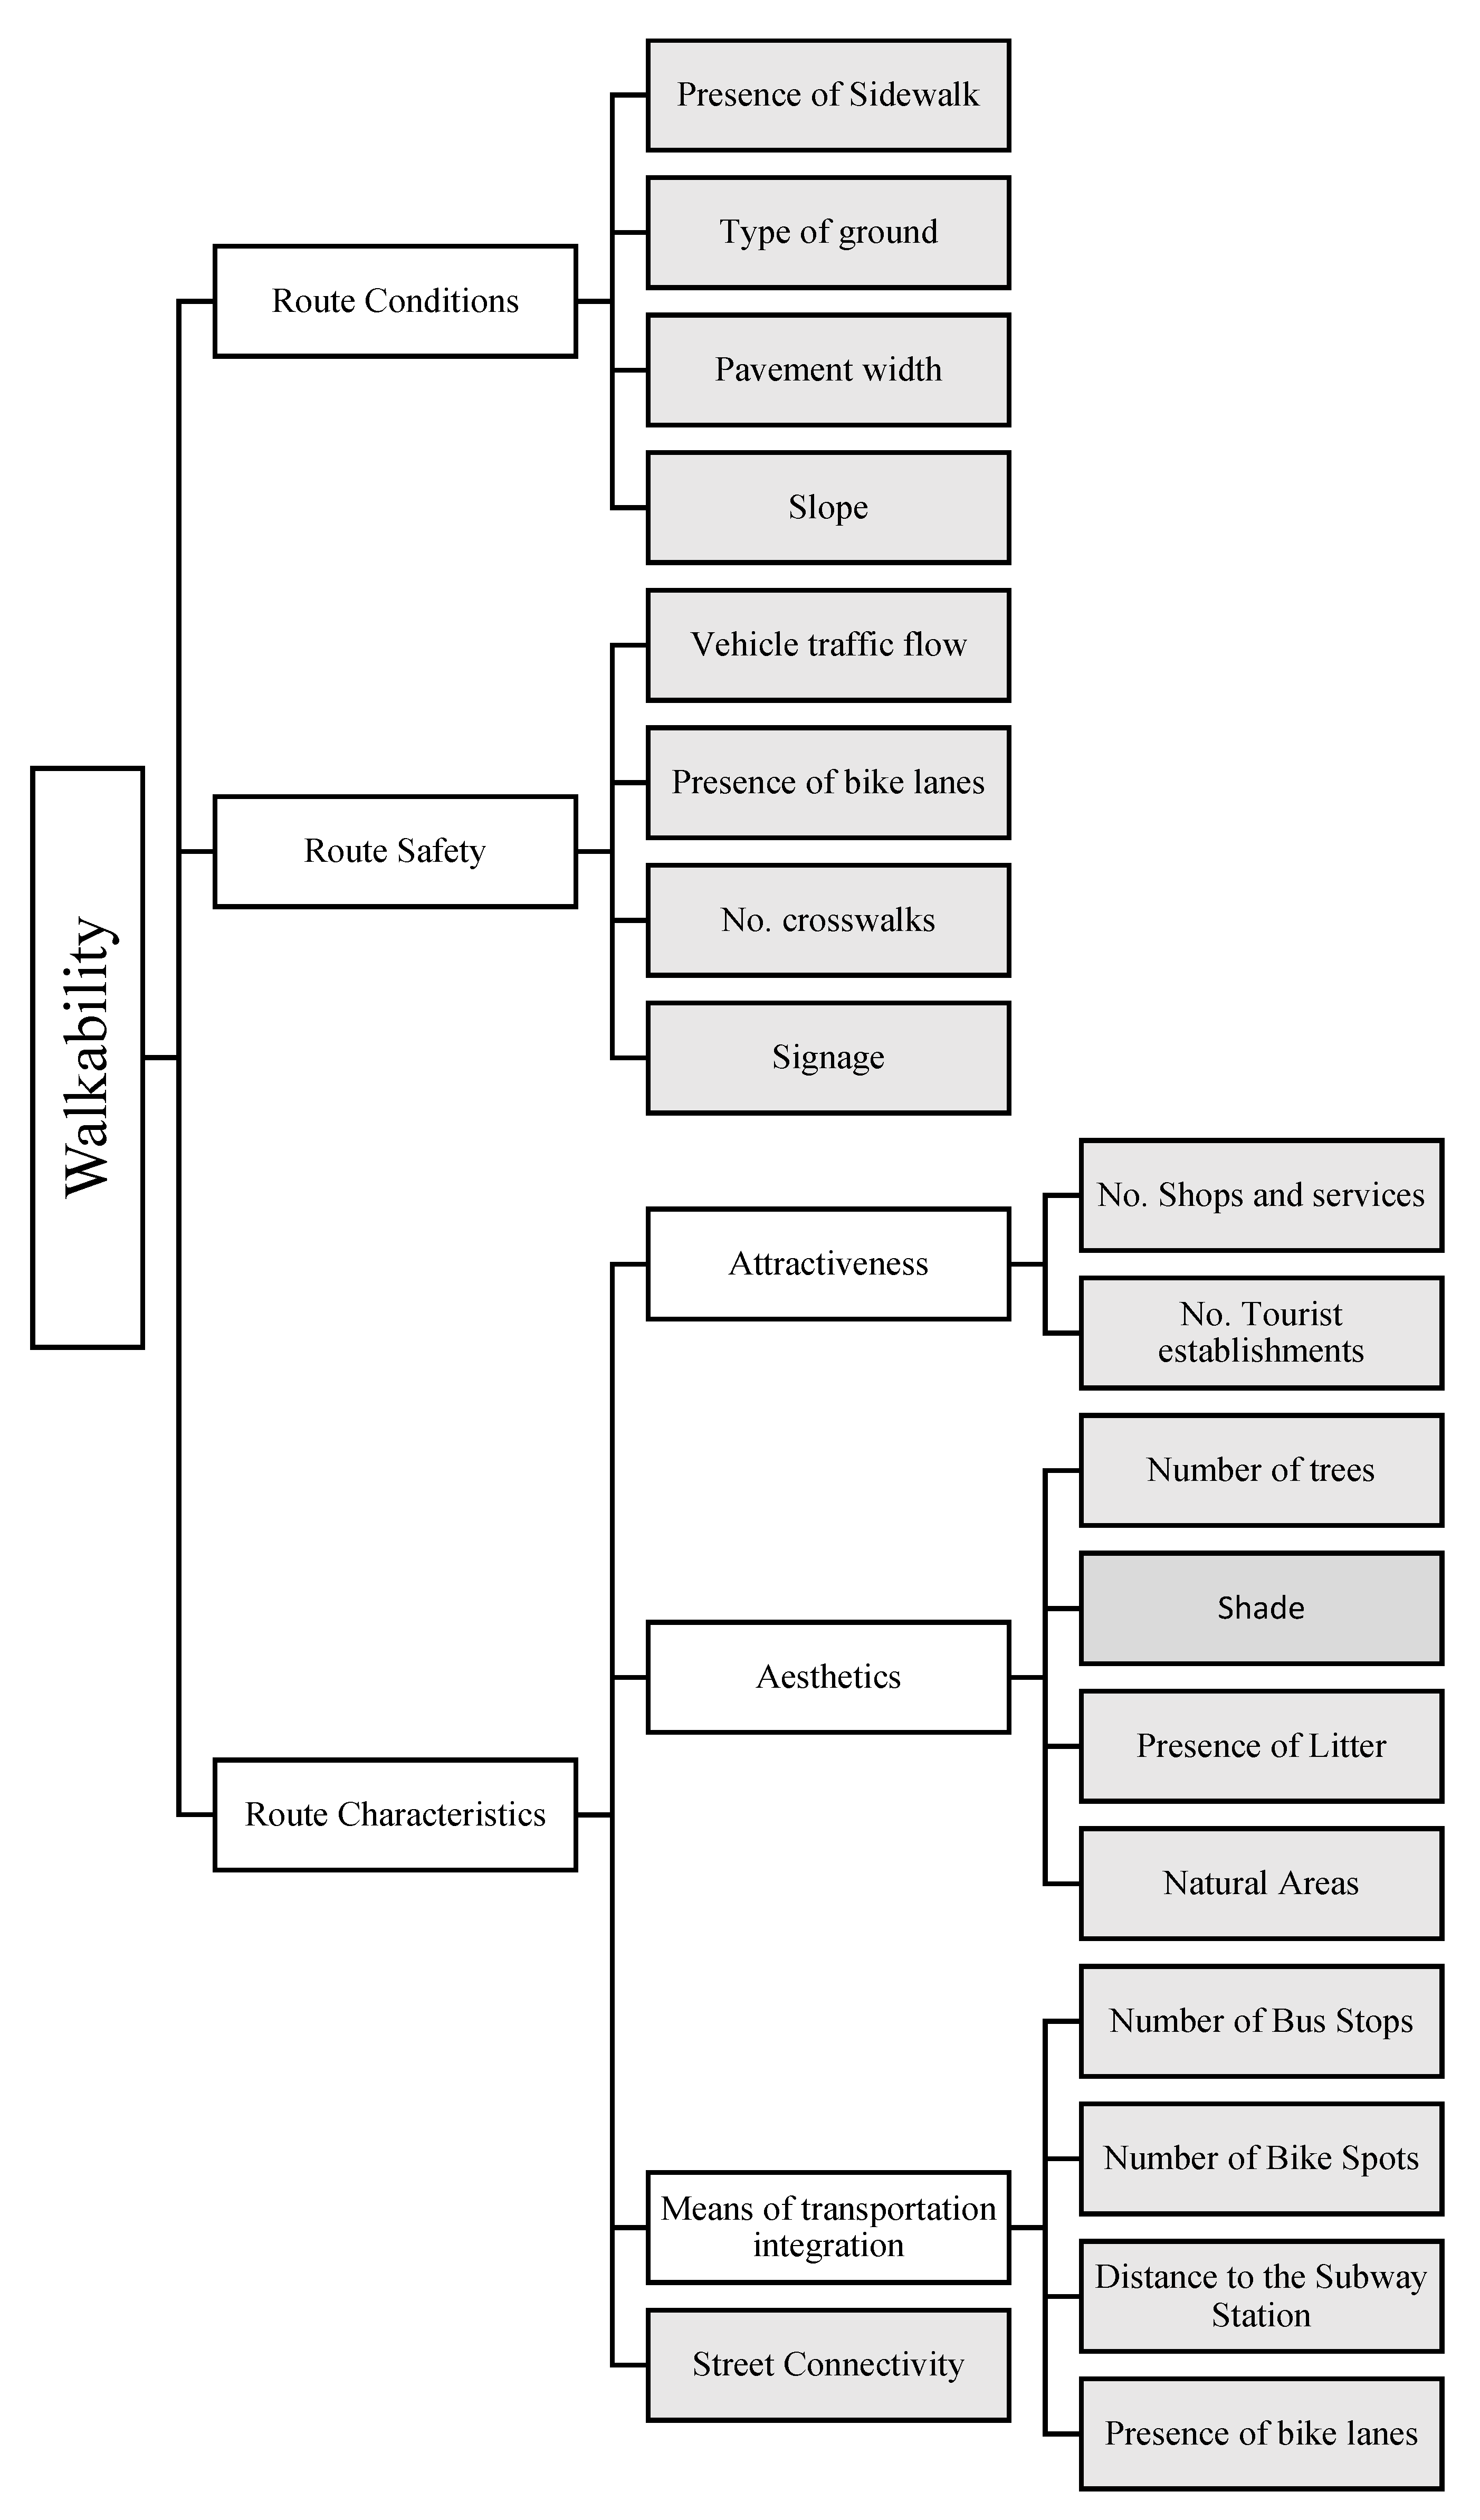
- Structuring the evaluation: The first phase of the analysis was dedicated to structuring the evaluation factors, namely the criteria and the alternatives. The 5Cs layout methodology was used as a base to choose the most important criteria for the study.
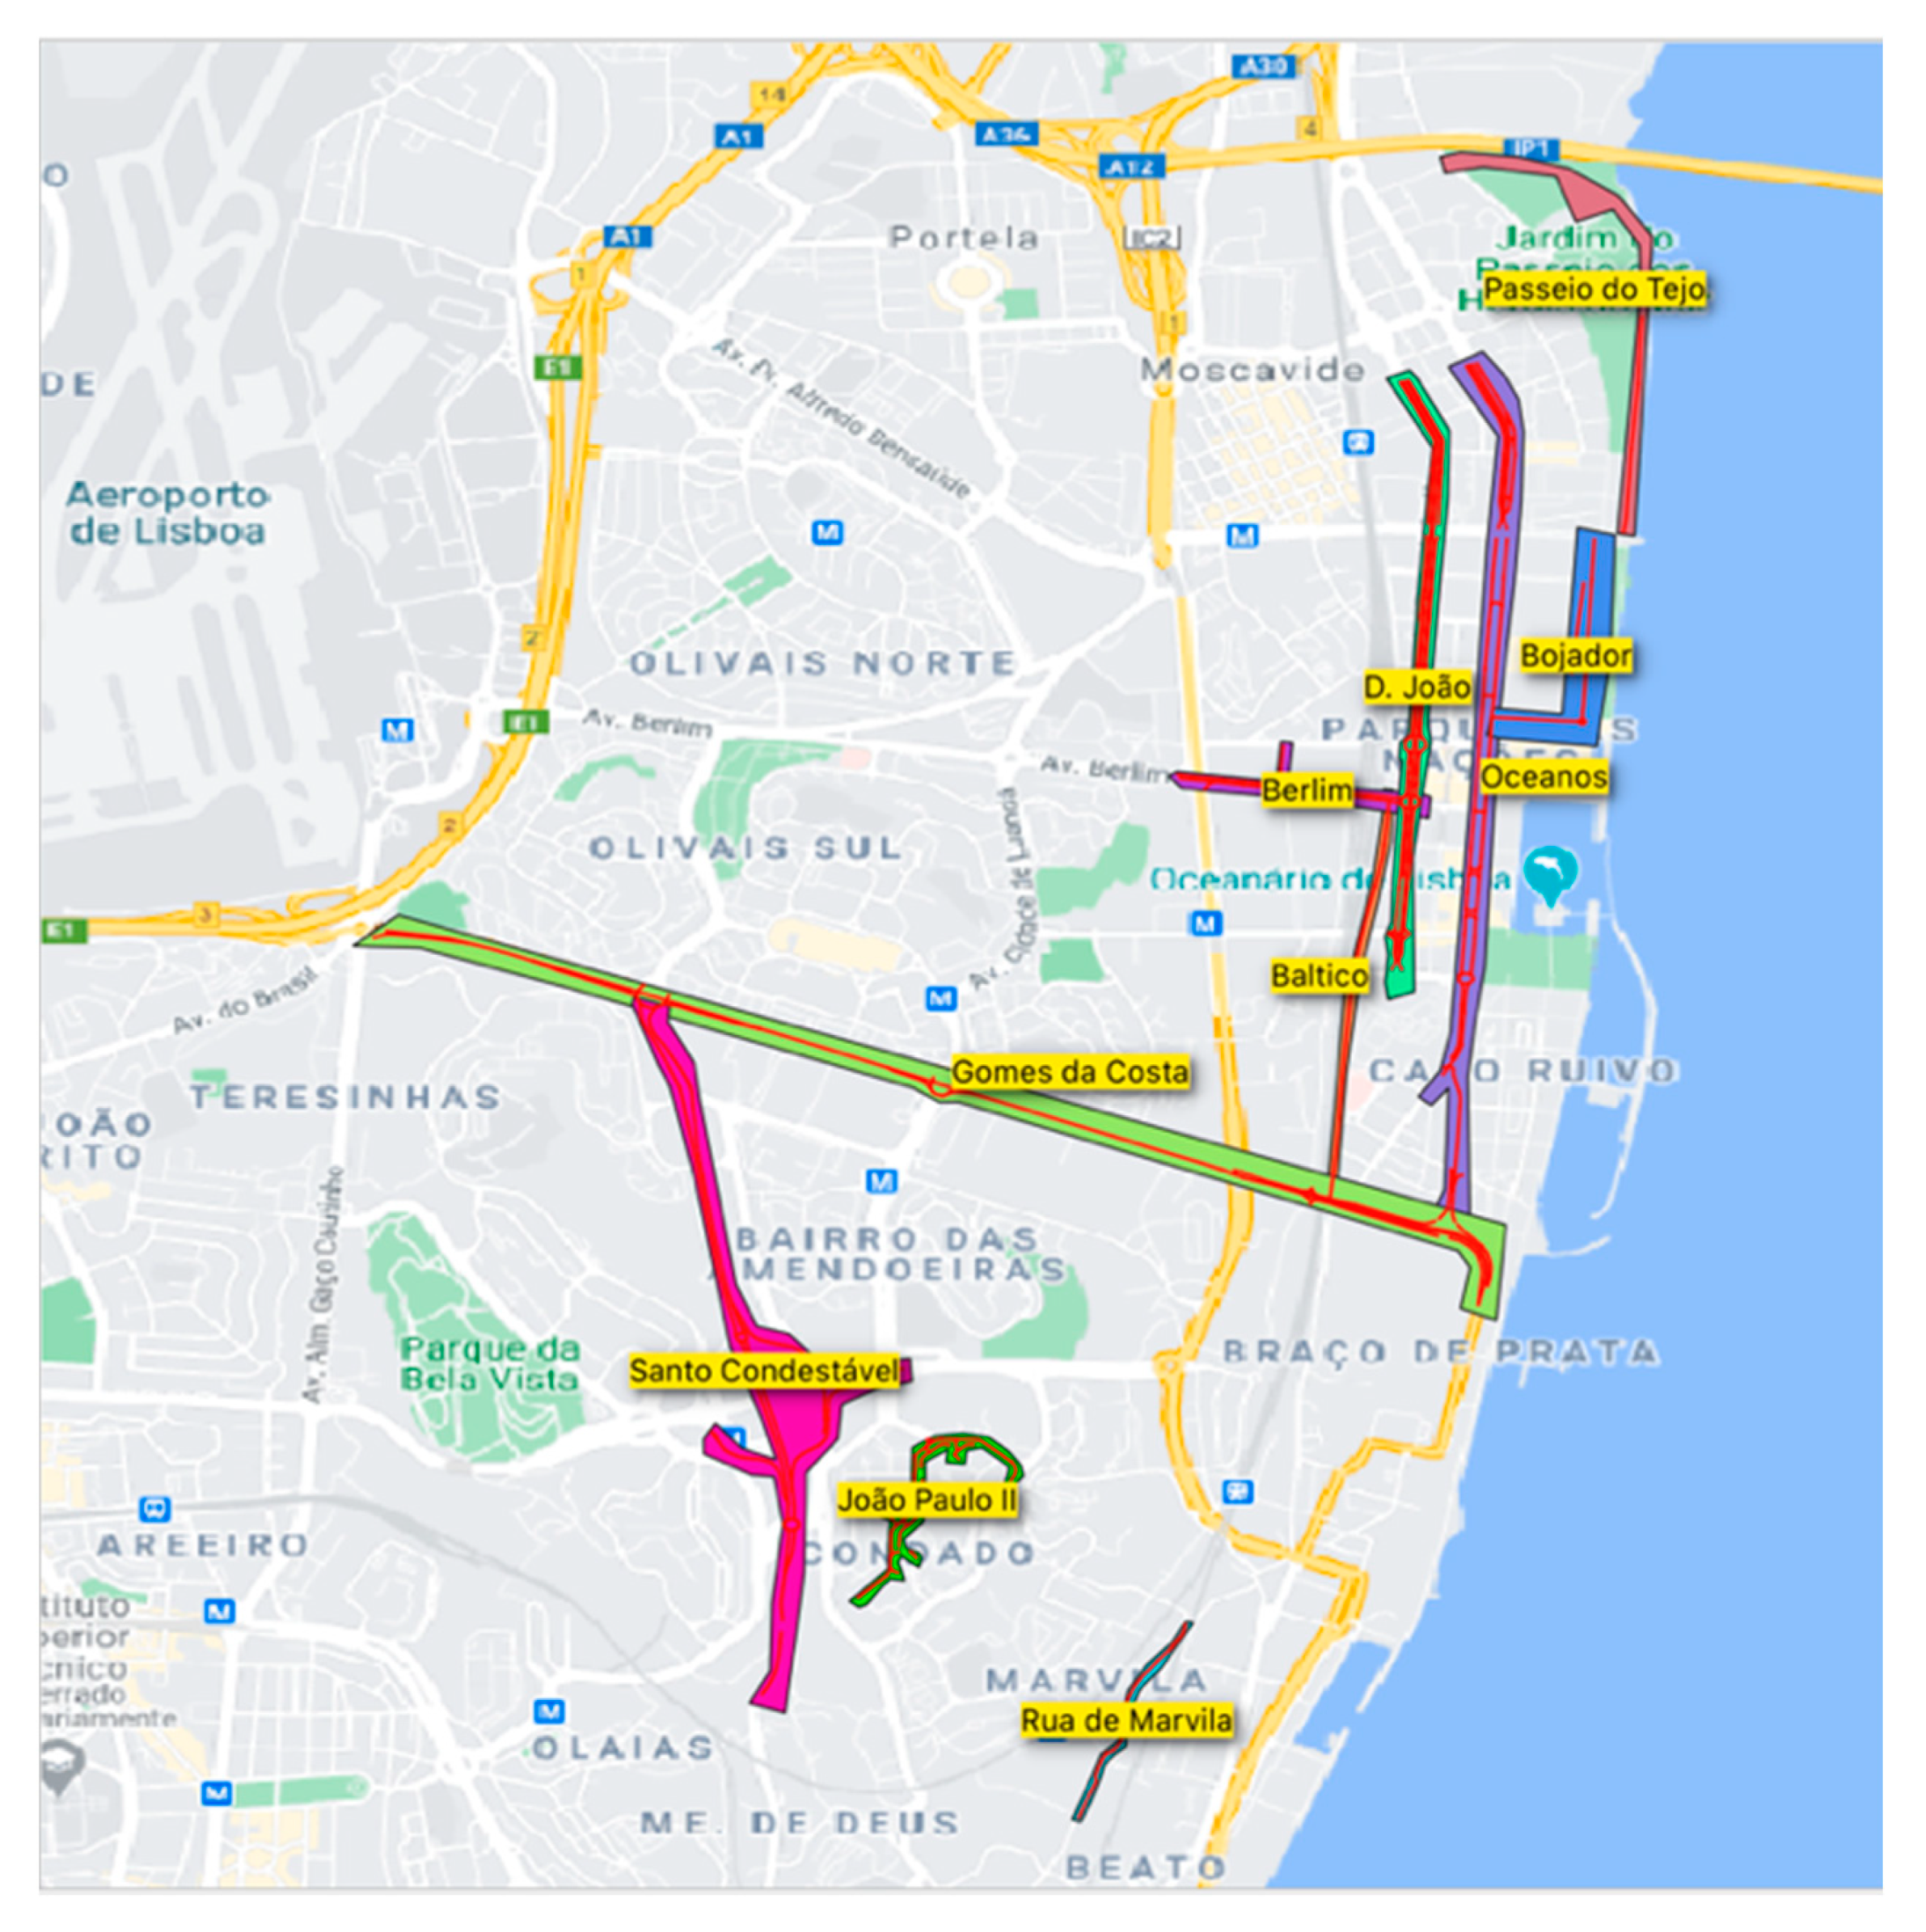
- Case study characterization: The second step was focused on characterizing the geographical scope and scale of the study area, as well as finding the data availability for the model. Roads located in the eastern zone of the city were selected.
- Data acquisition: An exhaustive search in official database sources (government, private companies, open-source applications) was carried out to obtain the most reliable data to run the MCDA and acquire sounder results.
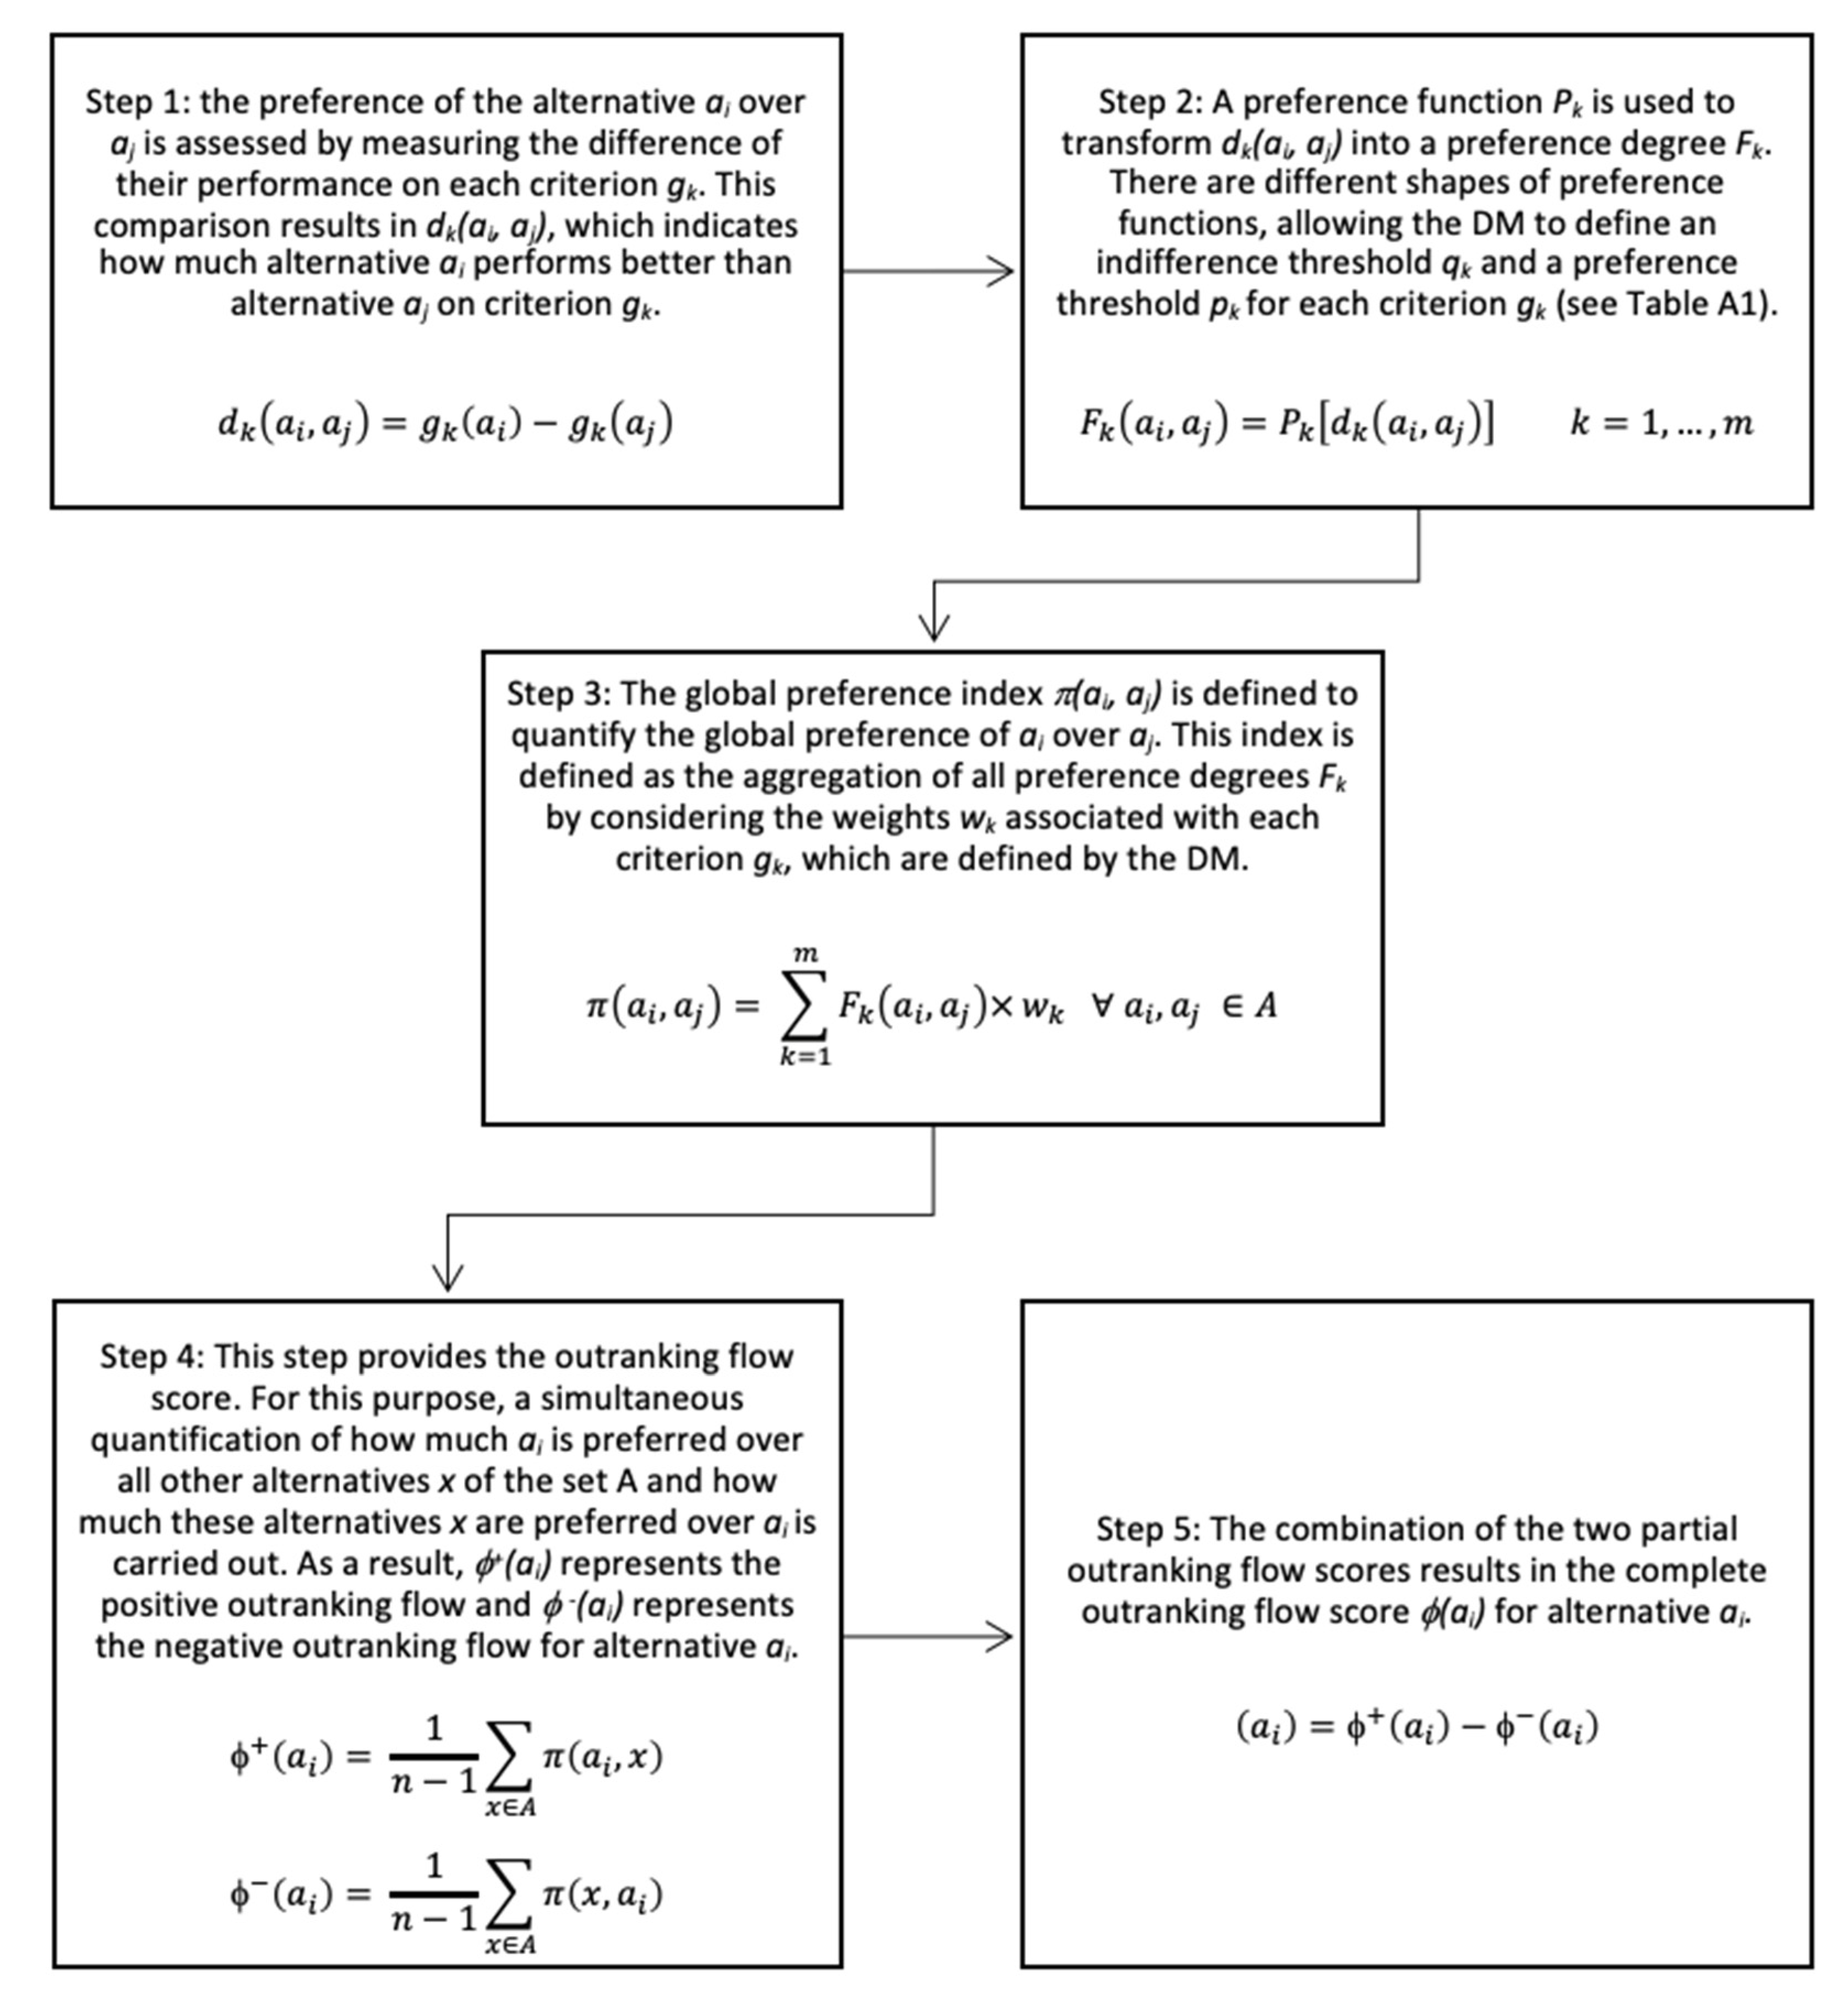
- MCDA implementation: This step was dedicated to developing the MCDA model and computational implementation (The Visual PROMETHEE Multicriteria Decision Aid software was used to obtain the results (www.promethee-gaia.net)).
- Results analysis: This step provided the generation of the PROMETHEE’s complete ranking of alternatives and the evaluation of the rankings to determine the best actions for the case study. Furthermore, suggestions for improvement in the area studied were introduced.
3.1. Evaluation Criteria
- Connectivity: for measuring how the footpath network connects to the main origins and destinations of the journey, as well as the extent of the connections between the different routes of the network. In our work, this factor is assessed by criteria regarding street connectivity.
- Convenience: for measuring the diversity of land uses and functions conveniently accessible on foot, or accessibility to other means of transport. In our work, this factor is assessed employing criteria regarding transport integration.
- Comfortability: for measuring how walking is accommodated to the capabilities and skills of all types of pedestrians. In our work, this factor is assessed by criteria regarding route conditions.
- Conviviality: for measuring the extent to which walking is a pleasant activity, in terms of interaction with people, the built and natural environment, and encompassing social and recreation activities. In our work, this factor is assessed by criteria regarding aesthetics and attractiveness.
- Conspicuousness: for measuring the extent to which walking routes and public spaces are discernible and inviting for pedestrians, in terms of clear and legible signage and information and in terms of spatial legibility, complexity, and coherence. In our work, this factor is assessed by criteria regarding route safety.
3.2. Alternatives
3.3. Data Acquisition
- Presence of sidewalk: This binary qualitative criterion describes the presence or absence of pedestrian sidewalks. Google Street View was used as an evaluation tool to observe the existence of pavement.
- Ground conditions: This qualitative criterion describes the quality of the project, construction, and pavement maintenance. The number of occurrences on the Minha Rua LX app concerning pavement conditions and maintenance in a timeframe of two years was carried out to assess it. In addition, Google Street View was used to assess the sidewalk conditions.
- Pavement width: This qualitative criterion evaluates how much effective pavement width is able for walking, considering the presence of obstacles (e.g., street furniture, lampposts). Google Street View was used as an evaluation tool to measure the sidewalk width. The qualitative scale represents the following measurements: Large (5 to 3 m), Medium (3 to 1 m), Narrow (1 to 0 m), Non-existent (0 m).
- Slope: This qualitative criterion evaluates the inclination of the route’s pavement. To assess it, open data provided by the Lisbon city council concerning the inclination of the streets were used. QGIS 3.14 (a free and open-source desktop geographic information system (GIS) application that supports viewing, editing, and analyzing geospatial data (https://qgis.org/en/site/)) software was used as a support-aid tool to assess the data and calculate the slope on the selected routes. The qualitative scale represents the following measurements: High (at least 50% of the route has more than 20 m slope), Medium (at least 90% of the route has less than 20 m slope), Flat (at least 90% of the route has less than 5 m slope).
- Vehicle traffic flow: This qualitative criterion evaluates the pedestrians’ sense of safety pertaining to the presence of high vehicle traffic flow. To assess it, data concerning the number of traffic jams during rush hours (8–11 a.m. and 6–9 p.m.), provided by Waze® and Google Street Maps, were analyzed. The qualitative scale represents the following measurements: High (at least more than 75% of traffic jams reported daily in the time period analyzed), Medium (at least 75% to 50% of traffic jams reported daily in the period), Low (at least less than 50% of traffic jams reported daily in the period).
- Number of crosswalks: This quantitative criterion evaluates the number of crosswalks in the route per square kilometer. Google Street View was used as an evaluation tool to measure the number of sidewalks. The data were divided by the area of each selected alternative in order to normalize the results.
- Signage: This qualitative criterion evaluates the pedestrians’ sense of safety due to the presence of signage. To determine it, open data from the Lisbon city council concerning the number of traffic signs and information posts in the area studied were collected. Additionally, occurrences on the Minha Rua LX app concerning roads and signage were taken into account.
- Presence of litter: This quantitative criterion evaluates the presence of litter on the route. The number of occurrences on the Minha Rua LX app concerning urban cleaning in a timeframe of two years was considered to determine it.
- Number of trees: This quantitative criterion evaluates the presence of trees on the route. Open data from the Lisbon city council concerning the number of trees in the studied area were used to determine it. The data were divided by the area of each selected alternative in order to normalize the results. QGIS 3.14 software was used as a support aid tool to assess and manipulate the data.
- Natural areas: This binary qualitative criterion evaluates the presence of natural areas (mainly parks) in the selected alternatives. To determine it, open data from the Lisbon city council concerning the location of parks in the city were collected.
- Shade: This quantitative criterion evaluates the total area of the street that is in shade throughout the day. A 3D model of the area studied was developed and ArcGIS Pro (a geographic information system application for working with maps and geographic information maintained by the Environmental Systems Research Institute (Esri)) software was used as a support tool to assess and acquire the data. The days with the most sunlight were selected to obtain the percentage of shade during the day. After setting the time period, the simulation was carried out to provide the shade incident during the day and its location. The percentage of the street falling into shade was calculated through this approach.
- Number of shops and services: This quantitative criterion evaluates the number of shops and services on the route (e.g., bakeries, markets, pharmacies, restaurants, bars). Open data from the Lisbon city council concerning the number of shops and services in the area studied were collected to determine it. The data were divided by the area of each selected alternative in order to normalize the results. QGIS 3.14 software was used as a support tool to assess and manipulate the data.
- Number of tourist establishments: This quantitative criterion evaluates the number of tourist establishments (e.g., museums, hotels, sightseeing spots, points of interest). To determine it, open data from the Lisbon city council concerning the number of tourist establishments in the area studied were collected. The data were divided by the area of each selected alternative in order to normalize the results. QGIS 3.14 software was used as a support tool to assess and manipulate the data.
- Bus stops: This quantitative criterion evaluates the presence of bus stops on the route. To determine it, open data from the Lisbon city council for the number of bus stops in the area studied were collected. The data were divided by the length of each selected alternative in order to normalize the results. QGIS 3.14 software was used as a support tool to assess and manipulate the data.
- Subway stations: This quantitative criterion evaluates the mean distance to a subway station. To determine it, open data from the Lisbon city council for the location of the subway stations were collected. The centroid of the routes was calculated to evaluate the distance to the nearest subway station, and the minimum distance from the centroid to the nearest station was measured. QGIS 3.14 software was used as a support tool to assess and manipulate the data.
- Bicycle-sharing stations: This quantitative criterion evaluates the presence of bicycle-sharing stations in the route. To determine it, data from GIRA (GIRA is the official Lisbon shared bicycle service provider) concerning the number of sharing stations in the area studied were collected. The data were divided by the area of each selected alternative in order to normalize the results. QGIS 3.14 software was used as a support tool to assess and manipulate the data.
- Bike lanes: This quantitative criterion evaluates the presence of bicycle lanes in the route. To determine it, open data from the Lisbon city council concerning the location and length of bike lanes in the area studied were collected. The data were divided by the total route length in order to obtain the percentage relationship of bike lanes in the selected alternatives. QGIS 3.14 software was used as a support tool to assess and manipulate the data.
- Street connectivity: This qualitative criterion describes how the footpath network connects to the main origins and destinations of the journey, as well as the extent of the connections between the different routes of the network. Google Street View was used as an evaluation tool to assess it.
4. Results
5. Discussion
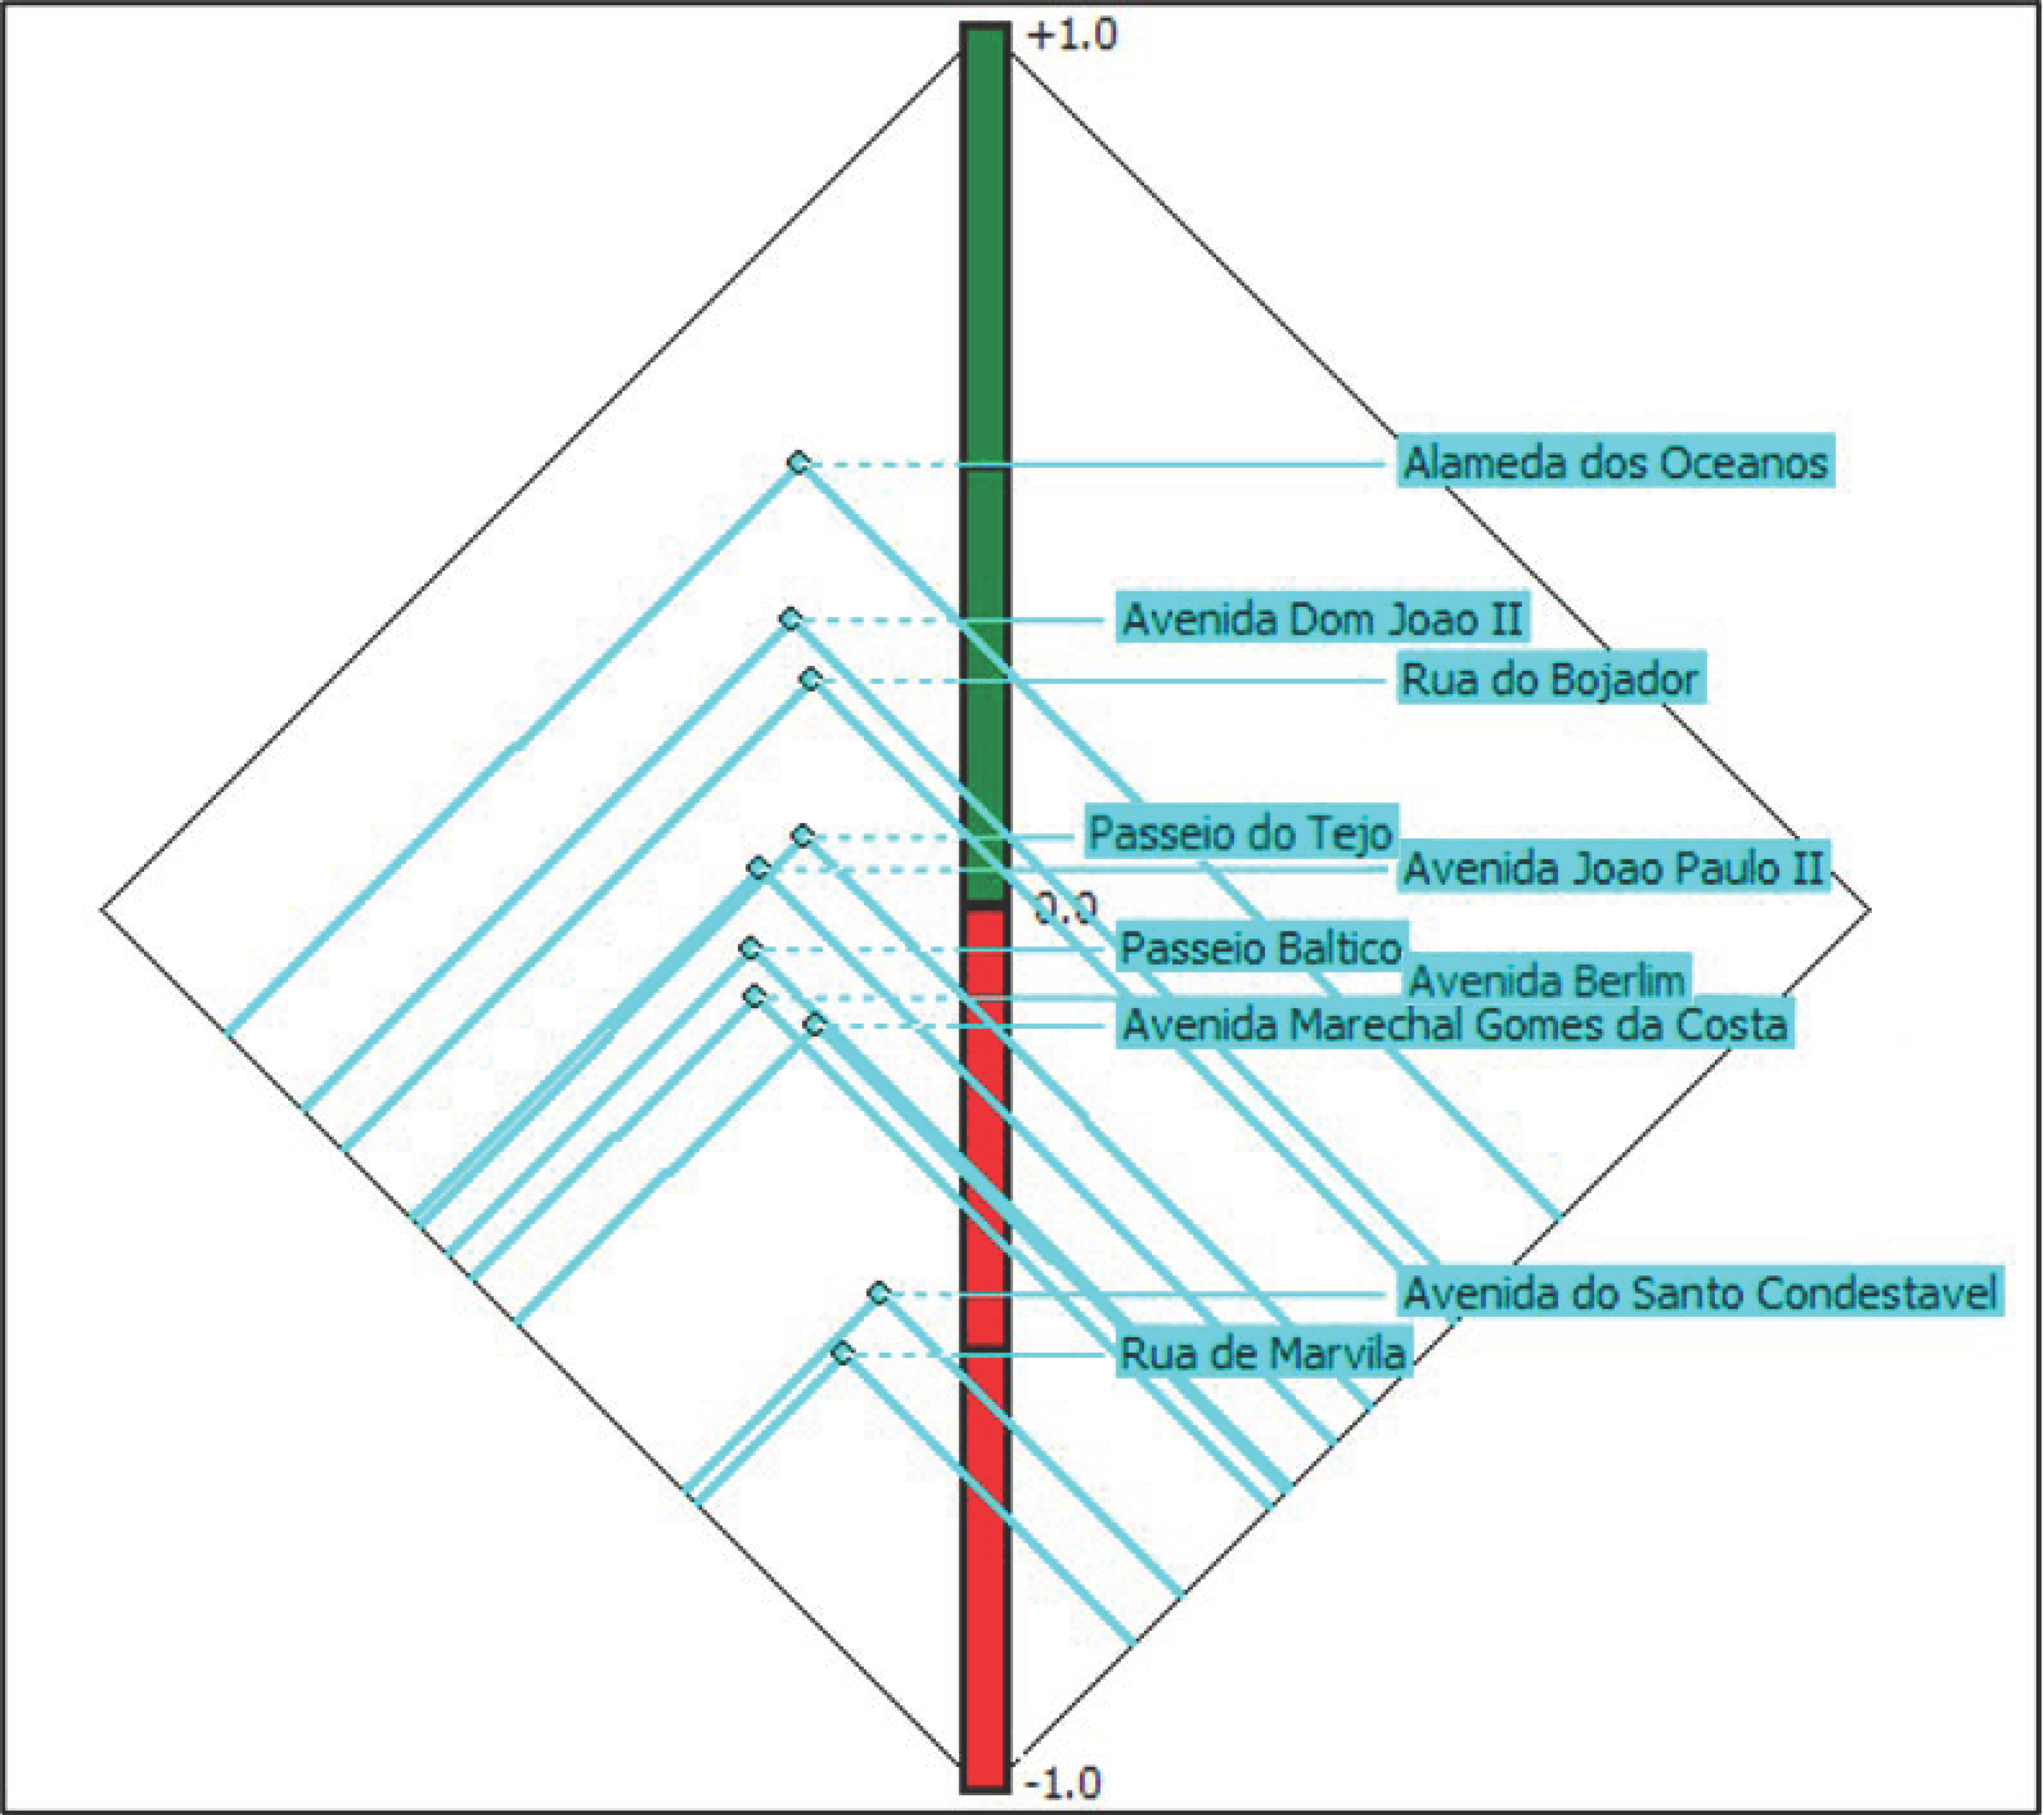
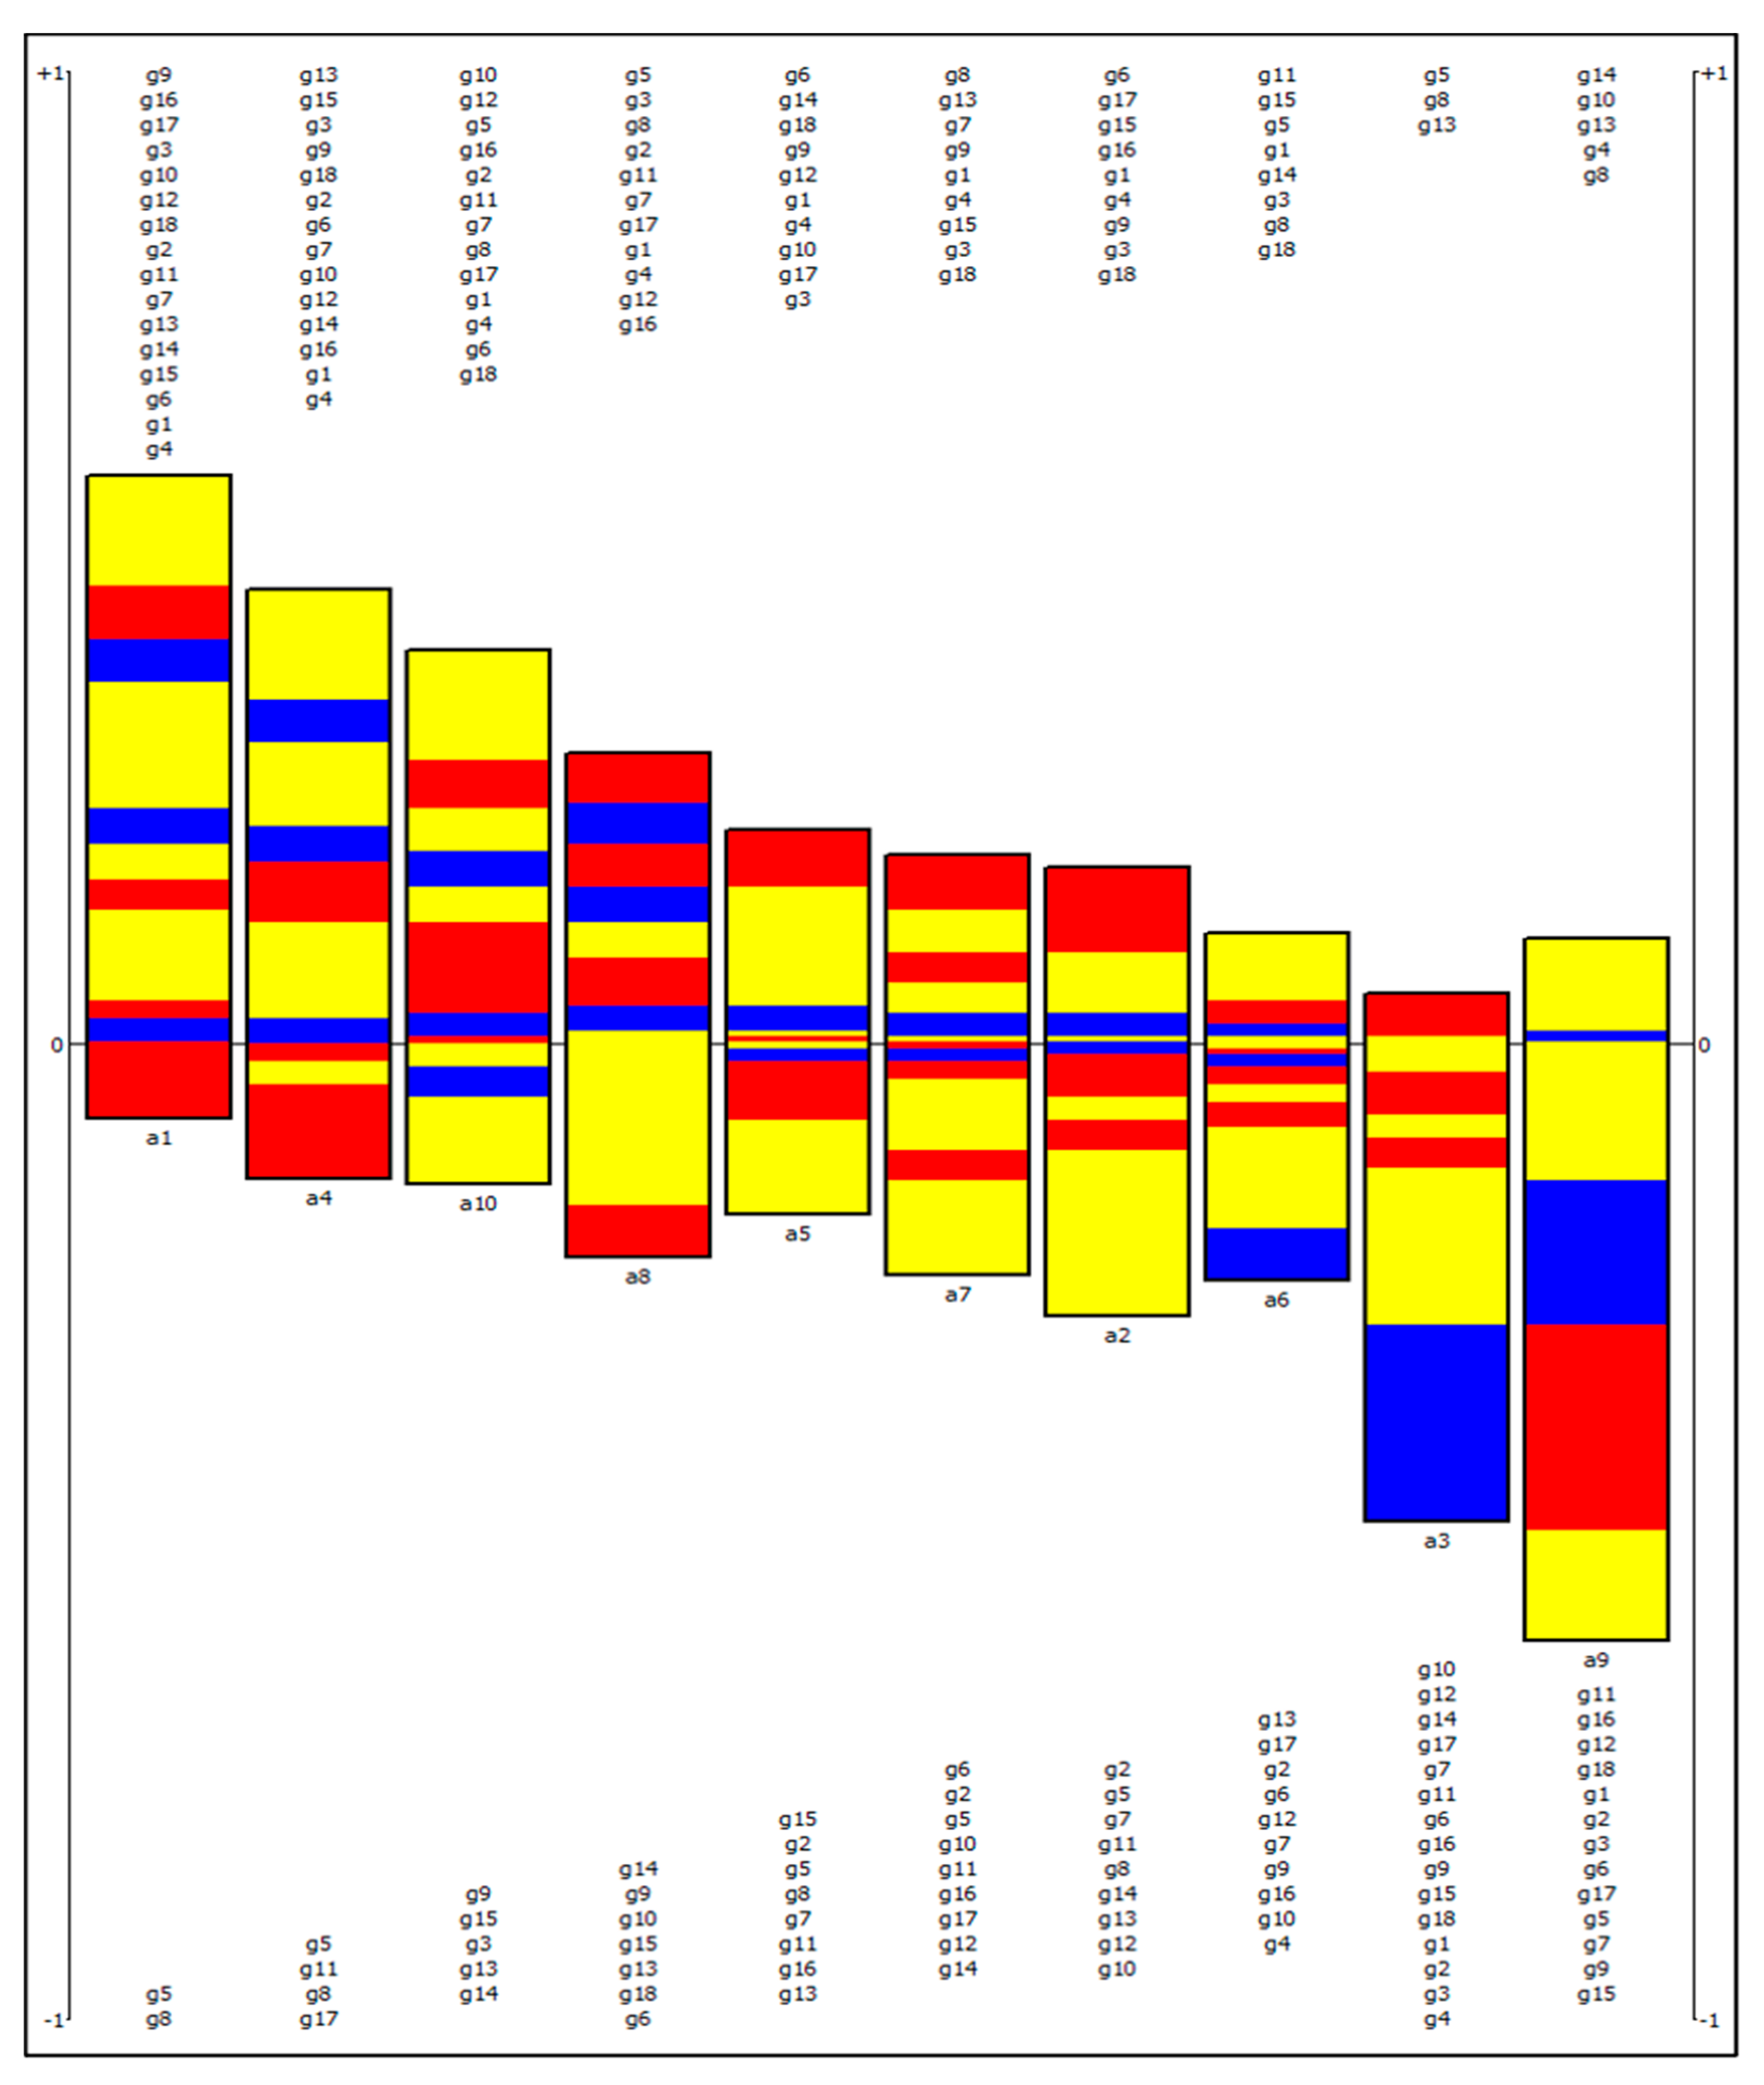
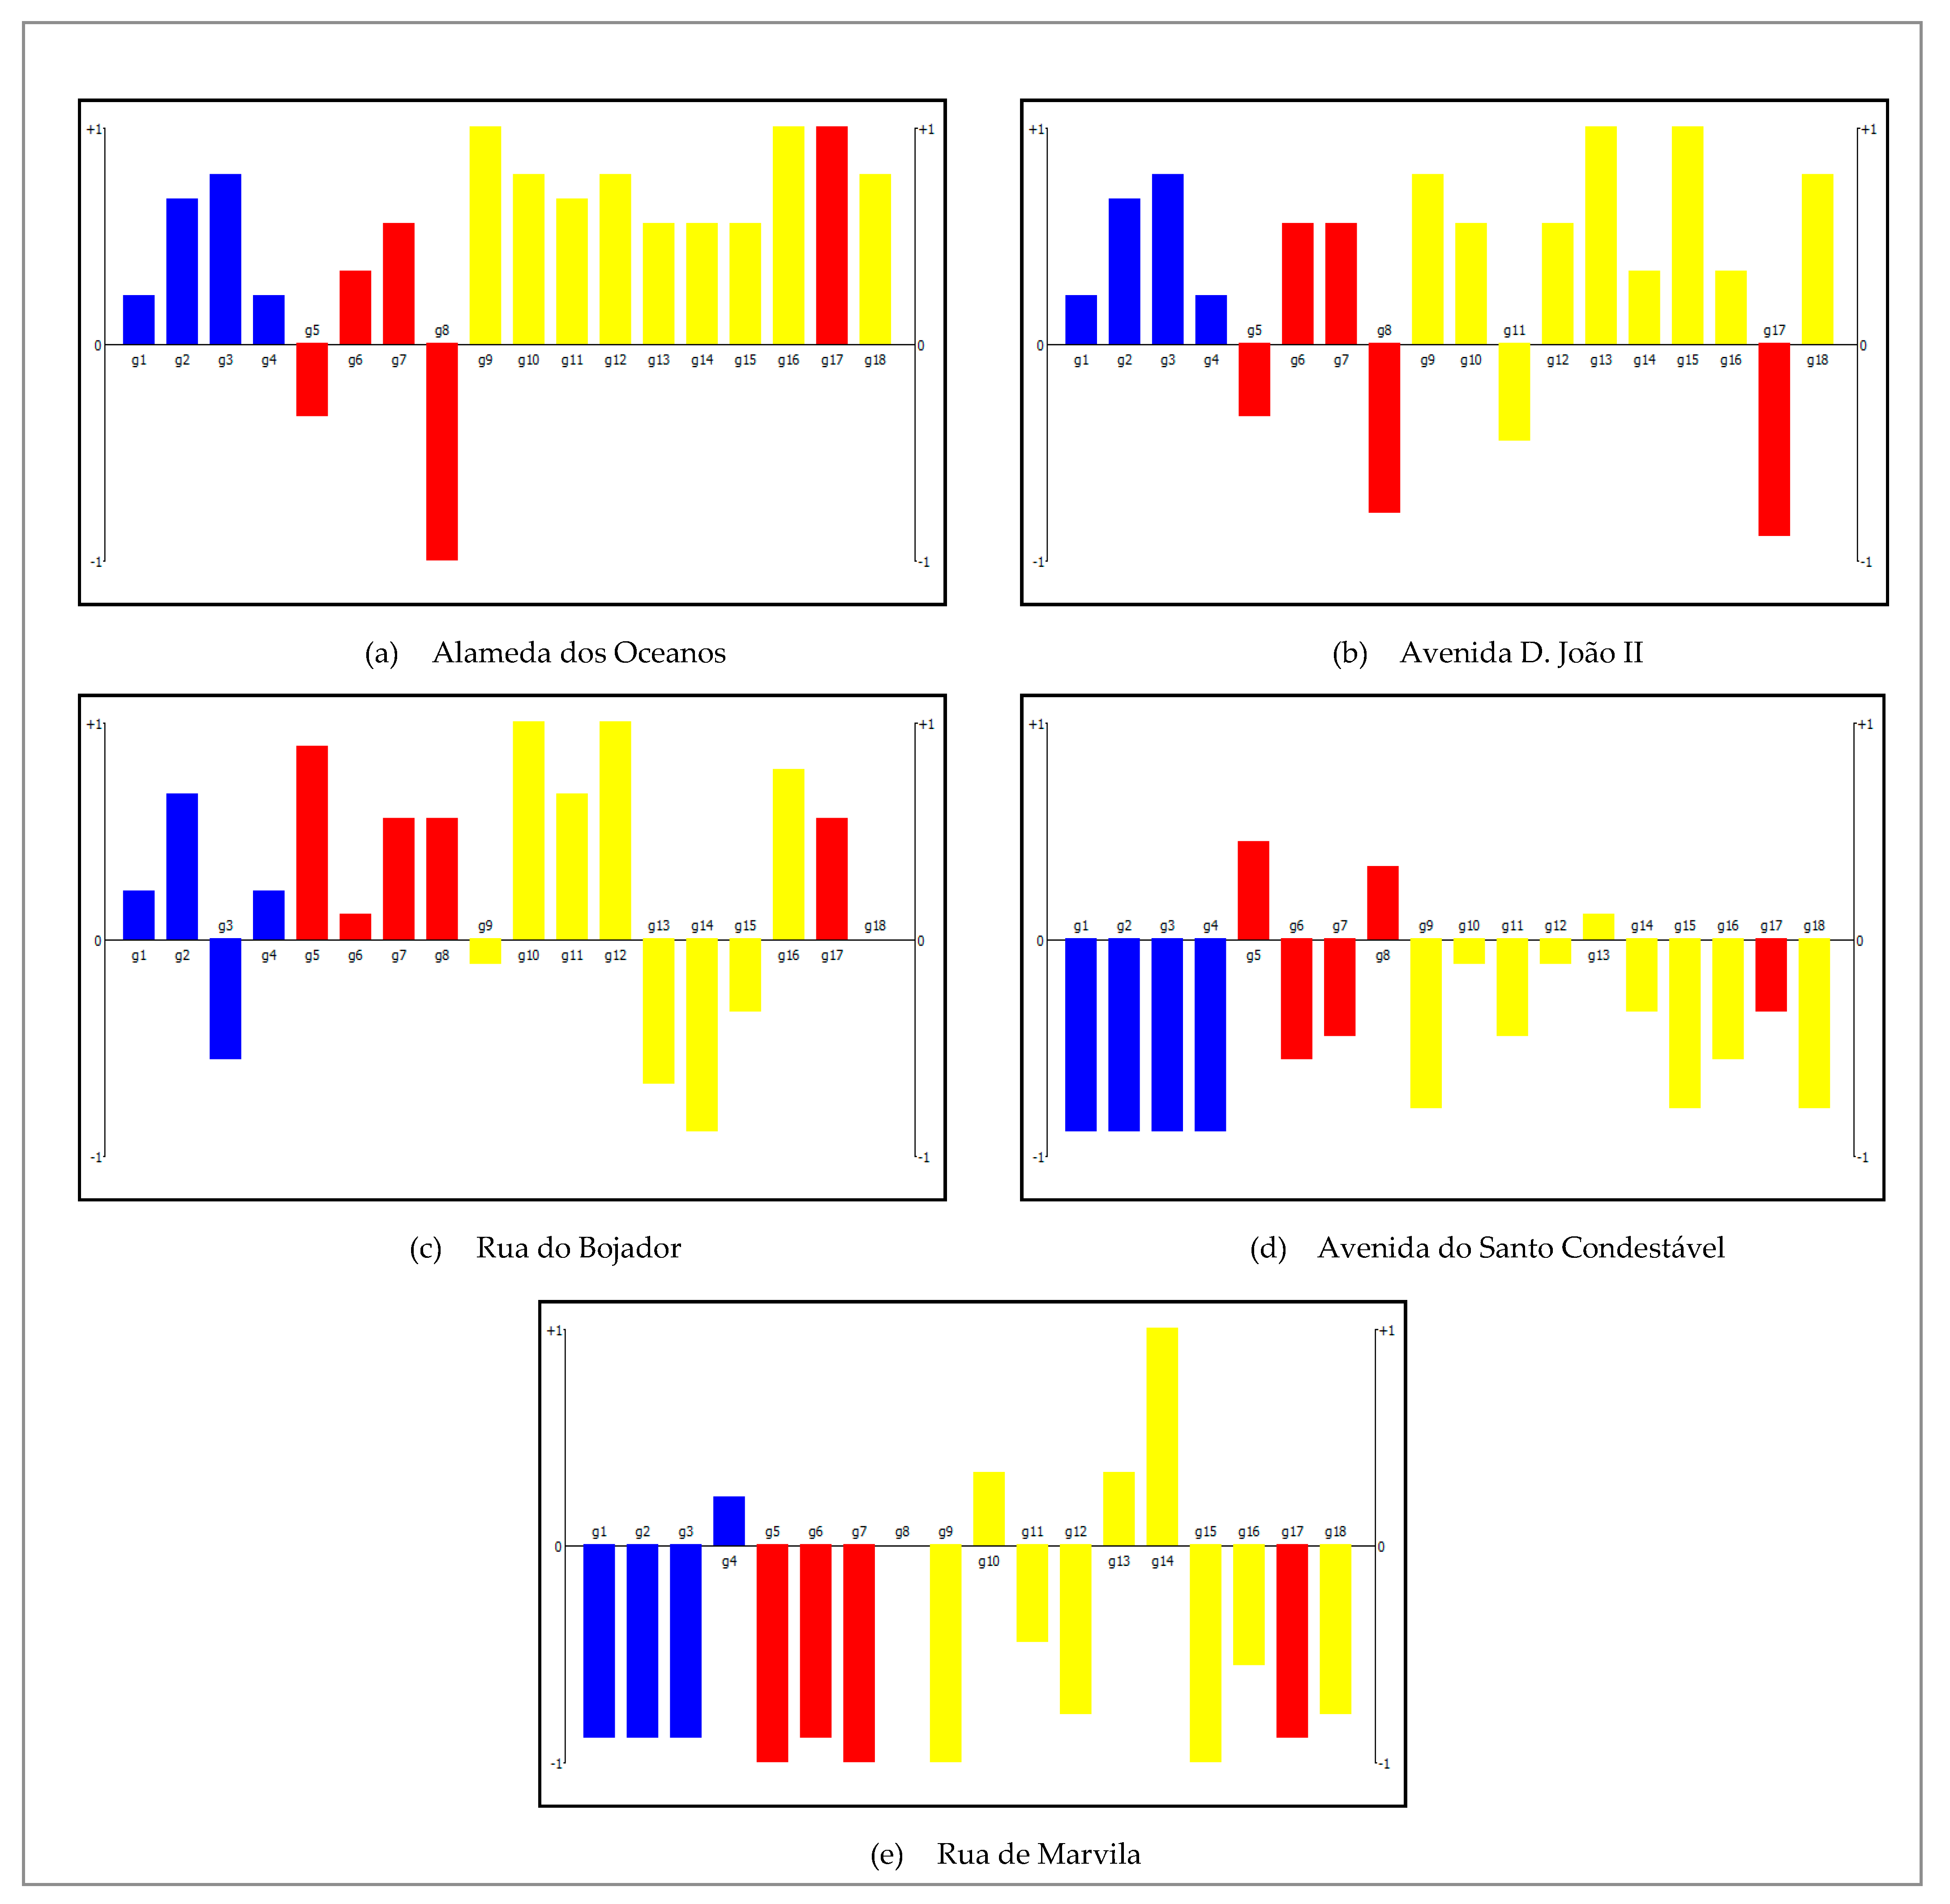
- Alameda dos Oceanos: The outcomes indicate that “Alameda dos Oceanos” has the best ranking among all alternatives. As can be seen in Figure 5, it has 16 strengths and only 2 weaknesses. This result is driven by its outstanding performance in all of the criteria evaluated. For instance, this alternative ranks first in 10 of 18 possible alternatives, representing 55% of the total. Furthermore, it is in second place in four criteria, which means that “Alameda dos Oceanos” performs in at least second place in 78% of all selected criteria. Figure 6 displays the action profile of this alternative. When analyzing the image, it becomes clear that improvements in the road to reduce the vehicle traffic flow (g5) during rush hours and the street’s cleanliness to avoid the presence of litter (g8) must be made.
- Avenida Dom João II: This avenue is in second place in the MCDA. This result is driven by its good performance in some criteria, performing in the first place in seven of 18 possible alternatives, representing 39% of the total. However, it can be noted that this alternative has four weaknesses. After analyzing Figure 6, some improvements are suggested to increase this alternative’s walkability. First, road improvements to reduce the vehicle traffic flow (g5) during rush hours could be made. The presence of litter (g8) also appears as a problem; therefore, the street’s cleanliness should be improved. A green area (e.g., park or square) could be constructed to improve this alternative’s aesthetics levels. This alternative presents only 3% of bike lanes in its extension; therefore, more bikeways could be added (g17).
- Rua do Bojador: This road appears just behind “Avenida D. João II,” i.e., in third place of the MCDA. This alternative is in first place in seven of 18 possible alternatives, representing 39% of the total. Concerning the weaknesses, it presents five (Figure 6). Some improvements are suggested to improve the alternative’s walkability. The sidewalk length could be extended by replacing parking spots by walkable routes (g3). Some parts of this street are treeless and thus more could be planted in the area (g9). More integration with bus transportation should be addressed (g14).
- Avenida do Santo Condestável: This avenue appears as the second-poorest ranked alternative among all. This result is driven by its poor performance in most of the criteria. This alternative is in the last place in seven of 18 possible alternatives, representing 39% of the total Figure 6 depicts the action profile of this alternative, which shows 14 weaknesses. More investment in infrastructure (g1, g2, g3, g4) must be made to improve this alternative’s walkability, since it performs poorly in all criteria related to the condition of the route. Sidewalks should be constructed to improve pedestrian walking quality (g1). This route’s pavement is also of bad quality, and a renovation must be done (g2). More signage (g6) and crosswalks (g7) must be implemented to improve pedestrian safety. More green areas could be incorporated to improve the number of trees (g9, g11) and the presence of shade (g10) in the area. More services could be incorporated into the area to improve pedestrian interest in the route. Finally, the integration with other means of transportation must be improved (g14, g15, g16), mainly buses.
- Rua de Marvila: This alternative appears as the poorest ranking. This result is driven by its poor performance in most of the criteria. This alternative is in last place in 13 of 18 possible alternatives, representing 72% of the total. Many changes must be made to improve the area’s walkability, including for instance, infrastructure investment (installation of sidewalks, signage, maintenance) and integration with other means of transportation. This result is more critical for the reason that this alternative is located in a residential area. Figure 6 shows the action profile of this alternative, which has 13 weaknesses. Despite all of the problems mentioned, it is important to highlight that this alternative has the best performance in terms of bus-stop density (g14); otherwise, the overall performance would be even poorer.
6. Conclusions
Author Contributions
Funding
Institutional Review Board Statement
Informed Consent Statement
Data Availability Statement
Conflicts of Interest
Appendix A
| Generalized Criterion | Definition | Parameters |
|---|---|---|
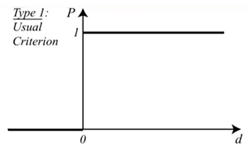 | - | |
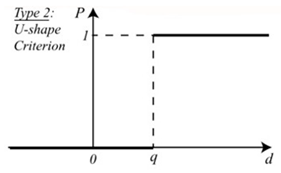 | ||
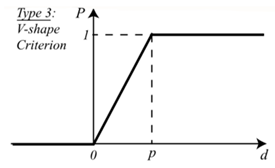 | ||
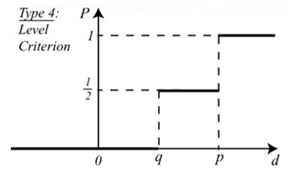 | , | |
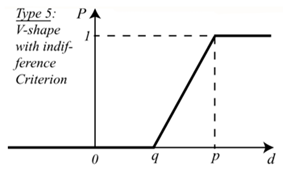 | , | |
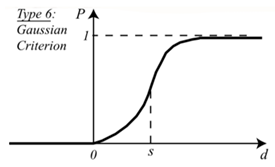 |
References
- Talen, E. Pedestrian access as a measure of urban quality. Plan. Pract. Res. 2002, 17, 257–278. [Google Scholar] [CrossRef]
- Cutini, V.; Di Pinto, V.; Rinaldi, A.M.; Rossini, F. Proximal cities: Does walkability drive informal settlements? Sustainability 2020, 12, 756. [Google Scholar] [CrossRef]
- Rogers, S.H.; Halstead, J.M.; Gardner, K.H.; Carlson, C.H. Examining Walkability and Social Capital as Indicators of Quality of Life at the Municipal and Neighborhood Scales. Appl. Res. Qual. Life 2011, 6, 201–213. [Google Scholar] [CrossRef]
- Kato, H. Effect of walkability on urban sustainability in the Osaka metropolitan fringe area. Sustainability 2020, 12, 9248. [Google Scholar] [CrossRef]
- Rebecchi, A.; Buffoli, M.; Dettori, M.; Appolloni, L.; Azara, A.; Castiglia, P.; D’Alessandro, D.; Capolongo, S. Walkable environments and healthy urban moves: Urban context features assessment framework experienced in Milan. Sustainability 2019, 11, 2778. [Google Scholar] [CrossRef]
- Eynard, E.; Santangelo, M.; Tabasso, M. Smart City—Planning for Energy, Transportation and Sustainability of the Urban System. In Proceedings of the 8th International Conference INPUT, Naples, Italy, 4–6 June 2014; pp. 365–375. [Google Scholar]
- Gilderbloom, J.I.; Riggs, W.W.; Meares, W.L. Does walkability matter? An examination of walkability’s impact on housing values, foreclosures and crime. Cities 2015, 42, 13–24. [Google Scholar] [CrossRef]
- Kim, E.J.; Kim, H. Neighborhood walkability and housing prices: A correlation study. Sustainability 2020, 12, 593. [Google Scholar] [CrossRef]
- Washington, E. Role of walkability in driving home values. Leadersh. Manag. Eng. 2013, 13, 123–130. [Google Scholar] [CrossRef]
- Pivo, G.; Fisher, J.D. The walkability premium in commercial real estate investments. Real Estate Econ. 2011, 39, 185–219. [Google Scholar] [CrossRef]
- Campisi, T.; Basbas, S.; Skoufas, A.; Akgün, N.; Ticali, D.; Tesoriere, G. The impact of covid-19 pandemic on the resilience of sustainable mobility in Sicily. Sustainability 2020, 12, 8829. [Google Scholar] [CrossRef]
- Saelens, B.E.; Handy, S.L. Built environment correlates of walking: A review. Med. Sci. Sports Exerc. 2008, 40, S550. [Google Scholar] [CrossRef] [PubMed]
- Gondauri, D.; Batiashvili, M. The study of the effects of mobility trends on the statistical models of the covid-19 virus spreading. Electron. J. Gen. Med. 2020, 17, em243. [Google Scholar] [CrossRef]
- Litman, T.A. Economic Value of Walkability. Transp. Res. Rec. 2003, 1828, 3–11. [Google Scholar] [CrossRef]
- Burden, D. Building communities with transportation. Transp. Res. Rec. 2001, 1773, 5–20. [Google Scholar] [CrossRef]
- Leslie, E.; Saelens, B.; Frank, L.; Owen, N.; Bauman, A.; Coffee, N.; Hugo, G. Residents’ perceptions of walkability attributes in objectively different neighbourhoods: A pilot study. Health Place 2005, 11, 227–236. [Google Scholar] [CrossRef]
- Ewing, R.; Handy, S. Measuring the unmeasurable: Urban design qualities related to walkability. J. Urban Des. 2009, 14, 65–84. [Google Scholar] [CrossRef]
- Lo, R.H. Walkability: What is it? J. Urban. 2009, 2, 145–166. [Google Scholar] [CrossRef]
- Eynard, E.; Melis, G.; Tabasso, M. Walkable Urban Environments for Wellbeing: An Analysis of Walkability in the City of Torino. Int. J. Urban Plan. Smart Cities 2020, 1. [Google Scholar] [CrossRef]
- Hall, C.M.; Ram, Y. Walk score® and its potential contribution to the study of active transport and walkability: A critical and systematic review. Transp. Res. Part D Transp. Environ. 2018, 61, 310–324. [Google Scholar] [CrossRef]
- Lefebvre-Ropars, G.; Morency, C.; Singleton, P.A.; Clifton, K.J. Spatial transferability assessment of a composite walkability index: The Pedestrian Index of the Environment (PIE). Transp. Res. Part D Transp. Environ. 2017, 57, 378–391. [Google Scholar] [CrossRef]
- Zegras, C. The built environment and motor vehicle ownership and use: Evidence from Santiago de Chile. Urban Stud. 2010, 47, 1793–1817. [Google Scholar] [CrossRef]
- Vincke, P. Multicriteria decision-aid. J. Multi Criteria Decis. Anal. 1994, 3, 131. [Google Scholar] [CrossRef]
- Munda, G. Multiple Criteria Decision Analysis: State of the Art Surveys; Springer: New York, NY, USA, 2005; Volume 78, ISBN 0-387-23067-X. [Google Scholar]
- Roy, B. Paradigms and challenges. Int. Ser. Oper. Res. Manag. Sci. 2016, 233, 19–39. [Google Scholar] [CrossRef]
- Doan, N.A.V.; De Smet, Y. An alternative weight sensitivity analysis for PROMETHEE II rankings. Omega 2018, 80, 166–174. [Google Scholar] [CrossRef]
- Campos, A.C.S.M.; Mareschal, B.; De Almeida, A.T. Fuzzy FlowSort: An integration of the FlowSort method and Fuzzy Set Theory for decision making on the basis of inaccurate quantitative data. Inf. Sci. 2015, 293, 115–124. [Google Scholar] [CrossRef]
- Calders, T.; Van Assche, D. PROMETHEE is not quadratic: An O(qnlog(n)) algorithm. Omega 2018, 76, 63–69. [Google Scholar] [CrossRef]
- Roy, B. The Outranking Approach and the Foundations of ELECTRE Methods. In Readings in Multiple Criteria Decision Aid; Springer: Berlin/Heidelberg, Germany, 1990; pp. 155–183. [Google Scholar]
- Bouyssou, D.; Vincke, P. Ranking alternatives on the basis of preference relations: A progress report with special emphasis on outranking relations. J. Multi-Criteria Decis. Anal. 1997, 6, 77–85. [Google Scholar] [CrossRef]
- Kim, E.J.; Won, J.; Kim, J. Is Seoul walkable? Assessing a walkability score and examining its relationship with pedestrian satisfaction in Seoul, Korea. Sustainability 2019, 11, 6915. [Google Scholar] [CrossRef]
- Liao, B.; van den Berg, P.E.W.; van Wesemael, P.J.V.; Arentze, T.A. Empirical analysis of walkability using data from the Netherlands. Transp. Res. Part D Transp. Environ. 2020, 85, 102390. [Google Scholar] [CrossRef]
- Dovey, K.; Pafka, E. What is walkability? The urban DMA. Urban Stud. 2020, 57, 93–108. [Google Scholar] [CrossRef]
- Lamíquiz, P.J.; López-Domínguez, J. Effects of built environment on walking at the neighbourhood scale. A new role for street networks by modelling their configurational accessibility? Transp. Res. Part A Policy Pract. 2015, 74, 148–163. [Google Scholar] [CrossRef]
- Gori, S.; Nigro, M.; Petrelli, M. Walkability indicators for pedestrian-friendly design. Transp. Res. Rec. 2014, 2464, 38–45. [Google Scholar] [CrossRef]
- Hall, C.M.; Ram, Y. Measuring the relationship between tourism and walkability? Walk Score and English tourist attractions. J. Sustain. Tour. 2019, 27, 223–240. [Google Scholar] [CrossRef]
- Distefano, N.; Pulvirenti, G.; Leonardi, S. Neighbourhood walkability: Elderly’s priorities. Res. Transp. Bus. Manag. 2020, 100547. [Google Scholar] [CrossRef]
- Kim, E.J.; Kim, Y.J. A Reliability check of walkability indices in Seoul, Korea. Sustainability 2020, 12, 176. [Google Scholar] [CrossRef]
- Pelegrina, G.D.; Duarte, L.T.; Romano, J.M.T. Application of independent component analysis and TOPSIS to deal with dependent criteria in multicriteria decision problems. Expert Syst. Appl. 2019, 122, 262–280. [Google Scholar] [CrossRef]
- Naharudin, N.; Salleh, A.H.; Halim, M.A.; Latif, Z.A. Conceptual Framework for Walkability Assessment for Pedestrian Access to Rail Transit Services by using Spatial-MCDA. IOP Conf. Ser. Earth Environ. Sci. 2020, 540, 012023. [Google Scholar] [CrossRef]
- Ruiz-Padillo, A.; Pasqual, F.M.; Larranaga Uriarte, A.M.; Cybis, H.B.B. Application of multi-criteria decision analysis methods for assessing walkability: A case study in Porto Alegre, Brazil. Transp. Res. Part D Transp. Environ. 2018, 63, 855–871. [Google Scholar] [CrossRef]
- Fancello, G.; Congiu, T.; Tsoukiàs, A. Mapping walkability. A subjective value theory approach. Socioecon. Plann. Sci. 2020, 72, 100923. [Google Scholar] [CrossRef]
- Moura, F.; Cambra, P.; Gonçalves, A.B. Measuring walkability for distinct pedestrian groups with a participatory assessment method: A case study in Lisbon. Landsc. Urban Plan. 2017, 157, 282–296. [Google Scholar] [CrossRef]
- Alshareef, F.; Aljoufie, M. Identification of the proper criteria set for neighborhood walkability using the fuzzy analytic hierarchy process model: A case study in Jeddah, Saudi Arabia. Sustainability 2020, 12, 9286. [Google Scholar] [CrossRef]
- Keeney, R.L.; Raiffa, H. Decisions with Multiple Objectives–Preferences and Value Tradeoffs; Cambridge University Press: Cambridge, UK; New York, NY, USA, 1994; Volume 39. [Google Scholar]
- De Smet, Y. Beyond Multicriteria Ranking Problems: The Case of PROMETHEE. In New Perspectives in Multiple Criteria Decision Making; Doumpos, M., Rui Figueira, J., Greco, S., Zopounidis, C., Eds.; Springer: Cham, Switzerland, 2019; pp. 95–115. ISBN 978-3-030-11481-7. [Google Scholar]
| Ref. | Alternative | Zone | Area (km2) |
|---|---|---|---|
| a1 | Alameda dos Oceanos | Parque das Nações | 0.2173 |
| a2 | Avenida de Berlim | Parque das Nações | 0.0428 |
| a3 | Avenida do Santo Condestável | Marvila | 0.2508 |
| a4 | Avenida Dom João II | Parque das Nações | 0.1225 |
| a5 | Avenida João Paulo II | Marvila | 0.0458 |
| a6 | Avenida Marechal Gomes da Costa | Marvila | 0.3193 |
| a7 | Passeio Báltico | Parque das Nações | 0.0383 |
| a8 | Passeio do Tejo | Parque das Nações | 0.0616 |
| a9 | Rua de Marvila | Marvila | 0.0175 |
| a10 | Rua do Bojador | Parque das Nações | 0.0889 |
| Ref. | Attribute | Description | Unit | Source |
|---|---|---|---|---|
| g1 | Presence of sidewalk | Presence of sidewalk on the route. | Y/N | Google Street View |
| g2 | Ground conditions | Quality of project, construction, and maintenance of the pavement | Good, Medium, Bad | Minha Rua LX |
| g3 | Pavement width | Effective pavement width for walking. | Large, Medium, Narrow, Inexistent | Google Street View |
| g4 | Slope | Inclination of the street, particularly of the pavement | High, Medium, Flat | Lisboa Aberta |
| g5 | Vehicle traffic flow | Pedestrians’ sense of safety while walking in the neighborhood, due to the presence of high vehicle traffic flow | High, Medium, Low | Waze |
| g6 | No. crosswalks | Number of crosswalks on the route | [number/m2] | Google Street View |
| g7 | Signage | Pedestrians’ sense of safety due to the presence of signage (transit board, information) | High, Medium, Low | Minha Rua LX |
| g8 | Presence of litter | Presence of litter on the route | Number of occurrences | Minha Rua LX |
| g9 | No. trees | Number of trees in the route area | [number/m2] | Lisboa Aberta |
| g10 | Shade | Presence of shade in the route area | % total area | Lisboa Aberta |
| g11 | Natural areas | Presence of natural areas (parks, squares) in the route area | Y/N | Lisboa Aberta |
| g12 | No. shopping and services | Number of shops and services on the route (bakeries, markets, pharmacies, restaurants, bars) | [number/m2] | Lisboa Aberta |
| g13 | No. tourist establishments | Number of tourist establishments on the route (museums, hotels, sightseeing spots, points of interest) | [number/m2] | Lisboa Aberta |
| g14 | Bus stops | Presence of bus stops | [number/m2] | Lisboa Aberta |
| g15 | Subway station distance | Distance of the nearest subway station | [km] | Lisboa Aberta |
| g16 | Bike-sharing stations | Number of bicycle-sharing stations in the street | [number/m2] | Gira |
| g17 | Bike lanes | Percentage of the route that presents bicycle lanes | % total length | Lisboa Aberta |
| g18 | Street connectivity | Density of routes that the selected street is connected with | High, Medium, Low | Google Street View |
| a1 | a2 | a3 | a4 | a5 | a6 | a7 | a8 | a9 | a10 | |
|---|---|---|---|---|---|---|---|---|---|---|
| g1 | y | y | n | y | y | y | y | y | n | y |
| g2 | Good | Medium | Bad | Good | Medium | Medium | Medium | Good | Bad | Good |
| g3 | Large | Medium | Non-existent | Large | Narrow | Narrow | Large | Large | Non-existent | Medium |
| g4 | Flat | Flat | High | Flat | Flat | High | Flat | Flat | Flat | Flat |
| g5 | Medium | Medium | Low | Medium | Medium | Low | Medium | None | High | None |
| g6 | 7.05 | 7.31 | 0.41 | 7.11 | 11.06 | 1.58 | 3.75 | 0 | 0 | 7 |
| g7 | Good | Medium | Medium | Good | Medium | Medium | Good | Good | Bad | Good |
| g8 | 109 | 49 | 21 | 82 | 33 | 25 | 0 | 6 | 25 | 20 |
| g9 | 7 | 1.5 | 0 | 5.6 | 1.9 | 0.5 | 4.1 | 0.6 | 0 | 1.1 |
| g10 | 91.68 | 39.01 | 76.14 | 89.2 | 81.72 | 56.87 | 71.07 | 63.86 | 83.32 | 99.4 |
| g11 | y | n | n | n | n | y | n | y | n | y |
| g12 | 0.16 | 0 | 0.01 | 0.09 | 0.07 | 0.01 | 0 | 0.06 | 0 | 0.27 |
| g13 | 0.07 | 0 | 0.03 | 0.63 | 0 | 0.02 | 0.1 | 0 | 0.06 | 0 |
| g14 | 3.52 | 0.81 | 1.25 | 2.99 | 6.63 | 2.53 | 0 | 1.33 | 9.87 | 0 |
| g15 | 0.35 | 0.35 | 1.9 | 0.3 | 0.95 | 0.35 | 0.65 | 1.6 | 2.1 | 1.3 |
| g16 | 8.52 | 0.81 | 0 | 0.74 | 0 | 0 | 0 | 0.66 | 0 | 5.84 |
| g17 | 100 | 47 | 3 | 0 | 18 | 11 | 1 | 27 | 0 | 30 |
| g18 | High | Medium | Low | High | High | Medium | Medium | Low | Low | Medium |
| Ranking | Action | ϕ | ϕ+ | ϕ− |
|---|---|---|---|---|
| 1 | Alameda dos Oceanos | 0.5062 | 0.6481 | 0.142 |
| 2 | Avenida Dom João II | 0.3272 | 0.5556 | 0.2284 |
| 3 | Rua do Bojador | 0.2593 | 0.5309 | 0.2716 |
| 4 | Passeio do Tejo | 0.0802 | 0.4383 | 0.358 |
| 5 | Avenida João Paulo II | 0.0432 | 0.3951 | 0.3519 |
| 6 | Passeio Báltico | −0.0432 | 0.3457 | 0.3889 |
| 7 | Av. de Berlim | −0.0988 | 0.321 | 0.4198 |
| 8 | Av. Marechal Gomes da Costa | −0.1296 | 0.3395 | 0.4691 |
| 9 | Av. do Santo Condestável | −0.4383 | 0.2222 | 0.6605 |
| 10 | Rua de Marvila | −0.5062 | 0.1667 | 0.6728 |
Publisher’s Note: MDPI stays neutral with regard to jurisdictional claims in published maps and institutional affiliations. |
© 2021 by the authors. Licensee MDPI, Basel, Switzerland. This article is an open access article distributed under the terms and conditions of the Creative Commons Attribution (CC BY) license (http://creativecommons.org/licenses/by/4.0/).
Share and Cite
Manzolli, J.A.; Oliveira, A.; Neto, M.d.C. Evaluating Walkability through a Multi-Criteria Decision Analysis Approach: A Lisbon Case Study. Sustainability 2021, 13, 1450. https://doi.org/10.3390/su13031450
Manzolli JA, Oliveira A, Neto MdC. Evaluating Walkability through a Multi-Criteria Decision Analysis Approach: A Lisbon Case Study. Sustainability. 2021; 13(3):1450. https://doi.org/10.3390/su13031450
Chicago/Turabian StyleManzolli, Jônatas Augusto, André Oliveira, and Miguel de Castro Neto. 2021. "Evaluating Walkability through a Multi-Criteria Decision Analysis Approach: A Lisbon Case Study" Sustainability 13, no. 3: 1450. https://doi.org/10.3390/su13031450
APA StyleManzolli, J. A., Oliveira, A., & Neto, M. d. C. (2021). Evaluating Walkability through a Multi-Criteria Decision Analysis Approach: A Lisbon Case Study. Sustainability, 13(3), 1450. https://doi.org/10.3390/su13031450


