Abstract
Maintaining product availability is one of the biggest challenges in retail business because it directly relates to lost sale and decrease in customer loyalty. A solution that ensures a more accurate prediction and eliminates costly stock-outs and wasteful overstocks is an automatic replenishment system. The goal of this paper is to measure the impact that the automatic replenishment system can have on product availability in retail business, especially when it comes to specific product and store related risk factors. A large quantitative study measured the performance of manual and automatic replenishment processes in a sample of 85 stores and 95 products of a major retail chain in Serbia. The study concluded that utilization of an automatic replenishment system can reduce stock-outs for the retail chains up to 60%. Specifically, when ordered through an automatic replenishment system, fast-selling products recorded 40% greater availability, products on promotion 48% higher availability, and products in a high-density retail stores 59% higher availability. The findings extend current understanding of automatic replenishment systems, and especially their performance related to high-risk retail conditions.
1. Introduction
Customer loyalty and satisfaction are the key preconditions for maintaining a sustainable retail business [1,2]. This requires balancing between increasing sales and profitability of the retail chain and avoiding overstocking and excessive waste [3]. Although increasing loyalty and satisfaction implies maintaining sufficient inventory levels and making each stock-keeping unit (SKU) available for customers, the phenomenon of a stock-out remains one of the most significant problems for retailers [4]. Research conducted in the last 60 years shows that the rate of unavailable products is generally high and constant at level between 7 and 8 percent [5], which results in average lost sales up to 4 percent [6].
Industries nowadays have more insight into corporate environmental, social, and economic sustainability than ever before [7]. Retail managers are constantly trying to increase product availability [8], which is driven by three key forces [6]. First, the increasing number of shopping channels and retail shops leads to an increase of bargaining power of buyers, who are willing to switch to competitor stores. Second, the potential solutions are growing in number and value, and these can be implemented worldwide. Third, and the most important, advanced technology enables innovative solutions for the stock-out problem, which reduces labor and inventory costs.
Retailers and their customers link automation to the sustainability agenda. In recent years, many retail companies have pledged to create and maintain sustainable supply chains. These companies realize the importance of protecting the environment, even if there may be tradeoffs between profitability and sustainability [1]. This includes elimination of costly stock-outs and wasteful overstocks by precise prediction and balancing supply and demand. Excess inventory can be costly to maintain and may become obsolete if products are not sold.
The information that provides insight into inventory levels and demand, improves replenishment decision, and potentially increases product availability is often shared with the help of automated replenishment programs (ARP) and supported by automated replenishment systems (ARS). Theory demonstrated that different types of automated replenishment programs and shared information can result in reduced uncertainty, reduced inventory levels, reduced bullwhip, and increased accuracy [9,10,11].
Consumers want to shop with innovative retailers who use automation and new technologies to promote sustainability and increase quality [12,13]. Sustainability is becoming an important distinguisher for retailers and automation is key to achieving this. Three quarters of retailers think automation can help them offer more sustainable and environmentally friendly solutions. Leveraging automation as a means for retailers to become more ethical or sustainable is also attractive to consumers. For example, 69% percent of consumers overall and more than 80% of consumers in China and India prefer to shop with retailers that use automation technology to increase product availability and reduce waste at the same time [14].
Although some literature on the capability of ARS addressing the problem of retail stock-outs can be found, these results are generally based on a limited time frame, number of products, and retail stores. The main goal of this research is to examine a larger set of data and measure the effect of ARS on both—SKU and store related factors that lead to stock-outs. This enables the evaluation of obtained results in relation to previous findings and overall improved implications for retail professionals.
The subject of empirical investigation is the influence of ARS on SKU availability in retail stores in Serbia. This has been achieved by using a sample of 95 products, 2 product categories, 85 retail stores, and by analyzing two types of ordering systems: (1) orders created manually by store managers and (2) orders created automatically by ARS system. Analysis included a quantitative study and a period of one calendar year. The findings contribute to the scarce knowledge within this specific research area focusing on the relationship between drivers of stock-out and efficiency of ARS.
The remainder of this paper is organized as follows. Section 2 contains a review of relevant literature in the field of product availability and ARS. Section 3 defines selected methodology and metrics and provides information on the collected data and statistics used. Section 4 presents the key research results and Section 5 is the discussion. The paper concludes with a findings overview, managerial implications, and recommendation for further research.
2. Review of the Scientific Literature
Sustainability is often understood to consist of an economic, environmental, and social dimension [15]. Therefore, maintaining sustainable supply chain management and sustainable retailing strategy is essential for obtaining environmental, economic, and social benefits [7,16]. However, we restrict our attention to evaluate the impact of ARS on product availability in retail business and argue in the following why evaluation of high-risk retail conditions and capability of an automated ordering system may be significant for maintaining sustainability in supply chains.
2.1. Drivers of Retail Stock-Outs
In the last two decades, several studies examined the factors leading to lower SKU availability and measured the effect of different drivers of stock-outs [6,8,17,18,19,20,21,22,23,24]. These studies confirmed that most of the drivers are associated with forecasting, as store managers must cope with increasing assortments and product proliferation, constant promotions, fluctuating demand, and reduced storage space.
Some of these studies focused on stock-out drivers related to product characteristics and revealed that factors, such as increased sales speed [18,25], demand variation, case pack size and shelf life [26], promotion [18,27], stock-out at the distribution center [18,20], selling price [28,29], and level of inventory [19,30] contribute to lower product availability.
Several authors examined how store characteristics impact stock-out performance. Angerer found that stock-out level varies strongly from store to store, and that stores with larger backroom and inexperienced managers are more prone to stock-outs [19]. Milicevic and Grubor investigated the effect of the backroom size on the on-shelf SKU availability, and found that larger backroom increases product availability, but only in case of small retail stores [31]. Another study found that increased product density and sales speed at store level contribute to lower product availability [22].
2.2. Automation of Ordering Process
To improve forecasting at store level and increase product availability, several automatic replenishment programs (ARP) have been created in the last 30 years [32,33,34,35]. These sophisticated supply chain practices are usually accompanied with automatic replenishment systems [28,36,37,38]. These systems are often driven by artificial intelligence and capable of making ordering decisions automatically based on demand forecasts and SKU inventory control policy.
ARS creates an order at the SKU/store level based on different kinds of transactional information, such as point of sale (POS) data, batch sizes, and waste data. This order is usually checked by store management and it can be accepted or overruled [28]. ARS process high granularity data that enables identification of seasonal and weekday variations, sales patterns, and creates forecast for the upcoming period, where the next delivery is determined based on the lead time and the ordering frequency. The sum of minimum number of facings, minimum inventory level, and calculated forecast becomes order-up-to level for the specific SKU and retail store [28].
Order proposal is generated if current inventory level of SKU at the store level is bellow order-up-to level, by computing how many batches the store needs to raise the inventory level up or above the order-up-to level. The current inventory level at retail stores is calculated based on the POS data, previous amount delivered to store and number of wasted SKUs. The suggested replenishment quantity for each store and SKU is calculated based on several inputs: current inventory level, POS data that is used to generate forecast, ordering frequency, minimum inventory level, lead time, and batch size [28].
This makes ARS valuable to suppliers and retailers when demand is non-stationary [39] and the use of advanced algorithms and ARS result in significant cost savings [40,41]. Characteristics such as shelf life and perishability are usually not included when the automatic replenishment program computes the replenishment quantity [36,42]. However, inventory policies which include these aspects have previously been proposed [43,44,45].
A classification of replenishment systems involving different degrees of automation and intelligence was done after examining different systems that have been implemented in retail around the world. Depending on a degree of automation, replenishment systems can be divided into manual, IT-supported (electronic inventory-based ordering), sales-based (simple ordering heuristics), and demand-based (time series and causal model-based forecasts). Table 1 shows the basic modules and characteristics of these systems, as suggested by Angerer [19]. Replenishment logic presented here denotes: (T, Q) fixed quantity Q, ordered every period T; (T, S) fill up to level S, every period T; (s, Q) order Q, whenever inventory drops below level s; (s, S) fill up to level S, whenever inventory drops below s.

Table 1.
Characteristics of automated replenishment levels.
Some of the key benefits and drawbacks of ARS have also been investigated in the literature. Besides already mentioned potential cost savings, the other advantages of ARS include reduced employee time in ordering, centralized and standardized decision making that makes ordering process more efficient [36,42,46]. Key disadvantages of ARS include difficulties to efficiently handle SKUs with short shelf life [42] and underperformance due to suboptimal configuration and implementation [47].
2.3. Impact of Automated Ordering on Product Availability
The replenishment is central for the performance of retail chains as it balances availability on one side and the risk of waste on the other. If too few products are ordered, the stores risk a stock-out, whereas if too many are ordered, the products may end spending too much time in the store, reducing remaining shelf life and in the worst-case end up being wasted.
Waste is not only an indication of economical loss in the phase where it is discarded. It also indicates that natural resources have been wasted and unnecessary pollution has been added to the environment from transportation along the supply chain [48,49,50]. Several studies examined the efficiency of automated replenishment programs in relation to waste and product availability [51,52]. The findings suggest that by utilizing an automatic replenishment program, stores can reduce their level of waste by up to 20% and have a longer remaining shelf life without compromising on-shelf availability.
When it comes to impact of ARS on product availability, there are several notable studies. Ivanov found implementation of ARS system preferable to manual ordering, although the cost of order processing remained relatively high on both automatic and manual ordering. Manual ordering process of each individual SKU generally consumes more time and labor compared to automatic. However, ARS requires significant labor costs as a result of regular physical audits that keep the inventory data accurate and up-to-date, and as well as a review of automatically generated orders, which store managers consider necessary. Technology adoption and potential resistance can also be an issue [53].
Angerer investigated the impact of manual and automatic systems on SKU related stock-out drivers and found that sales speed, variation in demand, case pack size, and price increase probability of stock-out when SKUs were ordered manually, but not in the case of ARS. The general conclusion was that even simple ARS can increase the product availability independently from SKU characteristics [19]. However, in most of these studies, identification of stock-outs was done by using manual audit or POS method, and therefore conclusions obtained were drawn from a relatively small sample of SKUs, stores, and a shorter period. Table 2 shows previous research related to current work.
Table 2.
Comparison between the contributions of different authors.
2.4. Conceptual Model and Hypotheses Development
Following the reviewed literature, we investigated relations between the following variables: product (SKU)-related drivers, store-related drivers, ordering system type, and stock-outs (as product availability indicator). Besides the direct effect of the automation of an ordering system on product availability, we examined indirect effects as well, related to high-risk product and store related drivers. For this analysis, we have used a conceptual model presented in Figure 1.
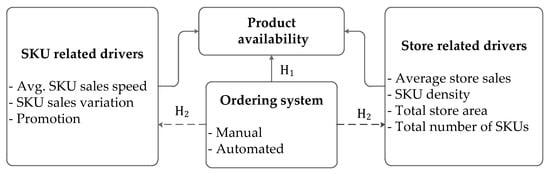
Figure 1.
Conceptual Model.
Given all information related to stock-out drivers and capabilities of automation of ordering systems, we have tested the following hypotheses:
Hypothesis 1 (H1).
Automatically ordered SKUs have higher product availability at retail store level.
Hypothesis 2 (H2).
Automatically ordered SKUs record higher product availability in case of high-risk product and store conditions.
Identification of stock-outs in this study was done by using store-level compiled inventory records and method called perpetual inventory aggregation (PI). This approach enabled inclusion and analysis of a much larger sample. The structure of the dataset allowed the measurement of the effect of several known stock-out drivers and efficiency of manual and automatic replenishment systems. This further provided ground for comparing the results obtained, and recommendations for practitioners.
3. Research Methodology
The data for the research was obtained from a large grocery retailer that offers more than 11,000 different SKUs in more than 170 stores in Serbia. The orders are created in two ways—manually and automatically. Automatic ordering is done with the assistance of artificial intelligence, which uses complex algorithms to set the ordering time and quantities at store level—whenever inventory drops below s, fill up to level S. Manual ordering is executed by store managers, who physically and electronically monitor inventory and set orders as needed. A short description of system modules and logic is given in Table 3. In both cases, the orders created for every SKU and store are summarized and forwarded to suppliers.
Table 3.
Description of ordering systems analyzed.
Given data was pre-processed in order to ensure its relevance and consistency, and to make it useable for the selected statistical approach. The starting point was the Enterprise Resource Planning (ERP) system of the company. Different reports on inventory and sales for all SKUs and stores were compiled into a dataset of high granulation. Extraction of data from central database was followed by selection of SKUs, stores, and integration with data obtained from additional electronic sources. Complete pre-processing and statistical analysis were performed by using Stata 12 statistical software.
Form over 11,000 active SKUs, 95 products divided in 2 categories were selected for the analysis. Baby diapers category comprised of 50 SKUs was selected since it carries the largest potential loss for the retailer. The largest global study showed that 39% of consumers change stores and 20% change brands if they face a baby diaper stock-out. The paper towel category consisted of 45 SKUs was selected for the second part of the dataset, as it carries the largest potential loss for the supplier. The same study found that 13% of consumers change stores and even 37% change brands in the case of paper towels stock-out [6].
From a total of 175 stores, 85 stores with consisted sales and reliable data for each of the 365 days of 2018 were selected for the analysis. The rest of the stores recorded incomplete data, and these were omitted from the sample. The last step of data pre-processing included integration with different additional information such as assortment tables, promotion periods, and ordering system type. The final set was structured as a single spreadsheet of high granulation (SKU/store/day level) and included 2,318,693 observations.
One of the biggest challenges associated with measuring product availability is stock-out identification. The literature distinguishes three methods of identification: manual audit (MA), point-of-sale (POS) estimate, and perpetual inventory (PI) aggregation [54], which was selected for this research. The MA method requires regular physical monitoring of SKU availability, and it consumes significant resources and time. The POS method uses sales-based mathematical models, which makes it applicable to fast-selling SKUs only. The PI method is based on store-level inventory data, which enable analysis of a large sample of products and stores. The main disadvantage of the PI method is that it considers store availability instead of shelf availability.
Stock-out is presented as a dichotomous (binary) dependent variable that is impacted by different stock-out drivers and two types of ordering systems as the independent (predictor) variables. Therefore, the probit regression as the most convenient approach was selected for statistical modelling. If at least one SKU is available in store, the value of the stock-out variable is 0. If product is not available on a specific day in a specific store, the value of dependent variable is 1. Stock-out as the dependent variable was modelled as:
where i represents 85 observed stores, j represents 95 observed SKUs, and k represents 365 observed days in the 2018 calendar year. The independent variables included sales speed, sales variation, and promotion as SKU related drivers, store sale, and store density as store related divers, and ordering system type. Ordinary least squares (OLS) and logistics regressions were considered as alternative methods, but these were rejected due to certain deficiencies. It has been long stated that OLS can yield false results if used with a dichotomous dependent variable [55]. Logistic regression was rejected as probit regression provide better fit by Akaike and Bayesian information criterion.
4. Results
To get some general insight into data and variables, descriptive statistics was performed prior to the correlation and the probit analysis. This enabled calculation of stock-out rate for the whole dataset, and both types of ordering systems. Descriptive statistics given in Table 4 and Table 5 show that the average percentage of stock-outs in the whole dataset is 2.53%. This stock-out rate is calculated as the ratio of the total number of observations where stock-out variable equals 1, and the maximum possible SKU availability (total number of observations). The stock-out rate is more than twice lower for the automatically ordered SKUs (1.38%) than manually ordered SKUs (3.72%).
Table 4.
Descriptive statistics of the product and store variables.
Table 5.
Availability of products ordered through manual and automatic system.
Correlation analysis was performed to prevent misconceptions about independent variables and reduction of the model accuracy. Table 6 shows 8 variables that were measured, and 5 that were selected for the analysis due to correlation issues: average SKU sale, promotional effect, average (daily) store sale, store density, and ordering type. The variables average SKU sale, average store sale and store density were used as continuous, while the variables ordering type and promotion were analyzed as binary (Boolean).
Table 6.
Correlation analysis for the product and store variables.
Variable “average SKU sale” (avg_sales_sku) is calculated as an average SKU quantity sold daily at each store. The calculation at store level provides a more accurate prediction comparing to the calculation at a whole retail chain. The sale of the selected SKUs (baby diapers and paper towels) is generally not seasonal, and the significant variation can be only caused by promotion activity. The variable sales variation (sales_var) significantly correlated with the average SKU sale (0.88); thus, the variable sales variation was excluded from the model.
Variable “number of SKUs per store” (total_sku_nmr) is the number of different products at store level, which—depending on store size—varies between 4 and 10 thousand. Variable “SKU density” is calculated as an average number of different products per square meter at the store level. Therefore, variables “store area” and “numbers of SKUs per store” recorded a significant correlation with the variable SKU density (0.835 and −0.588), which was the only one included in the model. Variable “average store sale” (avg_sales_str) corresponds to the value of average daily sale at store level in euros.
Variable “promotion” is binary (flag), where 1 indicates that the SKU was on discounted sale and 0 indicates that it was regularly sold in a particular store on a particular day. Table 4 shows that SKU with promotion flags account for nearly 14% of the sample. The ordering type (auto_ordr) variable is also binary variable considered at retail chain level, where 1 refers to marks products ordered automatically, and 0 to products ordered manually. In total, 48 SKUs were ordered automatically, and 47 SKUs manually.
Table 7 provides the probit regression results for the examined dataset. Prob > chi2 represents the probability of acquiring the chi-square statistic when significant relation between independent variables and the stock-out variable cannot be established. Since the suggested model recorded a value less than critical (0.01), it can be concluded that the model is statistically significant, and the same is true for all the coefficients (P > z).
Table 7.
Probit regression for the product and store variables.
Interpretation of the results obtained with probit regression is possible with the use of marginal effects. Margins provide a predicted stock-out probability for different variables, while some covariates can be fixed at values different from real. Figure 2 provides the average predicted probabilities of a stock-out for the variable “sales_speed_sku,” and Figure 3 provides the average predicted probabilities of a stock-out for the continuous variable sku_dens, both evaluated at the means of the covariates. Since variable “average store sale” recorded relatively insignificant coefficient, it was not further examined.
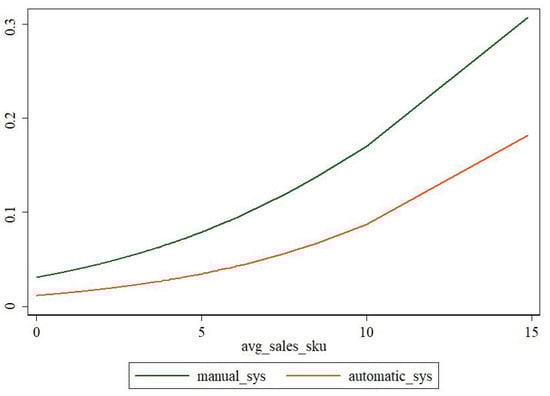
Figure 2.
Predicted stock-out probabilities in relation to average SKU sales.
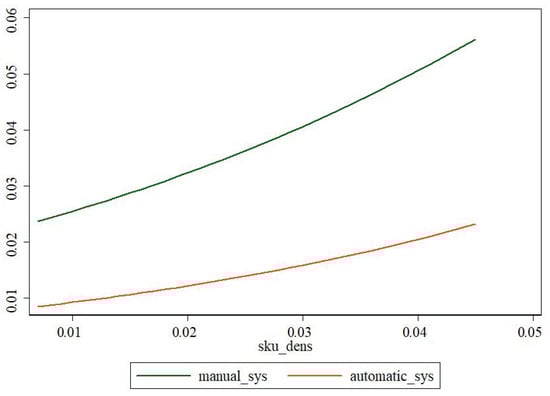
Figure 3.
Predicted stock-out probabilities in relation to SKU density.
Based on a marginal effect analysis, the stock-out probability for manually ordered SKU increases from 0.038 to 0.306 as the average daily SKU sales increase from 1 to 14.89. Figure 2 also shows that the stock-out probability for automatically ordered SKU increases from 0.014 to 0.181, as the average SKU sales increase form of 1 to 14.89. Since the predicted stock-out probability is twice as higher for the manual ordering system, we can conclude that the use of automatic system can significantly reduce the stock-out probability for fast selling SKUs (40 percent lower).
A similar effect can be observed with the store density variable (Figure 3). For manual ordering system, the predicted stock-out probability in the stores with a density of 0.01 SKU per square meter was 0.025 and increased to 0.056 in the stores with density of 0.045. For automatic ordering system, the predicted stock-out probability in the stores with density of 0.1 SKU per square meter was 0.009 and increased to 0.023 in the stores with SKU density of 0.045. It can be concluded that the automatic ordering system recorded significantly better results and lower probability of a stock-out in low-density and especially high-density retail stores (59 percent lower probability).
Next, we examined the impact of an automatic ordering system on the availability of SKUs on promotion. Table 8 shows the results of marginal effect analysis of the interaction of promotional and ordering variables. The general conclusion is that probability of stock-out increases with promotional activity and decreases with the use of automatic ordering system. The first line in the table (0#0) provides estimation of probability if SKU was sold regularly, and ordered manually, the second line (0#1) probability of stock-out if the SKU is on promotion and automatically ordered, and so on.
Table 8.
Marginal effects of the interaction of promotion and ordering variables.
The best-case scenario is the one with the predicted stock-out probability of 0.012, when the item is sold regularly, and ordered automatically (0#1). The worst performing scenario is 1#0 with a stock-out probability of 0.047, when the manually ordered SKU is sold on promotion. The analysis of the interaction of promotion and ordering system variables concluded that automatic ordering contributes to stock-out rate reduction of 64% on non-promotional items, and to stock-out rate reduction of 48% on items on promotion.
5. Discussion
The general conclusion is that the utilization of an automatic replenishment system can reduce stock-outs for retail chains from 40 to 60%. The potential improvement is in line with earlier quantitative studies, which found that automation can improve retailers’ inventory performance, reduce stock-out incidents, and provide more constant results [19,53]. However, in earlier studies, the effects were measured on a relatively small sample of products, stores, and a very short period [19,52]. This study confirmed and quantified potential improvement on a large dataset by using a perpetual inventory aggregation method for stock-out identification.
The results confirmed that fast-selling products ordered through an automatic replenishment system recorded a 40% greater availability. A similar conclusion was obtained in an earlier study that found that turnover speed has a smaller influence on product availability with automatic ordering systems [19]. The promotion and high sales variance were recognized as drivers of low product availability by some authors [18,27], and questioned by others [19]. The results of this study confirmed that products on promotion have a greater chance of stock-out, but also confirmed that when ordered through an automatic replenishment the system records a 48% higher availability.
While several studies confirmed that level and inventory performance vary strongly from store to store [19,22], the impact of product density in stores on their availability was doubted. This study confirmed that higher density in stores contributes to stock-outs [22], and also revealed that automatically ordered products in a high-density retail stores recorded 59% higher availability than products ordered manually.
6. Managerial Insights
The findings provided enhance managerial implication in terms of focusing on the most significant stock-out drivers and the potential benefits of automated ordering systems implementation. In most of the cases, retailers are forced to use the combination of automatic and manual replenishment system, which is driven by the simultaneous use of cross-docking and distribution center supply.
The findings clearly state that products with higher turnover and products on promotion require special attention and automatic systems with advanced forecasting capability can provide better results. This also calls for improved collaboration with suppliers [56] and use of automatic replenishment programs (ARP).
Beside higher product availability, other benefits of automation of ordering system that managers can expect include reduced employee effort in ordering [53], reduced level of waste, longer remaining shelf life [51,52], preservation of natural resources, and lower pollution from transportation along the supply chain [48,49,50]. It is expected that future studies on sustainability of retail operations include some of these variables.
Advanced technology cannot address all issues of contemporary retail businesses, as it generally assists managers and contributes to sustainable and efficient retail operations. In order to obtain the full benefits of using automated ordering systems, integrity and accuracy of data and accurate forecasting must be achieved.
7. Conclusions
Product availability represents one of the key performance measures in retail business and it should be regularly determined and measured. The existing literature investigated most of the profound stock-out drivers and mainly focused on the customer reactions and stock-out direct and indirect consequences. The goal of this paper was to go one step further and investigate how artificial intelligence and automation of the ordering system can contribute to retail sustainability in terms of increase of product availability and reduced the negative effects of stock-outs.
Overall, the results indicate that it is beneficial to utilize an automatic system for replenishment decisions in the retail industry. The study focused on key product and store related drivers and measured how automation of ordering system cope with the challenge that pose fast selling products, products on promotion, and densely packed retail shops with high turnover. These drivers were generally recognized as a great challenge for traditional manual ordering system, where store managers are forced to monitor a large number of SKUs with different selling dynamic in a limited store space.
The probit regression and analysis of marginal effects confirmed that an automated system records significantly better performance in high-risk conditions related to the stock-out drivers identified as most significant: SKUs with high turnover, SKUs on promotion characterized with increased sales variation, and densely packed stores with a large assortment. Besides generally higher product availability at retail chain level, the availability of automatically ordered SKUs was 40–60% higher compared to manually ordered SKUs in relation to the investigated high-risk conditions.
This study confirmed some of the positive effects recognized in earlier studies on automated ordering systems and product availability. However, the main contribution of this work is related to measurement of the effect of ARS on product availability in high-risk conditions and it contributes to the scarce literature and insights mainly based on limited number of products, retail stores, and time.
Different stock-out identification method and the use of a large sample has solved one of the key limitations of earlier studies. At the same time, another limitation related to PI stock-out identification method surfaced as it considers availability at store level instead of shelf availability. The PI method considers not just the availability of the product on the shelf, but also its availability in the back storage, which implies that actual shelf stock-out rate may be even higher than calculated. Potential analysis of ordering system performance in relation to shelf availability provides opportunity for further investigation and research.
Although it is difficult to analyze different types of sustainability-related variables in one study and quantify the impact of automation, further studies should provide additional evidence of automated systems performance. So far, cost-benefit approach was mostly pursued, as costs of automation play significant role in implementation and decision-making process. These costs do not only include costs of a system development, procurement, and implementation, but also costs of maintenance, physical audits that keep the inventory data accurate, and other issues such as capability of technology adoption and potential resistance [53].
Beside inclusion of other variables, such as substitution [57], waste, shelf life, and energy consumption, future studies and case studies could further analyze the performance of automated systems of different complexity [19], and different types of cooperation options with suppliers, such as Efficient Consumer Response, Quick Response, the Continuous Replenishment Program, and Vendor Managed Inventory [52]. This should provide opportunity for some larger meta-analysis on efficiency of automated ordering systems and improved managerial implications.
Author Contributions
Conceptualization, G.A. and V.V.D.; methodology, G.A.; formal analysis, M.R.; data curation, G.A. and M.R.; writing—original draft preparation, G.A.; writing—review and editing, V.V.D.; visualization, M.R.; supervision, G.A. All authors have read and agreed to the published version of the manuscript.
Funding
This research received no external funding.
Institutional Review Board Statement
Not applicable.
Informed Consent Statement
Not applicable.
Data Availability Statement
The data presented in this study are openly available in Dryad Digital Repository at https://doi.org/10.5061/dryad.dr7sqv9x7; Reviewer URL: https://datadryad.org/stash/share/ntKVmhwSyv4hBoUjf5vYmBbhORLp0snxfpWKHJC1CpY.
Conflicts of Interest
The authors declare no conflict of interest. The funders had no role in the design of the study; in the collection, analyses, or interpretation of data; in the writing of the manuscript, or in the decision to publish the results.
References
- Lysenko-Ryba, K.; Zimon, D. Customer Behavioral Reactions to Negative Experiences during the Product Return. Sustainability 2021, 13, 448. [Google Scholar] [CrossRef]
- Wei, A.-P.; Peng, C.-L.; Huang, H.-C.; Yeh, S.-P. Effects of Corporate Social Responsibility on Firm Performance: Does Customer Satisfaction Matter? Sustainability 2020, 12, 7545. [Google Scholar] [CrossRef]
- Sakoda, G.; Takayasu, H.; Takayasu, M. Data Science Solutions for Retail Strategy to Reduce Waste Keeping High Profit. Sustainability 2019, 11, 3589. [Google Scholar] [CrossRef]
- Ronald Berger. Full-Shelf Satisfaction: Reducing Out-of-Stocks in the Grocery Channel; Grocery Manufacturers of America: Washington, DC, USA, 2002. [Google Scholar]
- Aastrup, J.; Kotzab, H. Forty years of out-of-stock research—And shelves are still empty. Int. Rev. Retail Distrib. Consum. Res. 2010, 20, 147–164. [Google Scholar] [CrossRef]
- Corsten, D.; Gruen, T. Desperately seeking shelf availability: An examination of the extent, the causes, and the efforts to address retail out-of-stocks. Int. J. Retail Distrib. Manag. 2003, 31, 605–617. [Google Scholar] [CrossRef]
- Seok, H.; Nof, S.Y.; Filip, F.G. Sustainability decision support system based on collaborative control theory. Annu. Rev. Control 2012, 36, 85–100. [Google Scholar] [CrossRef]
- Ronald Berger. Optimal Shelf Availability—Increasing Shopper Satisfaction at the Moment of Truth; ECR Europe and Roland Berger: Kontich, Belgium, 2003. [Google Scholar]
- Costantino, F.; Di Gravio, G.; Shaban, A.; Tronci, M. The impact of information sharing on ordering policies to improve supply chain performances. Comput. Ind. Eng. 2015, 82, 127–142. [Google Scholar] [CrossRef]
- Kelepouris, T.; Miliotis, P.; Pramatari, K. The impact of replenishment parameters and information sharing on the bullwhip effect: A computational study. Rev. Comput. Oper. Res. 2008, 35, 3657–3670. [Google Scholar] [CrossRef]
- Titah, R.; Shuraida, S.; Rekik, Y. Integration Breach: Investigating the Effect of Internal and External Information Sharing and Coordination on Firm Profit. Rev. Int. J. Prod. Econ. 2016, 181, 34–47. [Google Scholar] [CrossRef]
- Gajewska, T.; Zimon, D.; Kaczor, G.; Madzík, P. The impact of the level of customer satisfaction on the quality of e-commerce services. Int. J. Product. Perform. Manag. 2019, 69, 666–684. [Google Scholar] [CrossRef]
- Križo, P.; Madzík, P.; Vilgová, Z.; Sirotiaková, M. Evaluation of the Most Frequented Forms of Customer Feedback Acquisition and Analysis. In Proceedings of the International Conference on Knowledge Management in Organizations, Žilina, Slovakia, 6–10 August 2018; Springer: Berlin/Heidelberg, Germany, 2018; pp. 562–573. [Google Scholar] [CrossRef]
- Capgemini Research Institute. Automation in Retail Stores Research; Consumer Survey; Capgemini Research Institute: Paris, France, 2019. [Google Scholar]
- Seuring, S.; Müller, M. From a literature review to a conceptual framework for sustainable supply chain management. Rev. J. Clean. Prod. 2008, 16, 1699–1710. [Google Scholar] [CrossRef]
- Sarkar, B.; Omair, M.; Choi, S.-B. A Multi-Objective Optimization of Energy, Economic, and Carbon Emission in a Production Model under Sustainable Supply Chain Management. Appl. Sci. 2018, 8, 1744. [Google Scholar] [CrossRef]
- Ehrenthal, J.C.; Stölzle, W. An examination of the causes for retail stockouts. Int. J. Phys. Distrib. Logist. Manag. 2013, 43, 54–69. [Google Scholar] [CrossRef]
- Avlijas, G.; Simicevic, A.; Avlijas, R.; Prodanovic, M. Measuring the impact of stock-keeping unit attributes on retail stock-out performance. Oper. Manag. Res. 2015, 8, 131–141. [Google Scholar] [CrossRef]
- Angerer, A. The Impact of Automatic Store Replenishment Systems on Retail: Technologies and Concepts for the Out-of-Stocks Problem; Deutscher Universitatsverlag: Wiesbaden, Germany, 2006. [Google Scholar]
- Usman, K. Determination of Drivers of Stock-out Performance of Retail Stores Using Data Mining Techniques. Master’s Thesis, Massachusetts Institute of Technology, Cambridge, MA, USA, 2008. Available online: https://dspace.mit.edu/handle/1721.1/45246 (accessed on 7 October 2020).
- Grubor, A.; Milicevic, N. The Analysis of FMCG Product Availability in Retail Stores. Eng. Econ. 2015, 26, 67–74. [Google Scholar] [CrossRef]
- Avlijas, G.; Milicevic, N.; Golijanin, D. Influence of store characteristics on product availability in retail business. Ekon. Manag. 2018, 21, 195–206. [Google Scholar] [CrossRef]
- Milicevic, N.; Grubor, A.; Djokic, N.; Avlijas, G. Retail Out-of-stocks in the Context of Centralized and Direct Delivery. Promet Traffic Transp. 2018, 30, 105–114. [Google Scholar] [CrossRef]
- Moussaoui, I.; Williams, B.; Hofer, C.; Aloysius, J.A.; Waller, M. Drivers of retail on-shelf availability: Systematic review, critical assessment, and reflections on the road ahead. Int. J. Phys. Distrib. Logist. Manag. 2016, 46, 516–535. [Google Scholar] [CrossRef]
- Gruen, T.W.; Corsten, D.S.; Bharadwaj, S. Retail Out-of-Stocks: A Worldwide Examination of Extent, Causes and Consumer Responses; Grocery Manufacturers of America: Washington, DC, USA, 2002. [Google Scholar]
- Mattsson, S.A. Inventory control in environments with seasonal demand. Oper. Manag. Res. 2010, 3, 138–145. [Google Scholar] [CrossRef]
- Ettouzani, Y.; Yates, N.; Mena, C. Examining retail on shelf availability: Promotional impact and a call for research. Int. J. Phys. Distrib. Logist. Manag. 2012, 42, 213–243. [Google Scholar] [CrossRef]
- Van Donselaar, K.H.; Gaur, V.; Van Woensel, T.; Broekmeulen, R.A.; Fransoo, J.C. Ordering behavior in retail stores and implications for automated replenishment. Manag. Sci. 2010, 56, 766–784. [Google Scholar] [CrossRef]
- DeHoratius, N.; Raman, A. Inventory record inaccuracy: An empirical analysis. Manag. Sci. 2008, 54, 627–641. [Google Scholar] [CrossRef]
- Grubor, A.; Milicevic, N.; Djokic, N. The effect of inventory level on product availability and sale. Prague Econ. Pap. 2016, 25, 221–233. [Google Scholar] [CrossRef]
- Milicevic, N.; Grubor, A. The effect of backroom size on retail product availability—Operational and technological solutions. Amfiteatru Econ. J. 2015, 17, 661–675. [Google Scholar]
- Daugherty, P.J.; Myers, M.B.; Autry, C.W. Automatic replenishment programs: An empirical examination. Rev. J. Bus. Logist. 1999, 20, 63–82. [Google Scholar] [CrossRef]
- Yao, Y.; Dresner, M. The inventory value of information sharing, continuous replenishment, and vendor-managed inventory. Transp. Res. Part E Logist. Transp. Rev. 2008, 44, 361–378. [Google Scholar] [CrossRef]
- Arshinder, A.K.; Deshmukh, S.G. Supply chain coordination: Perspectives, empirical studies and research directions. Rev. Int. J. Prod. Econ. 2008, 115, 316–335. [Google Scholar] [CrossRef]
- Sabath, R.E.; Autry, C.W.; Daugherty, P.J. Automatic replenishment programs: The impact of organizational structure. Rev. J. Bus. Logist. 2001, 22, 91–105. [Google Scholar] [CrossRef]
- Van Donselaar, K.; Van Woensel, T.; Broekmeulen, R.; Fransoo, J. Inventory control of perishables in supermarkets. Rev. Int. J. Prod. Econ. 2006, 104, 462–472. [Google Scholar] [CrossRef]
- Kuhn, H.; Sternbeck, M. Integrative Retail Logistics: An Exploratory Study. Oper. Manag. Res. 2013, 6, 2–18. [Google Scholar] [CrossRef]
- Ehrenthal, J.; Honhon, D.; Woensel, T.V. Demand Seasonality in Retail Inventory Management. Eur. J. Oper. Res. 2014, 238, 527–539. [Google Scholar] [CrossRef]
- Jonsson, P.; Mattsson, S.A. The Value of Sharing Planning Information in Supply Chains. Int. J. Phys. Distrib. Logist. Manag. 2013, 43, 282–299. [Google Scholar] [CrossRef]
- Byrne, P.; Heavy, C. The Impact of Information Sharing and Forecasting in Capacitated Industrial Supply Chains: A Case Study. Int. J. Prod. Econ. 2006, 103, 420–437. [Google Scholar] [CrossRef]
- Noh, J.S.; Kim, J.S.; Sarkar, B. Stochastic joint replenishment problem with quantity discounts and minimum order constraints. Oper. Res. 2019, 19, 151–178. [Google Scholar] [CrossRef]
- Van Woensel, T.; Van Donselaar, K.; Broekmeulen, R.; Fransoo, J. Consumer responses to shelf out-of-stocks of perishable products. Int. J. Phys. Distrib. Logist. Manag. 2007, 37, 704–718. [Google Scholar] [CrossRef]
- Bakker, M.; Jan Riezebos, J.; Teunter, R.H. Review of inventory systems with deterioration since 2001. Rev. Eur. J. Oper. Res. 2012, 221, 275–284. [Google Scholar] [CrossRef]
- Broekmeulen, R.; Van Donselaar, K.H. A heuristic to manage perishable inventory with batch ordering, positive lead-times, and time-varying demand. Rev. Comput. Oper. Res. 2009, 36, 3013–3018. [Google Scholar] [CrossRef]
- Ferguson, M.; Ketzenberg, M.E. Information sharing to improve retail product freshness of perishables. Rev. Prod. Oper. Manag. 2006, 15, 57–73. [Google Scholar] [CrossRef]
- Huber, J.; Gossmann, A.; Stuckenschmidt, H. Cluster-based hierarchical demand forecasting for perishable goods. Expert Syst. Appl. 2017, 76, 140–151. [Google Scholar] [CrossRef]
- Ahvonen, O. Retail Store Replenishment: Understanding the Improvement Areas in Automated Ordering Processes. Master’s Thesis, Aalto University, Espoo, Finland, 2018. Available online: https://aaltodoc.aalto.fi/handle/123456789/34733 (accessed on 2 November 2020).
- Bourlakis, M.; Maglaras, G.; Gallear, D.; Fotopoulos, C. Examining sustainability performance in the supply chain: The case of the Greek dairy sector. Rev. Ind. Mark. Manag. 2014, 43, 56–66. [Google Scholar] [CrossRef]
- Gerbens-Leenes, P.W.; Moll, H.C.; Schoot Uiterkamp, A.J.M. Design and development of a measuring method for environmental sustainability in food production systems. Rev. Ecol. Econ. 2003, 46, 231–248. [Google Scholar] [CrossRef]
- Maloni, M.J.; Brown, M.E. Corporate social responsibility in the supply chain: An application in the food industry. Rev. J. Bus. Ethics 2006, 68, 35–52. [Google Scholar] [CrossRef]
- Kiil, K.; Hvolby, H.H.; Fraser, K.; Dreyer, H.; Strandhagen, J.O. Automatic replenishment of perishables in grocery retailing: The value of utilizing remaining shelf-life information. Br. Food J. 2018, 120, 2033–2046. [Google Scholar] [CrossRef]
- Kiil, K.; Dreyer, H.C.; Hvolby, H.H.; Chabada, L. Sustainable food supply chains: The impact of automatic replenishment in grocery stores. Prod. Plan. Control 2018, 29, 106–116. [Google Scholar] [CrossRef]
- Ivanov, P. Improving Availability and Waste via Order Timing in Quickly Perishable Goods Retail. Master’s Thesis, Aalto University, Espoo, Finland, 2019. Available online: https://aaltodoc.aalto.fi/handle/123456789/39844 (accessed on 26 October 2020).
- Gruen, T.W.; Corsten, D.S. A Comprehensive Guide to Retail Out-of-Stock Reduction in the Fast-Moving Consumer Goods Industry; Grocery Manufacturers of America: Washington, DC, USA, 2007. [Google Scholar]
- Long, J.S. Regression Models for Categorical and Limited Dependent Variables; Sage Publications: Thousand Oaks, CA, USA, 1997. [Google Scholar]
- León-Bravo, V.; Caniato, F.; Caridi, M.; Johnsen, T. Collaboration for Sustainability in the Food Supply Chain: A Multi-Stage Study in Italy. Sustainability 2017, 9, 1253. [Google Scholar] [CrossRef]
- Ganesh, M.; Raghunathan, S.; Rajendran, C. The value of information sharing in a multi-product, multi-level supply chain: Impact of product substitution, demand correlation, and partial information sharing. Rev. Decis. Support Syst. 2014, 58, 79–94. [Google Scholar] [CrossRef]


Publisher’s Note: MDPI stays neutral with regard to jurisdictional claims in published maps and institutional affiliations. |
© 2021 by the authors. Licensee MDPI, Basel, Switzerland. This article is an open access article distributed under the terms and conditions of the Creative Commons Attribution (CC BY) license (http://creativecommons.org/licenses/by/4.0/).