Abstract
The application of topological optimization is currently considered one of the current trends. Because the shape of the components thus designed is the result of a design generated based on external influences acting on the model, their form can be considered almost optimal. For example, the extent of material savings resulting from shortening production cycles and reducing energy requirements is significant. Due to the way models are produced by layering the material in 3D printing, this technology makes it possible to get a little closer to the models’ optimal shape, for example, to produce prototype models for the production of injection moulds. The amazing amount of plastic and composite materials that this technology brings allows for a variable change in manufactured models based on requirements or external influences. These materials also include a group of materials and composite materials that are classified as biodegradable due to their composition. This fact, combined with the possibility of achieving the most optimal shape of components, contributes to reducing the environmental burden of such oriented production. This work presents the opportunities for modifying topological optimization outputs based on operating parameters and limits of additive production equipment fused deposition modeling (FDM). It gives the possibilities of using alternative ecological materials, their direct application, and the impact on creating models with the help of this technology. The final phase represents the result of the optimization process of the subsystem mechanism and the influence of the mechanical properties of biodegradable materials on the production process and the energy intensity of production. The aim of this work is to point out the fact and possibilities of using composite materials on a natural basis and their possible impact on reducing the environmental burden.
1. Introduction
One of the important issues in the field of sustainable development is the production and demand for plastic products. Given the results of current surveys, which point to the enormous market in particular areas, we can expect an increase in demand, production, and plastic waste in 2021–2027 []. Due to the global commitment to sustainable development in the production, processing, and disposal of plastic waste, products made of bio-based plastics and biodegradable plastics are increasingly preferred []. In connection with the environmental burden, a combination of both categories is, of course, ideal. As we can see in Figure 1, there is currently interest in BIO-plastics in various industries and sectors. The majority demand for plastic products can be observed mainly in the production of packaging materials []. However, compared to previous years, we can see a significant increase in the automotive and construction industries. BIO plastics play a major role in reducing vehicles’ weight and the associated fuel savings that directly affect CO2 production, reducing the environmental burden by consolidating these emissions [].
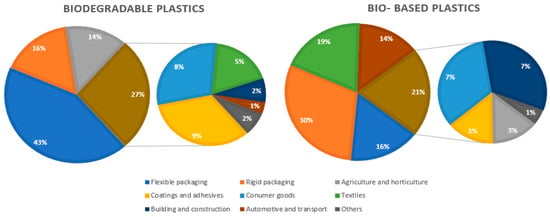
Figure 1.
Representation of bio and biodegradable plastics in different sectors [].
These materials also include polymerized polylactic acid (PLA). Unlike other materials in this group, PLA represents a group of plastics with a biological base belonging to the group of biodegradable materials []. These characteristics provide stable demand with a high growth assumption in the market predicted until 2027 [], as shown in Figure 2. In connection with this demand, an increase in the production of this type of material is expected as a response to the rise in demand.
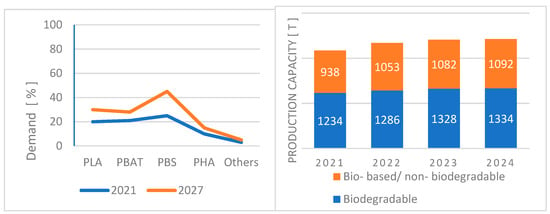
Figure 2.
Actual and assumed demand for various bio-degradable plastic based on global marketing [].
Due to its properties, composition, and versatile use, the PLA material is considered the ideal material that can replace some plastics formed as by-products of the petrochemical industry soon. The main raw material for its production is a base consisting of corn or potato starch, which is subsequently polymerized and processed to the desired state without any by-products []. The resulting material is easier to process than petroleum-based materials, such as e.g., acrylonitrile butadiene styrene (ABS) []. A characteristic feature of this polymer is the reduced resistance to external influences, which reduces the ability to withstand temperatures above 60 °C. This negative phenomenon can be modified by using different types of additives [,]. Creating the so-called PLA composite material and various elements allow us to adapt this material to the conditions in which it is to be used. [] The development of this type of composite materials is an important branch of the production and processing of plastics, but it also forms an integral part of additive production. In it, this development is one of the most promising areas. The output of a composite material by a combination of PLA plastic and various forms of cellulose is becoming promising from sustainable development in this respect [,]. This research brings the possibility of creating a material that, due to cellulose’s admixture, acquires to some extent, absorption effects and the very presence of cellulose promotes biological degradation in various environments. Figure 3 shows simple time dependence of the volume loss of PLA material in a controlled laboratory environment, simulating the conditions at a common municipal waste landfill. For example, a PLA plastic plate and PLA granulate are used compared to the paper alternative. It is clear from Figure 3 that despite the classification of PLA as biodegradable, the integral component’s degradation is lengthy []. For this reason, due to the growing demand and production capacity, it is assumed that PLA plastics and composites will accumulate in landfills at intervals of several years, which will lead to a consequent increase in the environmental burden.
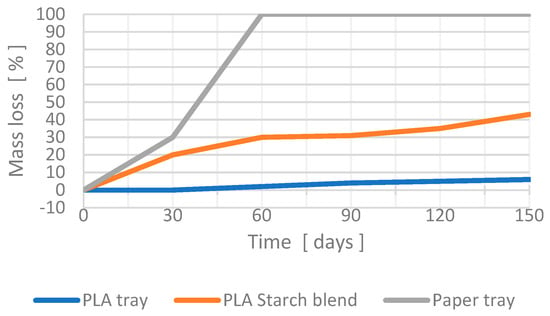
Figure 3.
Comparison in mass loss of various types of polymerized polylactic acid (PLA) compared to common paper tray used for food distribution [].
Because of these facts, this article’s main directions are to reduce the environmental burden caused by the production of PLA models in engineering, prototyping, and automotive production []. We currently consider the current topological optimization and additive output to contribute to solving this situation. Topological optimization methods, as part of generative design, contribute to creating the optimal shape of models. These result from a design generated based on the influences and loads acting on an individual model or structure []. Additive production is unique thanks to its usual method of model production, which allows you to get closer to the models’ optimal shape more than, e.g., conventional machining []. The combination of additive production, advanced materials, and topological optimization may have a major impact on the overall design and properties of specific types of products in the future.
In practice, many publications point out that the use of PLA (biodegradable material) is increasingly being used in the industry. This is also pointed out by various studies in which new mechanical and production properties of products manufactured using FDM technology are pointed out. The advantage is that the extruded components can be used in healthcare using the Bio-Composite Thermoplastic Filament. Their properties are breathability, lightness, good aesthetics, and rigidity. As interpreted in Calì M. et al. “A New Generation of Bio-Composite Thermoplastic Filaments for a More Sustainable Design of Parts Manufactured by FDM”, the use of biologically-based materials in combination with FDM technology is still a trend today. Equally interesting is the evaluation of such materials’ mechanical properties, which in some respects exceed the predicted mechanical properties and in some cases appear to be more durable than commercially used material. []
2. Methodology
An important aspect of the combination of additive FDM production technology is selecting material and setting the operating parameters of the FDM device, based on the material used [,,]. In this case, the material used was PLA and its cellulose-containing composite. Given that the basis of this material was PLA, we could assume that there would be no significant differences in production parameters. Another important aspect was the optimization conditions []. These were adapted so that the resulting model could be made using FDM technology. This technology or the model was created with several mechanical limitations that were taken into account when defining the optimization conditions.
Because of these facts, we divided the preparation itself into several partial goals that needed to be met to achieve the desired result. These goals can be characterized in the following steps:
- Step-determination of printing operating parameters. Clear definition of software limitations of model processing software. Analysis of the construction and method of production of models, determination of median limits of the device.
- Step-the selection of model material suitable for the goal of sustainable development in this area. Research and possibilities of production of alternative composites on the biological basis and study of their mechanical properties. Implementation of mechanical properties of these materials into a separate library used in optimization.
- Step-the selection of suitable software and method of the optimization process. We are taking into account the mechanical and software limitations of FDM devices in the optimization process.
- Step-analysis of the selected structure, its parameters, and forces are acting on the system. The subsequent release of the system and implementation of the results of this analysis into the optimization software.
- Step-comparison of the results of analyses with a sample non-composite material PLA and evaluate the effects connected with the change of volume, the time required for the production of models made from unique composites.
In the following chapters, we will approach the individual obstacles and limitations that we encountered during the issue’s solution. At the same time, we will present possible solutions and methods that will facilitate the individual steps and ensure the achievement of the expected results.
2.1. Fused Deposition Modeling Technology
Preproduction: in the pilot phase, it was necessary to create or digitize an object that would be made using an FDM device []. In this case, it was specific that the developed model would first be subject to topological optimization. Using this technology, an optimal model was generated on the basis of the action of external influences and mechanical loads, which was then exported in the required format [].
There is a lot of software for processing files into a program understandable to FDM devices. Some of this software is created by the device manufacturer, and their function parameters are modified for a specific device and its operation. Others do not have this limitation, and their use is general []. An important category was open-source programs. This type of program allowed a massive intervention in the parameters and operating conditions of the process itself and intervention in the resulting script, which allowed additional data manipulation. Programs considered included Cura and Simplify3D (Figure 4). These programs would enable us to perform all the necessary interventions associated with the modification of parameters for FDM equipment and optimize the production process to ensure the ideal production process of the optimized model.
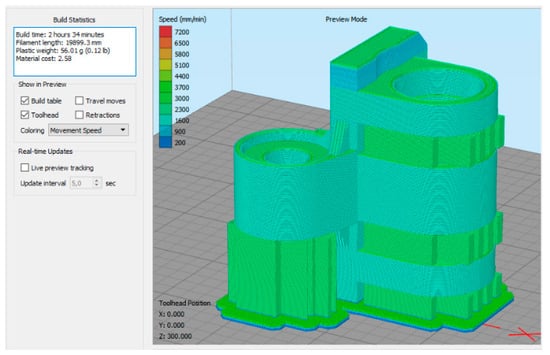
Figure 4.
Example of model processing in the program interface Simplify3D [authors own processing].
The first of the selected programs was Cura, a software created by Ultimaker B.V. The program is optimized for Ultimaker devices but has the option to choose various other types of commercially developed FDM devices []. Because the program allows extensive changes to settings, these profiles could be modified to meet the optimized models’ production requirements, whose demanding geometry often required additional intervention in production parameters []. The program itself consisted of two parts, Cura, and the Cura engine. The program also had its infrastructure of add-ons, which allowed various functions and thus allowed, e.g., the use of source data from the already mentioned formats OBJ and 3FM and AMF. The second program chosen was Simplify3D. This program is currently considered the market leader in data processing software for FDM devices. It has no default profiles and its settings are tied directly to the user experience []. It allowed extensive intervention in almost every parameter affecting the model’s production process and had the possibility of defining its equipment []. Thanks to the variability of options and settings, which are for solving printing optimized models, we chose the program Simplify3D.
Production: the principle of the method (Figure 5) was based on thermoplastic melting of the polymer in the form of a fiber (a), which was successively metered into the extruder (b), melted and extruded through the printhead. It was simultaneously applied to the flexible substrate (e) layer by layer. The fiber entered a partially liquid state due to the extruder’s temperature, which was kept close to the melting point of the material used. Because the ambient temperature was significantly lower, the material solidified quickly [,]. The printhead moved in the X and Y axes and accurately extruded and applied thin-film material to the substrate. After using the determined layer, the head moved upwards in the Z-axis and continued to apply the next layer []. The result of layering the solidified material on the previous layer was a plastic 3D model (c). The FDM process required the use of support structures for most overhanging geometry models. This means using another, mostly water-soluble material, which allowed the support structures (d) to be removed relatively easily after the operation was completed [,].
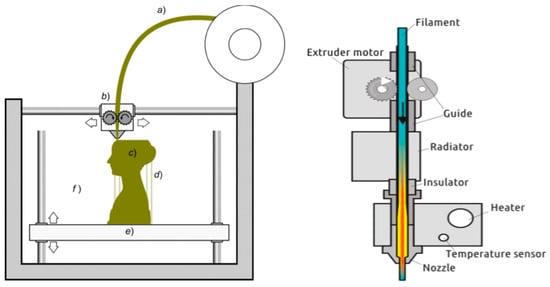
Figure 5.
Diagram of fused deposition modeling (FDM) device and print head [,].
The main problem we encountered with FDM technology was the mechanical limit, which was caused by the inner diameter of the print nozzle. It was standardized in various shapes and usable dimensions, including diameters from 0.1 to 0.8 mm for a 1.75 mm diameter filament. Due to how the material was layered with FDM technology, there was a boundary that defined the smallest possible dimension for the formation of the wall, or the outer or inner diameter [,]. Theoretically, it can be argued that the smallest diameter that can be produced by a 0.4 mm diameter nozzle is 0.4 mm. However, the reality was that the slicer, when generating coordinates for the print head, created the so-called circumferential per meters, the resulting number, the width of which corresponds to the width of the wall. It was then filled with the corresponding % of the infill []. These perimeters had separate settings for print head speed, initialization layer height, overlap, and more. Their final design had a significant effect on the mechanical properties of the prints. As shown in Figure 6, when using a 0.4 mm diameter nozzle, the critical limit was for the production of circular cross-sections with a sufficient number of circumferential perimeters and a 3 mm diameter fill. In the case of smaller cross-sections, the outer perimeters were deformed during the infill printing [].
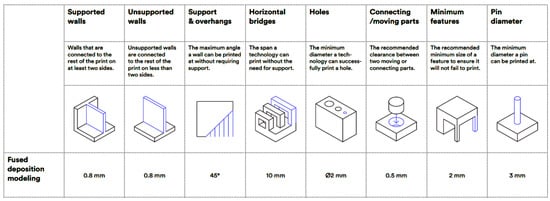
Figure 6.
Full assembly of SCARA type robotic arm, with A1 and A2 optimized parts [].
Postproduction: due to the nature and use of the product, various finishing operations were often required after modeling. Modifications included, for example, mechanical or chemical removal of support structures. [] We know several types of supports in connection with the material used and the type of FDM device. The most common are supports created by FDM devices with a single printhead. With this support, the support material was the same as the material from which the model was made. It differeds only in the preset parameters that the device used when creating it. This type of support was difficult to remove, especially from complex models that could be observed in topological optimization outputs [,]. When removing it, mechanical damage to the model often occurred. Devices enable a different approach to creating supports with multiple printheads or devices that allow the production process’s combination of materials []. In practice, this means that the device replaces the model’s material in the support area with support material []. It allows the use of different types of support materials, which can then be removed differently. For example, these methods include dissolving the support material in a special emulsion, water, or firing it to the end during the sintering process.
2.2. Material Selection
As already mentioned, there are currently many plastic materials on the market that are biodegradable, formed based on biodegradation, or a combination of both [,]. Most of them are suitable for filament management and subsequent use by FDM devices. In our case, we were mainly interested in the PLA material. Previous research indicates that the PLA material is formed by processing and subsequent polymerization of corn and potato starch []. A simplified procedure of this process can be seen in Figure 7. Therefore, it is noticeable that the processing of this material from plant components is relatively simple, no by-products are formed, and the material is partially degradable []. Besides, PLA can be considered as a typical and basic plastic material for additive production. The problem only occurs when processing PLA waste []. Its partial degradability can be interpreted as the ability to decompose under precise, direct laboratory conditions, which, e.g., in landfills, composts or seawater are difficult to find. Based on several publications, such as e.g., Plazza D. et al., Degradation of PLA in a simulated marine environment after 600 days, 2017, points to the extreme resistance of PLA material in a marine environment. It also states that a reduction in the resistance of the material in this environment can be achieved by using natural fibers, such as cellulose [,].

Figure 7.
Baseline of PLA processing [authors own processing].
Cellulose (Figure 8 a–c) as an admixture in various types of polymers to improve the ability of biodegradation of plastic waste is an increasingly topical issue due to the already mentioned values of plastics and plastic waste production []. Cellulose has several unique properties that make it unique in many areas. These include, e.g., toughness, biodegradability, high fluid absorption rate, high gloss, transparency, and much more []. For this reason, cellulose is an ideal material for application in the medical, manufacturing, textile, and automotive industries []. The production of cellulose acetate used in the selected material is more environmentally friendly than the production of polymers from fossil fuels. For comparison, the CO2 production in the production of 1 kg of Polypropylene is approximately 1.8 kg. While in the production of cellulose the production of CO2 is zero, due to the production of cellulose from biomass, which absorbs CO2. However, despite its positive properties, cellulose acetate has a relatively small share of the market, which is due to higher economic costs [,]. These relate to the use of wood pulp in other sectors [].

Figure 8.
Raw materials and products of cellulose acetate [].
Our research aimed to simulate the topological optimization of models made of PLA plastic with cellulose admixture. This material must first be processed into a filament, i.e., a fiber usable for FDM devices []. Fiber production was a process that allowed us to process plastic granulate into a string with diameters of 1.85 and 3 mm. The actual output of the filament intended for the FDM technology took place on devices whose operation principle was based on the following scheme (Figure 9) []. These devices worked with either one or two screws. The difference in the resulting extruded material was the degree of mixing of the composite material’s components.

Figure 9.
Schematic of conventional extruder [].
The commercially available material UPM Formi was the chosen material used for the design and observation of differences in topological optimization results, the time frame of production of individual models, and the possible saving of the used material (Table 1) []. The different percentage content of cellulose in the PLA plastic allowedd us to monitor the optimization process for the production of the device itself []. In contrast, we use pure, standard PLA material to compare and evaluate the results. Another planned research was the production of our composite material and the investigation of its properties []. UMP material forms and results of the optimization process presented in this publication will be used to obtain the necessary data and simulate composite PLA materials’ behavior with different percentages of cellulose.

Table 1.
Mechanical properties of various types UPM Formi 20, 20/ 19, 40 [].
One of FDM technology’s main limitations is the surface quality of the created models and their strength []. These shortcomings are due to the same method of layering the thermoplastic material, which causes various kinds of deformations and weaknesses []. These include, for example, an error in the layering of composite materials. It may be due to the insufficient density of the filling, or the inadequate number of perimeters enclosing the model at its lower or upper part. These defects can be seen in Figure 10. Similar defects are assumed for composites with a higher cellulose content. The higher cellulose content caused the material to crumble and weaken. Due to these facts and the fact that cellulose contains hydrogen bonds, which are problematic in the extrusion itself, we assumed similar defects in these samples (Figure 10).
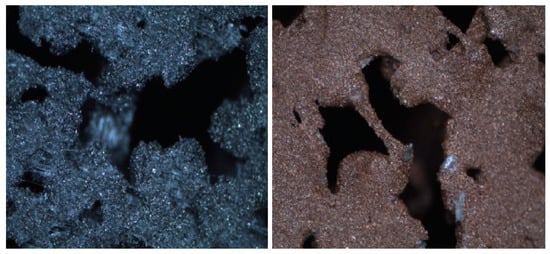
Figure 10.
Defects in the layering of composite PLA materials (on the left side-PLA with an admixture of stainless steel, the material on the right side again PLA with an admixture of copper) [authors own processing].
As mentioned, a significant shortcoming of FDM technology was how the resulting model was created []. Since the production process itself consisted of layering different types of materials, it was obvious that these layers’ formation would affect its resulting mechanical properties. However, these properties were related to the density of the fill and the number of outer perimeters, which could increase the strength of the model []. The orientation of the printout or its surfaces concerning the device’s coordination system had a significant influence.
2.3. Topology Optimization
The design and modification of a component usually consist of the transformation of already designed and used parts, the parameters, and the design used for a long time []. If the usual procedure is not available, the creation of conceptual designs is followed. These consist of the structure of parameters that reflect the environment’s requirements in which the component is used. Then the whole process is adapted to the possible ways of conventional production [,]. An alternative to this design is to use the optimization of the shape of the components and their topology. This method is used in cases where it is necessary to design or modify a model to be located in a particular place, withstand predefined forces, or relieve it. Topological optimization is thus a way of creating components from complex blocks []. Their final shape is the result of parameters defined before the process itself. These parameters include e.g., minimizing/maximizing volume, displacement, or the ability to resist displacements, minimizing the size of the elements used (Figure 11) [].

Figure 11.
Optimization process chronological order, from CAD part to manufactured object [].
2.3.1. Discrediting
Topological optimization is a form of structural optimization that aims to design the resulting model’s optimal shape [,]. In essence, this means that the material is distributed only where it is necessary in terms of loading during the optimization process (Figure 12) []. The body thus proposed was decomposed into a lattice (network) using the finite element method; this network is called an isotropic solid microstructure [].

Figure 12.
Solid (black) and void (white) elements of the optimized design shown on theoretical analysis and after SIMP method application [].
Discretization is performed in order to create functions, variables, models, and complex equations that are suitable for numerical evaluation and its implementation for computational technology [,]. The solution itself uses optimization methods to determine which of these places located on the grid (network) should be empty and vice versa. It creates an integer problem in which each element has two phases, 0 and 1. Given that the number of possible combinations is 2n, where n = the number of elements, this solution creates a relatively impractical problem with the number of individual elements located in the grid (network) []. There are two methods to solve this problem. The first method is the solid isotropic microstructure with penalization method (SIMP), dealing with the density of the grid (network), the second solution is the homogenization method. Due to the design’s nature, designed to optimize the model for FDM production, the SIMP method was decisive for us [].
2.3.2. Solid Isotropic Microstructure with Penalization Method (SIMP)
The SIMP method is based on the prediction of the optimal material distribution in the optimized area []. This distribution reflects specific loads, limitations, production limits, and performance requirements. The use of the established function for optimal distribution of material results in the solution of binary problems of optimized areas [,,,]. The answer is that for each element there is a relative density, the value of which can range between pmin, i.e., the minimum allowable density value for elements greater than 0, up to 1. As a result, it is possible to assign average density values for individual elements of the grid (mesh), these are subsequently characterized as porous. All elements whose value is between 0 and pmin are evaluated and displayed as empty, p = 0. Such an interpretation of the density values of the individual elements results in a lower number of errors in the finite element method. [] Since the relative density of the material pe is constantly changing for each element due to this process, it is obvious that Young’s modulus varies for each element (Figure 13) []. Accordingly, each element e has a relationship between the relative density factor, pe, and Young’s modulus of the associated isotropic material, E0. Therefore:
E(pe) = E0pep
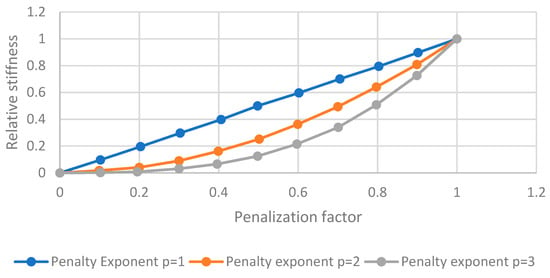
Figure 13.
Relation between relative density and stiffness according to penalization factor [].
E(pe)—stiffness tensor/ local stress-strain relation
pe—material relative density factor
p—penalty factor value
E0—Young’s modulus of assigned isotropic material) [].
The use of the so-called penalty factor p reduces the impact of elements with intermediate densities on the model’s resulting stiffness. The penalty factor optimizes the solutions to clearly define which of the elements are full (pe = 1) or empty (pe = 0). For materials with Poisson’s constant v = 0.3, it is recommended to use a penalty factor p = 3 [].
The SIMP method is a common standard in topological optimization and was also used by our chosen Inspire program. This method was especially evident in the production area, given the possibility of integrating production requirements and constraints, which were directly implementable in the optimization process and the subsequent creation of a model suitable for production []. The optimal solution was if all elements were filled to 100% or 0%. Due to its course, the SIMP method had several problems. A significant complication in this direction was the use of a lattice (network) structure of models. In the technical field, this problem is called checkerboard. The checkerboard problem consisted of a periodic pattern created during optimization, which was formed by elements with a density of 100% and 0%, the location of which did not correspond to the optimal distribution of the material [,]. This negative phenomenon could be classified as a third “product” that was not penalized during optimization. Its occurrence was caused by errors arising in the definition of finite elements, as a consequence of increasing stiffness, which was excessively interconnected in the corners of the model []. The emerging pattern itself was initially considered part of the optimized microstructure but was later reclassified to numerical noise. By eliminating it from the optimization process, the resulting model was somewhat closer to its ideal shape (Figure 14) [].
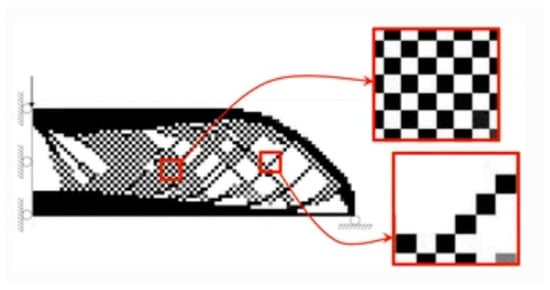
Figure 14.
Example of how numerical instabilities lead to the so-called checkerboard pattern [].
As an example of the work of the optimization software working with the SIMP method, we can mention the support of the Fairchild Dornier 728–100 aircraft doors (Figure 15) []. The optimization aimed to reduce the weight and maintain the rigidity of this model. The optimization result was a model, later a part with the resulting weight, which was 20% lower than the original model, respectively, its weight was reduced from 9.16 kg to 7.5 kg. The time required to design this model was also reduced from 3 months to 3 weeks [].
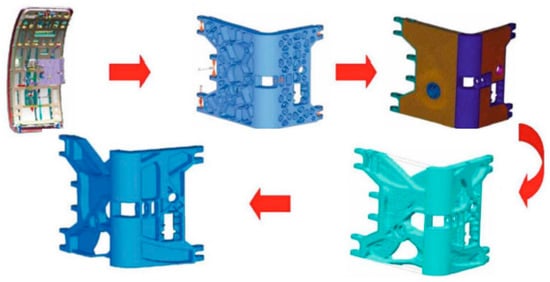
Figure 15.
Topology optimization of door support [].
2.4. Choosing a Software
Due to the current trend in using the industry’s generative design, it was necessary to choose specialized software initially []. Due to the already mentioned SIMP method, which was considered ideal for the production area, the Altair Inspire software was chosen. The possibilities of modifying the optimization process parameters were fully satisfactory. They often corresponded to the FDM slicer settings used to obtain data on the method of printing the samples. As part of the topological optimization of any model, it is necessary to follow several rules. The program we chose allowed us to design several of these requirements to correspond to the FDM device’s requirements (Figure 16). Within the program’s interface, we worked with the entire subsystem loaded in the STEP format. This format contained enough data needed for the optimization process and we achieved the best synchronization with it as part of the solution [].
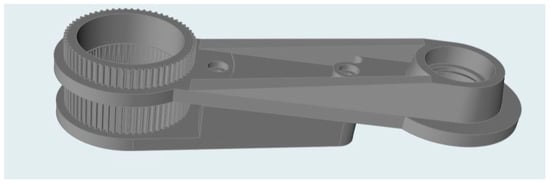
Figure 16.
Subsystem displayed in the Inspire interface [authors own processing].
The first of several important functions enabling the so-called Intuitive control of the program was the use of the operation of connections and the library of connecting elements itself []. The software itself searched for coaxial holes and suggested adding nuts and screws from a predefined catalog. The diameters, lengths, and other parameters of the screws were generated based on the model’s geometry. The use of this function can be seen in Figure 17.

Figure 17.
Generating screw connections from an available library [authors own processing].
The next function was the partition. This feature belongs to the modeling category. It allowed us to define the area around, for example, holes for screws, gears, etc. without re-exporting/importing and modifying the original CAD system []. An example of this function is shown in Figure 18. As part of the assignment’s solution, we used this function to define the holes for screws, bearings, and the toothing area of arm 1. It represented the truncated area was still linked to the original model, but couldd be ignored during optimization [,]. Subsequent to the optimization process that we used in the work solution, the task was to reduce the volume of material of the model according to the set conditions, the definition of these areas was necessary. Otherwise, they would be deformed to partial removal, which would prevent e.g., bearing placement or creating screw connections.

Figure 18.
Using the partition function [authors own processing].
Within the solution of the selected issue, we had a choice of two specific methods of solution. The first was the application of topological optimization based on individual components’ boundary conditions, i.e., applied directly to a particular selected part of the model. The second possibility of results from the definition of boundary conditions within the whole kinematic assembly, a functional assembly of a scara-type robot model, and the subsequent optimization of individual subsystems.
Optimization of individual subsystems is a complicated process involving a functional kinematic model and the most accurate information about its operating parameters. Since the model used to solve this problem was only conceptual, we decided to optimize one of the arm’s subsystems []. It was sufficient to optimize selected components for subsequent production using FDM devices.
The optimization process itself consisted of repeated optimizations of the shape of both components of the subsystem []. During these repetitions, the boundary conditions derived from the maximum operating parameters of the optimized assembly did not change. The change in the component optimization parameters consisted only in transforming the material of the optimized parts [].
2.5. Preparation of the Optimization Module
The definition of the boundary conditions themselves was, in our case, relatively simple. Since we had a complete robotic arm model at our disposal during the solution to this problem, calculating the weight of the components stored behind and on the optimized A1 and A2 was easy to read from the Inspire software []. After removing the excess parts of the structure, which would only prolong the optimization, we replaced them with ankle, forces, and moments corresponding to the read parameters. Figure 19 shows that the robotic arm components selected for optimization form the top and bottom of the first stage of the robotic arm. Due to their location and the fact that other components of the arm were attached to these components, we considered them to be key.
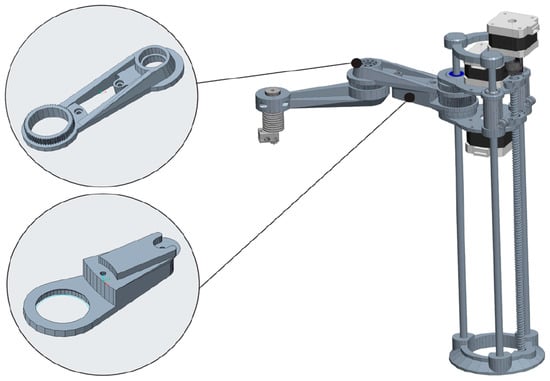
Figure 19.
Full assembly of SCARA type robotic arm, with A1 and A2 optimized parts [authors own processing].
For this reason, they had a suitable precondition for the interpretation of topological optimization modified for additive production and the interpretation of possible outputs using composite materials [].
Given the optimization and its result, we oversaw compliance with all measures that the resulting model had to meet before additive manufacturing []. Some of these parameters could not be defined before the optimization began. For this reason, it was often necessary to modify the N.U.R.B.S model, which often caused a slight deviation from the optimum shape []. Figure 20 shows the areas shown in brown on the models, which were optimized using the already mentioned SIMP method. By penalizing the individual elements to which the model would be divided during optimization, we obtained the resulting model. It corresponded to the specific composite, its mechanical properties, and constant boundary conditions.

Figure 20.
Definition of the area designated for the PLA material optimization process [authors own processing].
3. Results of Optimization of Individual Parts of the Subsystem
Since we chose the optimization of smaller units, the so-called subsystems of the assembly also reflected the time needed to display the analyses and subsequent shape optimization results []. In individual models, it lasted up to 402 min for A1 and 321 min for A2. Inspire software primarily analyzed the entire subsystem based on defined materials, model geometry, and optimized area [,]. The next step was to optimize the shape of the component based on the analysis results and the user requirements. In our case, this requirement was the maximum possible reduction in the volume of material []. This variant was chosen as the most optimal in terms of the idea of sustainable development, for which the shortening of production processes and the reduction of future plastic waste made the most sense [,]. We focused on the possibility of maximum material savings without degrading the subsystem’s properties and the design of the device itself (Figure 21).

Figure 21.
Results of individual analyzes of PLA material components (from left R1, R2) [authors own processing].
Based on the results of the analyses shown in Figure 22, the software automatically suggested possible areas with different percentages of material savings or sites penalized by loss or partial reduction in their volume []. As can be seen, despite the same boundary conditions, these results were markedly different. Due to several other parameters with which we could intervene in the optimization process itself, we focused on three specific ones connected with our solution []. Among the parameters that could be manually intervened in the optimization process were e.g., maximum and minimum width of walls, frequency of oscillation of the system, way of drawing the optimized part’s geometry, and many others []. Three of these parameters were decisive for our solution since we were considering a robot system type arranged to SCARA structures as a device whose components were created using FDM technology. The first choice was to reduce the volume. Two parameters limited this, the first was the percentage of the resulting model volume, and the second was the safety factor. We used the default mean value proposed by the software-derived work from a safety factor of 1.2. Thus, the volume reduction for all optimized models was 30%. We set the parameter limiting the minimum width of the walls or columns to 120% of the value of the hole’s diameter located on the printing nozzle []. This device was to produce the resulting components. Due to the mechanical limit of the printhead FDM device [], it was not physically possible to form an element with a radius equal to or smaller than the nozzle diameter. The method of plotting the optimized areas’ geometry was chosen so that each of the models had one flat bearing surface []. It would ensure better placement of the model on the printing pad and increase its adhesion.

Figure 22.
Results of the optimization process R1 and R2 [authors own processing].
Based on these definitions, we achieved results on A1 and A2. The resulting models’ samples can be seen in Figure 23, where the optimized models were stored directly on the assembly subsystem. This subsystem had been optimized as a whole. For the sake of better clarity, Figure 23 contains more detailed images of the optimization results with the corresponding areas, which were not part of the optimization process due to the partition function.
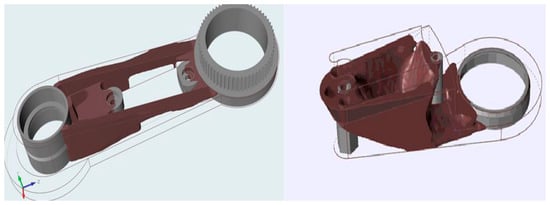
Figure 23.
Detailed display of optimized areas R1 and R2 [authors own processing].
The Inspire software allows you to modify the optimization results using the so-called N.U.R.B.S modeling within its capabilities. This type of modeling is different from parametric modeling used in CAD systems. Rather, it resembles volumetric modeling in the Blender or Maya 3D interface []. In our case, even though the models were intended for production using FDM technology, it was not necessary to significantly interfere with their shape. Within the models, only a few separate elements were removed, displayed by the software in areas outside the optimized site [,,]. We assumed that these were components that did not affect the result, which was generated only due to incorrect penalty of the element and the parameters correcting the optimization (Figure 24).
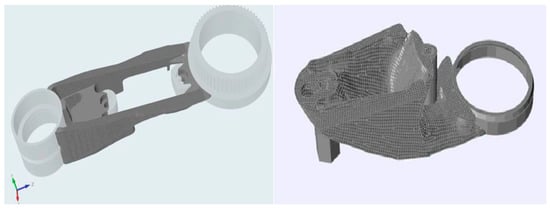
Figure 24.
Modifying models using the N.U.R.B.S function (from the left the optimized part, the optimized part associated with the partitions defined by the partition function) [authors own processing].
The resulting models, shown in Figure 24, were reconnected to the non-optimized parts after modification and exported in STL format []. This format was used to generate paths and parameters for FDM additive manufacturing equipment. Subsequent processing of these files can be seen in Figure 25.
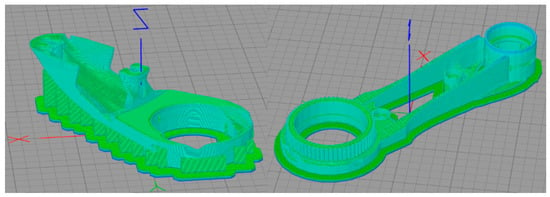
Figure 25.
Import models in STL format into Simplify(3d) [authors own processing].
In the previous chapter, we presented consistent settings and how to work with the model within the interface of the selected software. After a thorough analysis, optimization, and implementation of the results into the Simplify3D software, we could proceed to the final evaluation []. As part of solving the problem, we could evaluate if we achieved an average saving of 25.16% in time required to produce the A1 model and a 20.81% saving in the A2. The individual times necessary to make the subsystem’s optimized and non-optimized parts are presented in Table 2.

Table 2.
Comparison of the time required to print the original and optimized components [authors own processing].
Based on the results interpreted in Table 3, we achieved a surprising saving in the volume of material needed to print the individual components. The average savings of 28.16% for A1 and 20.81% for A2 would significantly reduce the production’s material consumption through FDM technology []. It should be noted that due to the shape complexity of the optimized elements, the supporting material was included in the total weight of the model within the optimized parts.

Table 3.
Comparison of weights of the original and optimized model [authors own processing].
Given the obtained results, it could be said that the technology of topological optimization in combination with additive production has great potential in the future. It had various options and modifications that allowed us to modify this process so that its results had the most beneficial impact on model production through additive production.
4. Conclusions
At present, the demand for plastic and composite materials is growing. The consequence of this demand is a simultaneous increase in the ability to produce an increasing amount of plastic materials. This growing trend, opens the door to tools that make it possible to move towards sustainable development and mitigate various industries’ environmental impact.
This paper presents several tools already mentioned, which may positively impact this situation’s development in the future. These tools include the topological optimization method and additive manufacturing technology. Topological optimization allows us to achieve a partially optimal shape of the components, the subsequent production of which using additive production enables the production of complex models quickly. For this purpose, the FDM technology is chosen, which we consider being ideal in this respect for several reasons. The work describes the fulfillment of partial goals in various areas. It thoroughly explains the issues that we encounter when connecting these technologies and points to the possibility of the interconnection of topological optimization methods and additive production.
The use of FDM technology allows us to use its composite materials from biodegradable or biodegradable polymers. A combination of PLA and cellulose is also such a polymer. While PLA material is considered a biodegradable bioplastic under strict conditions, it is known that these conditions are rarely present at sites of plastic. According to current knowledge, cellulose in PLA has a negative effect on the environmental resistance of the PLA material, thus contributing to its easier degradation, which we consider a positive phenomenon in terms of long-term sustainable development.
Combining these three tools and applying them to a specific example, the material savings in the additive method of model production have been demonstrated. It reached 45.45% for materials with different percentages of cellulose for material with 20% cellulose admixture, 33.91% for material with 40% cellulose admixture, and for the last type of composite, the saving was 42.09% compared to the original model design. Significant savings were also noticeable with arm A2, namely, 46.50% for material 3D20, 36.10% for material 3D40, and 48.92% savings for material 3D19/20. In connection with saving the used material, the time saving, which is a part of the final evaluation, was also a matter of course. In connection with the possible negative effect of cellulose on the polymer’s mechanical properties, an optimized model of 100% PLA without impurities was used as a basic pattern. By comparing the simulations of composite models with this sample, it is demonstrable that the percentage saving of the material is in the range of ±5%. We do not expect a significant impact on the resulting mechanical properties of such models. The application of these tools in plastics processing can be considered one of the important milestones to achieve a sustainable state. Additive manufacturing technologies and the development of new materials for this technology are key elements in minimizing and utilizing recycled fuel waste in some industries. Combining this technology with optimization methods adds new possibilities for the use and application of these technologies, the global use of which may partially mitigate the environmental impact.
Author Contributions
Conceptualization, J.K. and L.K.; methodology, J.K.; software, J.K.; validation, Š.G., J.P. and J.H.; formal analysis, J.K. and J.P.; investigation, J.K.; resources, J.H.; data curation, Š.G.; writing—original draft preparation, J.K.; writing—review and editing, L.K.; visualization, L.K.; supervision, L.K.; project, Š.G. All authors have read and agreed to the published version of the manuscript.
Funding
This paper is a part of the project VEGA n. 1/0116/20—Research of Application of Structural Topology in a Structure of New Generation of Moulds by 3D Printing Technology.
Institutional Review Board Statement
Conceptualization, J.K. and L.K.; methodology, J.K.; software, J.K.; validation, Š.G., J.P. and J.H.; formal analysis, J.K.; investigation, J.K.; resources, J.H.; data curation, Š.G.; writing—original draft preparation, J.K.; writing—review and editing, L.K.; visualization, L.K.; supervision, L.K.; project administration, J.K.; funding acquisition, Š.G. All authors have read and agreed to the published version of the manuscript.
Conflicts of Interest
The authors declare no conflict of interest.
References
- Bioplastics Market Size, Share & Trends Analysis Report by Product (Biodegradable, Non-Biodegradable), by Application (Packaging, Automotive & Transportation, Textile), by Region, And Segment Forecasts, 2020–2027. Available online: https://www.grandviewresearch.com/industry-analysis/bioplastics-industry (accessed on 23 December 2020).
- Dey, A.; Yodo, N. A Systematic survey of FDM process parameter optimization and their influence on part characteristics. J. Manuf. Mater. Process. 2019, 3, 64. [Google Scholar] [CrossRef]
- Khademhosseini, A.; Gulden, C.-U. 3D Bioprinting in Regenerative Engineering; CRC Press series: Boca Raton, FL, USA, 2018; p. 401. [Google Scholar]
- Calì, M.; Pascoletti, G.; Gaeta, M.; Milazzo, G.; Ambu, R. A New Generation of Bio-Composite Thermoplastic Filaments for a More Sustainable Design of Parts Manufactured by FDM. Appl. Sci. 2020, 10, 5852. [Google Scholar] [CrossRef]
- Ahlers, D. 3D Printing of Nonplanar Layers for Smooth Surface Generation. Master’s Thesis, MIN- Fakultät, University of Hamburg, Hamburg, Germany, 2018; pp. 13–19. [Google Scholar]
- Harrison, I.; Huttenhuis, P.J.G.; Heesink, A.B.M.; Enschede, P.T.B. BIOCA—Biomass Streams to Produce Cellulose Acetate; Department of Chemical Engineering, Twente University, Enschede, Procede Twente B.V.: Enschede, The Netherlands; Available online: https://www.researchgate.net/publication/237673369_BIOCA_-_Biomass_Streams_to_Produce_Cellulose_Acetate (accessed on 21 December 2020).
- Gibson, I.; Rosen, D.; Stucker, B. Additive Manufacturing Technologies; Springer: New York, NY, USA, 2015; p. 498. [Google Scholar]
- Qiu, G.Y.; Hu, P.; Zhou, W. Two-dimensional structural topology optimization based on isogeometric analysis. In Applied Mechanics and Materials; Trans Tech Publications Ltd.: Stafa-Zurich, Switzerland, 2014; Volume 472, pp. 475–479. [Google Scholar]
- Stoneman, S.; Lampariello, R. Embedding nonlinear optimization in RRT* for optimal kinodynamic planning. In Proceedings of the 53rd IEEE Conference on Decision and Control, Los Angeles, CA, USA, 15–17 December 2014; pp. 3737–3744. [Google Scholar]
- Guo, X.; Cheng, G.D. Recent development in structural design and optimization. Acta Mech. Sin. 2010, 26, 807–823. [Google Scholar] [CrossRef]
- Key Design Considerations for 3D Printing. Available online: https://www.3dhubs.com/knowledge-base/key-design-considerations-3d-printing/ (accessed on 25 December 2020).
- Pollák, M.; Kaščák, J.; Telišková, M.; Tkáč, J. Design of the 3D Printhead with Extruder for the Implementation of 3D Printing from Plastic and Recycling by Industrial Robot. TEM J. 2019, 8, 709–713. [Google Scholar]
- Degradation of PLA in a Simulated Marine Environment after 600 Days. Available online: https://www.longdom.org/conference-abstracts-files/2252–5211-C1-006-005.pdf (accessed on 23 December 2020).
- Scopigno, R.; Cignoni, P.; Pietroni, N.; Callieri, M.; Dellepiane, M. Digital Fabrication Techniques for Cultural Heritage: A Survey. Comput. Graph. Forum 2015, 36, 6–21. [Google Scholar] [CrossRef]
- Kuznetsov, V.E.; Tavitov, A.G.; Urzhumtsev, O.D.; Mikhalin, M.V.; Moiseev, A.I. Hardware Factors Influencing Strength of Parts Obtained by Fused Filament Fabrication. Polymers 2019, 11, 1870. [Google Scholar] [CrossRef] [PubMed]
- Meggiorin, M. Fused Deposition Modeling of 3D Porous Structures and Their Characterization. Master’s Thesis, University of Padua, Padua, Italy, 2018. [Google Scholar]
- UPM Formi 3D Data Sheet. Available online: https://www.upmformi.com/siteassets/documents/formi-3d/upm-formi-3d-product-data-sheet-en.pdf (accessed on 23 December 2020).
- Smith, J. Redesigning a Bicycle Crank Arm for Metal Additive Manufacturing by Applying DFMAM Guidelines to the Topology Optimization Process; Western Carolina University: Cullowhee, NC, USA, 2019. [Google Scholar]
- Pollak, M.; Kascak, J.; Torokova, M.; Kocisko, M.; Dobransky, J. Topological Optimization of a Supporting Part of a 3D Printer Pad. Manuf. Technol. 2020, 20, 492–499. [Google Scholar]
- Liu, J.; Gaynor, A.T.; Chen, S.; Kang, Z.; Suresh, K.; Takezawa, A.; Li, L.; Kato, J.; Tang, J.; Wang, C.C.L.; et al. Current and future trends in topology optimization for additive manufacturing. Struct. Multidiscip. Optim. 2018, 57, 2457–2483. [Google Scholar] [CrossRef]
- Olason, A.; Tidman, D. Methodology for Topology and Shape Optimization in the Design Process. Applied Mechanics. Master’s Thesis, Chalmers University of Technology, Goteborg, Sweden, 2011. [Google Scholar]
- Marck, G.; Nemer, M.; Harion, J.-L.; Russeil, S.; Bougeard, D. Topology Optimization Using the SIMP Method for Multiobjective Conductive Problems. Numer. Heat Transfer Part B Fundam. 2012, 61, 439–470. [Google Scholar] [CrossRef]
- Parameters for Standard Linear Static Topology Optimization. Available online: https://abaqus-docs.mit.edu/2017/English/TsoUserMap/tso-c-user-TopOpt-Sett-LStaTop.htm (accessed on 21 December 2020).
- Fiebig, S.; Sellschopp, J.; Manz, H.; Vietor, T.; Axmann, K.; Schumacher, A. Future challenges for topology optimization for the usage in automotive lightweight design technologies. In Proceedings of the 11th world congress on structural and multidisciplinary optimization, Sydney, Australia, 7–12 June 2015; Volume 142, pp. 1–8. [Google Scholar]
- Polak, R.; Sedlacek, F.; Raz, K.; Katalinic, B. Determination of FDM printer settings with regard to geometrical accuracy. In Proceedings of the 28th DAAAM International Symposium, Zadar, Croatia, 8–11 November 2017; pp. 0561–0566. [Google Scholar]
- Židek, K.; Maxim, V.; Pitel, J.; Hosovsky, A. Embedded vision equipment of industrial robot for inline detection of product errors by clustering-classification algorithms. Int. J. Adv. Robot. Syst. 2016, 13, 1–10. [Google Scholar] [CrossRef]
- Michalik, P.; Hatala, M.; Straka, L.; Petrus, M.; Macej, J.; Jusko, J.; Tirpak, P. Optimizing Component Production with Multi-axis Turning Technology. In 4th EAI International Conference on Management of Manufacturing Systems; Springer Nature: Cham, Switzerland, 2020; pp. 273–283. [Google Scholar]
- Dilyova, M.; Hatala, M.; Radchenko, S.; Botko, F.; Mitaľová, Z. Optimalization of parameters for measurement of the tribological properties of coating for machine parts. In Proceedings of the International Conference on Social and Technological Development; University PIM: Banja Luka, Bosnia and Herzegovina, 2019; pp. 357–361. [Google Scholar]
- Janáčová, D.; Pitel, J.; Vasek, V.; Mokrejs, P.; Viteckova, M.; Drga, R.; Krenek, J. Simulation of printed circuit boards recycling process. In Proceedings of the International Conference on Circuits, Systems, Communications and Computers, Athens, Greece, 14–17 July 2019; Édition Diffusion Presse Sciences: London, UK, 2019; pp. 1–4. [Google Scholar]
- Ngo, T.D.; Kashani, A.; Imbalzano, G.; Nguyen, K.; Hui, D. Additive manufacturing (3D printing): A review of materials, methods, applications and challenges. Compos. Part B Eng. 2018, 143, 172–196. [Google Scholar]
- Leary, M. Design for Additive Manufacturing; Elsevier: Amsterdam, The Netherlands, 2020; p. 358. [Google Scholar]
- Yuang, S.; Shen, F.; Chua, C.K.; Zhou, K. Polymeric composites for powder-based additive manufacturing: Materials and applications. Prog. Polym. Sci. 2019, 91, 141–168. [Google Scholar] [CrossRef]
- Singh, R.; Davim, J.P. Additive Manufacturing: Applications and Innovations, 1st ed.; CRC Press: Boca Raton, FL, USA, 2018; p. 280. [Google Scholar]
- Li, N.; Huang, S.; Zhang, G.; Qin, R.; Liu, W.; Xiong, H.; Shi, G.; Blackburn, J. Progress in additive manufacturing on new materials: A review. J. Mater. Sci. Technol. 2019, 35, 242–269. [Google Scholar] [CrossRef]
- Zhang, J.; Jung, Y.G. Additive Manufacturing: Materials, Processes, Quantifications and Applications; Butterworth-Heinemann: Oxford, UK, 2018; p. 362. [Google Scholar]
- Babu, S.S.; Love, L.; Dehoff, R.R.; Peter, W.; Watkins, T.; Pannala, S. Additive manufacturing of materials: Opportunities and challenges. MRS Bull. 2015, 40, 1154–1161. [Google Scholar] [CrossRef]
Publisher’s Note: MDPI stays neutral with regard to jurisdictional claims in published maps and institutional affiliations. |
© 2021 by the authors. Licensee MDPI, Basel, Switzerland. This article is an open access article distributed under the terms and conditions of the Creative Commons Attribution (CC BY) license (http://creativecommons.org/licenses/by/4.0/).