Article

UltraBrix: A Device for Measuring the Soluble Solids Content in Sugarcane

by
Marcus V. Americano da Costa
1,
Cristiano Hora Fontes
1,*,
Gregor Carvalho
2 and
Edison Camilo de Moraes Júnior
2,*
1
Graduate Program in Industrial Engineering, Federal University of Bahia, Salvador 40210-630, Brazil
2
Computing Department, Federal Institute of Alagoas, Maceio 57035-660, Brazil
*
Authors to whom correspondence should be addressed.
Sustainability 2021, 13(3), 1227; https://doi.org/10.3390/su13031227
Submission received: 20 November 2020 / Revised: 18 January 2021 / Accepted: 19 January 2021 / Published: 25 January 2021

Abstract

:
Human interference in production systems becomes feasible through the use of specific devices that, among other functions, allow the monitoring, control and optimization of processes. One of the drawbacks encountered in the sugar and ethanol industry is the lack of instruments for the measurement of the °Brix concentration in sugarcane that are low-cost and non-destructive. The measurement and monitoring of the °Brix concentration in the cane are necessary to identify the appropriate time for harvesting in order to reach the peak sucrose content in the cane, obtaining maximum yield from a given crop. Based on several measurement devices available in the current market that involve non-destructive technologies for the monitoring of physical-chemical properties of food, this paper proposes a new low-cost meter to measure °Brix in sugarcane. The device uses the continuous wave technique consisting of two piezoelectric transducers (signal transmitter and receiver), a pulse generator, an instrumentation amplifier with a bandpass filter and an amplitude meter. The developed measuring instrument is feasible and represents a promising alternative for the sugar and alcohol industry.

1. Introduction

It is estimated that about 1 billion metric tons of sugarcane are grown in an area of 26.7 million hectares in 105 countries. Brazil is the largest producer in the world, supplying about 40% of all sugarcane, followed by India (18%) and China (6%) [1]. Sugarcane is an important source of food and bioenergy and a high-value product for the economy and trade balance in many tropical and subtropical countries [2].
Sugarcane is composed of fiber (10–18%) and broth (80–90%). The fiber consist of cellulose, hemicellulose and lignin, and the broth consists of water (75–82%) and soluble solids content (18–25%). Soluble solids content consists of non-sugars (1%–2%) and total reducing sugars (sucrose 14–24%, glucose 0.2–1% and fructose 0–0.5%).
The °Brix scale, proposed in 1798 by Adolf Ferdinand Wenceslaus Brix, relates the amount of solid compounds (sugar) in a solution of sucrose with the refractive index of light incident on this same solution [3].
The quality of sugarcane for subsequent production of sugar and alcohol is an important factor in the performance of sugar and ethanol industries. Sugarcane pricing systems in various parts of the world are based on the quality and weight of sugarcane [4]. In the process of the must (juice nectar) fermentation in the sugar and ethanol industry, the high sugar concentration is directly associated with the efficiency of the ethanol generation process [5]. A higher concentration of °Brix in the must leads to an increase in the yield of ethanol production, besides a reduction in the cost of production [6,7]. One unity of 60 °Brix corresponds to 1 g of sugar per 100 g of sucrose solution at 20 °C [3].
The main determining factors for choosing a °Brix-measuring instrument are the type of sample used (juice or stem), sampling time, sample preparation, the number of samples required for each measurement and the cost of the equipment [8].
The most commonly used commercial techniques for the determination of °Brix in sugarcane include the use of refractometer, chromatograph, biosensor, °Brix hydrometer, spectroscope and the chemical analysis normally performed in the digital saccharimeter of °Brix. Among these, the spectroscope is a unique non-destructive device that, in addition to providing fast measurement with high accuracy, enables real-time monitoring. However, its high cost makes it unfeasible for real-time monitoring, as shown in Table 1.
The measurement delay intrinsic to destructive methods does not allow the application of these as a support for decision making in real time.
There are a number of non-destructive technological tools for monitoring the physicochemical properties of foods, such as electromagnetic sensors, image processing, ultrasound, magnetic resonance and laser excitation [9,10,11,12,13,14,15,16,17,18,19,20]. Using these instruments, the main physicochemical properties measured are °Brix and TSS (total soluble solids). In addition, there are instruments based on food aroma, capacitive sensor and spectroscopy (NIR—near-infrared spectroscopy, MIR—medium-infrared spectroscopy) to estimate the sugar content of sugarcane [8,19,21].
Non-destructive methods for predicting °Brix, specific for sugarcane, have been described by Nawi and Sorol [8,19]. They proposed the prediction of sugar content through the use of NIR in bark and cane juice samples. Using the microwave method, Jackson and Jayanthy [22] determined the sucrose content of the cane juice and Naderi-Boldaji [21] used dielectric spectroscopy in stem samples for °Brix measurement.
One of the challenges for the sugar industry is the lack of low-cost °Brix and TSS meters for field or laboratory use [21]. Currently, the measurement of sugarcane °Brix in most mills is done through the use of a manual refractometer, portable spectrometer and analysis of the sugar content in the laboratory [23]. On the other hand, technologies for measuring sugarcane °Brix in the laboratory have serious limitations for field use because the equipment requires clarified juice samples [8].
Regarding the harvest, the main constraints on the use of current sugarcane measurement and monitoring technologies include the sampling of sugarcane on farms, transportation of the sample to the laboratory, chemical analysis and the delay in obtaining the results (which leads to delay for possible decision making) [24]. The delay in time between harvesting and °Brix measurement in the sugarcane causes material deterioration and sugar loss [25]. Currently available measurement technologies, based on field sampling and subsequent laboratory analysis, present difficulties that do not allow real-time monitoring and decision making in the sugarcane industry.
However, the monitoring of °Brix content in real time, according to a given measurement period, is a necessary condition for the identification of the appropriate time of harvest which should coincide with obtaining the maximum value of this quality parameter. The importance of monitoring this property for production efficiency in the sugarcane industry together with the difficulties or high cost of the measuring devices available on the market requires the development of new methods or equipment for the automated monitoring of cane quality bringing benefits to the sugar and ethanol industry [8].
This paper presents a prototype of a low-cost non-destructive °Brix meter (UltraBrix) capable of measuring sugarcane sucrose in real time. The proposed method is based on the indirect measurement of the sugar degree through the attenuation of an electrical signal (and not an ultrasound). The device provides simplicity of configuration and layout, with proven efficiency for estimating °Brix in real time and directly in the field. Section 1 presents some fundamentals and a brief review of the methods available for measuring °Brix. Section 2 presents the method involved in the design and development of the new device, and Section 3 shows the results of its application using as reference the results obtained by other traditional measurement methods.

2. Materials and Methods

Ultrasound is one of the emerging technologies developed to measure quality and ensure safety in fruit and vegetable consumption [26]. The use of ultrasound to determine fruit and vegetable quality parameters was suggested by Mizrach [15]. The method consists of the estimation of variables related to fruit quality through the changes in speed and amplitude verified in an ultrasound sound wave (frequency above 20 kHz) emitted on the bark and body of the fruit. Several models of non-destructive devices are based on this technique and are used successfully in determining the quality of fruits and vegetables such as mango, avocado, apple, orange, melon, plum, potato and tomato [13,14,27].
The ultrasound devices generally comprise four basic components: a wave generator, a transmitting transducer and a receiver, a microprocessor (or computer) equipped with a signal processor and a monitor [13]. The interaction between sound waves and the sample changes the speed of sound, and there is also a signal attenuation (decrease in the electrical voltage measured by the amplitude of the signal) of the waves due to the absorption and scattering phenomena. In addition to the sound speed and signal attenuation, another parameter that is also correlated to the physical-chemical properties of the analyzed material is the acoustic impedance.
The attenuation of the signal is given by Beer’s law (Equation (1)) and is caused by the loss of energy in the compression and decompression of the ultrasonic waves due to the wave scattering and absorption effects [28].
α = 1 L ln A A o
where α is the attenuation of the signal (mm−1), A is the final amplitude of the wave (volts), Ao is the initial amplitude (volts), and L is the distance traveled by the sound (mm). The speed of sound propagation in the sample is obtained by the ratio between the distance (L) traveled and the respective time (∆t) to cross the cane. There is a correlation between the attenuation of the ultrasound signal and the mechanical and physiological properties of the evaluated fruits and vegetables [15]. The length L is measured by an electronic dendrometer developed by the authors that is based on the pulse-echo principle [29].
The pulse generator sends a continuous signal with a specific frequency and wavelength (Figure 1). In this device, the piezoelectric transducer (transmitter) receives the electric pulse from the function generator producing a sound wave. This sound wave passes through the sample, and the second transducer receives and transforms the sound signal into an electrical signal. The oscilloscope receives the signal from the function generator on channel 1 (CH1) and the signal from the receiver transducer on channel 2 (CH2) showing the respective electrical signals in the monitor together with the time elapsed (∆t) by the sound to cross the sample and the amplitudes of the signals (Ao and A).
The data comprised 114 sugarcane stems of commercial variety RB92579 (the same variety as found in about 40% of the harvest in the entire Northeast region of Brazil in 2015). Initially, the specimens (each of a length of around 5 cm) removed from the cane stems were placed in the UltraBrix device for the measurement of electrical signal attenuation. The experiment was carried out at room temperature (20 °C), and after measuring the signal attenuation, the stems were squeezed by extracting the cane juice to measure the °Brix in the Kasvi model K52-032 portable refractometer with a measurement range of 0–32 °Brix, accuracy of 0.20% and temperature compensation range between 10 and 30 °C. The refractometer was calibrated before the experiment, confirming the °Brix’s null value for distilled water.
The 114 stems were divided into two sets. The first set of samples (80 observations) was used for calibration and validation (model training). This technique was able to determine the existence of a significant relationship between the input variable (attenuation) and the °Brix response, calculating the correlation coefficient between the two variables and the standard deviation. The normality of the attenuation data shown by the Anderson–Darling test [14,30] with a probability of significance suggests the homogeneity of the data around the mean, making the use of the methods possible. The second set of data (34 observations) was used for testing (prediction) (these data were not used to estimate the model parameters). The value of °Brix was estimated from the attenuation using the model identified with the training sample (80 observations).
A statistical description of both samples (validation/calibration and test) is shown in Table 2.

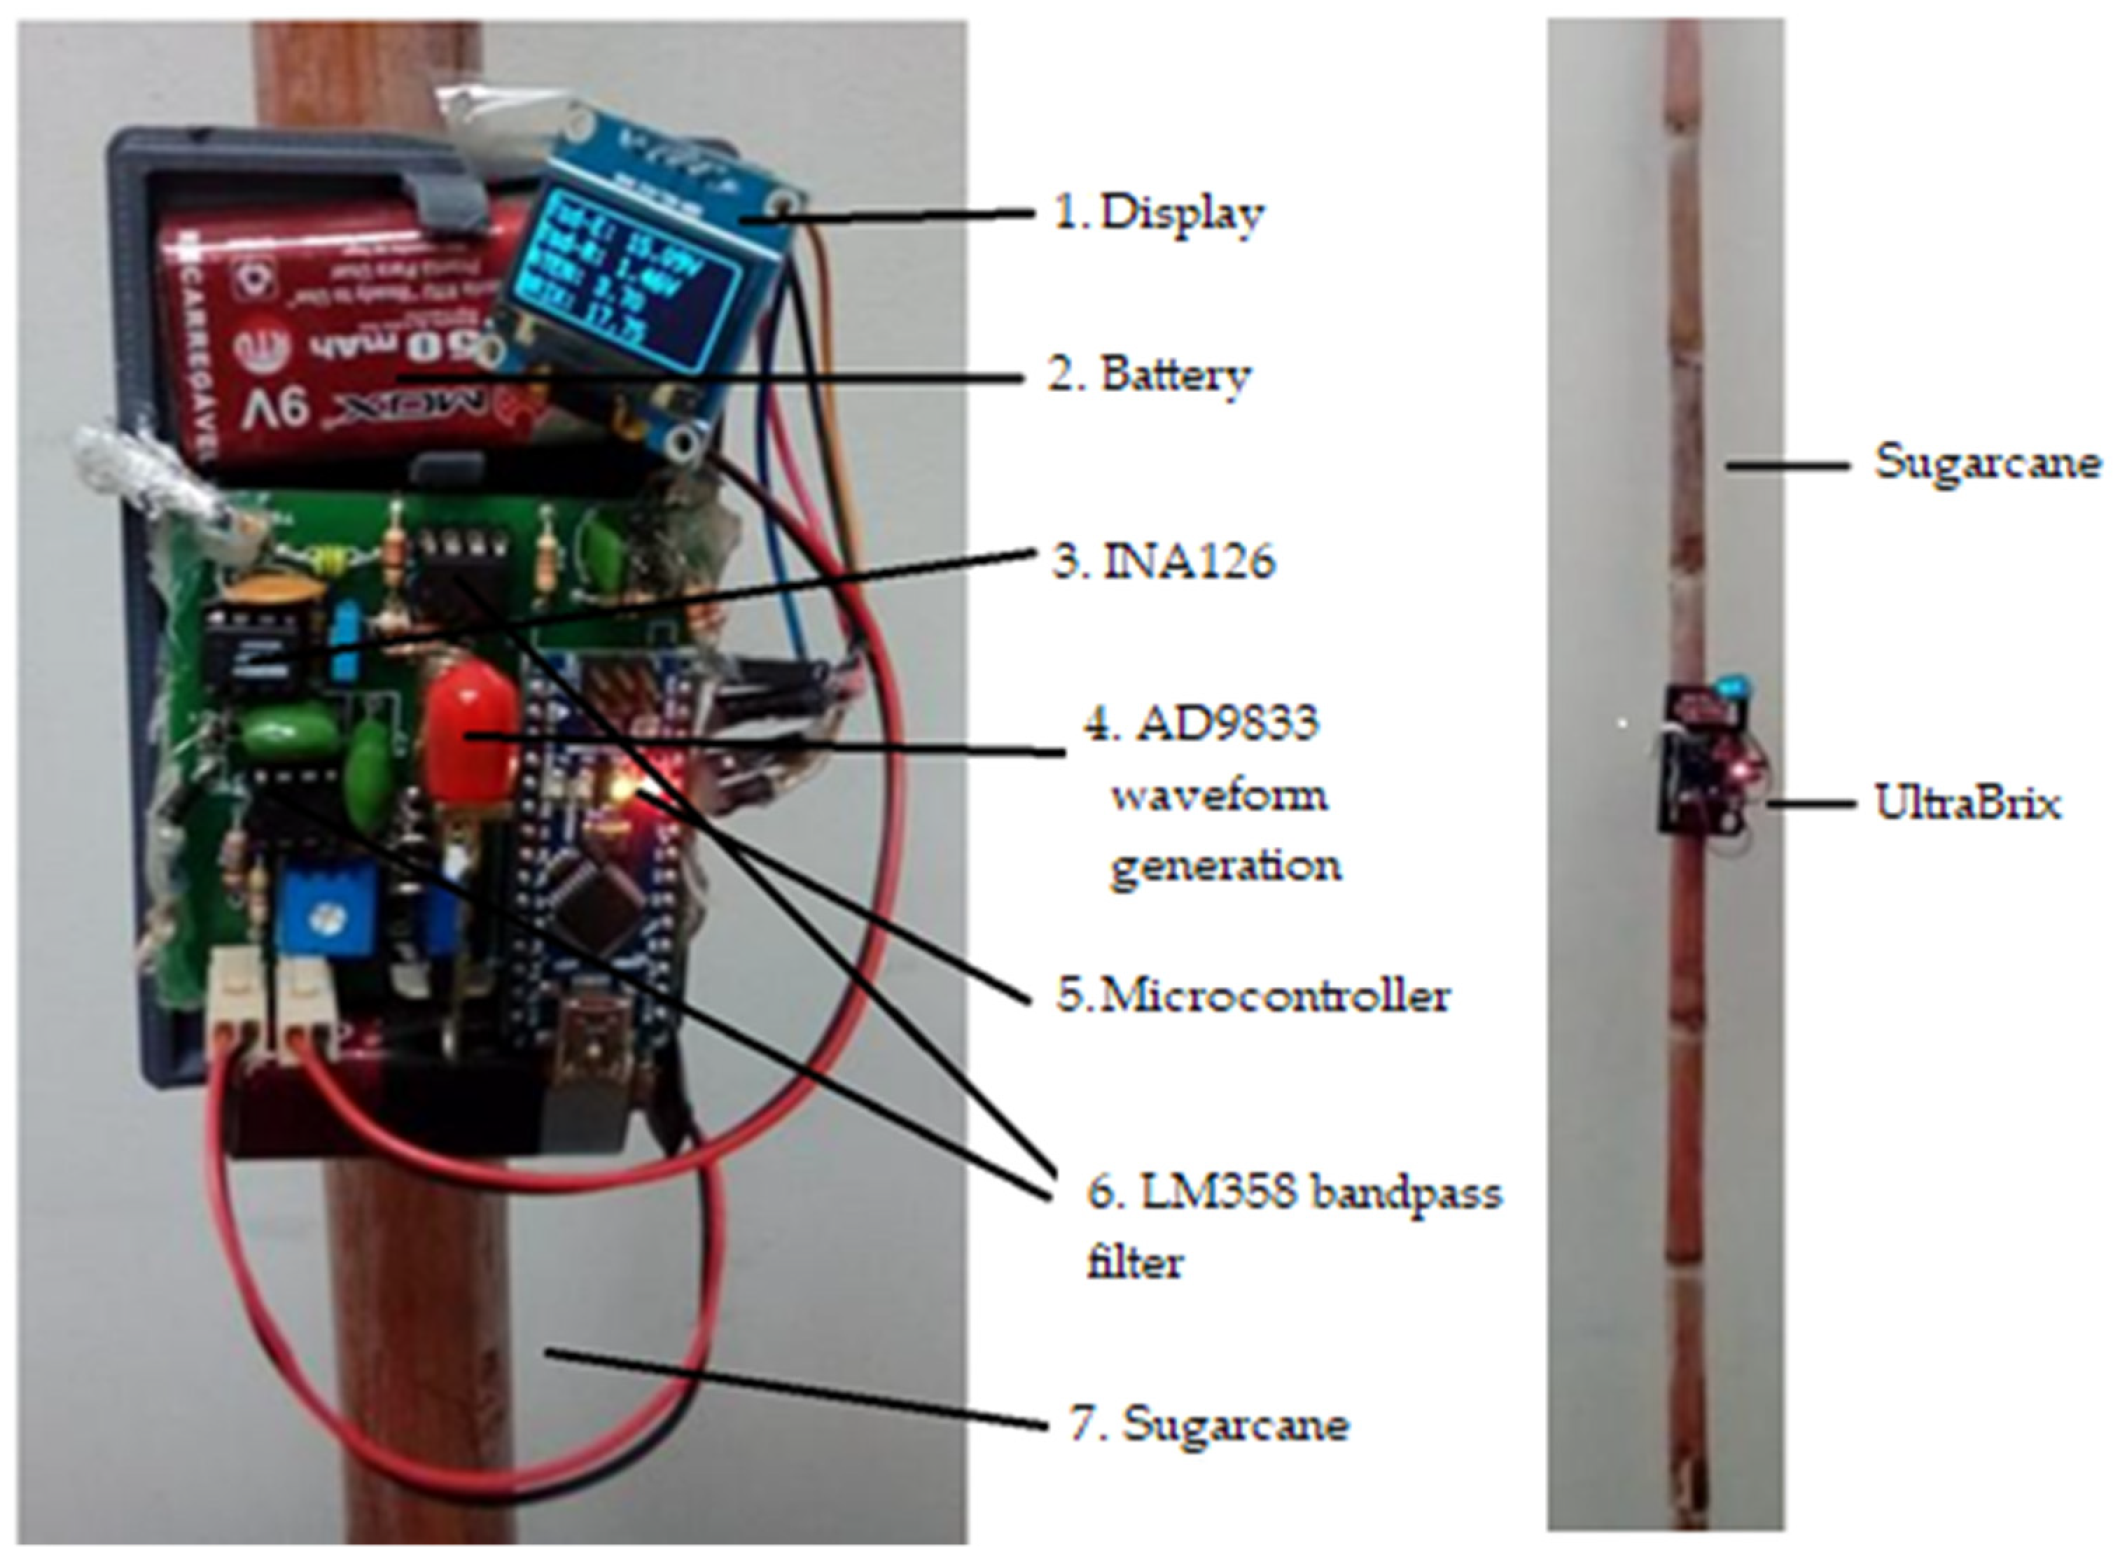
2.1. UltraBrix Device
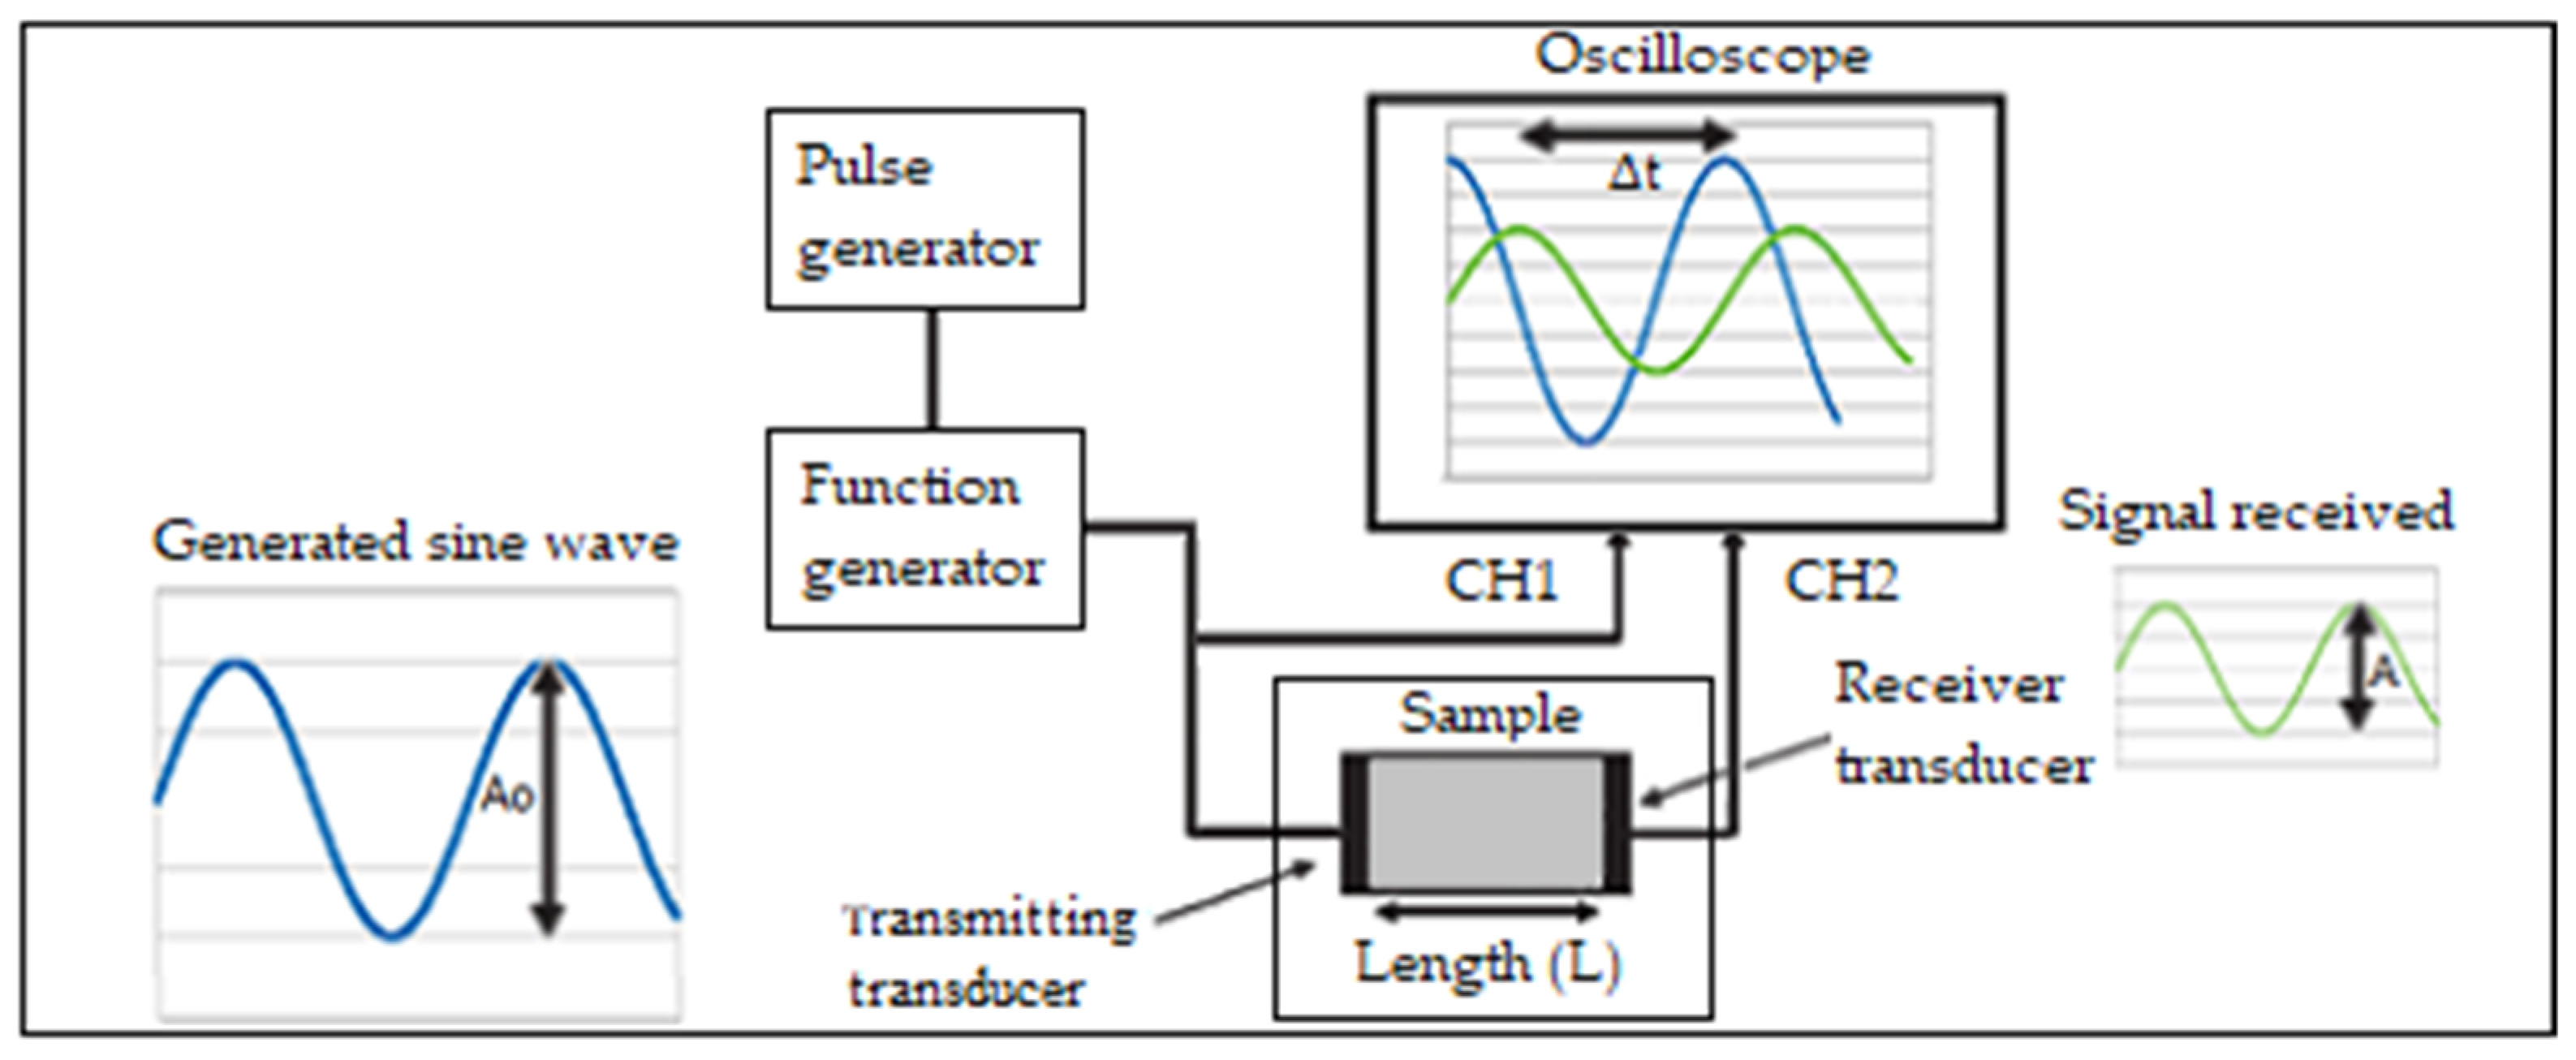
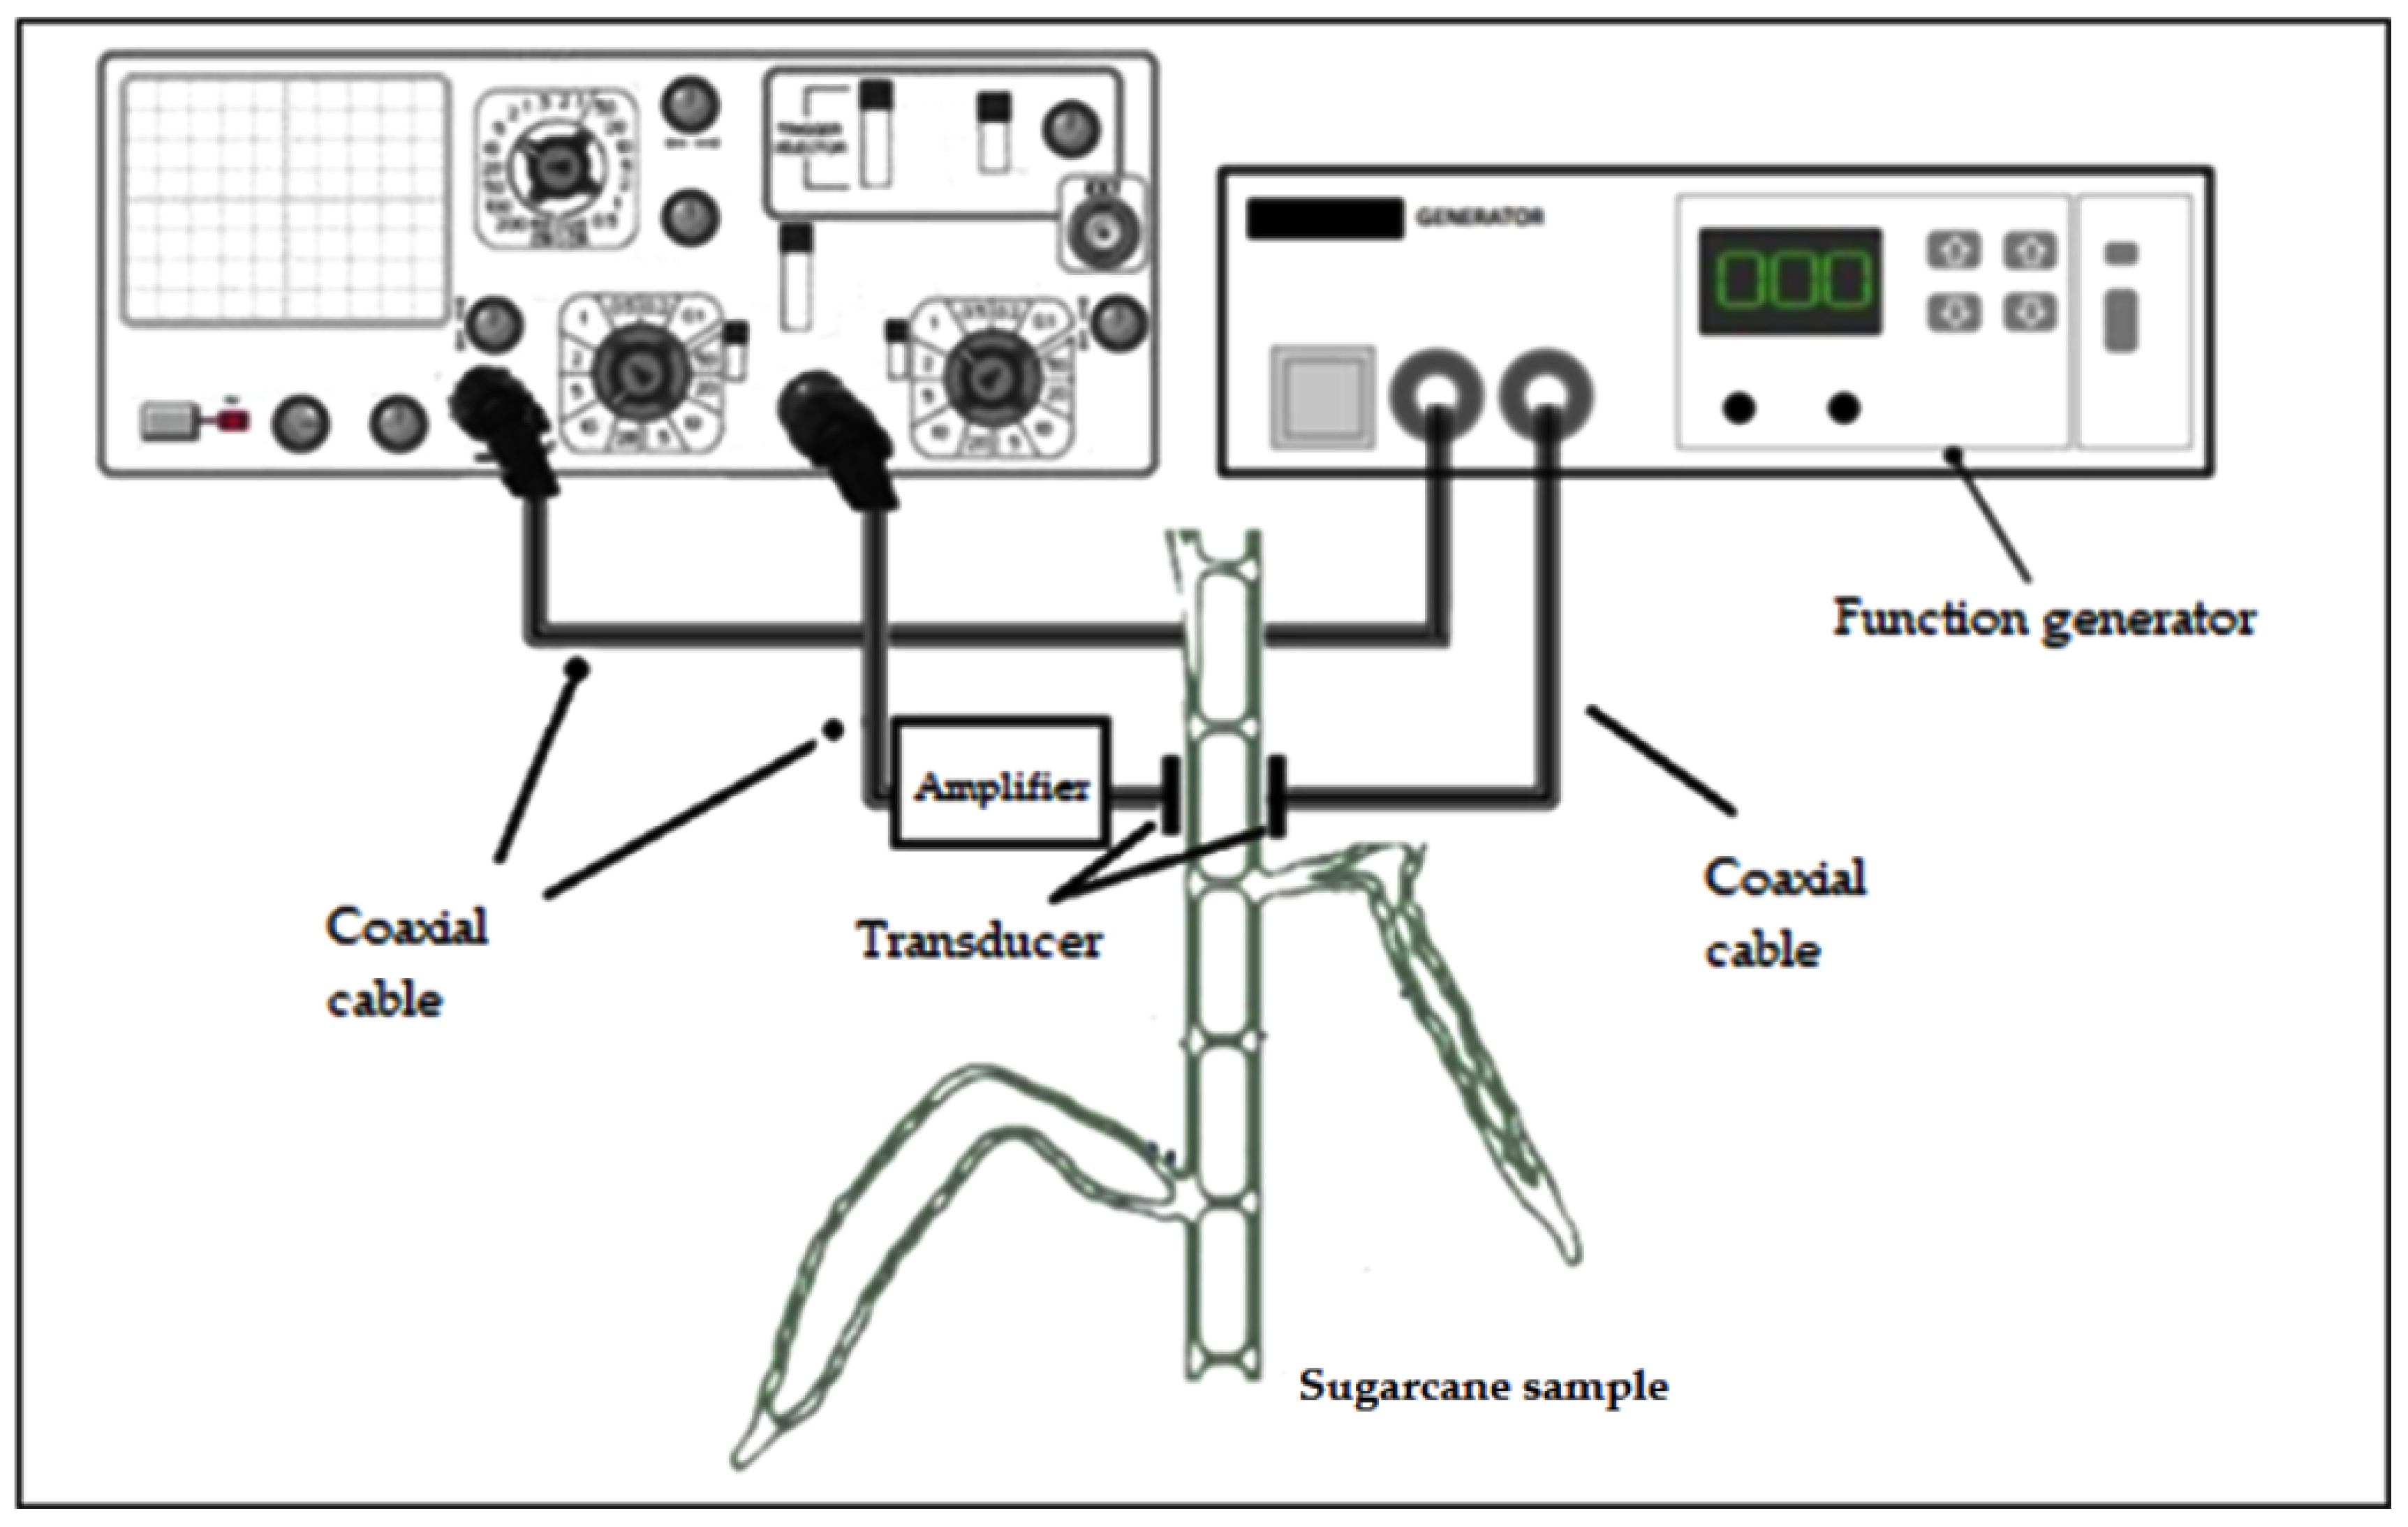
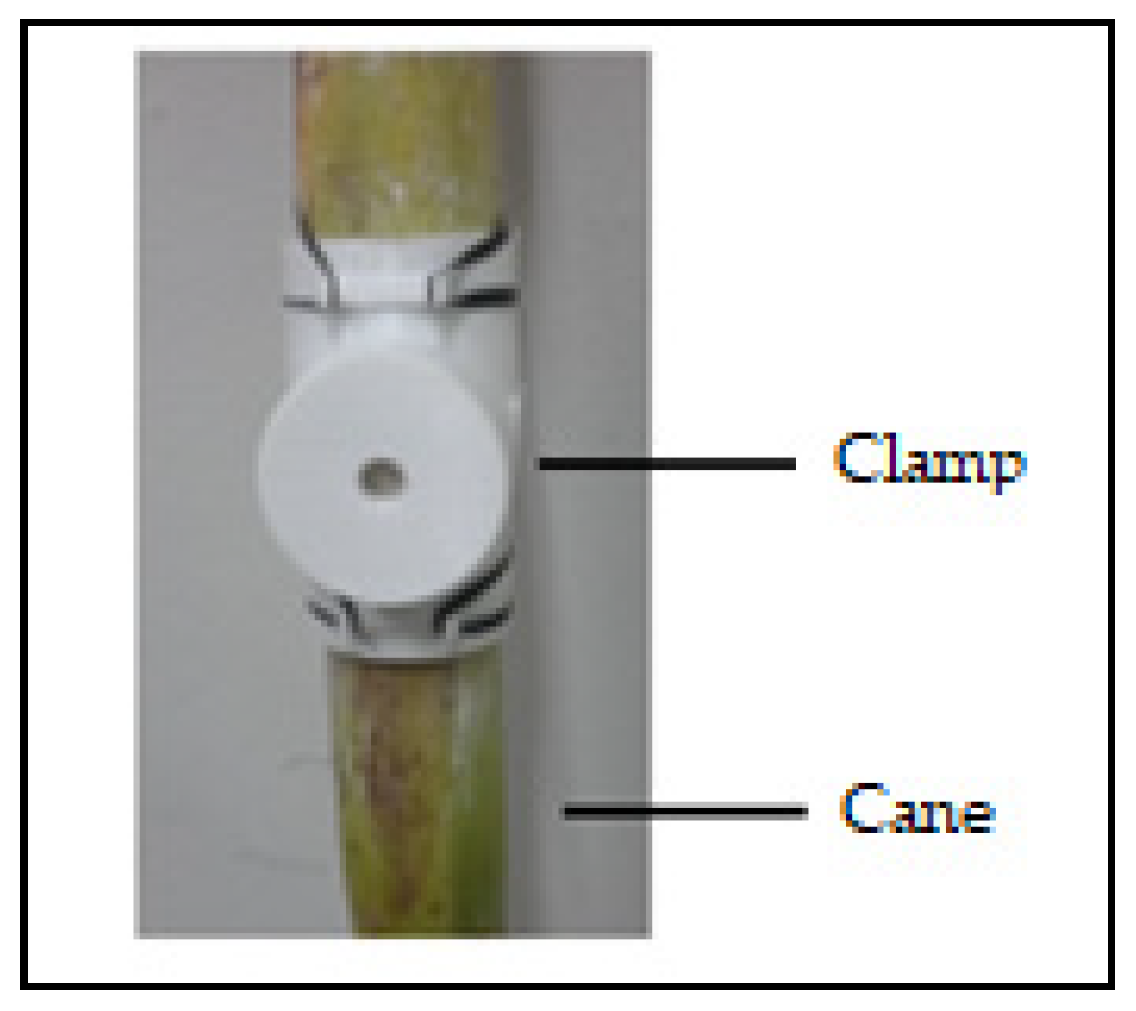
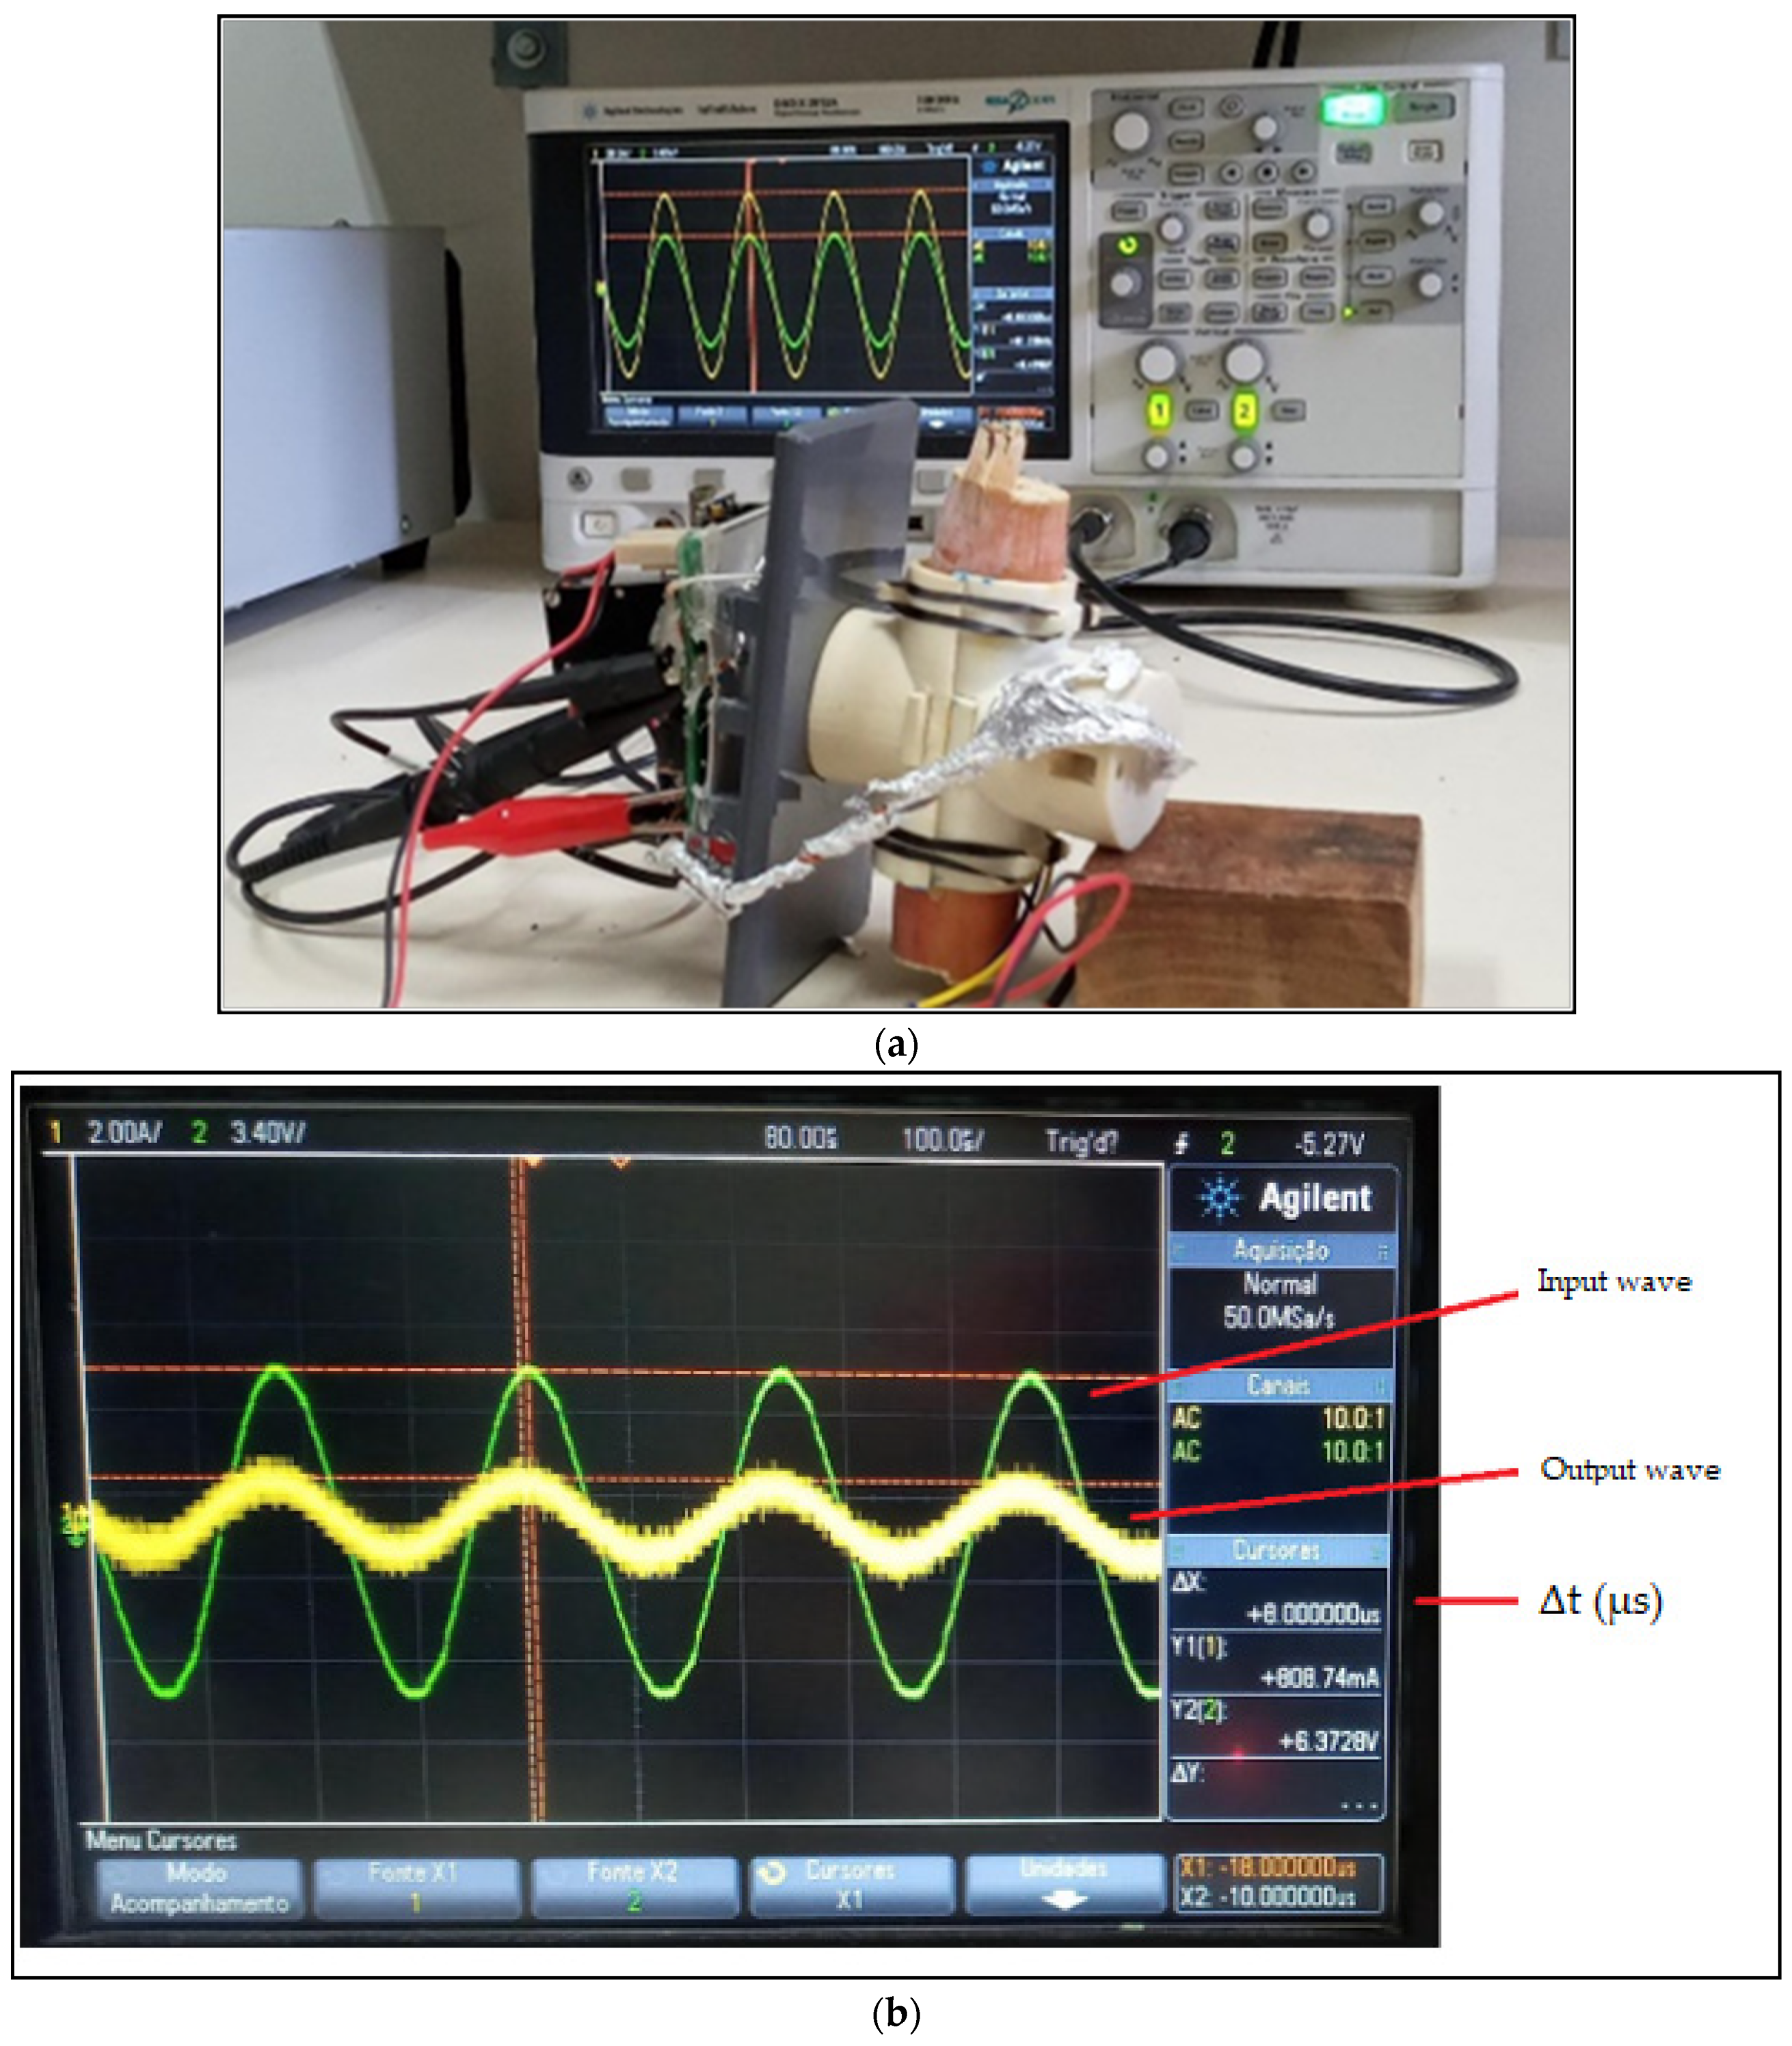
The developed device (UltraBrix, Figure 2, Figure 3, Figure 4 and Figure 5) is based on the continuous wave technique. This prototype is composed of the following elements: two piezoelectric transducers (one transmitter and one receiver) constructed with two 22 mm diameter piezoelectric cells (Kyocera company, Kyoto, Japan; voltage 30 V p-p, operating temperature −20 °C + 60 °C, impedance ≤ 500 Ω), a Global Specialties 4005 signal generator (replaced by the AD9833 module in the circuit), a Tektronix DS0 × 2012A oscilloscope (replaced by ATMEGA328 microcontroller in the circuit) and an instrumentation amplifier with a bandpass filter. This proposed configuration differs from those in other works [14] because the sample is not immersed in water (necessary for field operation) and it does not have an instrumentation amplifier with a bandpass filter. In this section, each of these components will be described in detail.
Figure 5 shows in detail the transducer elements used in Figure 3. Figure 4 shows the transducer clamp which was printed on flexible ABS (acrylonitrile butadiene styrene) in order to carry the transducer and fix the equipment to the sugarcane through a rubber band.

2.2. Transducer

The transducer was developed in the laboratory consisting of a piezoelectric cell placed inside a flexible ABS cylinder that surrounds the cane; a central hole with a diameter of 2 mm serves to pass the wire connecting the piezoelectric cell (Figure 4). The Langevin transducer is assembled with ring-shaped piezoelectric ceramics with a diameter less than 1/4 of the wavelength and two aluminum blocks fixed by a screw of high mechanical resistance. The transducer developed in this work has a production cost of about two dollars (USD) (per unit) and therefore is much cheaper than commercial transducers which cost about thirty dollars each.
Figure 3 presents a picture of the measuring device installed on a cane stem and shows the following components:
  • Display that shows the voltage measurements on the emitting transducer (Tsd-E) and receiver (Tsd-R), the attenuation value and the °Brix;
  • Battery used to power the electronic circuit (UltraBrix operation);
  • Integrated circuit instrumentation amplifier (INA126) whose function is to increase the signal received at the receiving transducer;
  • 4.3 kHz sine wave signal generator (AD9833 module) for the emitting transducer;
  • Arduino One ATMEGA328 microcontroller board—configures AD9833 module for 4.3 kHz sine wave generation, receives the signal from receiver transducer, measures start and end amplitudes of the sine signal, calculates signal attenuation and estimates °Brix;
  • LM358 integrated circuit used to allow only the sine signal to pass near the 4.3 kHz frequency (bandpass filter) to the Arduino, thus removing noise and miscellaneous signals.
Two supports were developed in a 3D printer (acrylonitrile butadiene styrene—ABS flexible) to fix the UltraBrix to the sugarcane stem (Figure 5). The brackets consist of a clamp (yellow) and a lid (green) to which the piezoelectric cell (pink) is attached. The results showed that these supports do not significantly affect the amplitude of the signal received by the piezoelectric. No specific product is used to increase the adherence of the device to the stem. A lid (cover) holds the piezoelectric cell inside the clamp, and the loss of energy (interference) is compensated by the amplifier.

2.3. Instrumentation Amplifier with Bandpass Filter

One of the contributions of this work is the inclusion of the instrumentation amplifier with a bandpass filter (Figure 6) in the continuous-wave technique presented by Mizrach and Awad [13,31]. With this instrumentation amplifier, it is possible to use a much lower input voltage (range 15 to 18 V) than that proposed by Mizrach [13]. This bandpass filter eliminates noise since the low voltage is more susceptible to electromagnetic interference.
The instrumentation amplifier (Figure 6) is an essential element, the purpose of which is to amplify a small amplitude signal acquisition system, and features a high input impedance, a gain control through a single RG resistor and high CMRR (common module rejection ratio). The input voltages of the emitter transducer and the receiver transducer are 18 V (V2) and 10 to 660 mV (V1), respectively. The instrumentation operational amplifier used was the electronic component INA126 which amplifies the input signal by about 85 times. The bandpass filter circuit consists of two filters arranged in series, namely a high pass filter and a low pass filter, allowing only the passage of signals to the oscilloscope with a frequency close to 4.3 kHz (between 0.7 kHz to 7.3 kHz), thus avoiding noise interference in the signal coming from the transducer.
The gain (G) of the amplifier reported by the manufacturer of the electronic component INA126 is given by:
G = 5 + 80000   R G
The RG resistor (1 kΩ) determines an amplifier gain of 85 times the piezoelectric receiver transducer signal. The bandpass filter is a circuit designed to transmit signals with desired frequencies and reject or attenuate other frequencies. Figure 7 shows the output frequency as a function of the gain (ω1 and ω2 are the cutoff frequencies, 0.7 kHz and 7.23 kHz, respectively).
The transfer function (gain) of the bandpass filter relates the output signal to the input signal:
H ω = O ω I ω = j ω 1 C 1 R 4 1 + j ω 1 C 1 R 3 R 6 R 5 1 1 + J ω 2 C 2 R 6
The cutoff frequency of the high pass (ω1) and low pass filters (ω2) is obtained by the following expressions:
ω 1 = 1 2 π R 4 C 1
ω 2 = 1 2 π R 6 C 2
The specifications of the components that constitute the bandpass filter are described in Table 3.
Figure 8 presents the polynomial fit model and Figure 9 shows the frequency distribution associated with the attenuation (Equation (1)) of the input electric signal for a sample with 80 stems. Considering the Anderson–Darling test, the normality of the data was verified by the probability of significance (p) equal to 0.519 (which is greater than the significance level of 95%). According to the mean ( x ¯ = 2.41   mm 1 ) and standard deviation ( S = 0.33) of the sample, the coefficient of variation is ( S   · 100 x ¯ ) 13.69% (less than 25%) which suggests a homogeneous dispersion of the data around the mean.

3. Results

As discussed in Section 2, a sample with 80 stems was used to identify a correlation model between °Brix (y) and signal attenuation (α). The polynomial fit model (Figure 8) is given by:
y = 4.3 α 2 22 α + 50 . 3
The coefficient of determination is shown in Figure 8 and Figure 9 (R2 = 0.76) for the training (validation/calibration) sample (80 observations). This coefficient is obtained by comparing the °Brix estimated by the model (Equation (6)) and the reference °Brix (measured by the refractometer Kasvi model K52-032). The root mean squared error (RMSE) obtained is about 0.33 (Figure 9), which is a measure of the accuracy of the °Brix estimates obtained by the model (Equation (6)) for the training sample (considering an average °Brix value of around 22.5, this represents an accuracy of around 1.5%).
The fit model (Equation (6)) was obtained by applying a resampling strategy (10-fold cross-validation approach) [32]. Ten-fold cross-validation involves randomly dividing the original sample (80 observations) into 10 groups of the same size. Ten models were estimated using each group as a validation set and the others for estimating parameters (model calibration/training). The model selected (Equation (6)) was the one with the lowest mean square error for the validation data. Moreover, the sample size (N = 80) is in accordance with the PEAR (Precision Efficacy Analysis for Regression) method [33] which proposes an equation for minimum sample size in linear regression problems based on the degree of explanation expected for the model and the number of predictors.
As shown in Figure 8, two sugarcane samples with the same °Brix may have different signal attenuation values. This is possible when the two canes have different stem diameters. In this case, the output signal on the stem with the largest diameter will have a decrease in amplitude (A, final amplitude, volts) since the sound signal from the transmitter will travel a longer distance until reaching the receiving transducer, which will result in loss of signal power due to absorption. Figure 8 also suggests that a useful (desired) calibration can be found at attenuations less than 2.1 which correspond to a °Brix greater than 22.8.
The effects of distance traveled and output signal amplitude on signal attenuation are predicted by Beer’s law (Equation (1)). Figure 10a shows a direct application of Beer’s law. Through this figure, it is possible to predict the effect of an increase in the diameter (2.2 cm < L < 4.2 cm) of the cane while maintaining the same °Brix. In this case, a reduction in the amplitude of the output signal is expected concomitantly with an increase in diameter and with the possibility of different attenuation values (α) (the figure shows a slight initial reduction in signal attenuation followed by a steeper increase). Figure 10a shows a specific (hypothetical) trajectory for the amplitude of the output signal (A) and Figure 10b fully presents the signal attenuation surface (according to Beer’s law). Considering two canes with the same °Brix, Figure 10 shows the signal attenuation behavior as the diameter of the cane (2.2 cm < L < 4.2 cm) increases and the amplitude of the output signal (0 < A < 1) decreases. The figure shows a slight initial reduction in signal attenuation followed by a steeper increase. Therefore, the regression model (Equation (6), in which the attenuation is estimated by the Beer law) should also consider the possibility that canes with the same °Brix have different signal attenuations due to the difference in their diameters.
Regarding the coefficient of determination R 2 = 0.76 associated with the adjustment model (Equation (6)), this result can be assessed using a test of significance which is able to predict this result on the population from which the sample (80 observations) was extracted. Considering the training sample size n = 80 and a sampling error equal to 5 % (confidence level 95 % ), the sample correlation coefficient R provides a population correlation coefficient equal to 0.85 . This implies a strong correlation between the proposed model and the population (Scrober et al., 2018) which shows that the coefficient of determination obtained 0.76 has a satisfactory statistical significance.

3.1. Test Sample and Validation

The test (performed with the sample of 34 stems, Figure 11a,b) provided a coefficient of determination (R2) equal to 0.83 and RMSE equal to 0.22, which is a measure of the accuracy of the °Brix estimates obtained by the model (Equation (6)) for the test sample. Considering an average °Brix value (refractometer) of around 22.4, this represents an accuracy of around 1.0%.
Table 4 shows the coefficient of determination found in other methods of measuring °Brix in sugarcane. Table A1 and Table A2 (Appendix A) show experimental data.

3.2. Sound Propagation around the Specimen and Application in the Field

The variety of sugarcane represents a categorical variable in the determination of °Brix, and therefore other models and adjustments (as in Equation (6)) would have to be identified for another variety.
UltraBrix is capable of transmitting information (signal attenuation or even the °Brix) in real time remotely (through a Wi-Fi network). The distributed application of the UltraBrix sensor is able to map the spatial and temporal diversity of the sugar content in the field. Figure 12 shows the apparatus (already tested in the field) for receiving and transmitting sensor data via Wi-Fi to a central computer. The apparatus consists of a router, a Raspberry Pi 3 computer, a battery charge controller, a solar panel, a 12 V battery and a 12 V to 220 V car inverter.
Regarding the possibility of the sound wave moving around the specimen, a test was carried out using an oscilloscope (Figure 13a,b) to measure the propagation time of the sound wave in a specimen whose stem diameter is 3 cm. The wave propagation time was 8   × 10 6   s which gives a speed equal to 3750 m/s. Considering the speeds of the sound wave in the air (≈340 m/s) and in other materials (wood ≈ 3900 m/s; water ≈ 1400 m/s; concrete ≈ 3200 m/s), it is reasonable to assume that the sound wave propagates predominantly through the solid medium (sugarcane).

3.3. Evaluation of Benefits for Sugarcane Production

The cost of manufacturing UltraBrix can be estimated at around USD 30 based on its main components (1 Arduino Uno mini microcontroller, 1 AD9833 Signal Generator, 1 Operational Amplifier LM358, 1 INA126 instrumental amplifier, 2 Piezoelectric cells, 2 Supports and 3D printed material in ABS). This is 280 and 2800 times lower than the cost of the analysis performed using the broth and cane stem spectroscopy, respectively [8].
Furthermore, 699 measurements of °Brix were carried out in the pre-analysis laboratory of a production unit located in the Northeast region of Brazil (2014/2015 crop) using a digital saccharimeter in order to determine the harvest point of the sugarcane (higher sucrose content). It was verified that about 41% (284 measurements) of these cane units had a °Brix value about 20% lower than the harvest point. This amount (284 sugarcane units) is equivalent to about 328,708 tons of cane (127.22 TRS—total recoverable sugar) collected in 4123 hectares (79.73 tons cane/ha on average). This represents an estimated harvest loss of approximately 12.20 kg of sucrose/total ton of sugar produced. This result reveals a common reality in sugarcane crops regarding suboptimal or inappropriate determination of the point or moment of harvest, which, in turn, causes loss of production and difficulty in effectively reaching the maximum production of sugar from the field. Therefore, these results demonstrate that it is possible to increase productivity through the use of a piece of equipment that performs online monitoring of sugarcane in the field.
The root mean square error (RMSE) obtained in both samples (mainly in the test sample whose data were not used to estimate the model parameters, Equation (6)) was around 0.3, which suggests an average measurement deviation around 1.3% (considering a °Brix value around 22). In addition, the maximum deviation obtained in the test sample (34 points) was 0.69 (≈3.1%). Considering an accuracy of 3% for the UltraBrix, a gain in sucrose production (around 10–11 kg of sucrose (≈0.3 USD)/total tons of sugar produced) can be achieved with its use in the field for monitoring production and deciding the best moment to harvest.
Comparing to other instruments for measuring sugar content in cane, the coefficients of determination (R2) obtained for training (0.76) and test (0.83) samples are within the range of values practiced as shown in Table 5. Table 5 presents the statistical performance (R2, RMSE) of other measuring instruments (portable NIR devices available on the market) and respective costs [36].

4. Conclusions

This work presents a non-destructive electronic device for the measurement of the amount of soluble solids content in sugarcane that is based on the attenuation of the sound wave signal emitted through the cane stem. Although the correlation developed for the estimation of °Brix from the attenuation of the sound signal in this equipment presented a correlation coefficient lower than other non-destructive methods based on NIR and MIR, the unit cost of the proposed device is about USD 30. This is about 38 times lower than the cost of analysis using portable NIR and MIR equipment. This could universalize real-time monitoring of °Brix, mainly in the Northeast region of Brazil to identify the appropriate harvesting point. This device could lead to an increase in sucrose production of about 20%. Additionally, the simplicity and flexibility of the proposed piece of equipment mean it can be used in any sugarcane industry in the world.
The application of UltraBrix in the field would allow the mapping of the planted area as well as reduce the cost of transporting the sample to the laboratory and staff and laboratory analysis costs. On the other hand, the clapping contact with the cane is a drawback because the coupling of the cane with the piezoelectric tablet can cause interference in the measurement.
UltraBrix can also be used as an auxiliary tool in the development of best practices in agricultural management, in cultural treatments and in the study of new varieties (genetic improvement) using °Brix monitoring throughout the period from planting to harvesting. Further tests in the field with other food crops as well as further research to determine the TSS, fiber and water content in the cane are planned.
Sugarcane is considered one of the great alternatives for the biofuels sector due to the great potential in the production of ethanol and its by-products. Brazil is the world’s largest producer of sugarcane, and the development of technologies for monitoring and increasing the efficiency of this sector represents an important contribution. The device developed and validated in this work provides a viable, low-cost and non-destructive alternative for monitoring and increasing productivity in the sugar and alcohol agro-industry and consequently for its sustainability.

Author Contributions

The authors E.C.d.M.J. and G.C. participated directly in the collection of samples and in the development and testing of the device. The authors C.H.F. and M.V.A.d.C. participated in the analysis and discussion of the results and writing of the manuscript. All authors have read and agreed to the published version of the manuscript.

Funding

This research received no external funding.

Institutional Review Board Statement

Not applicable.

Informed Consent Statement

Not applicable.

Data Availability Statement

The data presented in this study are available in Appendix A.

Acknowledgments

The authors acknowledge the Federal Agency for Support and Evaluation of Graduate Education (Coordenação de Aperfeiçoamento de Pessoal de Nível Superior, CAPES-BRAZIL), the National Council for Scientific and Technological Development (Conselho Nacional de Desenvolvimento Científico e Tecnológico, CNPq-BRAZIL, Productivity of Research Funds Process 301478/2018-0) and the Coruripe Sugar and Alcohol Plant (Alagoas, Brazil) for providing data and information necessary to carry out this work.

Conflicts of Interest

The authors declare no conflict of interest.

Appendix A

Table A1. Experimental data (calibration and validation) (all canes of RB9257 variety and aged 21 months).
EspStem aStem Diameter (cm)Attenuation°Brix RefrEstimated BrixError
113.202.1622.8022.640.16
273.002.4322.2721.950.31
382.802.4822.1321.890.24
433.002.2222.8022.420.38
553.002.3022.0022.200.20
673.002.2922.4022.210.19
7112.902.4122.2021.980.22
853.422.0723.1023.000.10
983.322.1122.7022.830.13
1093.302.1122.8022.830.03
11103.102.2722.3022.260.04
12113.202.1922.2022.530.33
13143.002.3721.7022.050.35
14152.932.4221.8021.960.16
15162.902.4421.9021.930.03
1613.152.2521.9022.340.44
1742.882.452221.920.08
1852.952.3022.822.200.60
1962.932.2722.822.280.52
20122.522.882222.190.19
21132.402.992222.520.52
22142.482.812222.060.06
2313.172.1222.222.770.57
2423.222.232222.400.40
2533.032.3521.822.090.29
2642.972.3121.822.180.38
2762.702.7121.621.900.30
2872.672.6621.821.860.06
2982.802.542221.850.15
3092.832.3722.222.050.15
31102.662.6721.821.870.07
32112.622.622221.840.16
33162.532.7922.222.010.19
3442.642.8622.622.160.44
3552.662.8422.422.100.30
3662.632.7722.321.980.32
3772.652.8321.822.090.29
3882.652.6221.921.850.05
3992.582.7022.221.890.31
40102.602.852222.140.14
41112.662.792222.020.02
42162.742.742221.930.07
43172.782.742221.940.06
44212.682.6922.521.880.62
45242.682.7922.522.020.48
46272.482.952222.390.39
47302.503.0122.422.600.20
4833.441.9023.623.860.26
4943.261.8623.524.090.59
5053.431.9723.823.470.33
5163.321.9623.723.510.19
5283.221.912423.820.18
53103.202.0323.523.160.34
54123.282.0223.223.200.00
55143.082.1723.122.590.51
56153.282.062323.040.04
57163.332.1022.822.870.07
58193.162.2522.222.330.13
59203.102.2422.222.370.17
60213.122.1222.722.790.09
61223.022.2822.422.260.14
62273.172.2322.422.400.00
6312.542.9722.822.470.33
6492.932.3422.4022.100.30
65102.902.3922.1022.020.08
66113.002.2222.0722.440.37
6723.671.8924.1323.910.35
6853.362.0223.4323.240.23
6963.202.0823.0022.960.05
7073.072.2922.6322.210.35
7123.671.8924.1323.910.23
72262.503.022322.620.38
73292.532.982322.480.52
7413.471.9124.323.840.46
7582.652.6721.421.870.47
76183.222.192222.530.53
77122.642.7921.522.010.51
78172.882.3622.7022.070.63
79132.822.6122.521.840.66
80202.822.4821.3321.900.56
a stem in both Table A1 and Table A2 refers to the position of the piece collected in the cane stem (the lower the value, the closer to the ground).
Table A2. Experimental data (test) (all canes of RB9257 variety and aged 21 months).
EspStem aStem Diameter (cm)Attenuation°Brix RefrEstimated BrixError
123.152.3022.3222.240.08
2233.082.1522.8922.700.19
3152.632.6322.0121.890.12
4152.632.6321.9121.890.02
572.722.6422.0621.900.17
672.722.6421.9921.900.09
7123.322.0922.8722.940.07
8133.102.2022.4522.530.08
9152.422.8522.3022.180.12
10152.422.8522.3022.180.12
1113.102.1022.7822.900.12
1233.102.4421.9021.980.07
1333.102.4421.9021.980.07
14173.202.0922.8522.940.10
1552.872.6021.9821.890.09
1652.872.6021.9121.890.03
1723.102.0922.7622.940.19
1823.002.2922.2922.260.03
1952.972.4121.9222.020.10
2052.972.4121.9022.020.12
2133.072.2322.2322.430.20
22243.272.0722.8023.030.23
23133.002.3621.9222.110.19
24133.002.3622.0922.110.01
2572.772.7721.8322.030.20
26142.672.6621.8821.910.03
27263.322.0522.7323.120.40
28122.972.2022.3122.530.22
2962.533.0723.2822.880.39
3072.522.9023.0022.300.69
3152.523.1823.7623.390.37
32132.403.0022.9822.610.37
33112.453.1823.4223.390.03
3432.553.2823.5323.940.41
a stem in both Table A1 and Table A2 refers to the position of the piece collected in the cane stem (the lower the value, the closer to the ground).

References

  1. FAOSTAT. Available online: http://www.fao.org/faostat/en/#data/FBS (accessed on 16 December 2018).
  2. Waclawovsky, A.J.; Sato, P.M.; Lembke, C.G.; Moore, P.H.; Souza, G.M. Sugarcane for Bioenergy Production: An Assessment of Yield and Regulation of Sucrose Content. Plant Biotechnol. J. 2010, 8, 263–276. [Google Scholar] [CrossRef] [Green Version]
  3. Schneider, F. Sugar Analysis: Official and Tentative Methods Recommended by the International Commission for Uniform Methods of Sugar Analysis (ICUMSA); Hyperion Books: New York, NY, USA, 1979. [Google Scholar]
  4. Froese, R.E.; Waterstraut, J.R.; Johnson, D.M.; Shonnard, D.R.; Whitmarsh, J.H.; Miller, C.A. Lignocellulosic Ethanol: Is It Economically and Financially Viable as a Fuel Source? Environ. Qual. Manag. 2008, 18, 23–45. [Google Scholar] [CrossRef]
  5. Mussatto, S.I.; Dragone, G.; Guimarães, P.M.R.; Silva, J.P.A.; Carneiro, L.M.; Roberto, I.C.; Vicente, A.; Domingues, L.; Teixeira, J.A. Technological Trends, Global Market, and Challenges of Bio-Ethanol Production. Biotechnol. Adv. 2010, 28, 817–830. [Google Scholar] [CrossRef] [PubMed] [Green Version]
  6. Puligundla, P.; Smogrovicova, D.; Obulam, V.S.R.; Ko, S. Very High Gravity (VHG) Ethanolic Brewing and Fermentation: A Research Update. J. Ind. Microbiol. Biotechnol. 2011, 38, 1133–1144. [Google Scholar] [CrossRef] [PubMed]
  7. Americano da Costa, M.V.; Pasamontes, M.; Normey-Rico, J.E.; Guzmán, J.L.; Berenguel, M. Advanced Control Strategy Combined with Solar Cooling for Improving Ethanol Production in Fermentation Units. Ind. Eng. Chem. Res. 2014, 53, 11384–11392. [Google Scholar] [CrossRef]
  8. Nawi, N.M.; Chen, G.; Jensen, T.; Mehdizadeh, S.A. Prediction and Classification of Sugar Content of Sugarcane Based on Skin Scanning Using Visible and Shortwave near Infrared. Biosyst. Eng. 2013, 115, 154–161. [Google Scholar] [CrossRef]
  9. Harnsoongnoen, S.; Wanthong, A. Real-Time Monitoring of Sucrose, Sorbitol, d-Glucose and d-Fructose Concentration by Electromagnetic Sensing. Food Chem. 2017, 232, 566–570. [Google Scholar] [CrossRef] [PubMed]
  10. Hosoya, N.; Mishima, M.; Kajiwara, I.; Maeda, S. Non-Destructive Firmness Assessment of Apples Using a Non-Contact Laser Excitation System Based on a Laser-Induced Plasma Shock Wave. Postharvest Biol. Technol. 2017, 128, 11–17. [Google Scholar] [CrossRef]
  11. Liu, Y.; Pu, H.; Sun, D.-W. Hyperspectral Imaging Technique for Evaluating Food Quality and Safety during Various Processes: A Review of Recent Applications. Trends Food Sci. Technol. 2017, 69, 25–35. [Google Scholar] [CrossRef]
  12. Magwaza, L.S.; Tesfay, S.Z. A Review of Destructive and Non-Destructive Methods for Determining Avocado Fruit Maturity. Food Bioprocess Technol. 2015, 8, 1995–2011. [Google Scholar] [CrossRef]
  13. Mizrach, A. Ultrasonic Technology for Quality Evaluation of Fresh Fruit and Vegetables in Pre- and Postharvest Processes. Postharvest Biol. Technol. 2008, 48, 315–330. [Google Scholar] [CrossRef]
  14. Mizrach, A. Nondestructive Ultrasonic Monitoring of Tomato Quality during Shelf-Life Storage. Postharvest Biol. Technol. 2007, 46, 271–274. [Google Scholar] [CrossRef]
  15. Mizrach, A.; Flitsanov, U. Nondestructive Ultrasonic Determination of Avocado Softening Process. J. Food Eng. 1999, 40, 139–144. [Google Scholar] [CrossRef]
  16. Morrison, D.S.; Abeyratne, U.R. Ultrasonic Technique for Non-Destructive Quality Evaluation of Oranges. J. Food Eng. 2014, 141, 107–112. [Google Scholar] [CrossRef] [Green Version]
  17. Patist, A.; Bates, D. Ultrasonic Innovations in the Food Industry: From the Laboratory to Commercial Production. Innov. Food Sci. Emerg. Technol. 2008, 9, 147–154. [Google Scholar] [CrossRef]
  18. Rady, A.M.; Guyer, D.E. Rapid and/or Nondestructive Quality Evaluation Methods for Potatoes: A Review. Comput. Electron. Agric. 2015, 117, 31–48. [Google Scholar] [CrossRef]
  19. Sorol, N.; Arancibia, E.; Bortolato, S.A.; Olivieri, A.C. Visible/near Infrared-Partial Least-Squares Analysis of Brix in Sugar Cane Juice: A Test Field for Variable Selection Methods. Chemom. Intell. Lab. Syst. 2010, 102, 100–109. [Google Scholar] [CrossRef]
  20. Srivastava, S.; Sadistap, S. Non-Destructive Sensing Methods for Quality Assessment of on-Tree Fruits: A Review. J. Food Meas. Charact. 2018, 12, 497–526. [Google Scholar] [CrossRef]
  21. Naderi-Boldaji, M.; Fazeliyan-Dehkordi, M.; Mireei, S.A.; Ghasemi-Varnamkhasti, M. Dielectric Power Spectroscopy as a Potential Technique for the Non-Destructive Measurement of Sugar Concentration in Sugarcane. Biosyst. Eng. 2015, 140, 1–10. [Google Scholar] [CrossRef]
  22. Jackson, B.; Jayanthy, T. Determination of Sucrose in Raw Sugarcane Juice by Microwave Method. Indian J. Sci. Technol. 2014, 7, 5. [Google Scholar] [CrossRef]
  23. Ramasami, P.; Jhaumeer-Laulloo, S.; Rondeau, P.; Cadet, F.; Seepujak, H.; Seeruttun, A. Quantification of Sugars in Soft Drinks and Fruit Juices by Density, Refractometry, Infrared Spectroscopy and Statistical Methods. S. Afr. J. Chem. 2004, 57, 24–27. [Google Scholar]
  24. Abdel-Rahman, E.M.; Ahmed, F.B.; van den Berg, M. Estimation of Sugarcane Leaf Nitrogen Concentration Using in Situ Spectroscopy. Int. J. Appl. Earth Obs. Geoinf. 2010, 12, S52–S57. [Google Scholar] [CrossRef]
  25. Purcell, D.E.; Leonard, G.J.; O’Shea, M.G.; Kokot, S. A Chemometrics Investigation of Sugarcane Plant Properties Based on the Molecular Composition of Epicuticular Wax. Chemom. Intell. Lab. Syst. 2005, 76, 135–147. [Google Scholar] [CrossRef]
  26. Knorr, D.; Zenker, M.; Heinz, V.; Lee, D.-U. Applications and Potential of Ultrasonics in Food Processing. Trends Food Sci. Technol. 2004, 15, 261–266. [Google Scholar] [CrossRef]
  27. Mizrach, A. Assessing Plum Fruit Quality Attributes with an Ultrasonic Method. Food Res. Int. 2004, 37, 627–631. [Google Scholar] [CrossRef]
  28. Buckin, V.; Kudryashov, E.; Driscoll, B.O. High-Resolution Ultrasonic Spectroscopy for Material Analysis. Int. Lab. 2003, 33, 10–13. [Google Scholar]
  29. Moraes Júnior, E.; Fontes, C.H.O.; Americano da Costa, M.V. Eletronic Dendrometer, Patent: Privilege of Innovation. National Institute of Industrial Property. Record number: BR10201701535. 2020. [Google Scholar]
  30. Anderson, T.W.; Darling, D.A. Asymptotic Theory of Certain “Goodness of Fit” Criteria Based on Stochastic Processes. Ann Math Stat. 1952, 23, 193–212. [Google Scholar] [CrossRef]
  31. Awad, T.S.; Moharram, H.A.; Shaltout, O.E.; Asker, D.; Youssef, M.M. Applications of Ultrasound in Analysis, Processing and Quality Control of Food: A Review. Food Res. Int. 2012, 48, 410–427. [Google Scholar] [CrossRef]
  32. Casella, G.; Fienberg, S.; Olkin, I. An Introduction to Statistical Learning with Application in R; Springer Texts un Statistics; Springer: Berlin/Heidelberg, Germany, 2017. [Google Scholar]
  33. Brooks, G.; Barcikowski, R. The PEAR Method for Sample Sizes in Multiple Linear Regression. Mult. Linear Regres. Viewp. 2012, 38, 1–16. [Google Scholar]
  34. Berding, N.; Brotherton, G.A.; le Brocq, D.G.; Skinner, J.C. Near Infrared Reflectance Spectroscopy for Analysis of Sugarcane from Clonal Evaluation Trials: I. Fibrated Cane. Crop Sci. 1991, 31. [Google Scholar] [CrossRef]
  35. Madsen, L.R.; White, B.E.; Rein, P.W.; Madsen, L.R.; White, B.E.; Rein, P.W. Evaluation of a near Infrared Spectrometer for the Direct Analysis of Sugar Cane. J. Am. Soc. Sugarcane Technol. 2003, 23, 80–92. [Google Scholar]
  36. Zgouz, A.; Héran, D.; Barthès, B.; Bastianelli, D.; Bonnal, L.; Baeten, V.; Lurol, S.; Bonin, M.; Roger, J.-M.; Bendoula, R.; et al. Dataset of Visible-near Infrared Handheld and Micro-Spectrometers—Comparison of the Prediction Accuracy of Sugarcane Properties. Data Brief 2020, 31, 106013. [Google Scholar] [CrossRef] [PubMed]
Figure 1. Continuous-wave technique.
Sustainability 13 01227 g001
Figure 2. Schematic diagram of UltraBrix.
Sustainability 13 01227 g002
Figure 3. UltraBrix laboratory device.
Sustainability 13 01227 g003
Figure 4. Transducer elements and transducer clamp.
Sustainability 13 01227 g004
Figure 5. Piezoelectric transducer.
Sustainability 13 01227 g005
Figure 6. Instrumentation amplifier circuit with a bandpass filter.
Sustainability 13 01227 g006
Figure 7. Gain of the circuit bandpass by frequency.
Sustainability 13 01227 g007
Figure 8. Fitted line calibration/validation results (training sample, 80 observations).
Sustainability 13 01227 g008
Figure 9. Calibration/validation results (training sample, 80 observations).
Sustainability 13 01227 g009
Figure 10. (a) Signal attenuation as a function of increasing the diameter and reducing the amplitude of the output signal; (b) Attenuation surface (Beer’s law).
Sustainability 13 01227 g010
Figure 11. (a) Test results (34 observations); (b) Residual plots (34 observations).
Sustainability 13 01227 g011
Figure 12. Apparatus for receiving and transmitting measurements from the UltraBrix.
Sustainability 13 01227 g012
Figure 13. (a) Measurement of the sound wave propagation time through a specimen; (b) Oscilloscope—measurement of the sound wave propagation time through a specimen.
Sustainability 13 01227 g013
Table 1. °Brix in sugarcane: commonly used methods.
MethodEquipment Cost (USD)Sampling
Time (min) a
Refractometry50020
Polarimeter11,30020
Chromatography9200–23,40030
Biosensor42505
°Brix hydrometer3015–20
Spectroscopy7000–128,000
71,000–99,300
0.2–1
a time elapsed to perform a measurement.
Table 2. Statistical features (validation/calibration and test sample) (specimens).
Validation/Calibration Sample (N = 80)
MeanStandard DeviationMinimumMedianMax
Attenuation (cm−1)2.410.331.862.353.02
°Brix22.460.6621.3322.2924.30
Test sample (N = 34)
Attenuation (cm−1)2.540.362.052.443.28
°Brix22.440.5521.8322.3023.76
Table 3. Electronic components.
ComponentsValue
RG (Resistor)1 kΩ
R3 R4 R5 e R622 kΩ
C1 (Capacitor)10 nF
C2 (Capacitor)1 nF
Table 4. Coefficient of determination: °Brix in sugarcane by different methods.
MethodCoefficient of Determination (R2)Author
Capacitive0.98Naderi-Boldaji (2015) [21]
Electromagnetic sensor0.99Harnsoongnoen (2017) [9]
Microwave--Jackson (2014) [22]
NIR0.91Berding et al. (1991a) [34]
MIR0.97Madsen et al. (2003) [35]
VIS/NIR (absorption)0.89Nawi et al. (2013) [24]
VIS/NIR (reflectance)0.91Nawi et al. (2013) [24]
Table 5. Portable NIR devices’ measurements in sugarcane.
Device and ManufacturerRMSER2Cost
DLP NIRscan Nano EVM 6.20.864$1136.00
F750 (Felix Instrument)8.90.720$7500.00–8500.00
LabSpec 4 (ASD)2.60.976Not found
MicroNIR1700 (Viavi)3.80.949Not found
MicroNIR2200 (Viavi)2.80.972Not found
NIRONE 2.2 (Spectral Engines)7.70.791$2434.00
Scio (Consumer Physics)9.40.687$1999.00
TellSpec (TellSpec)9.30.692$1500.00
Publisher’s Note: MDPI stays neutral with regard to jurisdictional claims in published maps and institutional affiliations.

