Abstract
The commitment of governments to sustainable development was materialised in the Millennium Development Goals (MDGs) and later in the Sustainable Development Goals (SDGs), the latter being a more ambitious project that positions local governments as the main agents for its implementation. With the aim of improving the sustainability of cities, this research analyses the commitment of Spanish local governments to the SDG-11, indicating possible improvements with the aim of complying with Agenda 2030. We use the X-STATIS study technique with graphic representations. The results indicate a positive trend towards achieving SDG-11, in which progressive governments are concerned with issues of inclusive and sustainable urbanisation as a result of increased citizen participation, and conservative governments focus on slum upgrading and safety in inclusive and accessible public spaces. In addition, the ideological coincidence between different administrative levels is an impetus to the fulfilment of SDG-11.
1. Introduction
At the beginning of the 21st century, world leaders initiated to consider the need to address the challenges of the Earth by setting the MDGs. With the experience gained in the implementation of these objectives, and after the deadline for their achievement, a more ambitious and comprehensive set of objectives was adopted in September 2015. In order to eradicate poverty, protect the planet, and improve the lives of all citizens without leaving anyone out, the 17 Sustainable Development Goals (SDGs) were agreed as part of Agenda 2030. Today, the crisis caused by Covid-19 poses a serious threat to the lives and well-being of millions of people around the world, giving rise to unprecedented situations affecting the economic, political, and social spheres. SDGs are no strangers to this reality; the impact of the pandemic negatively affects their achievement, making their implementation difficult and conditioning the future of countries in the coming years [1].
In this context, it is difficult to imagine how SDGs can be implemented without the involvement of local governments. Their capacity for community leadership, which provides cohesion and support to society, represents a unique position from which to obtain the collaboration of different agents that favour the fulfilment of the SDGs [2]. The importance of local government in sustainable development is reflected in SDG-11, indicating the need to “Make cities and human settlements inclusive, safe, resilient, and sustainable”. The impact of the pandemic caused by Covid-19 is proving to be moderately unfavourable for the fulfilment of this objective due to two aspects: on the one hand, urban poverty is increasing while public transport and access to green spaces are limited; on the other hand, urban population movements are improving with a significant decrease in pollution levels [1].
To achieve the SDGs, it is imperative to identify the starting point, quantify the targets, and indicate the public policies that favour their fulfilment. It is reasonable to think that if the SDG directly involves the local level, its evaluation should also be carried out at this level, with municipal data and characteristics. Therefore, and in order to contribute to the sustainable development of cities, taking into account the experience of the current pandemic, we consider that it is necessary to evaluate the commitment of local governments with the implementation of SDG-11. From the perspective of local governments in Spain, we identify their degree of compliance and point out the possible political factors that may improve their implementation in order to meet Agenda 2030.
In this sense, the complex transnational problems faced by SDGs require collective action at all levels, particularly since global actors recognise that more must be done to achieve the goals set out in Agenda 2030 [3]. Therefore, given the need for cooperation between governments, we wonder if there are differences in the commitment of SDG-11 according to the mayor’s ideology, or if ideological alignment between governments from different levels affects the implementation of SDG-11.
1.1. Benchmark Studies
The complexity and diversity of SDG-11 prevent a homogeneous analysis of cities around the world, taking into account the competences attributed to local governments in each country and the political, economic, and social characteristics of different countries. So far, it has been difficult to find databases that provide a comprehensive analysis of local policies of a wide scope [4]. Hence, there is a debate on the suitability of the indicators and their measurement, which raises some problems related to the extent of the targets [5]. We found several investigations that make SDG-11 measurable according to the characteristics of the place analysed. Thus, for Chinese cities, data on housing, traffic, land use and planning, environmental impact, public spaces, and the relationship between urban and rural areas are used [6]. In contrast, different approaches to SDG-11 were developed for German cities, with the municipal one focussing on residential rental prices, the modal division of traffic, road traffic injuries, land use, and recreational areas. However, within the German context itself, there are problems of comparability, disaggregation of data or lack of more precise indicators on sustainability [7]. On the other hand, from a central government perspective, in Romania, the indicators of all SDGs have been evaluated, according to the guidelines and strategies in the implementation of Agenda 2030, by analysing, in the specific case of SGG-11, the situation of households, victims of traffic accidents, air pollution, waste recycling, public transport, and criminality [8].
One important aspect of SDG-11 is related to urban planning, given the demographic phenomenon produced in recent years aimed at concentrating the population in large cities. This pattern of urban growth creates a problem in land distribution, and geospatial indicators need to be evaluated in order to achieve efficient land use [9]. This demographic characteristic has led to more than half of the world’s population living in large cities today, and it continues to grow at a greater rate in developing countries [10]. Another effect is access to housing, which is a key element in the sustainable development of large cities, where the different parties involved in the planning and construction process must work together to improve the sustainability of buildings and achieve SDG-11 [11].
1.2. Political Factors
The commitment of local governments to Agenda 2030 will determine the fulfilment of the SDGs. However, the perception of each ruler may imply different actions conditioned by their ideology. The literature has analysed the impact of ideology on municipal management, with different results. On the one hand, progressive governments are in favour of increasing spending by increasing debt, which leads to greater financial instability [12]. With regard to the provision of public services, progressive local governments are less likely to subcontract to the private sector than conservative governments [13]. In contrast, conservative governments are less efficient in providing some municipal services [14]. On the other hand, local governments face similar problems that require homogeneous solutions, where ideology seems to be losing influence in their decisions [15]. In addition, intergovernmental collaboration can give a boost to the SDGs. In this respect, it has been shown that ideological synchronisation between different levels of government leads to similar actions, resulting in a possible management advantage [16]. Thus, when there is an ideological alignment of political parties at different levels of government, collaboration increases, and results improve [17].
2. Materials and Methods
2.1. Sample
Spain is organised territorially into Autonomous Communities (17), provinces (50), and municipalities (8131) each with the autonomy to manage its respective interests. The municipalities are the administration closest to the citizen which, together with the Provincial Councils (41), Island Councils (11) and other infra and supra municipal entities, comprise the Local Administration in Spain. Most (84.01%) of these municipalities have fewer than 5000 inhabitants and are not obliged to provide the same public services as a large city, orienting their management towards the most basic services (lighting, waste collection, water supply, and street paving).
Considering the targets of SDG-11, in this work, we focus on municipalities with a population of more than 50,000. The commitment of these local governments to Agenda 2030 and the quantity and quality of the information provided allows for better analysis. Furthermore, these municipalities are a clear example of the demographic phenomenon produced in recent years, which is characterised by the exodus of small towns towards large cities, where 52.59% of the Spanish population currently lives, representing only 1.78% of the total number of Spanish municipalities.
With the information available, a complete data panel was designed, selecting only those local governments with sufficient information to evaluate SDG-11. When the inexistence of some specific data for a municipality and year of those considered in the sample was confirmed, they were estimated using alternative regressions, in order not to reduce the size of the sample. This estimate does not represent more than 3% of the total data. Consequently, the final sample is made up of a complete panel of 58 municipalities for the period 2014–2018. Thus, we have five data matrices with 58 rows (municipalities) and 12 columns (outputs), for a total of 3480 observations.
2.2. Materials
To evaluate compliance with the SDGs, the United Nations (UN) established a set of indicators associated with the targets in order to homogenise the calculation criteria. In our case, to measure the commitment of Spanish local governments to SDG-11, Table 1 shows the targets and indicators proposed for this objective and the outputs selected by the authors, according to the characteristics of local governments in Spain. Therefore, the following variables related to the targets are used: guaranteeing access for all citizens to adequate housing and basic services (Suitable housing); access to safe, affordable, and sustainable transport systems for all citizens (Travelers); inclusive and sustainable urbanisation (Urbanisation and Citizen participation); protecting and safeguarding cultural and natural heritage (Effective cost); reducing environmental impact (Urban cleaning, Waste management, and Air pollution); providing universal access to green, public, safe, inclusive, and accessible spaces (Green spaces, Public highway, and Urban security); and providing support to Least Developed Countries in the construction of sustainable and resilient buildings (Transfers). Table 2 shows the descriptive statistics for the proposed variables.

Table 1.
Sustainable Development Goal 11: Make cities and human settlements inclusive, safe, resilient, and sustainable.
Table 2.
Description and descriptive statistics of outputs.
2.3. Method
The X-STATIS study technique [18] is used for data analysis in a three-way format. In our case, we have information from 12 outputs that evaluate the commitment of 58 local governments to SDG-11 during the period 2014–2018. This technique belongs to the STATIS family of methods [19,20], which aims to extract relevant information from a three-way table. Its procedure is centred on the construction of a commitment matrix that summarises the information contained in the k tables.
The first step, prior to building the commitment, is to study the relationship between the different tables, in our case, the different years. This is done by analysing the interstructure (see Figure 1), which consists of a general comparison of the structure of the k tables of data. The vector covariance matrix is constructed, which contains the scalar products among tables, where the element in row k and column l is calculated as Cov(Xk, Xl) = Tr(XtkDnXlDp), with Xk being the k-ésima table of the sequence, and Dn and Dp being the metrics for rows and columns, respectively. In this way, we can find out which years have had similar behaviour or if there has been any significant change between them. This step will be performed based on a Euclidean representation, where each year (each data table) will be represented with a vector and the similarity between years will correspond to acute angles between vectors.
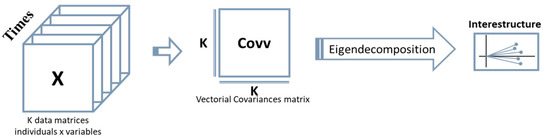
Figure 1.
Interstructure analysis flow chart in X-STATIS.
The second step is the construction of the commitment matrix (see Figure 2); from the k data tables (each table has 58 rows and 12 columns of dimensions), we build the Z matrix, where through vectorisation, each of its column vectors corresponds to the data of each original matrix, stacking its variables one on top of the other. In our study, the Z matrix will consist of 696 rows (the information of the 58 municipalities in the 12 outputs) and five columns (the years), with a total of 3480 observations. To this matrix, we apply a decomposition into values and singular vectors (Z = UΛVt), and we get the matrix ZV, with the same dimensions of Z, but now, its columns contain the values of the five components of its decomposition in decreasing order. Each component is a linear combination of Z; remember that each variable of Z is referred to a matrix (to a year), and therefore, all contain information common to all the matrices (years). Now, if we select the first ZV component (696 rows), since it is the one that carries the most information, and deploy it horizontally, we get the compromise matrix, with the same dimensions as the original matrices (58 rows × 12 columns). This matrix “filters” the noise and contains the statistically significant information: the stable structure of the k matrixes. In this way, it is possible to trace its structure and represent this information on a two-dimensional plane, where we can identify groups of municipalities according to their position (represented as points on the plane). In addition, the most important relationships among the outputs can be seen, clarifying how the achievement of some targets can intrinsically lead to the achievement of others, which we will do by evaluating the sharpest angles among the outputs (represented as vectors). All the calculations and graphs made in this X-STATIS analysis were processed using the software ADE-4 [21].
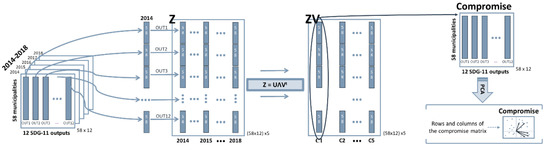
Figure 2.
Compromise analysis flow chart in X-STATIS.
3. Results and Discussion
To achieve the SDG-11 targets by 2030, local governments must address major changes in the management of services related to this objective. With the results obtained for the outputs selected for each target, we can say that the trend is positive for achieving SDG-11. In particular, the commitment of local governments to the sustainable development of cities is demonstrated by upgrading slums, increasing access to housing, providing appropriate basic services to citizens (Suitable housing), and increasing sustainability in transport systems (Travelers). In addition, the direct participation of civil society has increased in recent years (Citizen participation), as well as concern for the least developed countries, for which financial assistance has been increased (Transfers). There has also been an increase in the average proportion of paved surface in cities with open spaces for public use (Public highway), which has been accompanied by an improvement in air quality; reducing the levels of smaller diameter particles (Air pollution), which cause most respiratory diseases, is improving urban life.
On the other hand, certain aspects of SDG-11 show a negative trend, such as the rate of land consumption (Urbanisation); urban security, with an increase in the proportion of crimes against freedom and sexual indemnity (Urban security); and worse waste management, whose production has increased in recent years (Waste management). Finally, it should be noted that certain indicators have slowed down their development in the period analysed, showing little relevance for local governments, such as the periodicity of the waste collection service (Urban cleaning), the spaces of parks and gardens (Green spaces), or the cost of the service of protection and management of historical heritage (Effective cost).
These results can be seen in Figure 3, where the z-scores for each output in the different years of the study are represented in descending order (first bar year 2018). These measures allow the comparison of the evolution of some outputs with others, showing the average value over the whole period through the vertical line, obtaining positive values on the right and negative values on the left (for example, in the output public highway, the year 2018 presents the average value for the period, 2017 values are above, and 2014–2016 values are below).
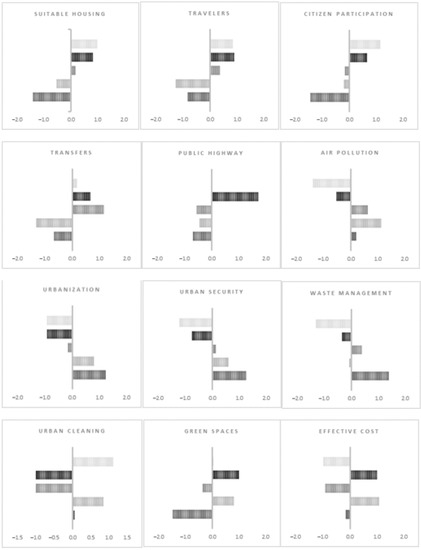
Figure 3.
Z-score outputs of Sustainable Development Goal (SDG)-11, 2014–2018 period.
Once the outputs prioritised by local governments have been verified, we evaluate the relationship among them with the three-way X-STATIS analysis. We use five data matrices, one for each period (2014–2018). Each year, the information from 58 municipalities on 12 proposed outputs is available to measure their commitment to SDG-11. First, we check the structures of the years through the interstructure analysis (see Figure 4), which provides a graphical estimate of the coefficient of vector correlation between the years being studied. We use the factorial 1–2 plane, which represents approximately 91% of the information, where the years are represented as vectors, associating the acute angles with positive correlations.
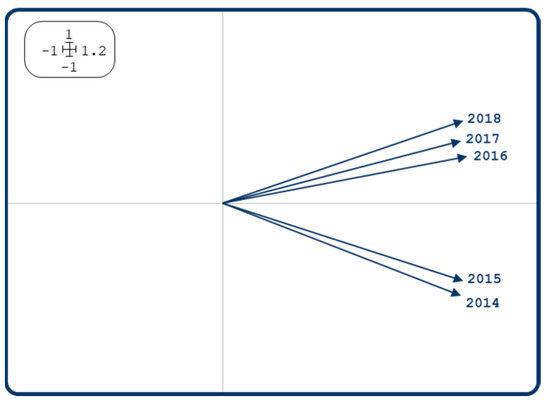
Figure 4.
Interstructure analysis, SDG-11 in 2014–2018.
The period analysed can be clearly divided into two stages; the first corresponds to the years 2014 and 2015, with high similarities between them, and the second corresponds to the years 2016–2018. This change, which was already noticeable in the z-scores (see Figure 3), may be due to the renewal of local governments produced by the municipal elections of 2015 (we will analyse this later by adding political variables to the study)
Then, we construct the commitment matrix, which synthesises the information contained in the five years of study, filtering the noise and capturing the relevant data. We will use the factorial plane 1–2 for its representation, which encompasses 41% of the information. The representation of this information will allow us to observe the most important relationships among the outputs during the years analysed. Focusing now on Figure 5, where the municipalities are represented as points, those located close to each other will have similar commitment characteristics. Regarding the outputs, these are represented as vectors, evaluating the acute angles with positive correlations
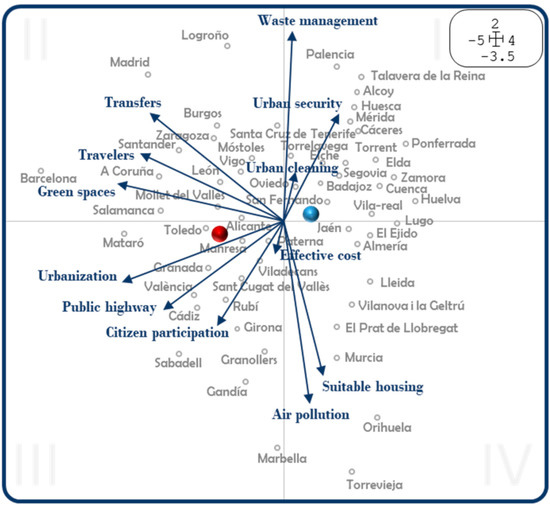
Figure 5.
Compromise analysis representing all the municipalities and all the outputs.
The results show that those municipalities with high Citizen participation have the best inclusive and sustainable housing developments as well as the best capacity for the planning and management of human settlements (Urbanisation). In addition, they have a greater number of paved areas (Public highway), with the municipalities of Cadiz, Gandia, Girona, Granollers, and Sabadell standing out, as can be seen in the third quadrant of Figure 5. On the other hand, municipalities with a higher proportion of Suitable housing show greater guarantees in terms of access to housing and basic services, so improving the marginal neighbourhoods (Gandía, Marbella, Orihuela, Torrevieja, and other tourist municipalities); however, they have worse levels of air quality (Air pollution).
Elsewhere, the municipalities that show more value in Transfers to less developed countries are also characterised by enjoying safer, accessible, and sustainable transport systems (Travelers), and a higher proportion of public and safe Green spaces (Barcelona, Burgos, Madrid, Logroño, Salamanca, Santander...). Likewise, these municipalities pay special attention to Waste management, show better levels of air quality (lower value in Air pollution), and achieve the lowest rates of crimes against sexual freedom (Urban security) (Alcoy, Logroño, Palencia, Talavera de la Reina...).
The stable information from the k data tables throughout the study period has provided us with the common objectives facing local governments. The analysis of the interstructure showed an important change, separating the study into two periods (2014–2015 and 2016–2018), which may be due to political changes in local governments after the 2015 elections. In addition, it should be noted that Agenda 2030 was agreed in 2015 with the 17 SDGs, demonstrating a strong commitment by local governments to sustainable development. With regard to the two circles that appear on the map (Figure 5), these refer to the centroid according to local governments with progressive ideologies, in red, or with conservative ideologies, in blue. The distance they show (remember that we evaluate distances in terms of similarities: close points, similar individuals) on the plane is more than enough to think that there is a trend towards making different decisions according to the ideology of the dominant party in local government (Ideology). The red centroid represents progressive governments and is located on the left semi-plane, showing higher values in Urbanisation, Citizen participation, or Green spaces, among others. On the other hand, the conservative governments are located on the right half of the plane, closer to Urban Security and Urban Cleaning.
In order to explore these differences, we show some graphs of parallel coordinates [22] with a visualisation system that can represent n dimensions in a two-dimensional system, in which each vertical axis corresponds to a variable (the 12 proposed outputs), and the horizontal lines represent the individuals (Figure 6 shows the z-scores per year, differentiating between progressive and conservative governments (Ideology). Figure 7 illustrates the ideological alignment with the government of the Autonomous Community (regional government). In addition, to verify this information, Table 3 presents the corresponding tests of statistical significance according to Mann–Whitney’s U-test.
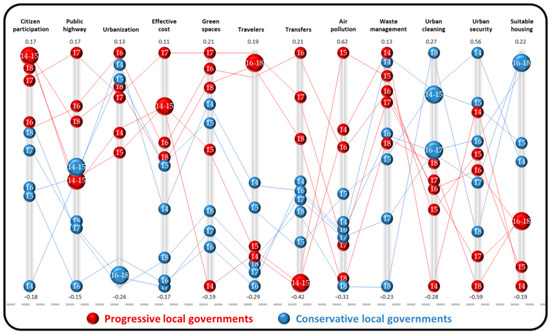
Figure 6.
Graphs of parallel coordinates: outputs SDG-11, progressive and conservative local governments.
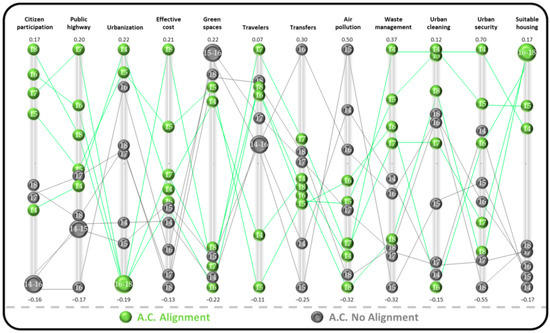
Figure 7.
Parallel coordinates: outputs SDG-11, regional government alignment.
Table 3.
Mann–Whitney U-test of statistical significance, progressive and conservative local governments.
The results show that there are important differences among the outputs proposed to evaluate the commitment of local governments to SDG-11, depending on whether they are led by a mayor with a progressive or a conservative ideology. Progressive governments are more concerned with improving inclusive and sustainable urbanisation, which is reflected in Citizen participation, with highly significant differences (p-value = 0.002), and in the management of land consumption according to population growth (Urbanisation), as well as a greater proportion of paved sections (Public highway), although we only found sample differences. With regard to the preservation, protection, and conservation of historical heritage (Effective cost), again, progressive governments place greater emphasis on all the years analysed; however, due to the high dispersion of data, the differences are not significant. At the same time, these governments have been increasing their financial support (Transfers) to less developed countries, helping the construction and modernisation of sustainable buildings (statistically significant with p-value = 0.048). Similarly, we found significant differences in the proportion of spaces for parks and gardens (p-value = 0.022); conservative governments show a downward trend during the period analysed. Finally, it should be noted that progressive governments have provided better access to safe, affordable, and sustainable transport systems in recent years (Travelers).
On the other hand, conservative local governments are more involved in improving slums, ensuring greater access to housing (Suitable housing), with highly significant differences (p-value = 0.000). In addition, these governments prioritise the security of their municipalities, with inclusive, accessible, and safe public spaces (Urban security), also with highly significant differences (p-value = 0.000). However, it should be noted that “both ideologies” show a downward trend in some security-related issues during the period under review; specifically, the proportion of crimes against sexual freedom has increased. With regard to the reduction of environmental pollution, we found no statistically significant differences for air quality (Air pollution) or for Waste management. However, we did find significant differences in the frequency of urban solid waste collection (p-value = 0.045), as seen in Figure 6, where conservative governments present higher values in all years.
This information shows the consistency of the results, as they confirm the findings of the X-STATIS analysis (Figure 5), which shows the preference of progressive governments for increasing spending towards the outputs of the left semi-plane (Citizen participation, Public highway, Urbanisation, Green spaces, Travelers, Transfers, and Effective cost). On the other hand, the conservative governments are less efficient in the provision of some municipal services, highlighting their commitment to the outputs of the right half of the plan (Suitable housing, Urban security, Urban cleaning, Air pollution, and Waste management).
Finally, following a process similar to the previous one, we verified the impact of the ideological alignment of the local government with that of the Autonomous Community (regional government) (Ideological alignment). Figure 7 shows how the highest values are obtained by those municipalities governed by the same political party as at the regional level. These results confirm a greater intergovernmental collaboration among those governments that coincide in ideology and, consequently, implement similar policies, taking into account that they pursue the same political objectives. In addition, to verify this information, Table 4 presents the corresponding tests of statistical significance according to Mann–Whitney’s U-test, the commitment to reduce environmental impact, with adequate Waste management (p-value = 0.018), to decrease pollution and improve air quality (Air pollution) (p-value = 0.034), and to facilitate access to safe, inclusive, and accessible public spaces, along with lower proportions of crimes against sexual freedom (Urban security) (p-value = 0.047), are outputs that improve with the ideological alignment.
Table 4.
Mann–Whitney U-test of statistical significance, Autonomous Community alignment.
4. Conclusions
Agenda 2030 is facing a severe setback due to the pandemic originated by Covid-19, which not only affects sustainable development, but also life in cities as we knew it until now. In this turbulent scenario, the opportunity arises to identify the degree of compliance with the SDGs in the urban environment in order to serve as an impulse to reach the targets set in 2030. To this end, we considered it appropriate to analyse the SDG that is most important for cities, SDG-11, from the perspective of local governments in Spain. Taking into account the lack of information on sustainable development, the main contribution of the research is the proposal made for the measurement of SDG-11, suggesting variables that measure the results in the services related to the targets.
Evaluating the compliance of SDGs by key actors in their implementation, the local governments, leading players in the development of Agenda 2030 with the idea of “Think globally, act locally”, can be a step towards their success. In line with previous research [23], we consider it necessary to evaluate the compliance with SDG-11 in the context of Spanish local governments in order to offer results oriented to obtaining more sustainable cities. For this purpose, we use a descriptive methodology focussed on the analysis of three-way tables and graphs, which is known as X-STATIS.
The political changes following the Spanish municipal elections of 2015 in local governments, and the agreements reached within the framework of Agenda 2030 at the end of 2015, appear to have influenced the commitment of local governments to sustainable development. The perception of each ruler, conditioned by his or her political ideology, implies the correct selection of public policies that favor his or her success.
Progressive governments, in favor of increasing spending by raising debt, are focussing their efforts on inclusive and sustainable urbanisation as a result of more citizen participation, which leads to the construction of paved sections and the development of new residential areas. These governments allocate a higher proportion of their budgets to the preservation of historical and cultural heritage, green spaces, and financial support to less developed countries. On the other hand, conservative governments prioritise the improvement of slums, safe, inclusive and accessible public spaces, and the importance of daily urban solid waste collection. In addition, the ideology seems to be losing influence on other targets, such as those related to climate change. In addition, the ideological synchronisation between different levels of government leads to an improvement in the results of SDG-11.
Finally, the scarce availability of information is the main limitation of the research, reducing the analysis to 58 municipalities with a population of more than 50,000 inhabitants. In the coming years, with the publication of more complete and detailed information, it will be possible to increase the sample. In short, the results point to a high commitment of local governments to SDG-11, which may not be sufficient to achieve the goal to Make cities and human settlements inclusive, safe, resilient and sustainable. Therefore, given the need to obtain sustainable cities, and considering the effects of the pandemic and demographic changes, this research provides public managers with results that guide them in the implementation of future public policies aimed at sustainable development.
Author Contributions
Conceptualization, P.-J.M.-C., V.A.-E., B.B. and I.-M.G.-S.; methodology, P.-J.M.-C., V.A.-E. and I.-M.G.-S.; software, V.A.-E.; validation, P.-J.M.-C., V.A.-E., B.B. and I.-M.G.-S.; formal analysis, P.-J.M.-C. and V.A.-E.; investigation, P.-J.M.-C., V.A.-E., B.B. and I.-M.G.-S.; resources, P.-J.M.-C.; data curation, P.-J.M.-C. and V.A.-E.; writing—original draft preparation, P.-J.M.-C. and V.A.-E.; writing—review and editing, B.B. and I.-M.G.-S.; visualization, P.-J.M.-C., V.A.-E., B.B. and I.-M.G.-S.; supervision, I.-M.G.-S.; project administration, P.-J.M.-C., V.A.-E., B.B. and I.-M.G.-S. All authors have read and agreed to the published version of the manuscript.
Funding
The Spanish Ministry of Education (FPU-MEC 16/03180) has financially supported this study.
Institutional Review Board Statement
Not applicable.
Informed Consent Statement
Not applicable.
Data Availability Statement
Publicly available datasets were analyzed in this study. This data can be found in the links listed in Table 2.
Acknowledgments
In this section, you can acknowledge any support given which is not covered by the author contribution or funding sections. This may include administrative and technical support, or donations in kind (e.g., materials used for experiments).
Conflicts of Interest
The authors declare no conflict of interest.
References
- Sustainable Development Report. 2020. Available online: https://sdgindex.org/reports/sustainable-development-report-2020/ (accessed on 17 November 2020).
- Guha, J.; Chakrabarti, B. Achieving the Sustainable Development Goals (SDGs) through decentralisation and the role of local governments: A systematic review. Commonw. J. Local Gov. 2019, 6855. Available online: https://orcid.org/0000-0002-5627-1462 (accessed on 17 November 2020). [CrossRef]
- Naim, K.; Beaudet, S. Network Governance for Collective Action in Implementing United Nations Sustainable Development Goals. Adm. Sci. 2020, 10, 100. [Google Scholar] [CrossRef]
- Rozhenkova, V.; Allmang, S.; Ly, S.; Franken, D.; Heymann, J. The role of comparative city policy data in assessing progress toward the urban SDG targets. Cities 2019, 95, 102357. [Google Scholar] [CrossRef]
- Hansson, S.; Arfvidsson, H.; Simon, D. Governance for sustainable urban development: The double function of SDG indicators. Area Dev. Policy 2019, 4, 217–235. [Google Scholar] [CrossRef]
- Xu, X.; Gao, J.; Zhang, Z.; Fu, J. An Assessment of Chinese Pathways to Implement the UN Sustainable Development Goal-11 (SDG-11)—A Case Study of the Yangtze River Delta Urban Agglomeration. Int. J. Environ. Res. Public Heal. 2019, 16, 2288. [Google Scholar] [CrossRef] [PubMed]
- Koch, F.; Krellenberg, K. How to contextualize SDG 11? Looking at indicators for sustainable urban development in Germany. ISPRS Int. J. Geo-Inf. 2018, 7, 464. [Google Scholar] [CrossRef]
- Firoiu, D.; Ionescu, G.H.; Băndoi, A.; Florea, N.M.; Jianu, E. Achieving sustainable development goals (SDG): Implementation of the 2030 Agenda in Romania. Sustainability 2019, 11, 2156. [Google Scholar] [CrossRef]
- Melchiorri, M.; Pesaresi, M.; Florczyk, A.J.; Corbane, C.; Kemper, T. Principles and applications of the global human settlement layer as baseline for the land use efficiency indicator—SDG 11.3. 1. ISPRS Int. J. Geo-Inf. 2019, 8, 96. [Google Scholar] [CrossRef]
- Mudau, N.; Mwaniki, D.; Tsoeleng, L.; Mashalane, M.; Beguy, D.; Ndugwa, R. Assessment of SDG Indicator 11.3. 1 and Urban Growth Trends of Major and Small Cities in South Africa. Sustainability 2020, 12, 7063. [Google Scholar] [CrossRef]
- Zhu, J.; Cao, Y.; Zhai, J.; Zhao, X.; Zhao, Y.; Kang, S. Analysis on synergies and trade-offs in green building development: From the perspective of SDG 11. Chin. J. Popul. Resour. Environ. 2019, 17, 341–351. [Google Scholar] [CrossRef]
- Navarro-Galera, A.; Lara-Rubio, J.; Buendía-Carrillo, D.; Rayo-Cantón, S. Analyzing Political and Systemic Determinants of Financial Risk in Local Governments. Transylv. Rev. Adm. Sci. 2020, 16, 104–123. [Google Scholar] [CrossRef]
- Alonso, J.M.; Andrews, R.; Hodgkinson, I.R. Institutional, ideological and political influences on local government contracting: Evidence from England. Public Adm. 2015, 94, 244–262. [Google Scholar] [CrossRef]
- Benito, B.; Guillamón, M.-D.; Martínez-Córdoba, P.-J. Determinants of efficiency improvement in the Spanish public lighting sector. Util. Policy 2020, 64, 101026. [Google Scholar] [CrossRef]
- Rios, V.; Pascual, E.; Cabases, F. What drives local government spending in Spain? A dynamic spatial panel approach. Spat. Econ. Anal. 2017, 12, 230–250. [Google Scholar] [CrossRef]
- Bolívar, M.P.R.; Navarro-Galera, A.; Subirés, M.D.L.; Muñoz, L.A. Analysing the accounting measurement of financial sustainability in local governments through political factors. Account. Audit. Account. J. 2018, 31, 2135–2164. [Google Scholar] [CrossRef]
- Benito, B.; Martínez-Córdoba, P.-J.; Guillamón, M.-D. Impact of politicians’ salaries and their dedication regime on the efficiency of municipal public services. Local Gov. Stud. 2020, 1–24. [Google Scholar] [CrossRef]
- Jaffrenou, P.A. Sur L’analyse des Familles Finies de Variables Vectorielles: Bases Algébriques et Application à la Description Statistique. Ph.D. Thesis, Université de Lyon, Lyon, France, 1978. [Google Scholar]
- Escoufier, Y. Opérateur associé à un tableau de données. In Annales de l’INSEE; JSTOR: New York, NY, USA, 1976; pp. 165–179. [Google Scholar]
- L’Hermier des Plantes, H. Structuration des Tableauya trois Indices de la Statistique; Université Montpellier II: Montpellier, France, 1976. [Google Scholar]
- Thioulouse, J.; Chessel, D.; Dole, S.; Olivier, J.-M. ADE-4: A multivariate analysis and graphical display software. Stat. Comput. 1997, 7, 75–83. [Google Scholar] [CrossRef]
- Inselberg, A. The Plane R2 with Coordinate Parallel. In Computer Science and Applied Mathematics Departments; Tel Aviv University: Tel Aviv, Israel, 1992. [Google Scholar]
- Martínez-Córdoba, P.J.; Raimo, N.; Vitolla, F.; Benito, B. Achieving Sustainable Development Goals. Efficiency in the Spanish Clean Water and Sanitation Sector. Sustainability 2020, 12, 3015. [Google Scholar] [CrossRef]


Publisher’s Note: MDPI stays neutral with regard to jurisdictional claims in published maps and institutional affiliations. |
© 2021 by the authors. Licensee MDPI, Basel, Switzerland. This article is an open access article distributed under the terms and conditions of the Creative Commons Attribution (CC BY) license (http://creativecommons.org/licenses/by/4.0/).