1. Introduction
Location information is a necessary component of the Future Sustainability Computing (FSC) framework which integrates diverse policies, procedures, programs and provides amount of potential applications such as mobile computing, robots and pedestrian navigation, augmented reality and other Location Based Service (LBS) [
1]. For example, a RSSI-based distance estimation framework [
2] was constructed to accurately estimate the location of users, in sustainable indoor computing environment. An infrared human posture recognition method [
3] was also developed for intelligent monitoring in sustainable smart homes. Indoor localization and monitoring are important to sustainability technologies and systems. By obtaining the location information, more services and application can be developed to support FSC.
While outdoor positioning problem can be well solved by using the Global Navigation Satellite System (GNSS), indoor positioning remains a challenge due to the lack of reliable and low-cost indoor positioning technique. There are a number of solutions developed for indoor positioning such as Wi-Fi [
4], magnetic [
5], UltraWide Band (UWB) [
6], image [
7], inertial sensor [
8], etc. Compare with other indoor localization techniques, Wi-Fi fingerprinting has been widely used in various indoor environments, since it can be easily deployed using existing off-the-shelf mobile devices and wireless network (e.g., 802.11 Wi-Fi infrastructures) without participating of other devices and infrastructures.
Based on routing algorithms [
9,
10], Wi-Fi signals can achieve relative high throughput, low latency, and high reliability from source to destination in wireless networks. However, the growing demand and diverse traffic pattern of smart devices increase the strain on wireless networks. Some studies attempt to provide solutions to fulfill the requirements of distributed communications. For example, Wang [
11] presented a coexistent routing and flooding network, which could conduct routing within the Wi-Fi network and flooding among ZigBee node using a single stream of Wi-Fi packets. Kemal [
12] proposed the DeepWiFi protocol, which hardens the baseline Wi-Fi with deep learning and sustains high throughput by mitigating out-of-network interference. It supports embedded platform and provide major throughput gains especially when channels are likely to be jammed. Gilani [
13] proposed a Software Defined Networking (SDN) based routing architecture for Wireless Mesh Networks (WMNs). Although these state-of-art Wi-Fi routing algorithms can improve the capacity of communication of wireless network, they cannot directly provide accurate location information of mobile devices for indoor and outdoor location-based applications.
The principle of Wi-Fi fingerprinting is to calculate location by matching the current Wi-Fi received signal strength (RSS) measurements with a set of RSS measurements with known locations. It is generally based on two phases: offline training phase and online localization phase. In offline phase, the geo-tagged RSS measurements are collected from multiple Wi-Fi access points (AP) and treated as a fingerprint. A number of the collected fingerprints which covers an indoor space is used to construct a radio map. Whereas, in online phase, the location of user is computed by matching the current fingerprint measurement with a constructed radio map. The localization accuracy of Wi-Fi fingerprinting is significantly affected by the quality of radio map. The location accuracy and reliability can be improved when the fingerprints are accurately geo-tagged with high spatial density. However, it also requires more labor and time cost for fingerprint measurement and geo-tagging. For Wi-Fi fingerprinting, the collecting and constructing of radio map is a key issue that limits its large-scale application.
Recently, much effort has been devoted to reducing the intensive cost of manpower and time for radio signal mapping (i.e., collecting and generating radio map). Some researchers have tried to replace the site survey process by employing wireless radio propagation models [
14,
15]. However, due to the unpredictability of signal propagation, signal propagation models do not perform properly in complex indoor environments and lack the potential of their applications. Some researchers [
16,
17,
18,
19] have focused on development of zero-configuration indoor localization systems which do not require an explicit site survey phase. Instead, they implement a training phase during the use of the systems. For example, Sorour [
16] exploits the inherent spatial correlation of RSS measurements to reduce the required calibration of fingerprints and performs a direct localization without a full radio map. Redpin [
17] is an adaptive zero-configuration indoor localization system which constructs a fingerprint database by encouraging users to upload self-identified locations. However, Redpin needs a large amount of collaboration data and cannot be applied in the initial stage. UnLoc [
18] is a localization scheme which can sense and identify indoor landmarks, e.g., elevators or corridor corners, and uses them to recalibrate the locations, without the need for a site survey. Zee [
19] is a localization system that does not need an explicit site survey or calibration. It requires the users to roam in the indoor area to collect information before being able to localize themselves. In general, although these systems can be directly applied without a full site surveying process, they require a long training and recalibration process and cannot provide reliable localization results before the initialization and training phase are finished. As a widely used artificial intelligence technique, deep learning has been employed by many indoor localization approaches. For example, Hsieh [
20] presented a deep learning-based approach by utilizing transmission channel quality metrics. This approach partitioned indoor area into two-dimensional blocks and train four deep neural networks to estimate the location of RSS and CSI (channel state information). Koike [
21] used spatial beam signal-to-noise ratios (SNRs) as mid-grained intermediate-level channel measurement and constructed fingerprinting database by using a deep learning approach. These works have not considered the labor cost of constructing and updating fingerprint database. WiDeep in [
22] is a deep learning-based indoor localization system, which combines a stacked denoising autoencoders and a probabilistic framework to handle the noise and instability of Wi-Fi signals. Zahra [
23] employed extreme learning machines and the high-level features extracted from autoencoder to improve localization performance in both feature extraction and classification. Wang [
24] proposed a stacked denoising autoencoder based feature extraction method to obtain time-independent Wi-Fi fingerprint. A multi-layer perceptron method was used to build a regression model which associated the extracted feature to the corresponding location. These methods can reduce the labor cost required for fingerprinting but also require a relative long time for data training.
Crowdsourcing is an efficient way to reduce the labor and time cost that needed for radio signal mapping. Many studies [
25,
26,
27,
28] have used crowdsourcing trajectories to construct radio map. For example, WILL [
25] investigates unexploited RF signal characteristics and leverage user motions to construct radio map. LIFS [
26] applies human motions to connect previously independent radio fingerprints. Recently, AiFiMatch [
27] and RCILS [
28] take advantage of activity detection and map matching techniques to estimate crowdsourcing trajectory. Later, fingerprints can be calibrated from the trajectory sequence. However, although the accuracy of activity detection method is high, it is difficult to apply these systems in practical use. This could be due to the fact as it assumes that all the activities (e.g., a turn) performed at special locations (e.g., corners or elevators). However, this assumption is vulnerable to the randomness of human activity. If a turning activity happens at corridor open space or room, it will be wrong to match the current location to the special locations recorded in an indoor map.
Landmark is always used as the spatial reference due to its with salient visual and semantic characteristics. It can provide accurate location information and can be used to reduce positioning error of indoor or outdoor positioning systems. During the recent decades, a large amount of studies has focused on developing landmark recognition methods or systems. For example, Cao [
29] proposed a landmark recognition algorithm with sparse representation classification and extreme learning machine. The spatial pyramid kernel-based bag-of-words histogram approach was used to extract image feature, and the artificial neural network was trained with extreme learning machine combine with sparse representation classifier for landmark image recognition. Cunha [
30] has proposed the Patch PlaNet which considered landmark recognition as a classification problem and extended the PlaNet deep neural network model to perform the classification. Compared with original network, the performance of Patch PlaNet improves the accuracy of landmark recognition by 5–11 percentages. These works can achieve a satisfactory landmark recognition result. Federico [
31] considered the computational time problem in large-scale landmark recognition. The algorithm can drastically reduce the query time associate with outperform accuracy, which can be applied to diverse embedding techniques. However, this algorithm is not suitable for indoor environment with insufficient texture features. Chua [
32] proposed a landmark-based indoor navigation approach, which employed a 360-degree camera to recognize landmarks and provide a shortest navigation path using Dijkstra algorithm. Except for image landmark, special sensor data or Wi-Fi signal can also be used as landmark. Sun [
33] used both RSS crests and troughs to define a landmark. A RSS waveforms smoothing method was implemented on the clustered crowdsourced trajectories, which improved the location accuracy of Wi-Fi landmarks about 24.2%. The change of indoor environment layout and moving pedestrian may decrease the accuracy of Wi-Fi landmarks.
This study intends to utilize spatial structural features, such as intersections or corners, to correct the cumulative error of crowdsourcing trajectories for radio signal mapping. Compared with human activity, spatial structures are visually sensible features existing in physical space. It makes spatial structures, termed as structure landmarks which are more reliable and robust as compare to activity landmarks. Through detecting and recognizing the structure landmarks (e.g., L-junction, T-junction) along a route, the location of the route can be spatially estimated and calibrated. The sampling points from the route can be used to generate fingerprints and construct radio map for indoor localization.
This study proposes a structure landmark-based radio signal mapping method which is sustainable for indoor localization. For an indoor environment, structure landmarks can be easily extracted from a floorplan and stored in a landmark dataset along with their geo-tags. During a radio signal mapping process, multi-sensor data can be collected through smartphone, including video frames, inertial readings and Wi-Fi signals. Based on proposed structure landmark recognition method, video frames and inertial readings can be integrated to recognize the type of structure landmark along a mapping route. The inertial data can also be utilized to roughly calculate the relative location of the route. By matching the recognized structure landmarks with the ones in landmark dataset, the location of the recognized landmarks can be estimated. After that, the recognized landmarks can be used to accurately estimate the location of the mapping route. Finally, a Wi-Fi radio map can be constructed to extract further Wi-Fi fingerprints from a spatially estimated mapping route. An indoor localization experiment is also conducted to evaluate the quality of the constructed radio map.
This paper is organized as follows:
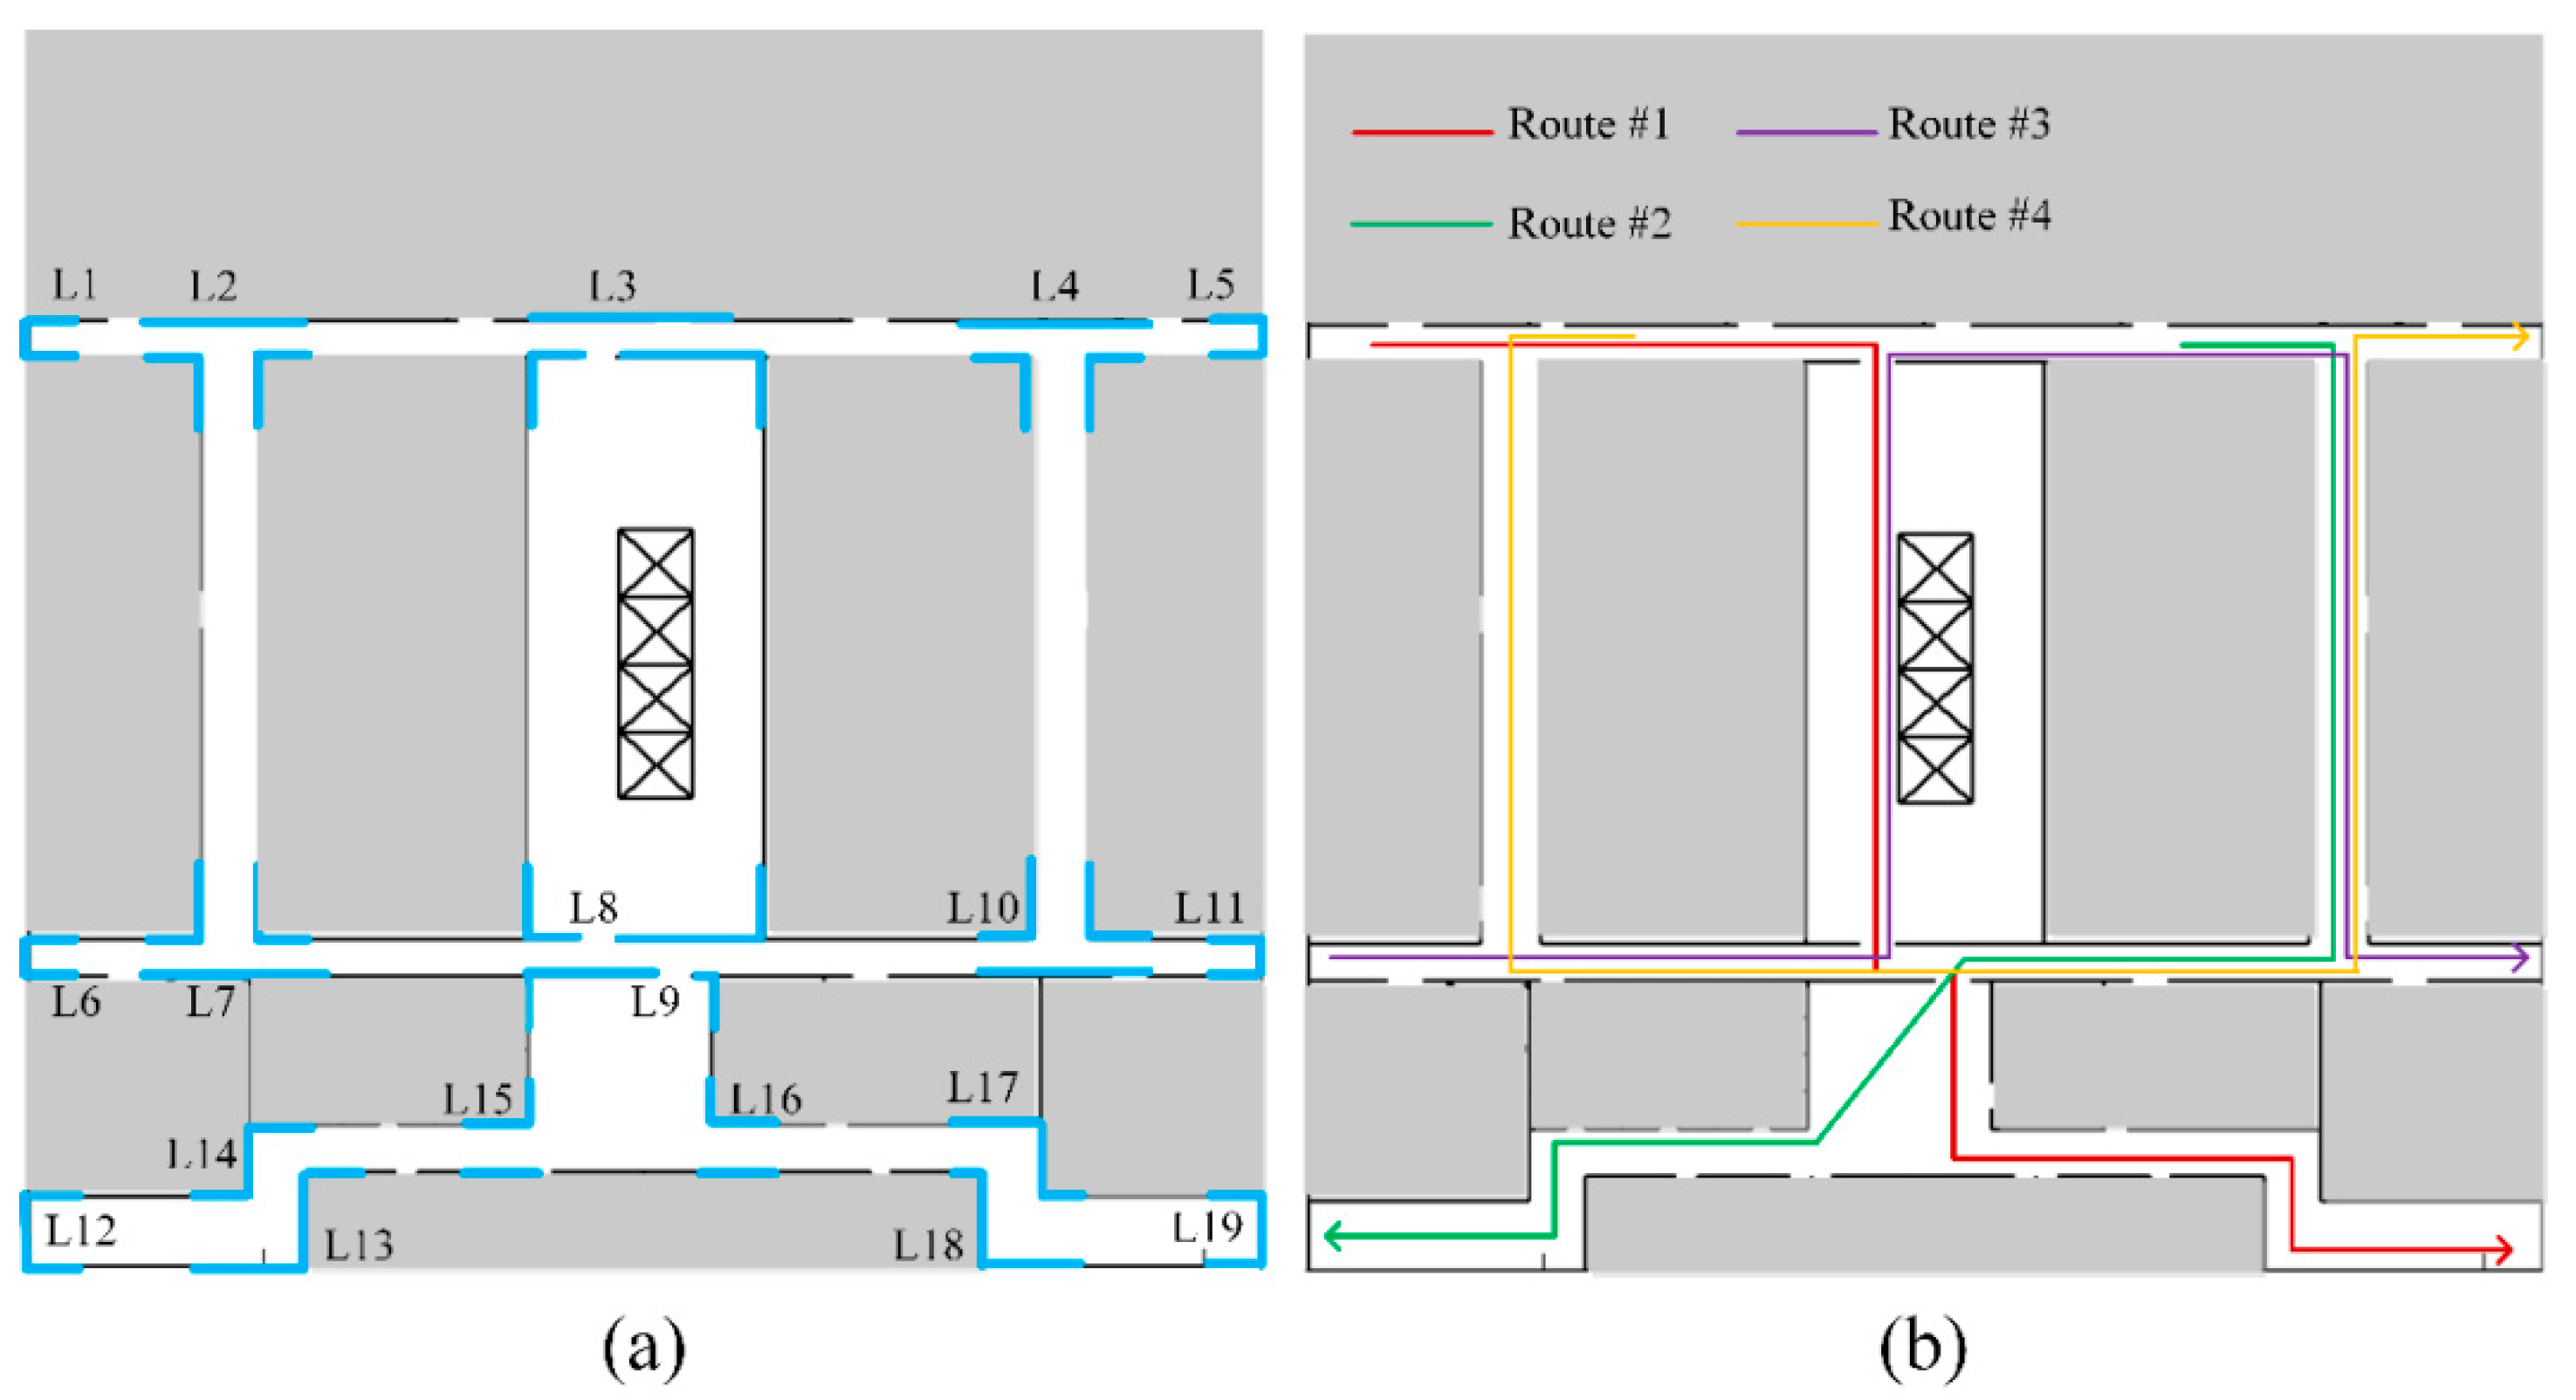
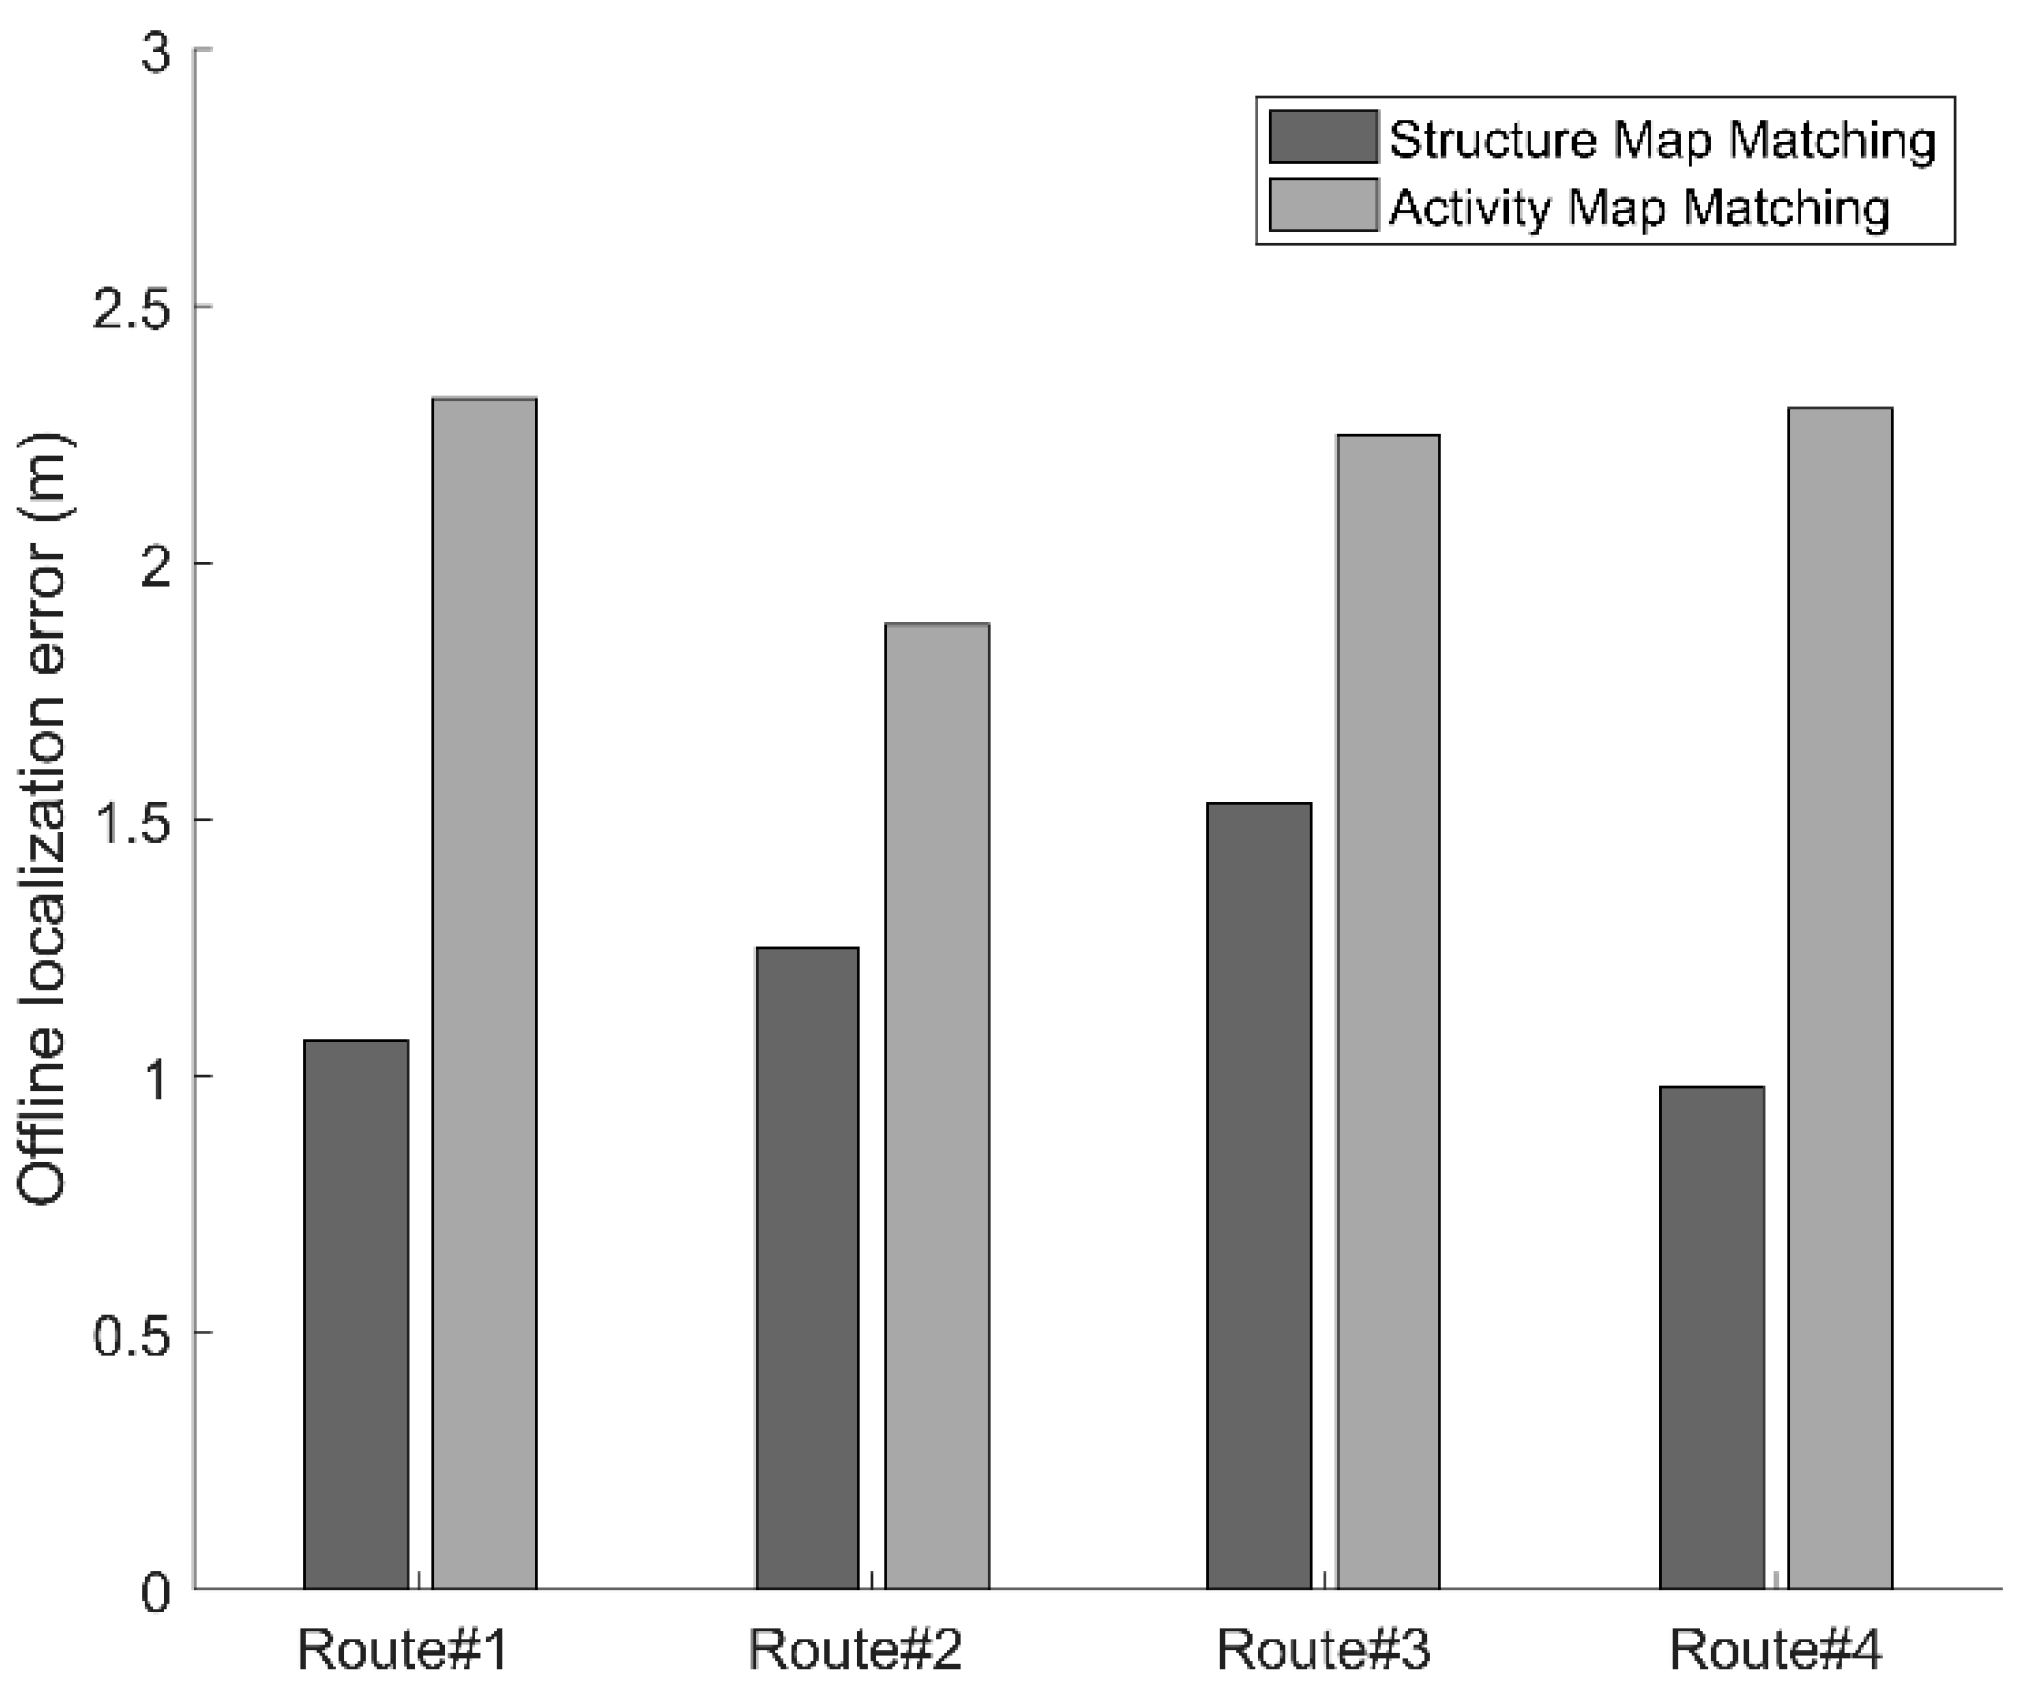
Section 2 presents the methodology of structure landmark based indoor radio signal mapping method. Experimental results and comparisons are described in
Section 3. Conclusions are drawn in
Section 4.
2. Methods
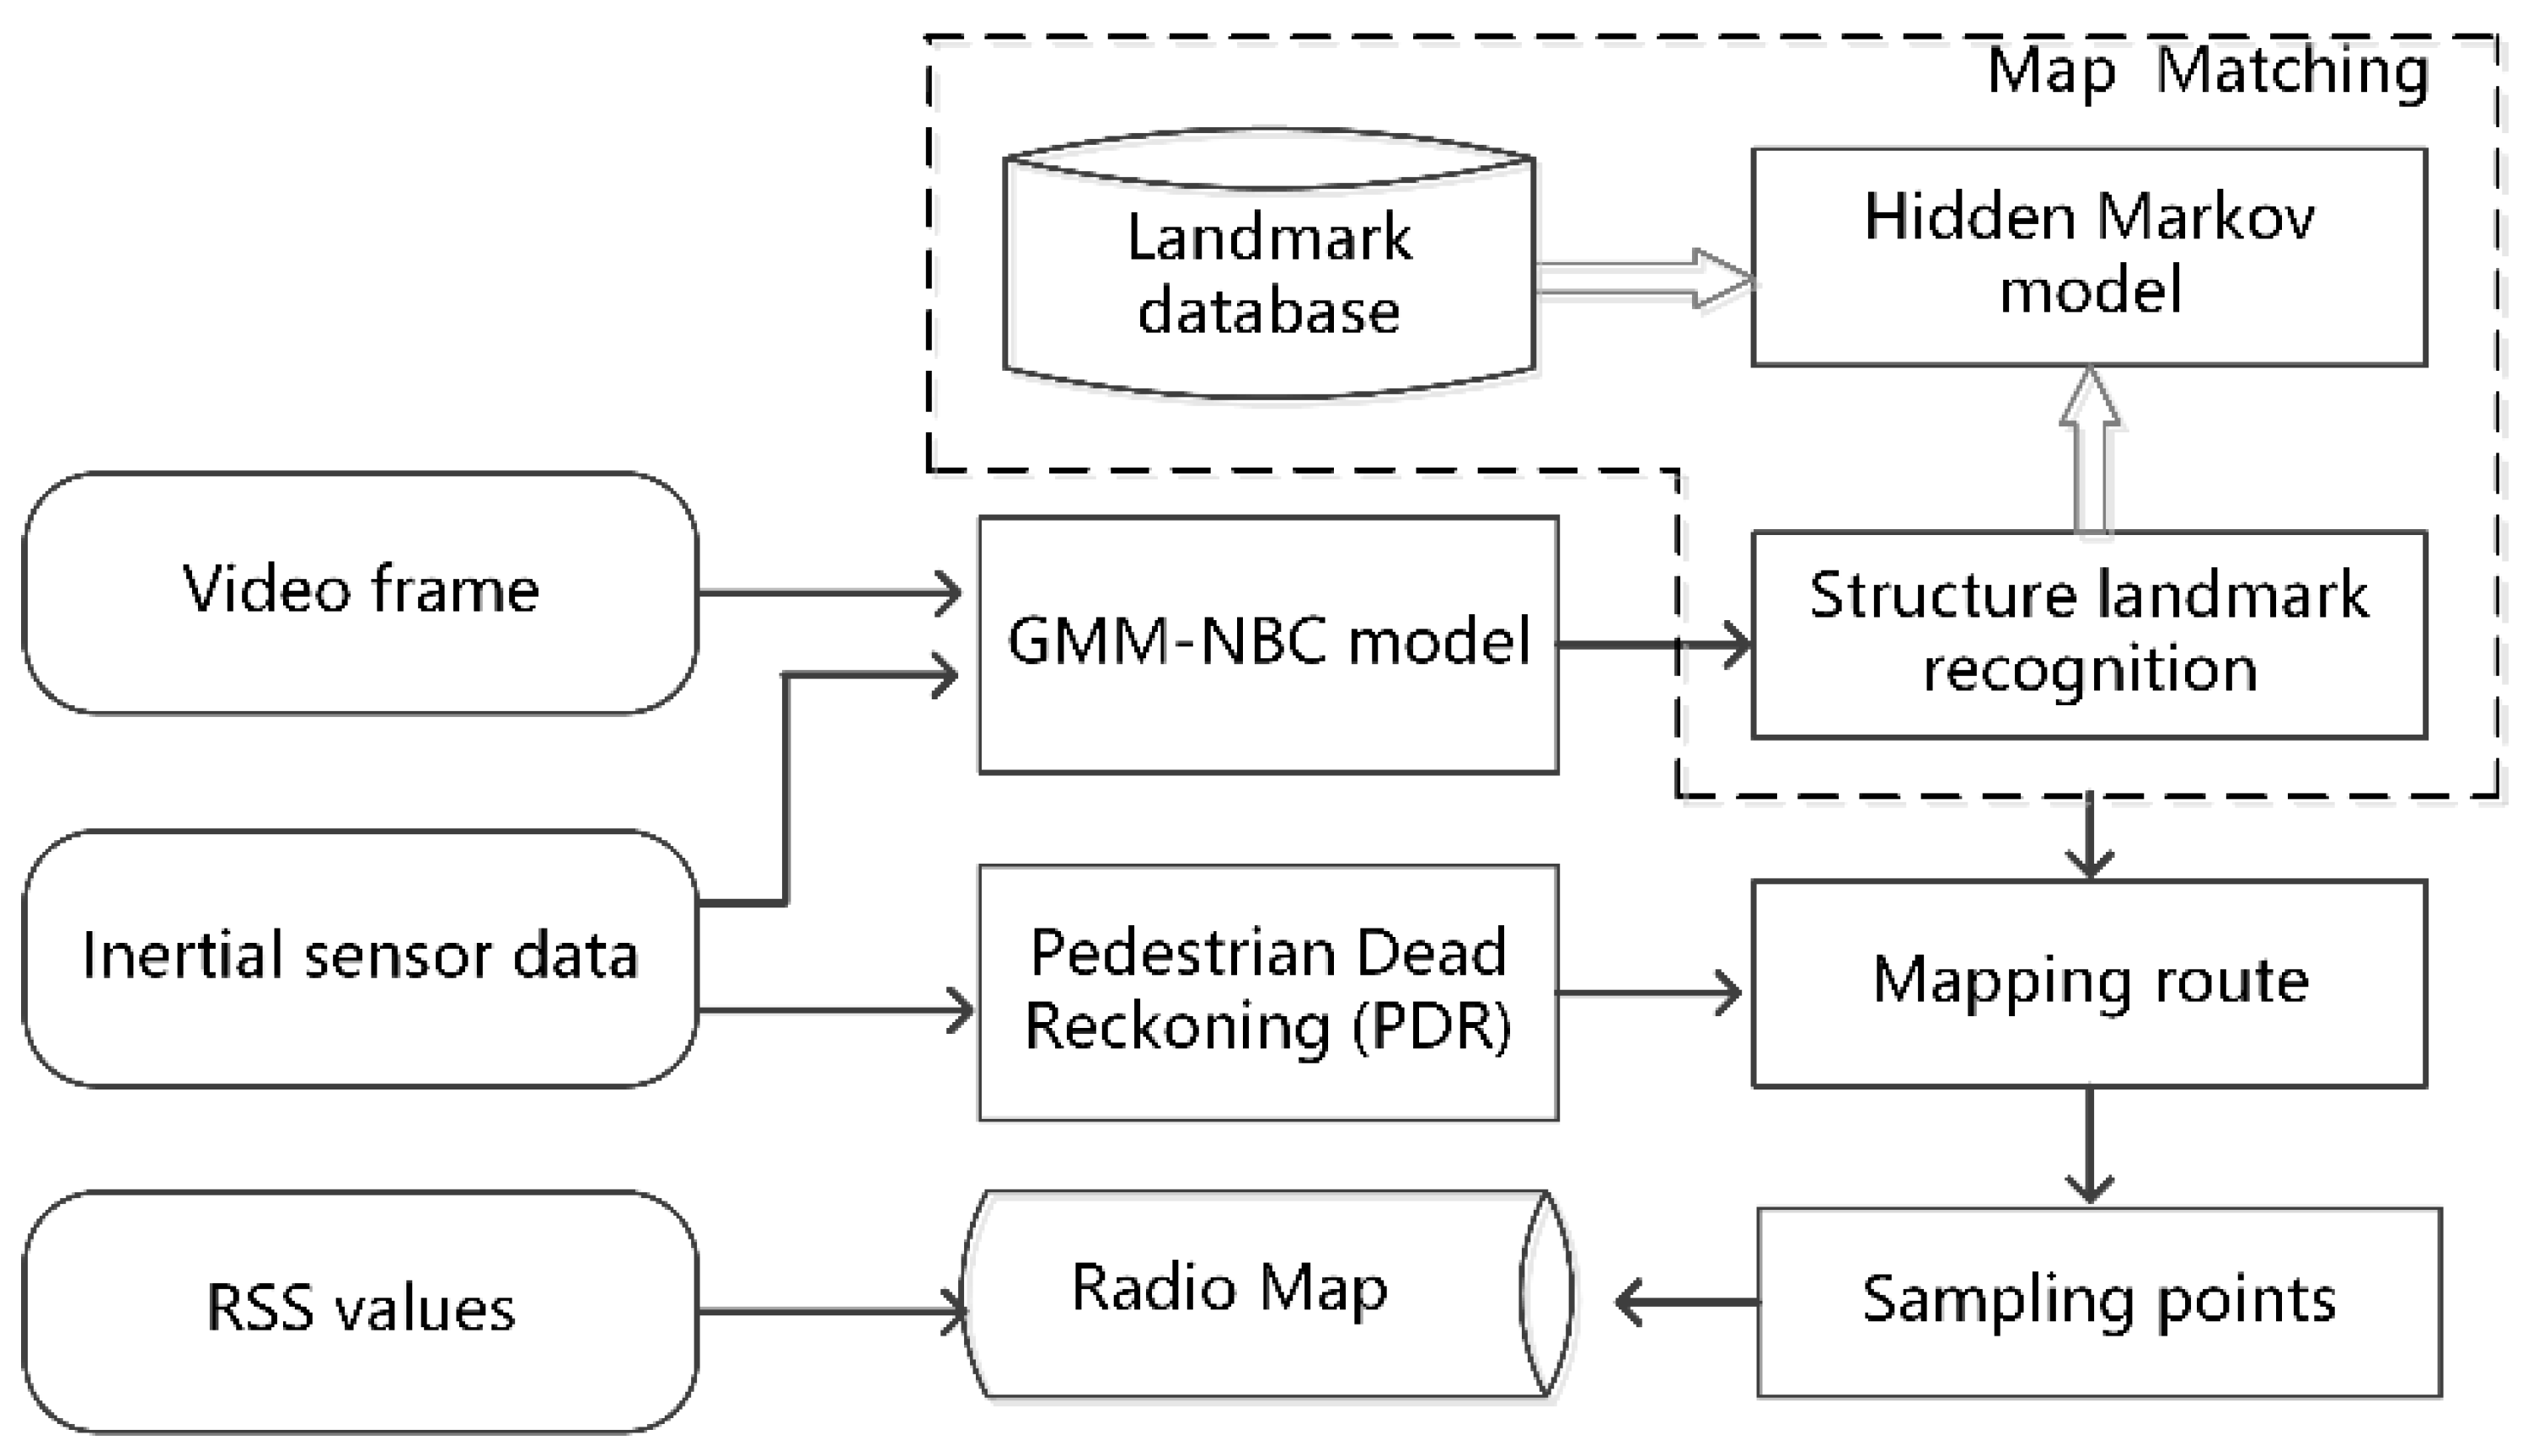
The overview of this approach is described in
Figure 1. The inputs of this approach are video frames, inertial data and Wi-Fi RSS values, which can be collected by smartphone sensors. Landmark dataset, including type and location attributes of structure landmarks, can be extracted from indoor floor plan. The output of this method is a generated Wi-Fi radio map, which can be indirectly used for indoor localization.
This method firstly defined the type of typical structure landmarks in indoor space. Then, a learning-based classification model was designed for distinguishing the type of structure landmark based on collected inertial sensor data and video frames. Inertial sensor data including accelerator, gyroscope and orientation readings were used to recover trajectory geometry by using the PDR method. Furthermore, heading angle change calculated from gyroscope data was used as a feature to recognize the type of structure landmark. As initial location of trajectory was unknown, a Hidden Markov model (HMM) based map matching method was also developed to match the recognized structure landmarks along the trajectory to a landmark database. The location of identified structure landmarks can be determined, which can be further used to estimate the spatial location of the trajectory. Finally, the sampling points from the trajectory were used to generate a radio map for indoor localization.
2.1. Types of Structure Landmark
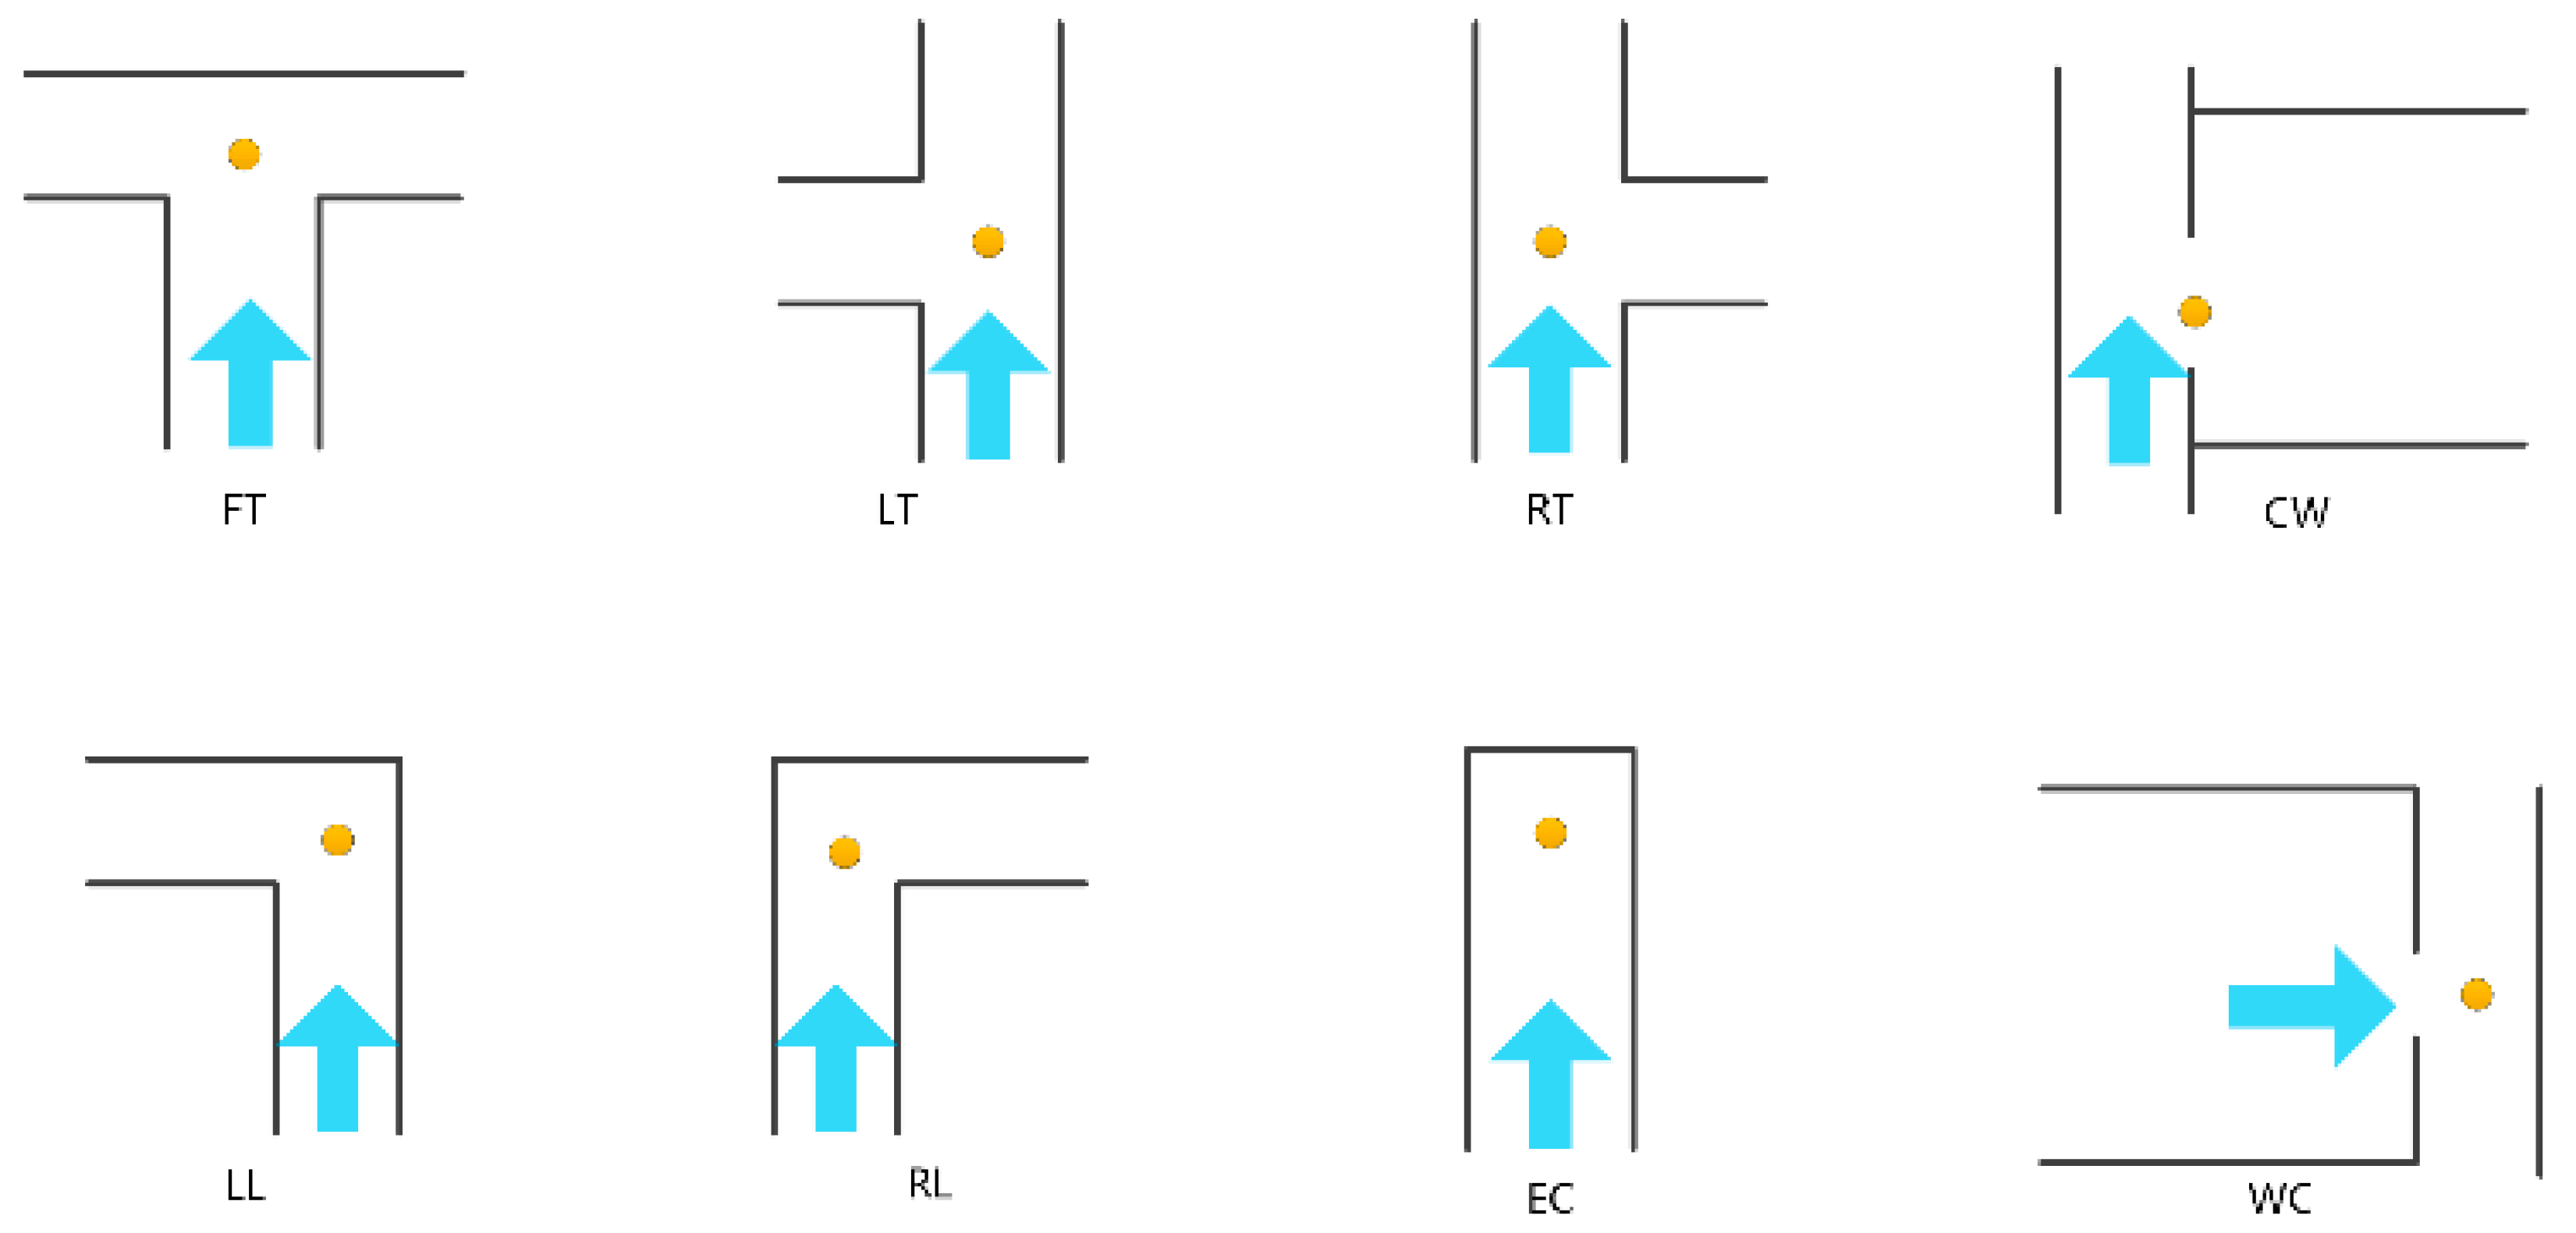
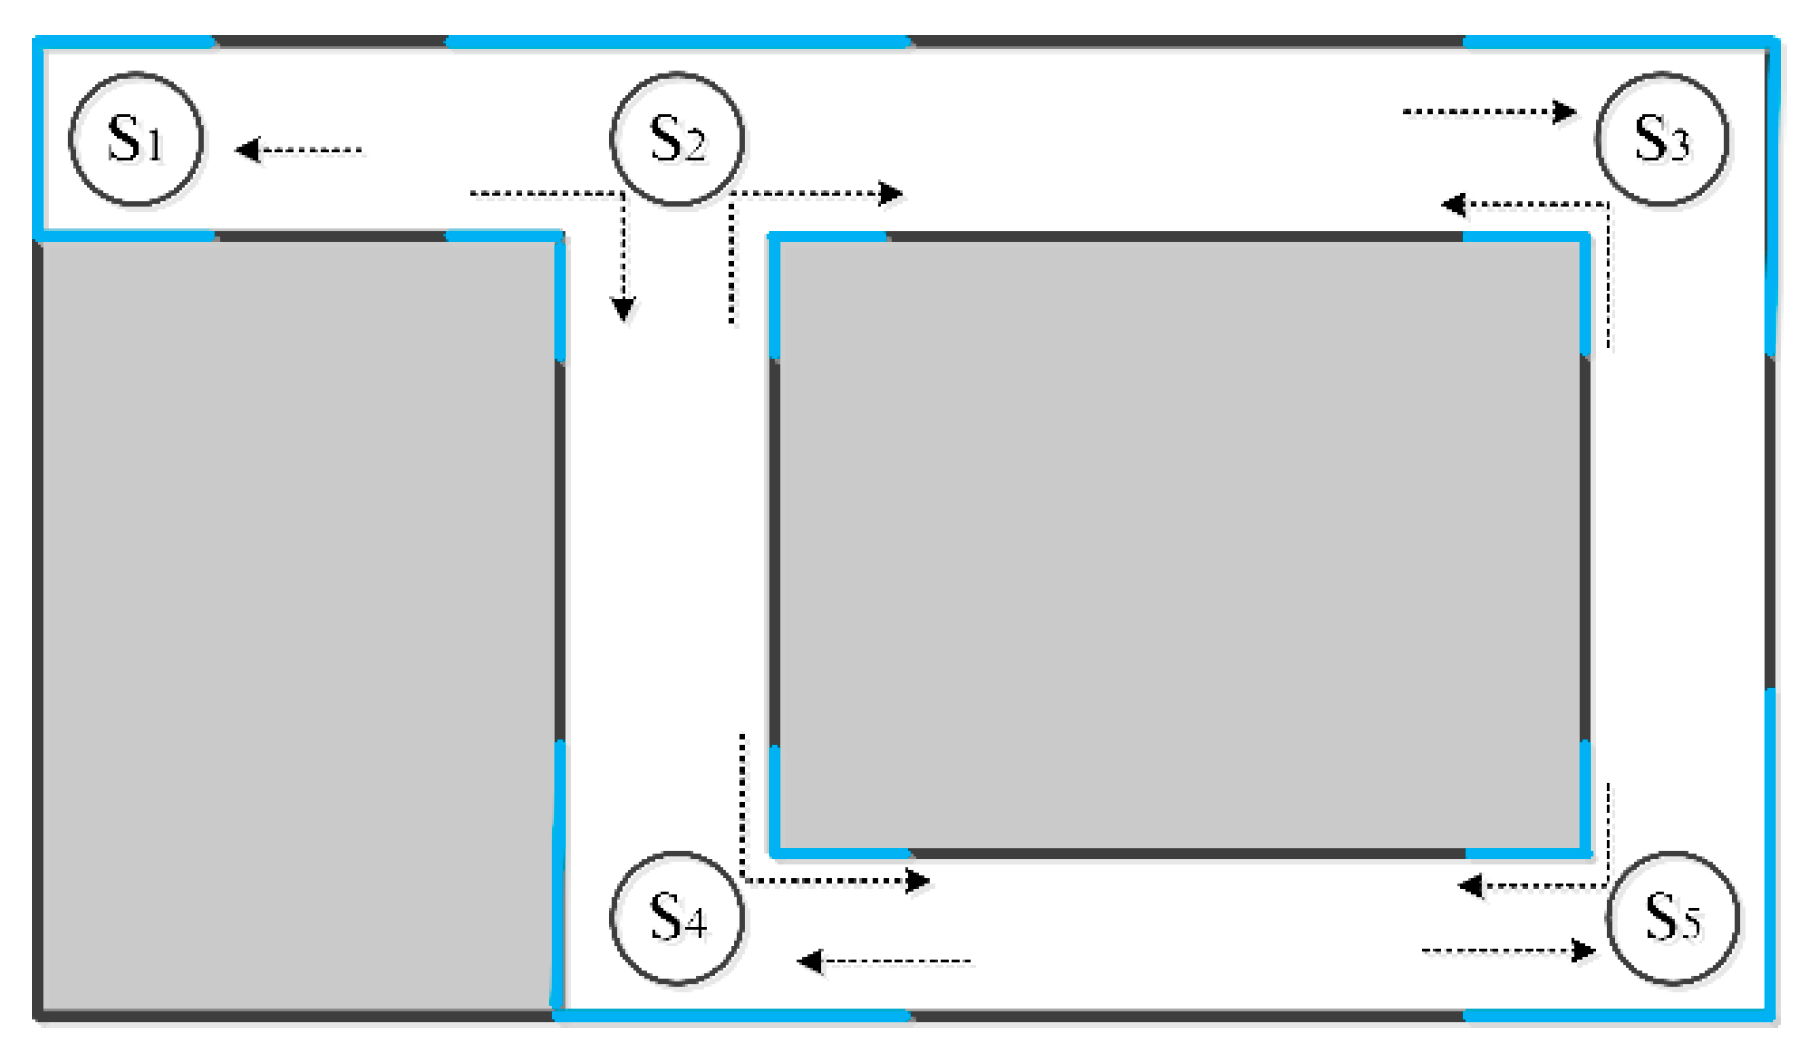
Structure landmarks are defined as visually salient structures in indoor space that anchors special locations, such as intersections, entrance, corners, etc. As shown in
Figure 2, 8 different types of structure landmark have been defined, including FT (T-junction at front angle), LT (T-junction at left angle), RT (T-junction at right angle), LL (L-junction at left angle), RL (L-junction at right angle), EC (end of corridor), CW (corridor to wide area) and WC (wide area to corridor). Each type of structure landmark has a special structural and visual characteristic, which is a basis for landmark recognition. According to the definition, structure landmark dataset can be easily extracted from a floorplan of an in-door space.
This study intends to integrate both visual and inertial features to recognize the type of a structure landmark. The reason for including visual features in landmark recognition is that visual information has a more reliable relationship with the physical environment as compare to inertial information. This method does not depend on the assumption that all walking activities (e.g., a turning action) happen at special locations (e.g., an intersection). Instead, it employs visual information to sense and detect whether a person is at a special location (i.e., structure landmark). A Gaussian Mixture Model based Naïve Bayesian Classifier (GMM-NBC) is proposed to recognize the type of landmark.
2.2. Structure Landmark Recognition
2.2.1. Feature Calculation
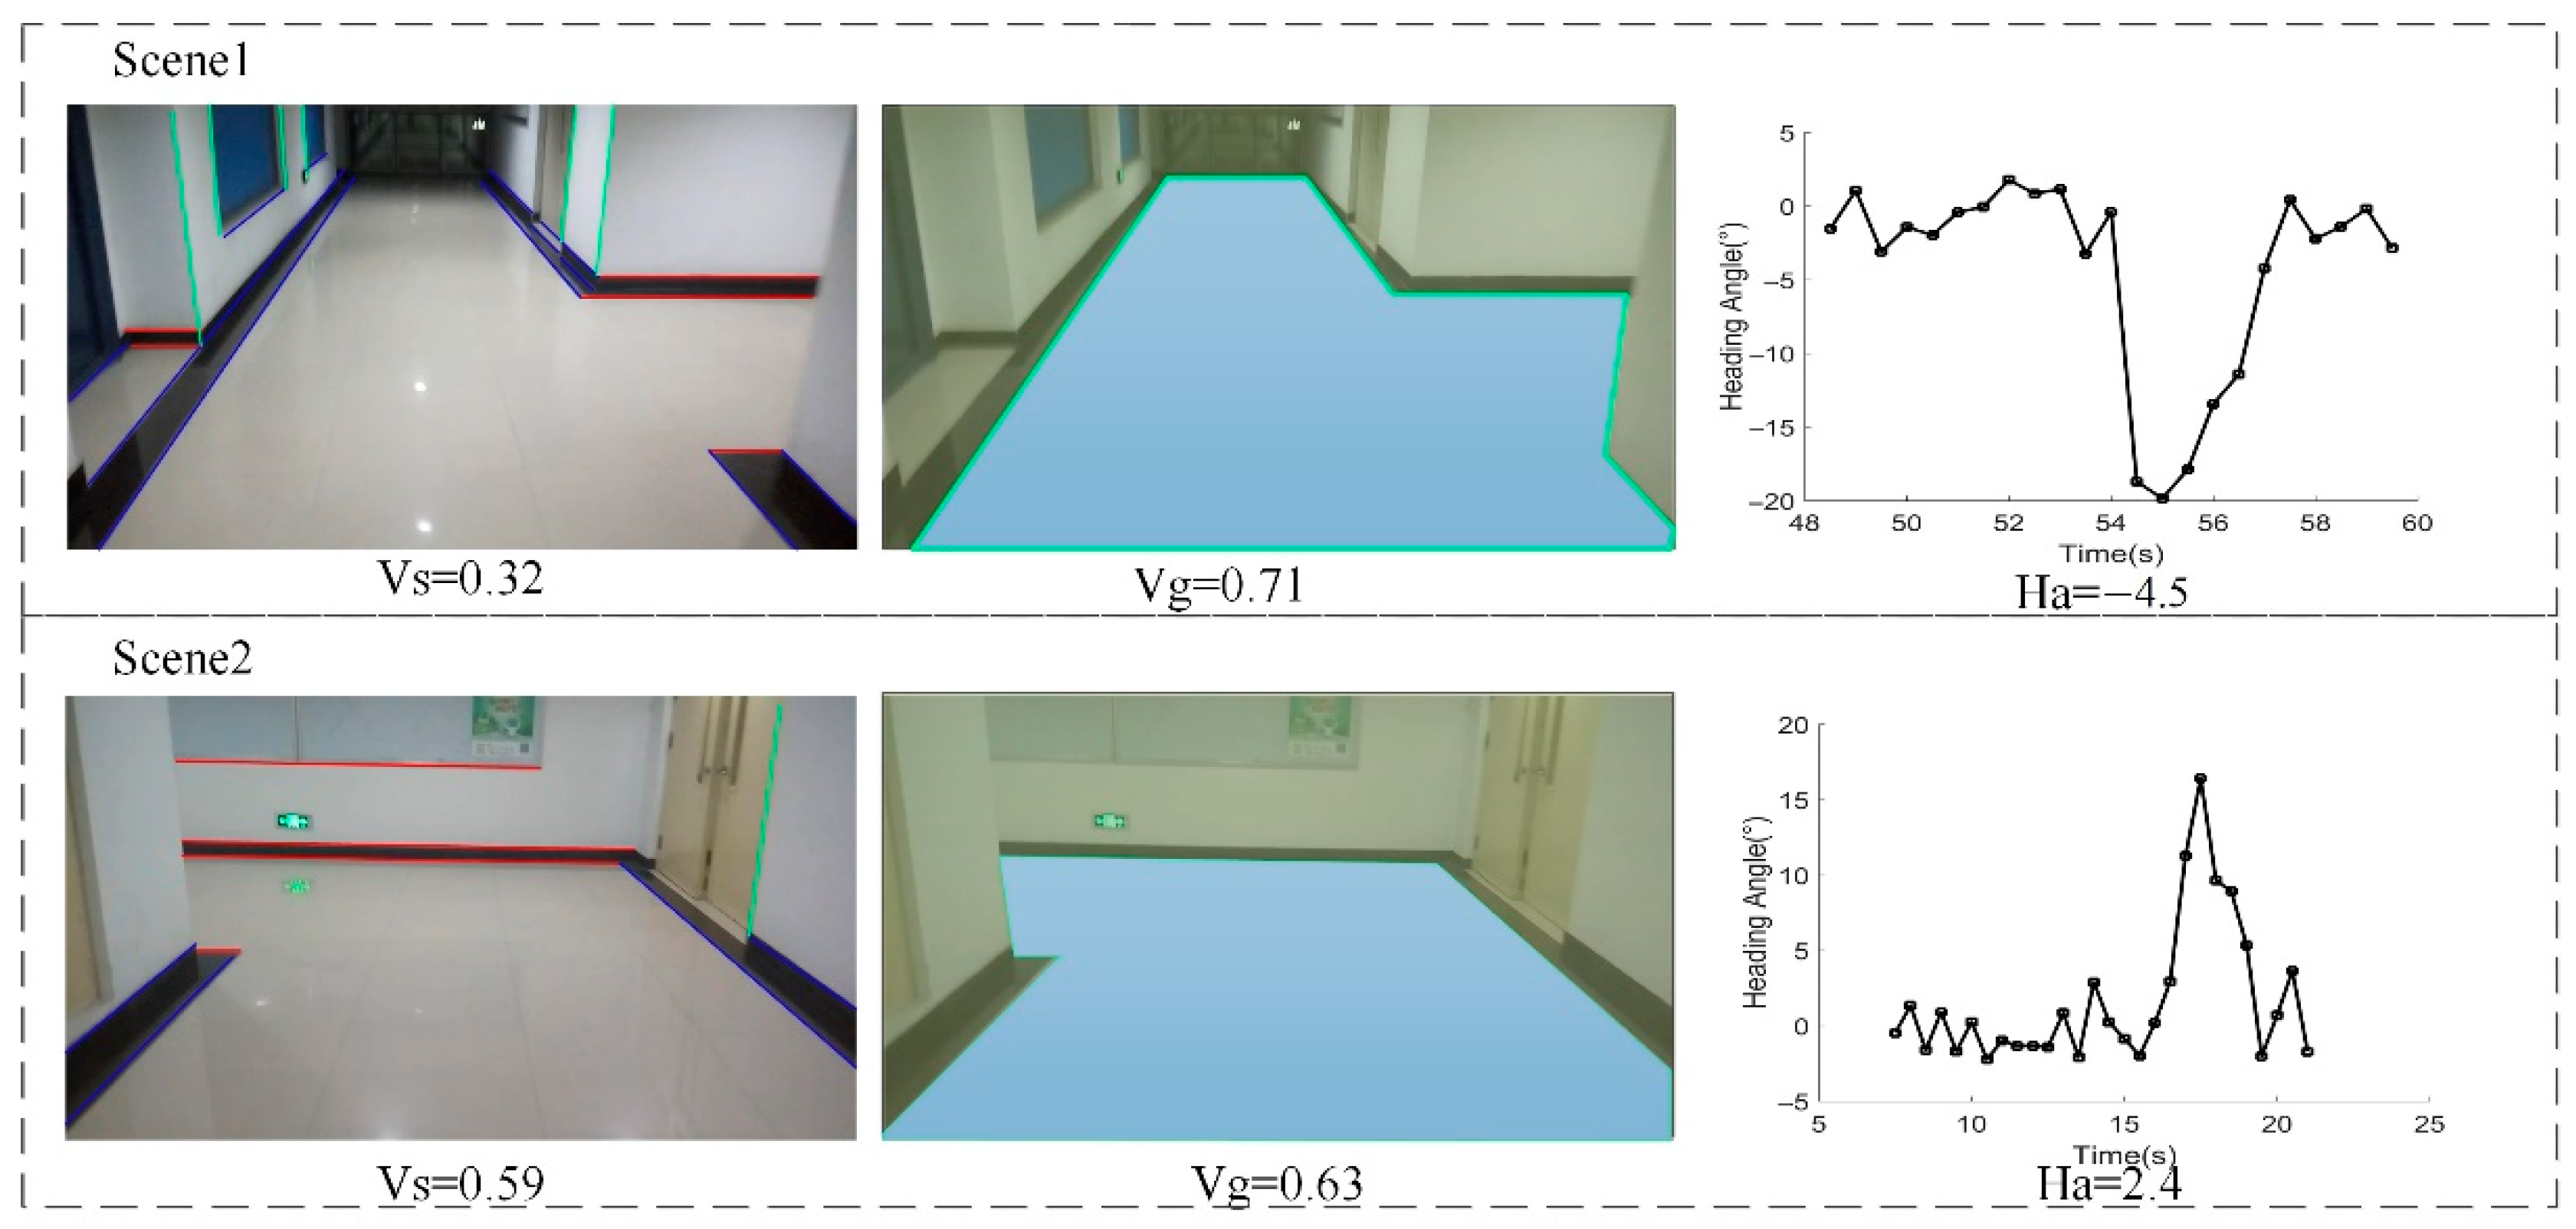
One important visual feature for landmark recognition is vanishing segments, which is the line segments toward the vanishing point of a video frame. Vanishing points and vanishing segments are important visual features for various computer vision studies, including scene understanding [
34], 3D reconstruction [
35], and so on. Indoor scene can be abstracted as three cluster lines with orthogonal direction towards vanishing point. As shown in
Figure 3, the vanishing segments towards horizontal (red line), vertical (green line) and infinity direction (blue line) can be extracted from a video frame by using the proposed method in [
36]. Using vanishing segments, a visual feature variable is defined as follows:
where
is the defined feature value of frame
i,
is the vanishing segments towards the horizontal direction,
is the vanishing segments towards the infinity direction,
is a function to calculate the total length of line segments. The value of
reflects the structure characteristics of a scene.
Another important visual feature is the floor plane of an indoor scene. Floor plane detection is a basic issue for many study fields, such as mobile robotics, navigation and 3D modeling. This method calculates the wall-floor boundary and evaluate the likelihood of horizontal intensity edge line segments by using the algorithm proposed in [
37]. The visual feature variable is defined as follows:
where
is the area of an extracted floor plane from frame
i,
is the size of frame
i. The variable
shows the ratio of floor plane area in an image.
The third feature is heading angle change, which is calculated by using gyroscope readings. When a person walks across a structure landmark, he or she may turn left, turn right or turn around. Different type of structure landmark leads to different walking direction. For example, LL and RL landmark refer to one walk direction, while FT landmark provides two potential walking directions. At the location of EC landmark, a person may turn around. Therefore, this method calculates change in heading angle variable using inertial reading. The feature of heading angle change can be calculated as follows:
where
is the heading angle change of frame
i,
and
are the start and end moments of frame
i,
is the gyroscope readings from smartphone.
For each type of structure landmark, the calculated visual and inertial features are used to construct a feature vector, which can be represent as:
where
represent the three different feature value of frame
j.
Figure 3 shows an example of feature values for two different indoor scenes. Scene 1 is a RT landmark and Scene 2 is a LL landmark. The value of
and
of two scenes are significantly different.
2.2.2. GMM-NBC Construction
In this paper, a GMM-NBC model is designed to distinguish the type of structure landmarks. The principle of GMM-NBC is to estimate the joint probability of continuous feature vectors based on parametric probability density function. The highest value of joint probability determines the type of a structure landmark.
Because the distribution of feature value is unknown, this method uses the GMM model to approximate the distribution. GMM is a mixture model with a weighted sum of K component Gaussian densities, which can be used to fit any type of distribution in theory. The GMM can be formulated as:
where x is a D-dimensional continuous-valued data vector,
is a parameter set which can be defined as:
(i = 1, 2, …M),
represents the mixture weight which satisfy the constraint as:
is the component Gaussian densities function with the mean vector
and the covariance matrix
, which can be formulated as follows:
In order to use the complete GMM to fit the feature distribution, the parameter set
should be learned on the training phase. There are several techniques available to estimate the parameters of a GMM e.g., moment estimation, minimum
estimation, Bayesian estimation and maximum likelihood estimation [
38]. In this study, we use the maximum likelihood estimation (MLE) to find the model parameters which maximizes the likelihood of GMM given the training data. For sequence of training vectors
, the likelihood function of
can be represented as follows:
Because Equation (8) is a non-linear function of parameters λ and direct maximization is not possible. This method uses an expectation-maximization (EM) algorithm to solve this problem. Given an initial model λ, the basic idea of EM algorithm is to estimate a new mode , such that . The new model can then be implemented as an initial model for the next iteration. This process is repeated until some convergence threshold is reached.
On each EM iteration, the estimate of parameters can be represented as follows:
After serval iterations, the posteriori probability of feature vector
can be calculated as follows:
To recognize the type of structure landmark, the normalized feature vector
and
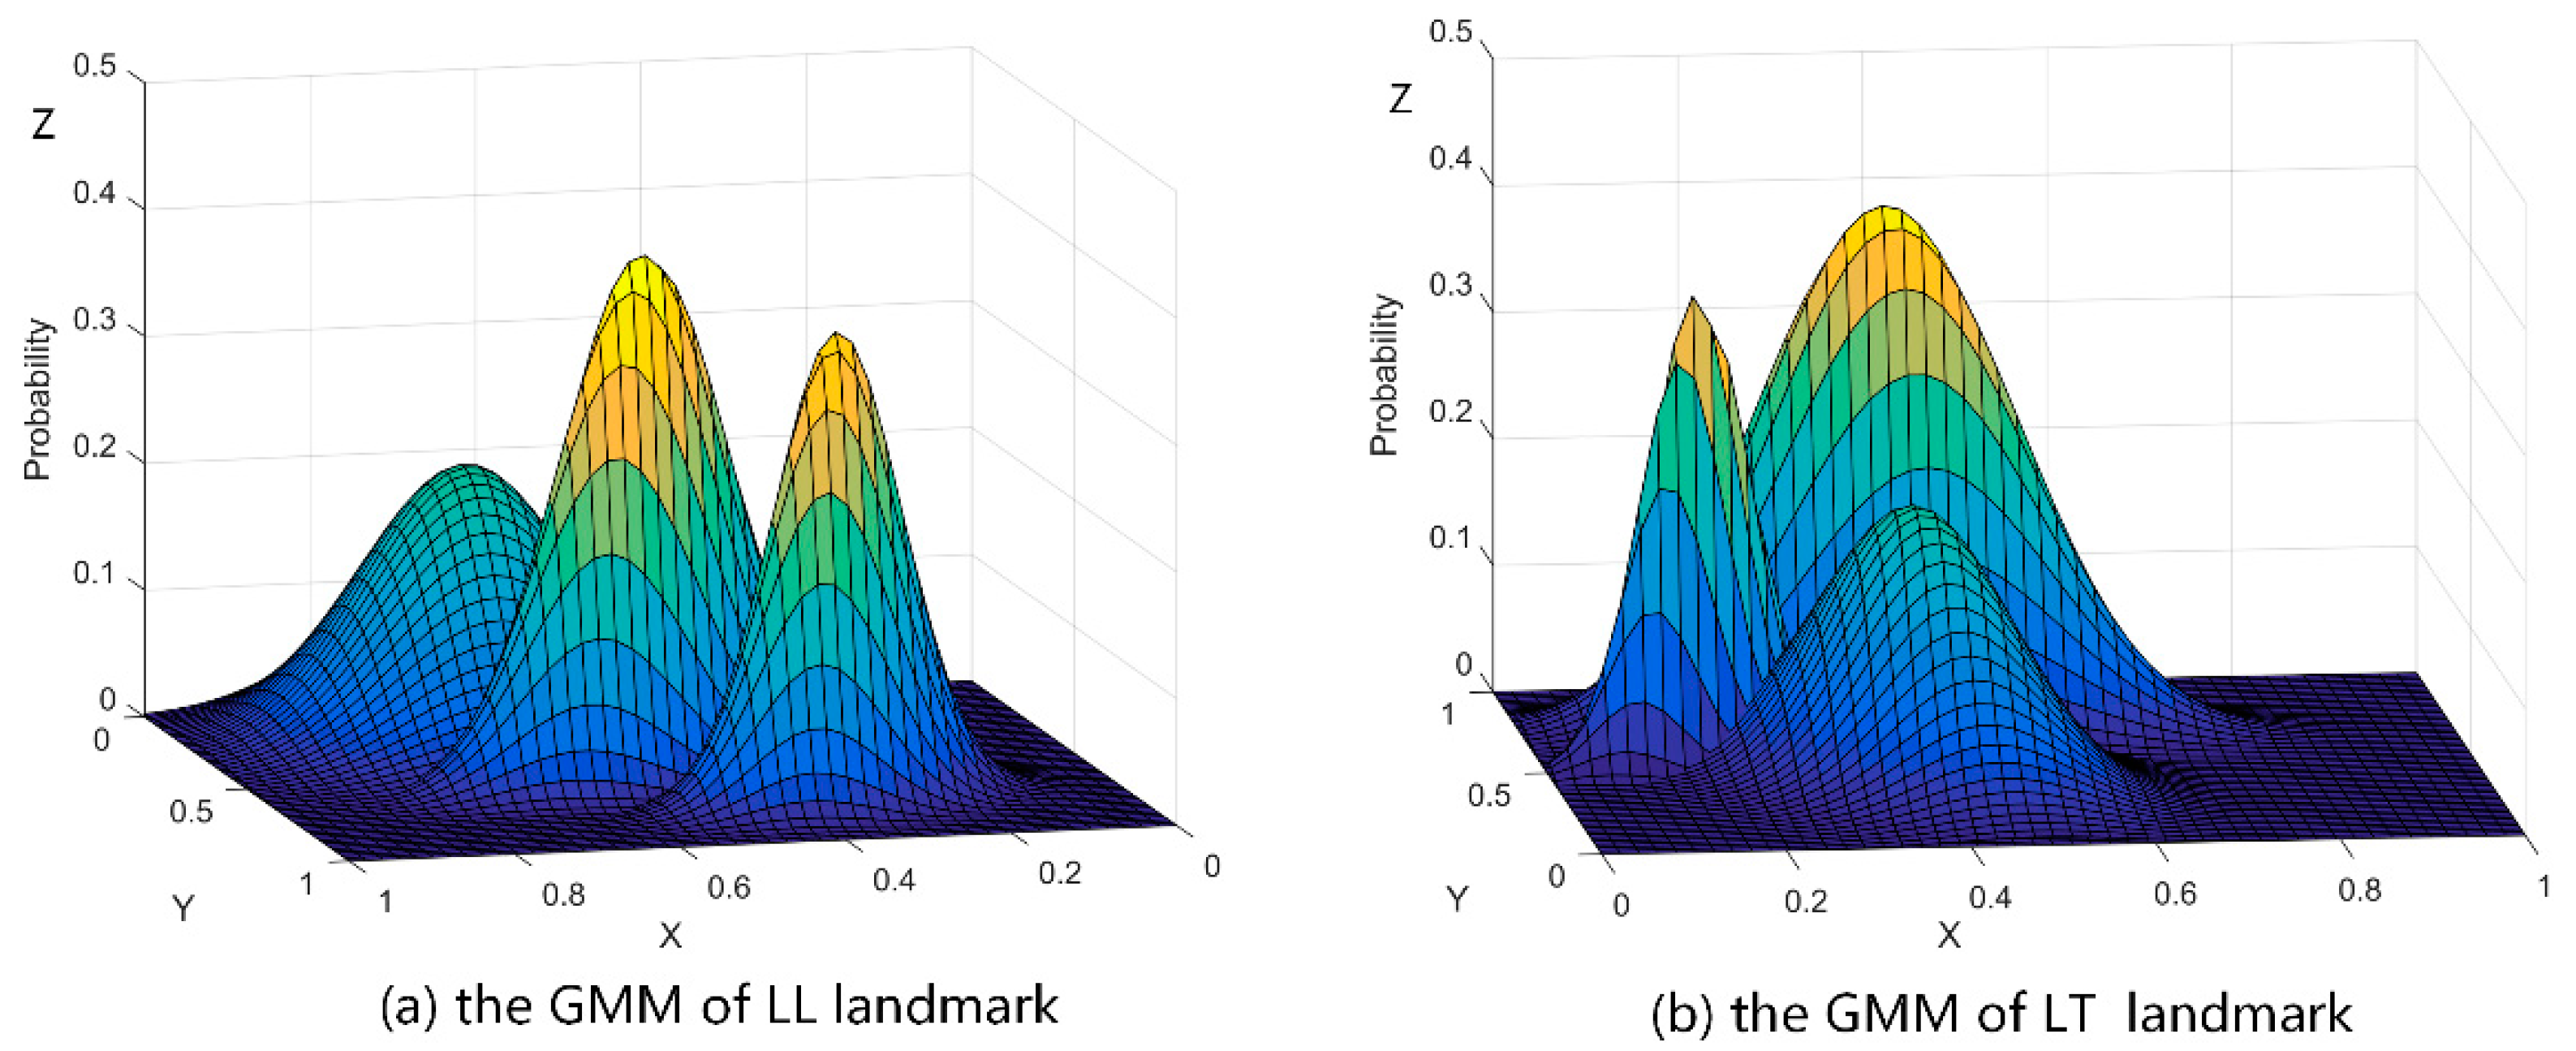
is used as an input of GMM. The number of Gaussian components is set to 3. The posteriori probability of each type of structure landmark can be calculated by using Equation (12).
Figure 4 shows the GMM result of LL and LT landmark, in which the
X-axis is the
value, the
Y-axis is the
value and the
Z-axis represents the posteriori probability.
2.2.3. Structure Landmark Recognition
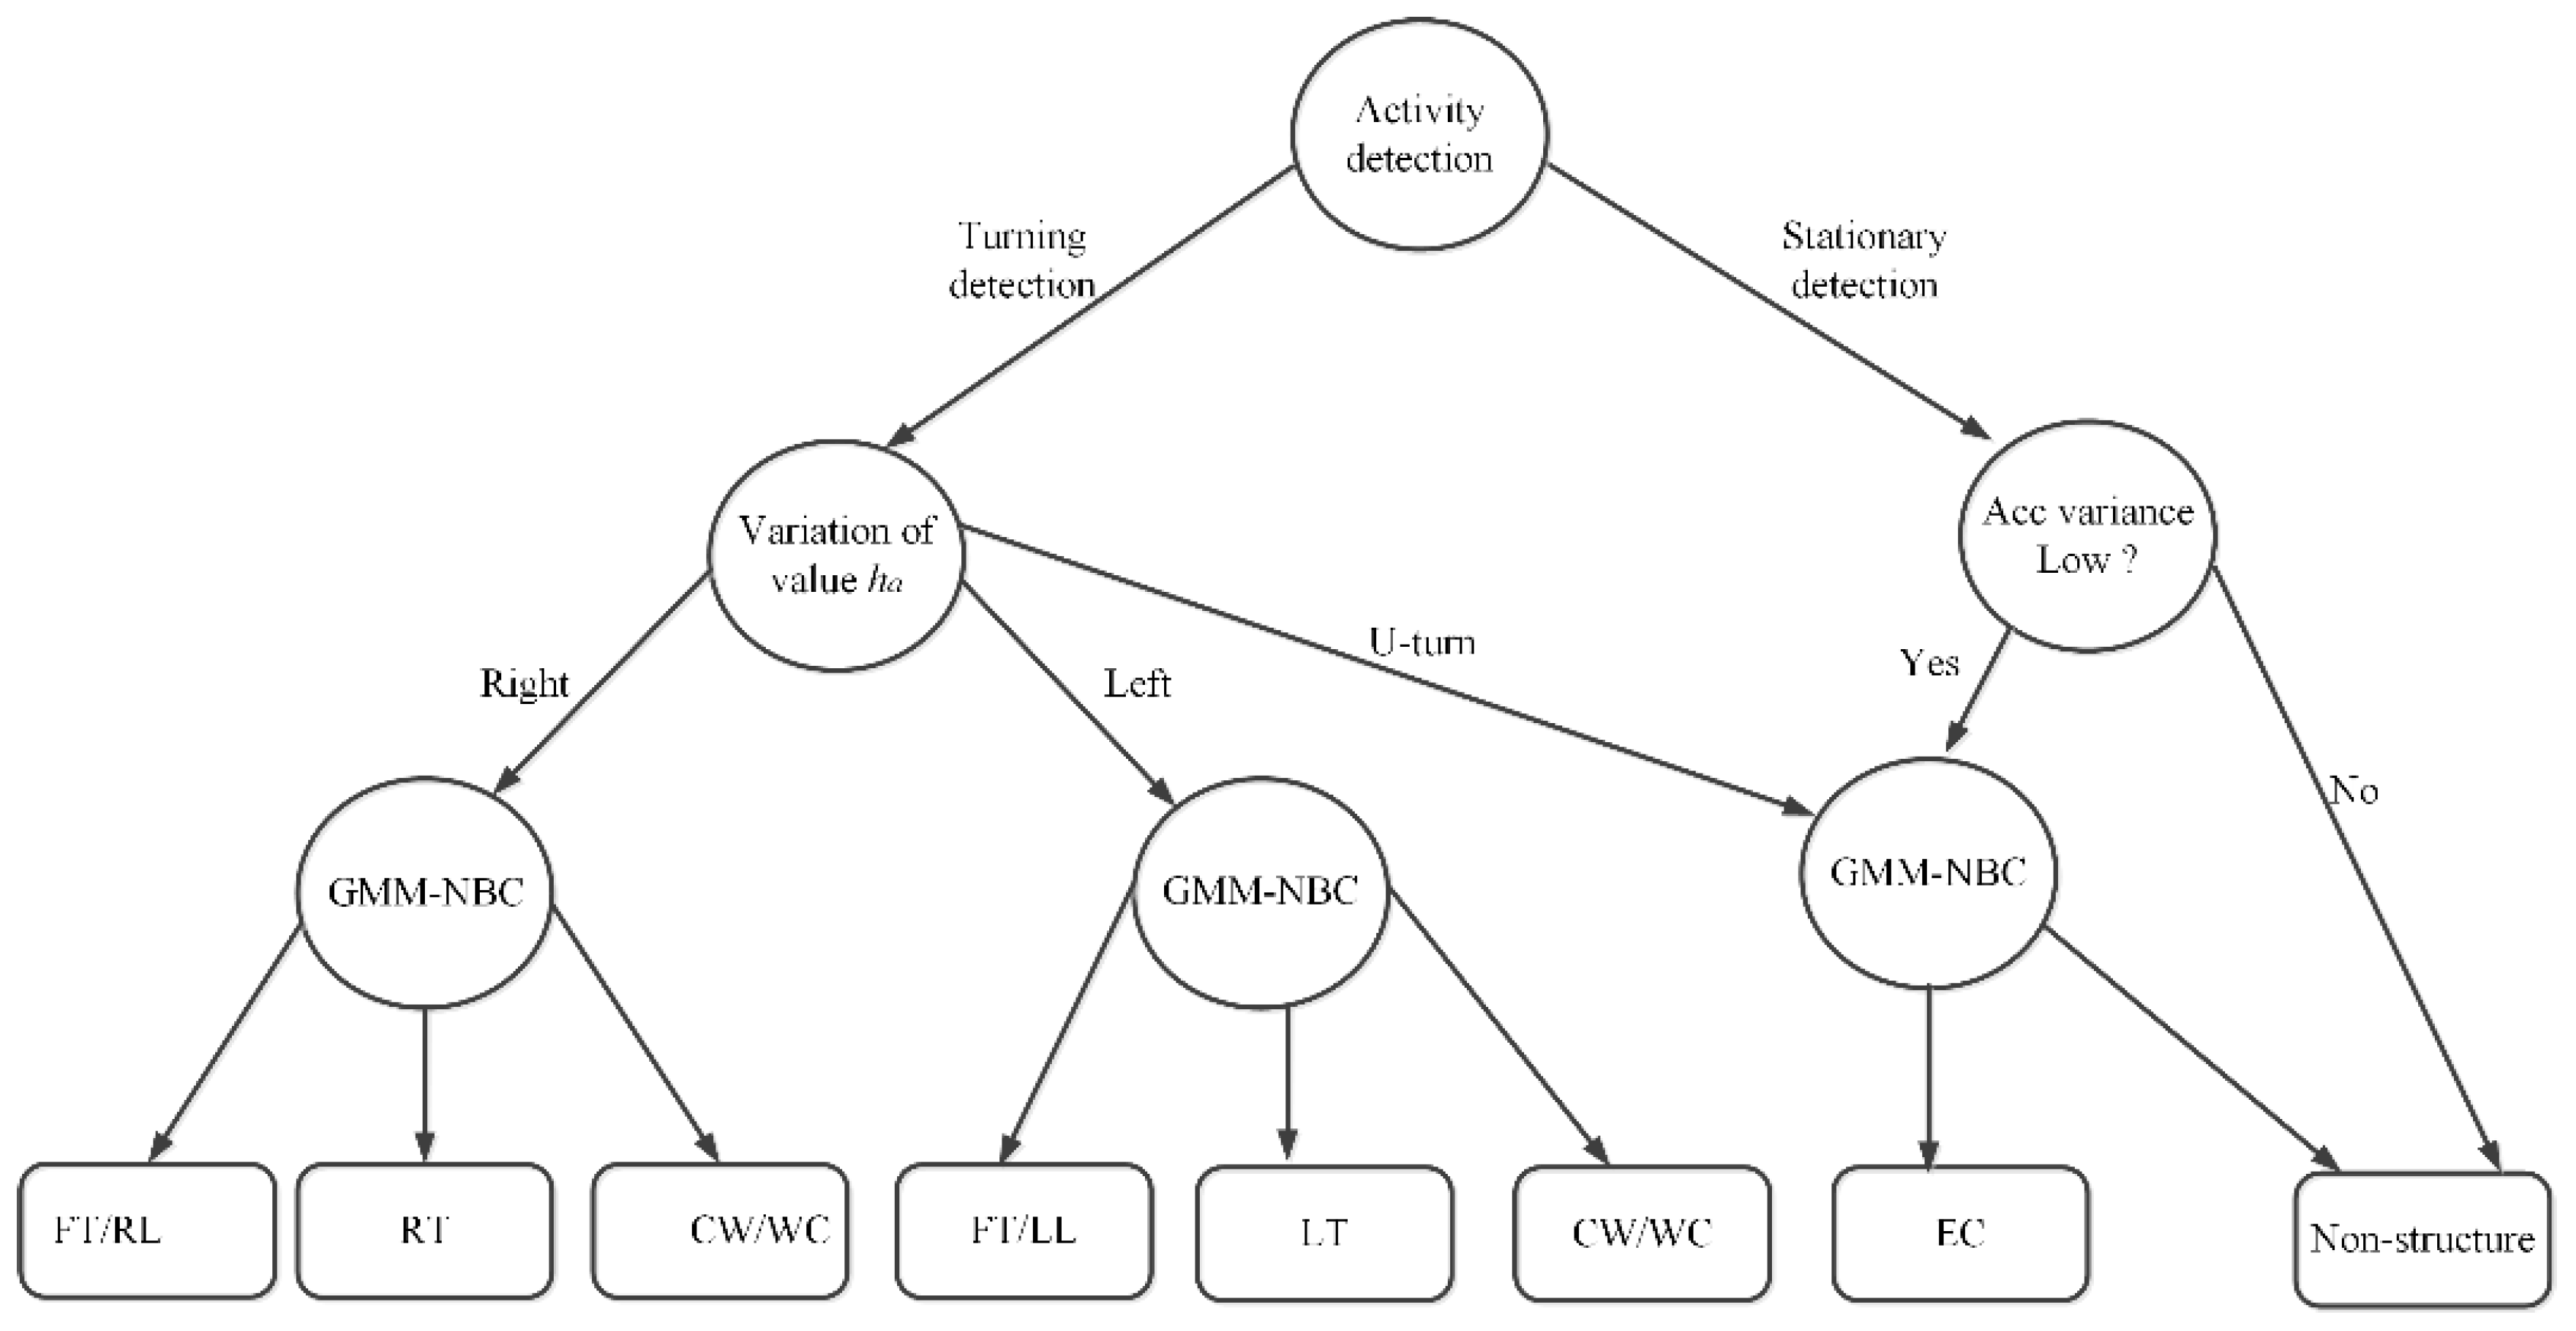
Based on the GMM-NBC model, this study uses a decision tree to identify the type of structure landmarks. When people walk in an indoor area, each encountered structure landmark reflects a specific signal pattern of inertial and visual features. Considering the randomness of pedestrian activity, this method uses inertial data to detect the activities related with turning or stopping. Later, the visual data is used to find whether the location of a walking activity happens at the location of a structure landmark. As shown in
Figure 5, a detected walking activity will trigger the module of structure landmark recognition. Firstly, we separate the motion state by using turning detection and stationary detection. A peak detection algorithm [
39] is implemented using gyroscope data, which can identify the orientation (left or right) and type (normal or U-turn) of a turning action. As recommend in [
40], the variance of acceleration is used to detect the stationary state of pedestrian, and the threshold is set to 0.25. The sum of rotation angle calculated from gyroscope is used to distinguish U-turn and normal turn, and the threshold is set to 135 degrees. Then, the variation of feature value
is used to separate the type of structure landmark into two categories. If the value of
is first increased and then decreased, the type of a landmark may fall in the scope of {FT; RT; RL; CW; WC}. If the value of
is first decreased and then increased, the type of a landmark may fall in the scope of {FT; LT; LL; CW; WC}.
Finally, the GMM-NBC model is used to further distinguish the type of structure landmark. A special case is to distinguish EC landmark and non-structure. Due to the randomness of turning activity, pedestrian may stop walking and make a turn at a non-structure location. We use the stationary detection and U-turn detection as a judgment condition. If the variance of acceleration is low and sum of rotation angle is higher than a threshold, EC landmark and non-structure location can be identified by using the GMM-NBC model. Another special case is that FT landmark is difficult to be accurately recognized. The reason is that when people make a right (or left) turn at a FT landmark, the visual information of scenes on the opposite side may not be collected by smartphone camera. The visual and inertial signal feature of FT landmark may be similar with RL or LL landmark. However, this potential incorrect recognition problem can be solved by the proposed landmark map matching algorithm. By matching a sequence of landmark (along a route) to the map, the influence of the incorrect landmark recognition results can be significantly reduced.
2.3. Structure Landmark Based Indoor Map Matching
The method proposed in
Section 2.2 can be used to recognize the type of structure landmark. However, for larger indoor environments, it is possible that many structure landmarks may share the same landmark type. In order to solve this problem, a Hidden Markov model based indoor map matching algorithm is designed to uniquely identify each landmark along a signal mapping route.
The core idea of HMM is to construct the relation between the observation and the hidden state by using the conditional stochastic probability. The main parameters of HMM include: {S, V, A, B, }, in which is the hidden state. is the observation. is the state transition probability between state and . is the emission probability which represent the probability when the observation in the state . is the initial state distribution of value {S, V, A, B}.
In this study, we define structure landmark as the hidden state of HMM. The type of landmark, e.g., FT landmark, is defined as the observation, which can be recognized by using the method proposed in
Section 2.2. The value of state transition probability
can be calculated based on the spatial adjacency relation among landmarks. The emission probability
of hidden state
is defined according to the confusion matrix of landmark recognition. To increase the practicability of the proposed method, the initial location of each route is assumed to be unknown. The initial state of distribution is uniform for all hidden state. The sum of transition probability and emission probability of each hidden state equals 1.
Figure 6 shows an example of calculating state transition probability and emission probability. Because landmark
is directly adjacent to
,
and
, the transition probability of
,
,
are defined as 1/3. For FT landmark (state
), different walking direction may lead to different identification result. Considering the existing of incorrect recognition results in confusion matrix, the emission probability of
is defined as:
where
,
,
,
,
represent the probability that
being recognized as LT, RT, LL, RL and FT landmark.
The aim of the map matching method is to find the absolute location of detected landmarks along a signal mapping route. After constructing the parameters of HMM, a Viterbi algorithm [
41] is used to search for the most probable sequence of hidden state. For most indoor environments, there are many structure landmarks that share the same landmark type. The result of traditional Viterbi algorithm converges slowly and may provide more than one candidate location. In this study, we use the spatial adjacency of landmarks and the absolute heading angle information to improve the convergence speed of Viterbi algorithm. The spatial adjacency relationship of two landmarks means they can be straightly accessed by each other without turning action. Absolute heading angle information can be obtained from smartphone sensor. The main steps of this map matching algorithm are shown as below:
- (1)
Initialization: For the first detected and recognized landmark, all landmarks in the map will be treated as its candidate locations if they are within the same landmark type. We define as the probability along a candidate path, at time t, which accounts for the observation in state .
- (2)
Induction: For subsequently recognized landmarks, calculating the probability
and
according to the transition probability
and emission probability
.
where
is the most probable location of observation
. If the value of
equals 0, the path will not be used as a candidate.
- (3)
Backtracking. When the last structure landmark has been detected, the algorithm can estimate the state of the observation and backtrack the state array based on the array of . The path with the highest value is selected as the result. If the number of candidate path is higher than 1, the heading angle along the route can be used to eliminate false matches.
2.4. Radio Map Construction
After landmark recognition and map matching, the location of a signal mapping route can be estimated. Later, sampling point from the route can be used to construct radio map for indoor localization. The location of each sampling point can be estimated by a pedestrian dead reckoning (PDR) algorithm using inertial data. A Low-pass Butter-worth filtering and peak detection algorithm [
42] is used to detect the steps from a recovered route. A frequency-based mode [
43] is implemented to estimate step length. The result of PDR can be described as follows:
where (
) is the coordinate of sampling point
,
and
are the step length and heading direction, respectively.
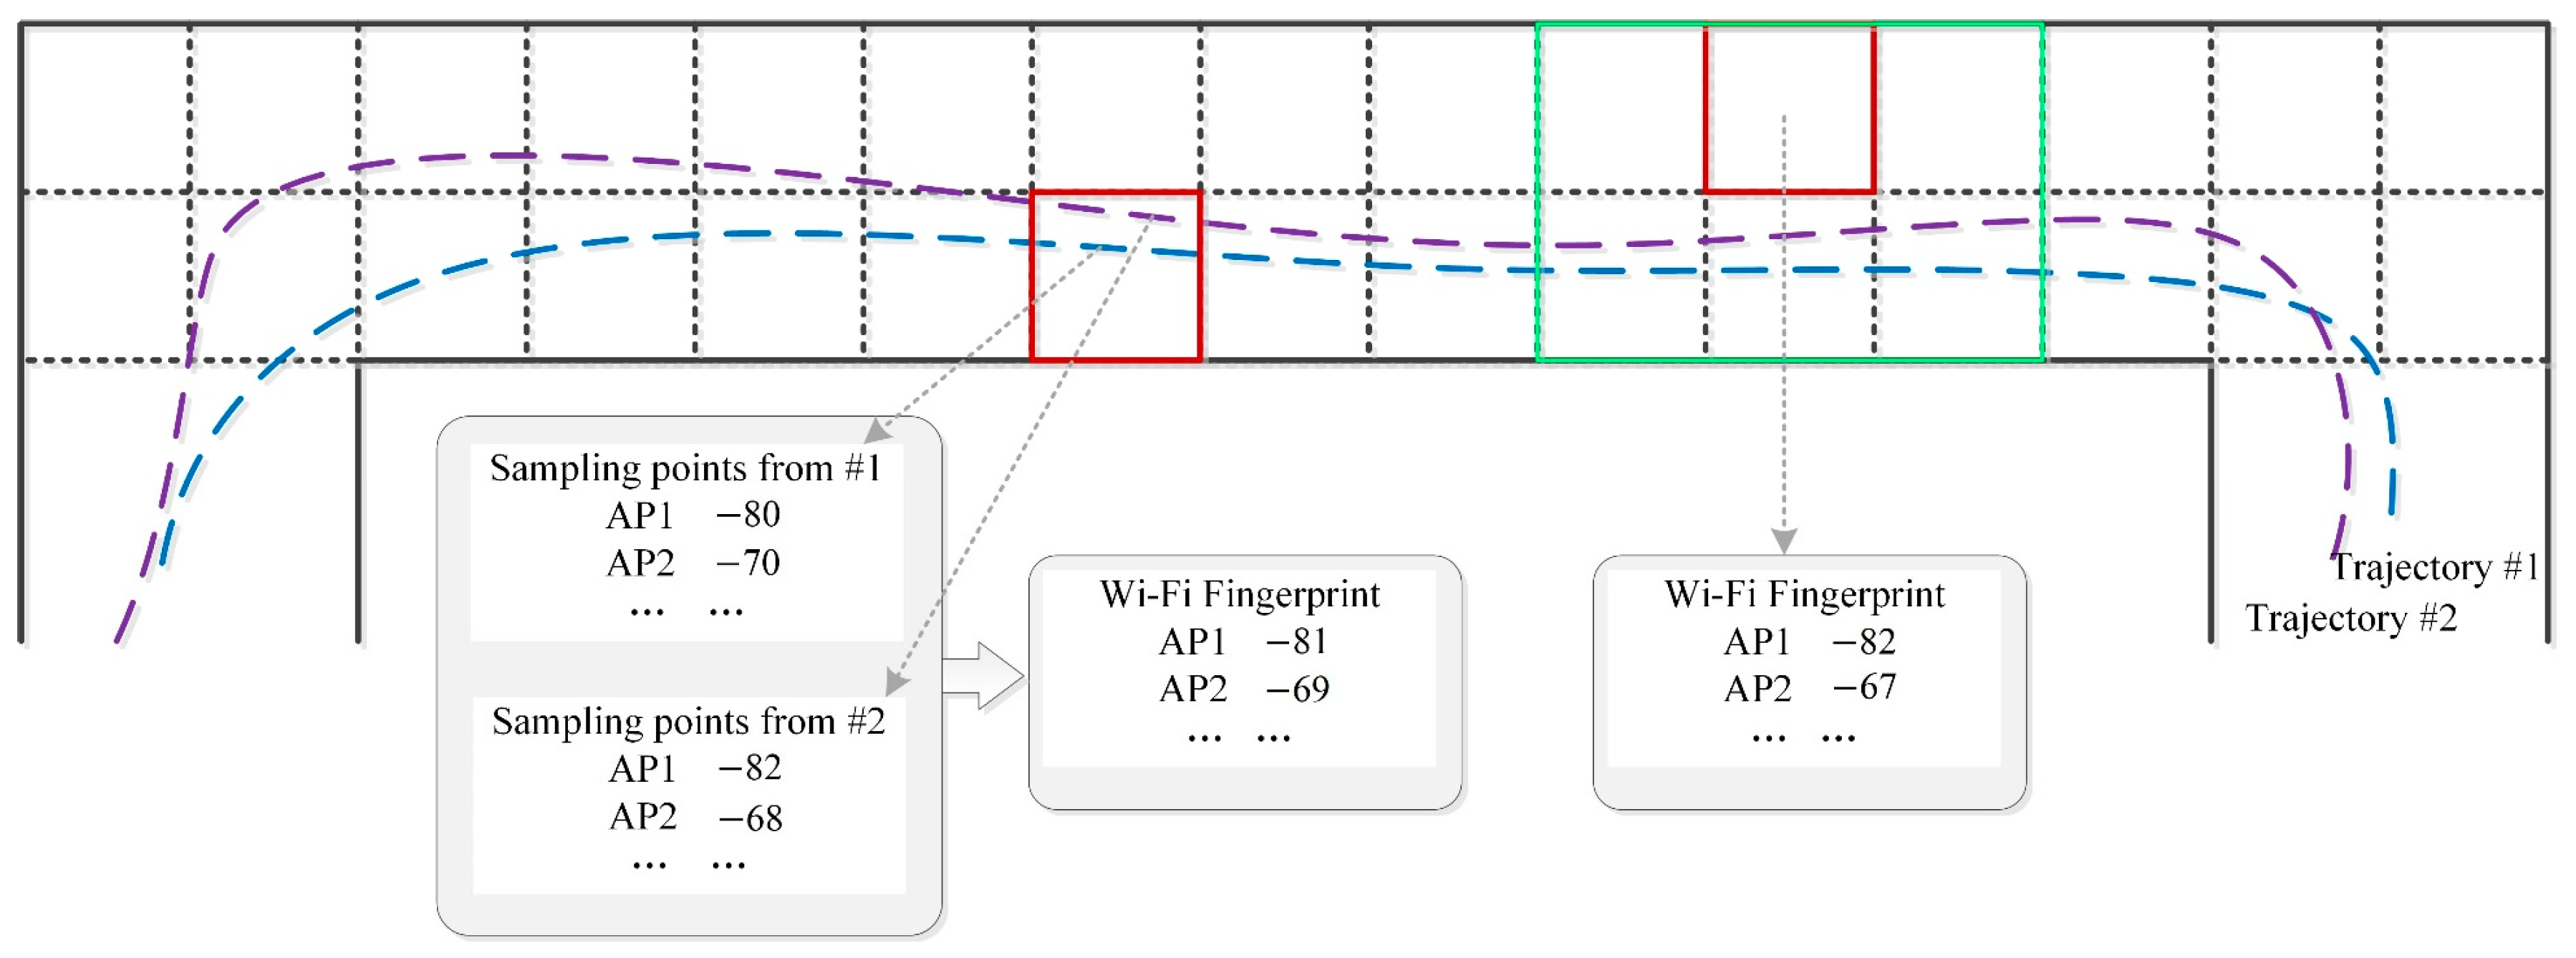
Each sample point from a mapping route is associated with Wi-Fi receive strength signal (RSS) data, which can be used to construct Wi-Fi fingerprints database (radio map). The attribute of sampling points for radio map construction is shown in
Table 1. For each sample point, the coordinates are calculated through proposed map matching method and PDR algorithm, the collected RSS data include the RSS value and its AP information. To construct a radio map, an indoor space is divided into regular grids. If a trajectory passes through a grid, the sampling points from the trajectory are extracted to generate the corresponding Wi-Fi fingerprint. As shown in
Figure 7, if m sampling points (maybe from different trajectories) are within the spatial extent of a grid, the RSS value of AP i in the grid can be calculated as:
where
is the value of AP i in the grid, G is the set of AP,
is the
of the k-th sampling point. If one grid does not have any sampling point in its spatial extent, the value of RSS should be calculated by using the RSS from its neighbor grids:
where
is the neighborhood grids of the current grid, j is the index of a grid,
is the weight function which inverse distance
.


