Article

Effects of Patent Policy on Outputs and Commercialization of Academic Patents in China: A Spatial Difference-in-Differences Analysis

Institute of Social Science Survey, Peking University, Beijing 100971, China
Sustainability 2021, 13(23), 13459; https://doi.org/10.3390/su132313459
Submission received: 27 October 2021 / Revised: 30 November 2021 / Accepted: 3 December 2021 / Published: 5 December 2021
(This article belongs to the Collection Technological Innovation and Economic Growth)

Abstract

:
The development of a difference-in-differences estimator is a new move in patent policy evaluation research. However, such an estimator neglects the possibility that academic patent activities follow a spatial autoregressive process with respect to the dependent variable. The objective of this study was to propose a spatial difference-in-differences estimator accounting for possible spatial spillover effects. In this study, an empirical analysis of a sample of 31 Chinese provinces from 2010 to 2019 indicates that an incentive patent policy has a positive impact on the output and commercialization of academic patents, with positive effects also spilling over into neighboring provinces. This study further found that incentive patent policies play a placebo role in academic patent activities. Provincial patent policies are merely a proxy for other variables that characterize the systemic differences between provinces that implement patent policies and those that do not. Therefore, the promotion of academic patent activities cannot be attributed to policy incentives.

1. Introduction

Technological progress is the eternal power and source of sustainable development [1]. The transformation of scientific and technological achievements, including patented technologies, integrates science and technology with the three major ecosystems of society, economy, and ecology and is a key link in the realization of economic transformation and sustainable development [2,3]. The effect of scientific and technological innovation on sustainable development is mainly reflected in the promotion of economic growth [4] and the evolution of social patterns [5], as well as the protection of the ecological environment and the conservation of resources [6], which has continuously promoted the sustainable development of the economy, society, and natural systems. In the entire national innovation system, universities occupy an important position [7]. Therefore, the innovation ability of universities is also an important aspect of research in the field of social sustainable development [8,9].
Universities promote the sustainable development of society through the commercialization of academic patents, which is also important for the sustainable development of universities themselves. Universities are a very important part of the innovation systems of various countries in the world, and academic patents are an important indicator of the scientific research strength and R&D capabilities of universities [10,11]. Universities are important bases for scientific and technological innovation, and the ultimate goal of university patent operations is to transform academic patents into actual productivity [12,13]. Therefore, many countries have enacted a series of patent policies to improve the output and commercialization of academic patents [14,15,16,17]. However, researchers have not yet reached a consensus on the impact of government patent incentive policies on academic patent activities [18,19,20].
In policy evaluation, the difference-in-differences approach adequately controls for the possible omission of significant variables correlated with academic patent activity [21,22]. The difference-in-differences estimator is a convenient way to deal with the omission of a latent constant spatial structure [23]. What is less clear in the policy evaluation, however, is what happens if spatial autocorrelation is generated by an autoregressive process over the dependent variable. In other words, theoretical and empirical investigations with the traditional difference-in-differences method have ignored the geographical proximity and spatial spillover effects of academic patent activities.
This study used provincial statistics to estimate the effects of patent policies on academic patent activities based on the specific characteristics of incentive patent policies implemented by China’s provincial governments. The two purposes of the patent incentive policies for universities are to increase the output of academic patents and to increase the degree of commercialization of academic patents [14]. Therefore, academic patent activities here include two aspects of activities: academic patent production and commercialization. Therefore, two questions need to be addressed:
Q1. What is the influence of patent policies on the output of academic patents?
Q2. What is the influence of patent policies on the commercialization of academic patents?
With the development of China’s economy, more and more attention is being paid to the protection of intellectual property rights. The central government and local governments have successively issued a series of patent policies aimed at improving the output and quality of patents and promoting the commercialization of patents [24]. China is now the country with the largest number of patent applications in the world each year. However, the commercialization of academic patents in universities is still relatively backward. The commercialization rate of academic patents in China is less than 5%, which is much lower than that of western developed countries. The low commercialization rate of academic patents is a common problem faced by developing countries [25]. Therefore, research on China will not only help to summarize China’s experience in patent development, but also help developing countries design and implement more effective patent incentive policies. In addition, the implementation of provincial patent incentive policies by Chinese provinces in different years is actually an important public policy experiment. This provides a good realistic basis for quasi-experimental research on patent policies.
This study will show how the spatial difference-in-differences model can be used to calculate three different treatment effects: treatment effects based on patent incentive policies, spillover effects within the treatment group, and spillover effects on the control group. This study found that an incentive patent policy has a positive impact on the output and commercialization of academic patents. However, the policy variable is likely to be an instrumental variable for the difference between provinces in the experimental group and the control group. Our results also confirmed the existence of spillovers both within and beyond the treated group. This research shall add value to the empirical application of the difference-in-differences method as well as the literature related to the promotion of patent activities.
Taking advantage of the time node differences in implementing incentive patent policies in different provinces and the interactions between neighboring provinces, this study used the spatial difference-in-differences model to identify the stimulating effects of patent policies. Section 2 introduces the development of provincial patent policy in China; Section 3 outlines the literature review and hypothesis development; Section 4 reports the data and methods; Section 5 presents the research results; and Section 6 outlines the discussion. The final section is the conclusion.

2. The Development of Provincial Patent Policy in China

After the central government of China issued the Outline of the National Intellectual Property Strategy in 2008, several provinces have introduced and implemented patent support policies on funding applications and patent creation, applications, protections, and management, which have promoted local scientific and technological progress and economic development. These provincial-level patent policies aim to promote patent creation, patent applications, patent management, patent services, and patent protection [14]. For example, in terms of promoting patent creation, some provinces provide incentives through direct grants to patent applicants, and in terms of patent applications, some provinces have encouraged commercial banks to increase credit for patented technology industrialization projects, and guarantee agencies to give priority to financing guarantees for patented technology industrialization projects. On this basis, in order to promote the commercialization of academic patents in local universities, some provinces have introduced and implemented patent policies on such matters as having relevant patents that have yielded economic benefits as an important criterion for conferring academic titles in universities.
Because provinces constitute different economic and social environments, their patent policies also differ [20]. For example, Zhejiang Province provides special subsidies ranging from CNY 5 to 10 million to key provincial patent innovation institutions listed in the training plan; in 2013, Shanghai provided special subsidies for patent work pilot units not exceeding CNY 400,000, and Hunan Province established a patent award of CNY 300,000. Local governments play an important role in promoting patent output and commercialization. Due to the differences in local governments’ patent policies, the effects of local patent policies on local patent output and commercialization will also be different. In addition, local patent policies are not static but need to be adjusted according to actual needs. For example, Beijing, Shanghai, and Tianjin have revised their local patent policies almost every two to three years. Therefore, the evaluation of the effects of local patent policies on patent output and transformation has become an important part of local patent management.
Since 2010, China’s patent output has continuously increased [24,26]. According to the China Science and Technology Statistical Yearbook 2020, the number of domestic patent applications increased from 140,339 in 2010 to 4,195,104 in 2019, while the number of domestic patents granted increased from 95,236 in 2010 to 2,474,406 in 2019. Over the same period, the patent activities of universities have also shown a vigorous development trend [27]. The number of patent applications from universities increased from 72,744 in 2010 to 340,685 in 2019, while the number of patents granted to universities increased from 37,490 in 2010 to 213,163 in 2019. However, whether the increase in local patent output is caused by local patent policies remains a matter of dispute.

3. Literature Review and Hypotheses

Academia has different opinions on the impact of patent policies on patent output. The mainstream view is that patent policies have a positive impact on patent output [20,28]. There is a positive relationship between the implemented patent subsidy policies and the number of patents [14], and public patenting-promoting policies contribute effectively to the motivation for regional utility patenting activities [29]. Similarly, patent policies such as government subsidies can encourage patent filings directly [24]. China’s patent policy is often regarded as an important factor driving the rapid increase in the number of patent filings [26]. In the United States, the Bayh–Dole Act significantly increased the number of university patents [17,18]. However, some studies show that patent policies have no significant impact on patent output [15,30,31]. Additionally, patent policies may have negative effects, as excessive protection policies decrease the pace of innovation [32]. Despite the above controversy, it is generally believed that public patenting-promoting policies will promote the output of academic patents [20,27]. The role of patent policy in promoting academic patent output has also been confirmed in Italy [33] and Germany [34].
Thus, we propose the following hypothesis:
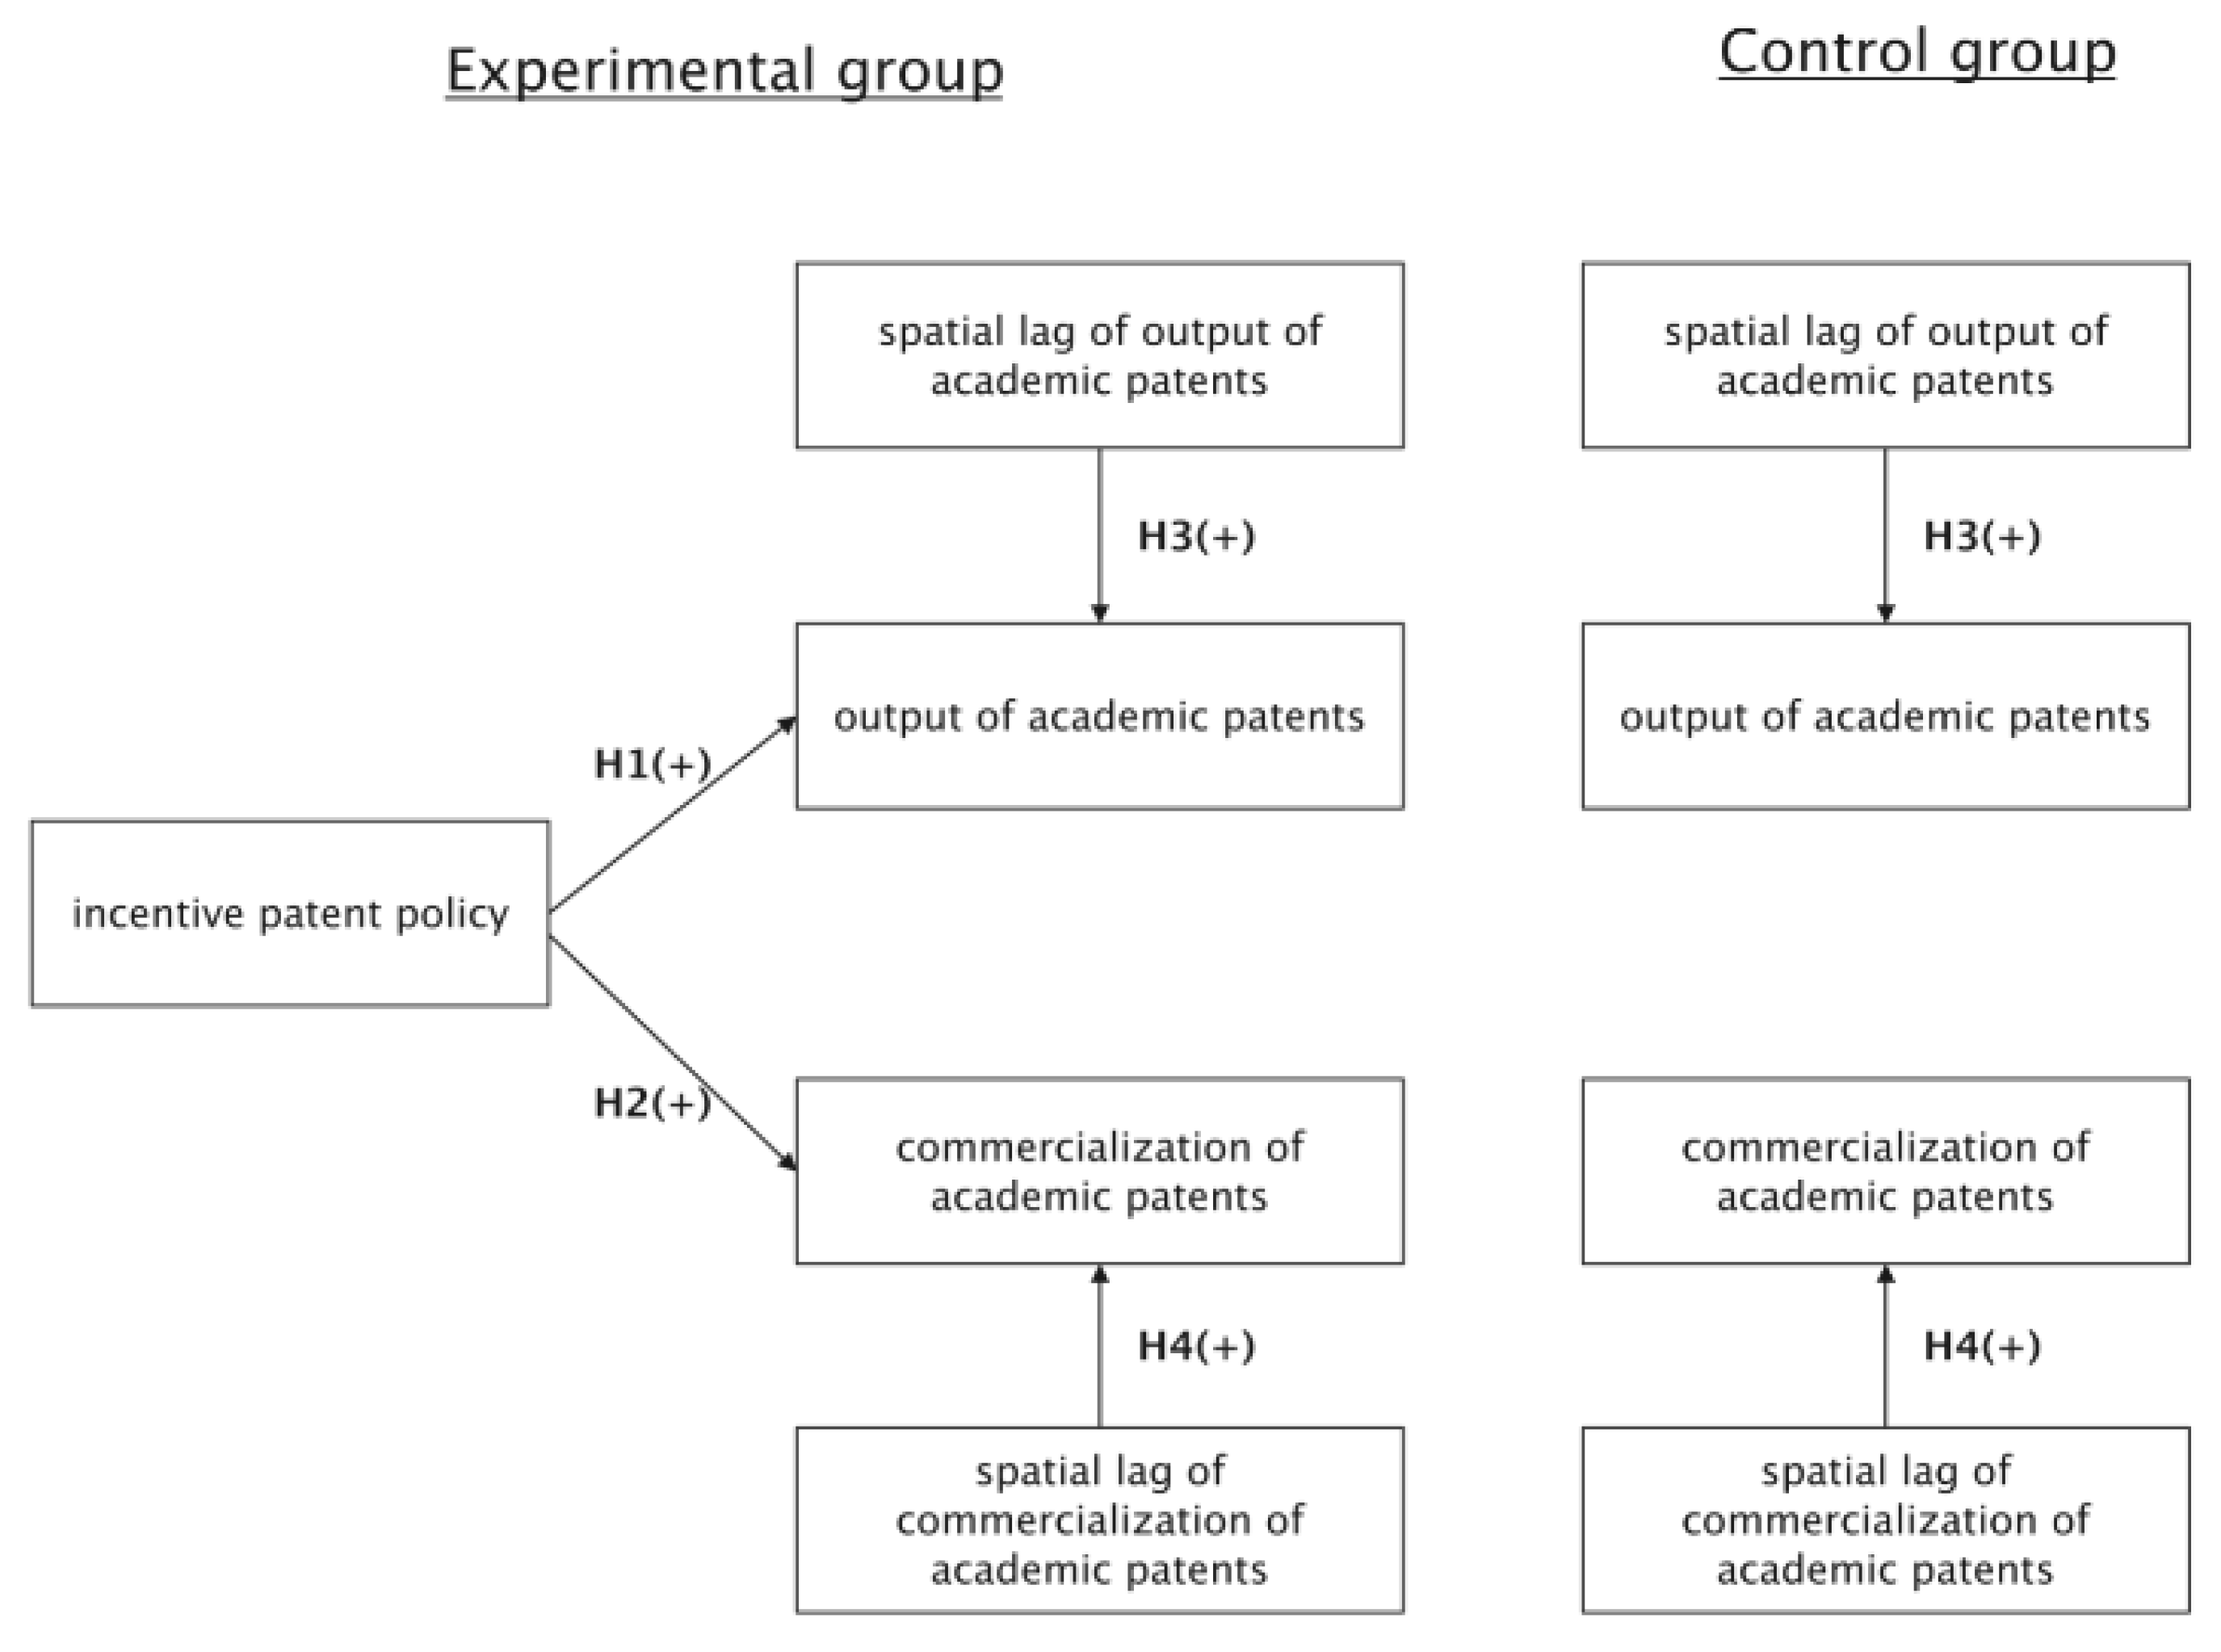
Hypothesis 1.
The incentive patent policy is positively related to the output of academic patents.
The impact of incentive patent policies on the commercialization of academic patents is also a concern of the government, academia, and industry. In the United States, the Bayh-Dole Act has greatly promoted the intellectual property work of American universities and accelerated the pace of commercialization of academic patents [35,36]. Patent policy is an important institutional factor affecting the commercialization of academic patents [33,37]. Regional patent policies also promote the commercialization of academic patents by university startups [38]. Some studies have pointed out that the impact of patent policy on the commercialization of academic patents is not significant [20,39]. The goal of the incentive patent policy is to promote the commercialization of academic patents. However, due to the varying situations in different countries and regions, there are differences in the effects of policies. It is generally believed that incentive patent policies have promoted the commercialization of academic patents to a certain extent.
Thus, we propose the following hypothesis:
Hypothesis 2.
The incentive patent policy is positively related to the commercialization of academic patents.
The geographic localization of knowledge spillovers is a central tenet in patent research [40,41,42]. The impact of patent activities often crosses political boundaries (such as national and provincial boundaries) and affects patent activities in neighboring regions [40]. Patent activities in universities not only have an impact on local development but also spread to neighboring areas [43]. Local governments in neighboring regions compete with each other to promote patent activities, leading to strategic interactions [44,45]. Neighboring local governments often learn from each other in policymaking, which leads to policy diffusion [46,47]. When the implementation of a patent policy in one place promotes the output and commercialization of academic patents, neighboring local governments will quickly imitate and establish similar patent policies, thereby promoting the output and commercialization of local academic patents. Therefore, academic patenting in universities often has positive spatial spillover effects. The academic patent activities of universities in one region will drive the academic patent activities of other neighboring regions. Thus, the following two hypotheses are proposed.
Hypothesis 3.
Academic patent output has a positive spatial spillover effect.
Hypothesis 4.
The commercialization of academic patents has a positive spatial spillover effect.
Figure 1 shows a graphical representation of the proposed theoretical model and the research hypotheses to be tested. The empirical test of the spatial spillover effect in Hypothesis 3 and Hypothesis 4 is mainly realized through the significance of the spatial lag term and the sign of the regression coefficient [48,49,50]. This analysis framework is set based on the spatial difference-in-differences model and can handle the following three different treatment effects: treatment effects based on patent incentive policies, spillover effects within the experimental group, and spillover effects on the control group.

4. Materials and Methods

4.1. Data

This study used panel data from 31 provinces (autonomous regions and municipalities directly under the central government) in mainland China from 2010 to 2019, with a sample size of 310. The data were obtained from the China Statistical Yearbook from 2011 to 2020, while data related to the commercialization of academic patents came from the Compilation of Science and Technology Statistics in Universities, compiled by the Science and Technology Department of the Ministry of Education of China, from 2011 to 2020. According to whether a significant provincial patent incentive policy was issued before 2019, 31 provinces across the country were divided into an experimental group and a control group. The experimental group comprised 17 provinces, including Beijing and Shanghai. The control group comprised 14 provinces, namely Hebei, Shanxi, Inner Mongolia, Heilongjiang, Jiangxi, Henan, Guangxi, Hainan, Guizhou, Yunnan, Tibet, Qinghai, Ningxia, and Xinjiang.

4.2. Variable Measurements

Explained variables: Although the number of patents has certain limitations in measuring innovation capabilities, such as the inability to distinguish the quality of innovative inventions, the number of patents is still an important indicator that is commonly used to measure patent output [51,52]. In this research, there were two explanatory variables. The first is the number of academic patents granted (NGP) in each province, a common indicator of the output of academic patents [53], while the second is the commercialization rate of academic patents (CAP), the number of academic patents sold divided by the number of patents granted to the university. In empirical research, using the commercialization rate instead of commercialization revenue to measure the degree of academic patent commercialization can effectively overcome the impact of the number of academic patents for more reasonable horizontal comparisons [16].
Explaining variables: There were four explanatory variables. GDP per capita is the most commonly used indicator of the degree of economic development [54,55]. Therefore, in terms of operational definition, GDP per capita (PGDP) is used as an indicator of the degree of regional economic development. Second, the number of universities (NCU) in a province is an important indicator of the level of local higher education development [56]. Third, the teacher/student ratio is used to measure the number of teachers for students [57]. Fourth, as enterprises above a designated size are generally large enterprises, the number of enterprises above the designated size (NIE) is an indicator of the scale of large industrial enterprises in a region. The composition and definitions of the relevant variables are summarized in Table 1.
The descriptive statistics of the variables are summarized in Table 2.
In addition, because of the need for policy evaluation, there is another key independent variable, the policy variable. The dimensions of the incentive patent policy at the provincial level in this article mainly comprise the patent grant award policy, patent application funding policy, annual patent fee reduction policy, and university patent promotion policy. The patent incentive policies issued by various provinces are generally comprehensive, including patent output incentive policies and patent commercialization incentive policies. In the same province, in different years, relevant patent policies are also revised and improved. This research used a quasi-natural experimental method. In this study, the year of the introduction and implementation of landmark major patent documents and policies at the provincial level is regarded as the beginning of a provincial patent policy experiment. For example, Sichuan, Shaanxi, Gansu, and Hunan introduced and implemented iconic patent incentive policies in 2012. Therefore, for these four provinces, 2012 is the launch year for the implementation of patent policy experiments.
The landmark incentive patent policies at the provincial level were collected using information retrieval through the legal database (Peking University Magic Weapons), provincial and National Patent Office website, and Baidu search engine. According to the time when each province implemented the incentive patent policy, a policy variable (DID) was constructed. To explore the strategic interactions between neighboring provinces, the latitude and longitude data of provincial capital cities were also used in this research.

4.3. Method

The difference-in-differences model is an effective means of evaluating the effects of specific policies and is one of the most popular approaches in economics and other disciplines of social sciences [58,59]. The main purpose of policy effect evaluation is to evaluate the changes in outcomes associated with a specific policy implementation [60]. Controlling background changes in outcomes that occur with time (e.g., secular trends affecting outcomes) is a prerequisite for the scientific evaluation of specific policies [61,62]. The difference-in-differences approach has been increasingly applied to address this problem [22,63]. However, while the traditional DID model assumes the spatial independence of observation objects [21,23], spatial autocorrelation is often observed in reality [64,65]. Therefore, it is necessary to include this spatial dependency in the DID method [66]. This spatial difference-in-differences approach can effectively investigate the spatial spillover effects of policies [67,68,69,70].
Strategic interactions exist between neighboring local governments, so they are spatially dependent on each other [71,72]. Local governments’ implementation of technology conversion encouragement policies will not only affect the commercialization of academic patents in the province but also the commercialization of academic patents in neighboring provinces. In previous research [66,70], spatial difference-in-differences models, including the spatial dependence between neighboring provinces, were used to accurately assess the impact of local government technology commercialization policies on the commercialization of academic patents. The model is as follows:
N G P i t = C + ρ W N G P i t + β 1 P G D P i t + β 2 N C U i t + β 3 T S R i t + β 4 N I E i t + β 5 D I D i t + ε i t , ε i t N ( 0 , σ 2 I n ) , i = 1 , , 31
C A P i t = C + ρ W C A P i t + β 1 P G D P i t + β 2 N C U i t + β 3 T S R i t + β 4 N I E i t + β 5 D I D i t + ε i t , ε i t N ( 0 , σ 2 I n ) ,   i = 1 , , 31
Here, D I D i t is a combined dummy variable, the product of the two dummy variables for the group and the patent policy of the local government, calculated as follows: D I D i t = ( D I D i t ( 1 ) D I D ¯ ( 1 ) ) × ( D I D i t ( 2 ) D I D ¯ ( 2 ) ) , where D I D i t ( 1 ) is a dummy variable for the group: D I D i t ( 1 ) = 1 , if it is the treated group province (implementing patent policies), and D I D i t ( 1 ) = 0 if it is not the treated group province; D I D i t ( 2 ) is a dummy variable used as a local patent policy: D I D i t ( 2 ) = 1 if it is from the year when the local patent policy was implemented and every year thereafter, and D I D i t ( 2 ) = 0 in the previous year; and D I D ¯ ( 1 ) and D I D ¯ ( 2 ) are the means of the series of two dummy variables, respectively. Moreover, W is the spatial weight matrix. The inverse-distance space weight matrix was used: W i j = 1 / d i j , where d i j is the distance from province i to province j .
According to Hypotheses 1 and 2, β 5 in Equations (1) and (2) should be significant and positive. In spatial econometrics, the spatial lag term is generally introduced to test the spatial spillover effects between neighboring regions [73,74]. When the regression coefficient of the spatial lag term of the target variable is significant and positive, there is a positive spatial spillover effect [51,52]. According to Hypotheses 3 and 4, ρ in Equations (1) and (2) should be significant and positive.

5. Results

5.1. Empirical Results

The regression results are shown in Table 3. In Models 1 and 2, NCG is the explained variable, which corresponds to Equation (1), while in Models 3 and 4, CAP is the explained variable, which corresponds to Equation (2). In addition, Models 1 and 3 are fixed-effects models, and Models 2 and 4 are random-effects models. In the empirical test, to control for the influence of the time factor, the relevant years were also entered into the model as the time variable.
Table 3 reports the effects of regional patent policies on local academic patenting and commercialization under the spatial difference-in-differences models. The Hausman test of Models 1 and 2 is significant (δ2 = 44.32, p = 0.001). The Hausman test of Models 3 and 4 is significant (δ2 = 31.62, p = 0.001). In both cases, the fixed-effects model is better than the random-effects model. Therefore, the fixed-effects models (Model 1 and Model 3) were mainly used in this research. At the same time, the random-effects model was used as a reference.
According to Table 3, in all four models, the regression coefficients of DID are significant and positive. This shows that the patent policies promulgated and implemented by local governments have an obvious promotion effect on the academic patenting of universities and the commercialization of academic patents. The regression coefficient of DID in Model 1 is 1592.831 and significant. Thus, Hypothesis 1 was confirmed. Similarly, the regression coefficient of DID in Model 3 is 4.394 and significant. Thus, Hypothesis 2 was confirmed. This shows that the patent policies implemented by the local government have a greater role in promoting academic patenting of universities than in promoting the commercialization of academic patents. This result is consistent with the research of Gong and Peng [20].
In the four models in Table 3, the regression coefficients ( ρ ) of the spatial lag of the independent variable are all significant and positive. This shows that the promulgation and implementation of patent policies by local governments have not only promoted the academic patenting of universities and the commercialization of academic patents in the province but have also had a spatial spillover effect, driving the academic patenting and commercialization of academic patents in neighboring provinces. In Model 1, ρ is 0.652 and significant, indicating that when the neighboring provinces increase the number of granted academic patents by an average of 1, the number of granted academic patents in the target province increases by 0.642. Thus, Hypothesis 3 was confirmed. In Model 3, ρ is 0.419 and significant, indicating that when the commercialization rate of academic patents by neighboring provinces increases by 1%, on average the commercialization rate of academic patents in the target province increases by 0.419%. Thus, Hypothesis 4 was confirmed. There are therefore strategic interactions between neighboring provinces; they are not independent of each other [71,72,75]. When a province implements a patent policy that promotes local academic patenting and the level of commercialization, neighboring provinces will imitate it and implement similar patent policies, which will promote local academic patenting and commercialization. To a certain extent, this spatial spillover effect stems from policy diffusion [76,77].
In addition, in Models 1 and 3, the regression coefficients of PGDP are both significant and positive. This shows that the more developed the local economy, the higher the degree of academic patenting and commercialization of universities. In Models 1 and 3, the regression coefficients of NCU are both significant and positive. This reflects the agglomeration effect of universities [78]. The spatial agglomeration of universities is beneficial for innovation and commercialization of academic patents. In Models 1 and 3, the regression coefficients of the TSR are both significant and positive. Generally, universities with relatively high teacher/student ratios are often research-oriented universities that focus on scientific research [79,80]. Therefore, they are more likely to produce academic patents and commercialize them [81]. In Models 1 and 3, the regression coefficients of the NIE are both significant and negative. Large industrial companies generally conduct independent research and development and rarely purchase patents from universities [82,83]. Therefore, they will have a restraining effect on academic patenting and commercialization. In Models 1 and 3, all the regression coefficients of the year dummy variables are significant, which shows that the time factor has been effectively controlled.
The provincial patent policy is designed to encourage local enterprises and universities to improve their intellectual property innovation and transformation capabilities, which has a direct impact on local academic patenting and commercialization [19]. At the same time, it will also have an indirect effect on the production and commercialization of academic patents, through such routes as increasing university funding and promoting industry–university cooperation [84,85]. In Table 3, the direct, indirect, and total effects of the patent policies are estimated. The results are summarized in Table 4.
According to Table 4, the direct and total effects of patent policies are both significant and positive. This is consistent with the results presented in Table 3. Provincial patent policies have a positive effect on the respective province’s academic patenting and commercialization. In terms of indirect effects, the indirect impact of the province’s patent policies on the number of granted academic patents in the province is positive and significant, also indicating indirect promotion of the production of academic patents in the province through other channels. However, Table 4 shows that the indirect impact of the patent policies implemented in a province on the commercialization of academic patents is not significant. This shows that the patent policies have limited ways of influencing the commercialization of local academic patents.

5.2. Placebo Test

The above empirical results show that the implementation of patent policies in the province has a stimulating effect on the output and commercialization of local academic patents. However, this stimulus effect may be due to the fact that patent policies are merely proxies for other variables that characterize the systemic differences between provinces that implement patent policies and those that do not. To this end, the following placebo test is needed: Assuming that the implementation time of the provincial patent policy is one year earlier or one year later, whether these virtual patent policy variables affect the output and commercialization of academic patents is examined. If the patent policy represents other variables that characterize the persistent differences between the two types of provinces, then the coefficient of this variable is statistically significant. Fixed-effects models were used here. The test results are provided in Table 5.
According to Table 5, in all four models, the regression coefficients of DID are significant and positive. By comparing Models 5 and 6 in Table 5 with Model 1 in Table 3, it can be seen that the regression coefficient values of DID are similar, and by comparing Models 7 and 8 in Table 5 with Model 1 in Table 3, it can be seen that the regression coefficient values of DID are similar. This shows that even if those provinces did not implement patent policies in these years, the local academic patent output and commercialization would be stronger. It can be seen that the implementation of patent policies in the province is not the fundamental factor promoting the output and commercialization of local academic patents but is merely a proxy for other variables. Provincial patent policies have a placebo effect on this process, hiding more than they reveal [86].
Nevertheless, the spatial spillover effect produced by the provincial patent policies is significant. In the four models in Table 5, the regression coefficients ( ρ ) of the spatial lag of the independent variable are all significant and positive. This shows that provincial patent policies will have a positive impact on neighboring provinces as well as a positive effect on local academic patent output and commercialization. When a province implements a patent policy, it is a signal to the neighboring provinces to implement similar policies to promote academic patent output and commercialization [87]. It appears that this signaling mechanism of provincial patent policies has considerable promise for generating novel and powerful insights into inter-provincial competition and interaction.

5.3. Robustness Test

One of the problems faced by this spatial difference-in-differences approach is whether the results of the regression change as the spatial weight matrix changes. If the regression results do not change significantly, this indicates that the results obtained by the regression are robust. In the robustness test in this study, the spatial inverse-distance contiguity weight was used in the form of the spatial inverse-distance contiguity matrix, a weighting matrix that contains the inverse distance for neighbors and 0 for others [48]. After replacing the spatial inverse-distance matrix with the spatial inverse-distance contiguity matrix, we estimated Models 1 and 3 in Table 3 again; the results are summarized in Table 6. Detailed results are presented in Appendix A.
Comparing Model 9 in Table 6 with Model 1 in Table 3, it can be seen that the regression coefficients of DID are positive, and the values are relatively close. In both models, the regression coefficients ( ρ ) of the spatial lag of the independent variable are significant and positive. Similarly, comparing Model 10 in Table 6 with Model 3 in Table 3, it can be seen that the regression coefficients of DID are positive and the values are relatively close. In both models, the regression coefficients ( ρ ) of the spatial lag of the independent variable are significant and positive. This shows that even if the spatial weight matrix is replaced, the main results in Table 3 are essentially unchanged.
In addition, the placebo test was performed again using the spatial inverse-distance contiguity weight matrix. The results are summarized in Table 7, and detailed results are presented in Appendix B. Comparing Table 7 and Table 5, we note that, except for the regression coefficients (ρ) of the spatial lag of the independent variable in Table 7 not being significant, Table 7 basically replicates Table 5. This shows that even if the spatial weight matrix is replaced, the placebo effect and spatial spillover effect still exist without much change. Therefore, on the whole, the conclusions of this study are relatively robust.

6. Discussion

6.1. Theoretical Implications

This research has important theoretical implications, including the following:
This research examined the impact of incentive patent policies on academic patent activities, effectively compensating for the deficiencies of existing research. The impact of incentive patent policies on academic patent activities has been controversial. Proponents of these policies believe that they promote the output and commercialization of academic patents [17,18,33]. Opponents of the policy believe that these policies have no obvious effect on academic patent output and commercialization and may even have a negative effect [15,31,39]. The focus of the above disputes is the empirical evidence on which they are based, and most of this evidence results from correlation tests rather than causality tests. This study found that the relationship between incentive patent policies and academic patent output is positive and significant, in line with previous research [17,18,20]. In addition, the relationship between incentive patent policies and the commercialization of academic patents is positive and significant. This result corroborates previous research [33,37]. Therefore, this research supports the views of these policy supporters.
However, this correlation does not necessarily mean that a causal relationship can be established between academic patent activities and incentive patent policies. This study further found that incentive patent policies appear to play a placebo role in academic patent activities. Provincial patent policies are merely proxies for other variables that characterize the systemic differences in patent policies between provinces. It can be seen that the correlation between the incentive patent policies and academic patent activities on which policy supporters are based hide more than they reveal [86]. Therefore, this research supports the views of policy opponents [15,31,39]. In fact, the theoretical contribution of this study does not lie in the party it supports, but in testing whether there is a causal relationship between the policy and academic patent activities. This is the key to evaluating the policy effects. The existence of the placebo effect of incentive patent policies can effectively expand the theory of patent policy evaluation, which helps consolidate the scientific foundation of patent policy evaluation.
In addition, this study reveals the spatial spillover effect of academic patent activities. If a province implements incentive patent policies to improve academic patent activities, this will have a positive spillover to neighboring provinces, causing them to imitate these policies and promote academic patent activities. This positive spatial spillover effect may come from policy imitation between local governments [88], geographic proximity [40,41,42], regional competition [44,45,89], and policy learning [46,47]. This shows that neighboring local governments have strategic interactions with each other to promote academic patent activities. Therefore, when evaluating the effects of patent policies, it is not appropriate to independently evaluate the effectiveness of local governance, but rather a comprehensive evaluation from a regional perspective should be conducted.
In terms of empirical research methods, the traditional difference-in-differences model can only deal with one type of treatment effect, which is the policy treatment effect [22,23,59]. This study introduces spatial autocorrelation into the traditional difference-in-differences model, so it can deal with spillover effects in quasi-natural experiments. This is an important expansion and breakthrough for the traditional difference-in-differences method. This spatial difference-in-differences method can be applied to other contexts, such as air pollution policy evaluation and regional child education subsidy policy evaluation. As long as it is possible that there are both policy treatment effects and spatial spillover effects, this method can be used to carry out quasi-natural experimental research.
In addition to policy evaluation, this research also analyzed the factors affecting the output and commercialization of regional academic patents, finding that the regional economic development level, number of universities, and teacher/student ratio have positive impacts on the output and commercialization of academic patents, while the relationship between the number of regional large-scale enterprises and academic patent activities is negative. Regional academic patent output and commercialization activities are embedded in regional economic, educational, and industrial systems. This is consistent with the prediction of the social embeddedness theory [89,90]. Research on academic patent activities based on the social nesting perspective effectively expands the scope of traditional academic patent theories [20,33,37,39], helping reveal the antecedents of academic patent output and commercialization.

6.2. Managerial and Policy Implications

This study has strong managerial and policy implications. First, when the government introduces and implements incentive patent policies, it must master the internal laws of academic patent activities of universities and design and implement targeted patent policies in order to achieve the expected results. Second, the effectiveness of the incentive patent policy system depends not only on the static system but also on the entire policy process and even more so on the policy environment. Therefore, to improve policy effectiveness, it is necessary to improve supporting measures such as taxation and finance by promoting the coordination of different elements in the entire patent policy system. Third, when formulating and implementing incentive patent policies, it is necessary to strengthen inter-provincial cooperation and coordination, promote inter-provincial spillover and reciprocity, and jointly improve regional academic patent output and commercialization.

7. Conclusions

Based on data from 31 provinces of China from 2010 to 2019, a spatial difference-in-differences approach was adopted in this study to investigate the impact of incentive patent policy on academic patent output and commercialization in China, showing that incentive patent policies are positively related to academic patent output and commercialization. However, due to the placebo effect, the promotion of academic patent activities cannot be simply attributed to incentive patent policies. In addition, this study shows that there is a positive spatial spillover effect in the academic patent activities of neighboring provinces. The current study has certain limitations. While it used provincial-level data, city-level or county-level data might be used in the future. Research at the university level is also an important research direction for the future. If relevant data at the university level are available, the impact of policies such as the technology transfer office on the output and commercialization of academic patents can be tested, as well as the impact of the size of the engineering and technology department in the university. Current research lacks cross-provincial commercialization data of academic patents. In the future, relevant information can be collected through surveys to investigate the cross-provincial commercialization of academic patents. Moreover, the current study is limited to China, and there is no international comparison. In the future, comparative studies with other countries should be conducted. In this study, the patent policy does not distinguish between patent output incentive policies and patent commercialization incentive policies. In the future, patent policies can be further subdivided to distinguish the effects of the above two different patent policies on academic patent activities. Finally, this study did not involve the quality of patents. In the future, variables that measure patent quality can be introduced to study the impact of patent incentive policies on patent quality. These new research directions will help to further verify the main research results of this research and yield richer research innovations in the future.

Funding

The author disclosed receipt of the following financial support for the research, authorship, and/or publication of this article: This research is funded by the National Social Science Foundation of China (17BSH122).

Institutional Review Board Statement

Not applicable.

Informed Consent Statement

Not applicable.

Data Availability Statement

The data presented in this study are available on request from the corresponding author.

Acknowledgments

The author gratefully acknowledges the Social Science Foundation of China (17BSH122) for the support of this research. The author would like to express thanks to the editor and anonymous reviewers for their insightful comments and suggestions.

Conflicts of Interest

The author declared no potential conflict of interest with respect to the research, authorship, or publication of this article.

Appendix A. Results of Estimation and Robustness Test from 2010 to 2017

Table A1. Results of empirical estimation.
NGPCAP
Model 9Model 10
Fixed-EffectsFixed-Effects
PGDP81.675 *** (6.08)0.04 (1.39)
NCU198.492 *** (8.69)0.209 *** (4.22)
TSR109,027.4 *** (3.65)240.003 *** (3.79)
NIE−71.343 ** (−2.55)−0.127 ** (−2.13)
DID1335.697 ** (1.98)4.19 *** (2.91)
Year
2011−799.032 ** (−2.47)−2.676 *** (−3.81)
2012−908.811 *** (−2.66)−4.111 *** (−5.41)
2013−1379.384 *** (−3.78)−5.103 *** (−6.25)
2014−1824.466 *** (−4.64)−5.99 *** (−6.7)
2015−1479.94 *** (−3.4)−6.654 *** (−6.81)
2016−1551.978 *** (−3.18)−6.71 *** (−6.35)
2017−1889.571 *** (−3.43)−6.878 *** (−5.91)
2018−2105.03 *** (−3.38)−7.363 *** (−5.67)
2019−2031.186 *** (−2.89)−6.633 *** (−4.62)
_cons
ρ0.457 *** (8.5)0.325 *** (3.4)
Sigma_e1143.2742.435
Log likelihood−2365.264−646.419
Wald chi21062.18 ***179.34 ***
Pseudo R20.360.076
Wald test of spatial terms72.32 ***11.54 **
Note: *, **, and *** are significant at 0.1, 0.05, and 0.001, respectively.

Appendix B

Table A2. Results of placebo tests.
NGPCAP
Model 11Model 12Model 13Model 14
1 Year Earlier1 Year Later1 Year Earlier1 Year Later
PGDP82.027 *** (6.09)82.124 *** (6.13)0.041 (1.43)0.041 (1.43)
NCU199.759 *** (8.72)197.899 *** (8.67)0.212 *** (4.26)0.21 *** (4.23)
TSR106,702.4 *** (3.57)109,446.8 *** (3.67)232.4 *** (3.66)240.694 *** (3.8)
NIE−73.633 *** (−2.63)−68.646 ** (−2.45)−0.133 ** (−2.23)−0.122 ** (−2.03)
DID1156.851 (1.47)1383.757 ** (2.2)4.313 *** (2.57)3.692 *** (2.76)
Year
2011−861.139 *** (−2.64)−769.299 ** (−2.38)−2.915 *** (−4.09)−2.578 *** (−3.66)
2012−946.946 *** (−2.72)−822.964 ** (−2.43)−4.311 *** (−5.54)−3.815 ** (−5.06)
2013−1359.85 *** (−3.7)−1318.562 *** (−3.66)−5.125 *** (−6.21)−4.842 *** (−6.02)
2014−1841.402 *** (−4.6)−1825.342 *** (−4.66)−6.151 *** (−6.72)−5.885 *** (−6.62)
2015−1462.864 *** (−3.33)−1441.003 *** (−3.34)−6.707 *** (−6.76)−6.422 *** (−6.66)
2016−1540.6 *** (−3.13)−1552.708 ** (−3.2)−6.774 *** (−6.32)−6.592 *** (−6.27)
2017−1883.072 *** (−3.39)−1890.709 *** (−3.44)−6.95 *** (−5.9)−6.773 *** (−5.84)
2018−2103.322 *** (−3.36)−2107.435 *** (−3.39)−7.448 *** (−5.67)−7.264 *** (−5.6)
2019−2037.11 *** (−2.88)−2033.422 *** (−2.9)−6.731 *** (−4.65)−6.551 *** (−4.57)
ρ0.459 *** (8.52)0.455 *** (−8.48)0.315 *** (3.27)0.34 *** (3.59)
Sigma_e1146.6091182.6732.4442.436
Log likelihood−2375.575−2364.803−647.327−646.844
Wald chi21054.31 ***1066.33 ***176.11 ***178.36 ***
Pseudo R20.3580.360.0770.077
Wald test of spatial terms72.66 ***71.89 ***10.71 ***12.89 ***
Note: **, and *** are significant at 0.05, and 0.001, respectively.

References

  1. Binswanger, M. Technological progress and sustainable development: What about the rebound effect? Ecol. Econ. 2001, 36, 119–132. [Google Scholar] [CrossRef]
  2. Cimoli, M.; Dosi, G.; Maskus, K.E.; Okediji, R.L.; Reichman, J.H.; Stiglitz, J.E. Intellectual Property Rights: Legal and Economic Challenges for Development; Oxford University Press: Oxford, UK, 2014. [Google Scholar]
  3. Eppinger, E.; Jain, A.; Vimalnath, P.; Gurtoo, A.; Tietze, F.; Chea, R.H. Sustainability transitions in manufacturing: The role of intellectual property. Curr. Opin. Environ. Sustain. 2021, 49, 118–126. [Google Scholar] [CrossRef]
  4. Yi, S.; Xiao-Li, A. Application of threshold regression analysis to study the impact of regional technological innovation level on sustainable development. Renew. Sustain. Energy Rev. 2018, 89, 27–32. [Google Scholar] [CrossRef]
  5. Calabrese, A.; Costa, R.; Ghiron, N.L.; Tiburzi, L.; Pedersen, E. How sustainable-orientated service innovation strategies are contributing to the sustainable development goals. Technol. Forecast. Soc. Chang. 2021, 169, 120816. [Google Scholar] [CrossRef]
  6. Yang, B.; Jahanger, A.; Ali, M. Remittance inflows affect the ecological footprint in BICS countries: Do technological innovation and financial development matter? Environ. Sci. Pollut. Res. 2021, 28, 23482–23500. [Google Scholar] [CrossRef]
  7. Gokhberg, L.; Kuznetsova, T.; Zaichenko, S. Russia: Universities in the Context of Reforming the National Innovation System. In Universities in Transition: The Changing Role and Challenges for Academic Institutions; Göransson, B., Brundenius, C., Eds.; Springer: Cham, Switzerland, 2011; pp. 247–260. [Google Scholar]
  8. Richards, C.; Shahbazim, M. Universities as innovation systems: A crucial key to sustainable national innovation policies and capacity building in Malaysia and elsewhere? Front. Plant Sci. 2013, 4, 75. [Google Scholar]
  9. Omrcen, E.; Lundgren, U.; Dalbro, M. Universities as role models for sustainability: A case study on implementation of University of Gothenburg climate strategy, results and experiences from 2011 to 2015. Int. J. Innov. Sustain. Dev. 2018, 12, 156–182. [Google Scholar] [CrossRef]
  10. Mowery, D.C. Nanotechnology and the US national innovation system: Continuity and change. J. Technol. Transf. 2011, 36, 697–711. [Google Scholar] [CrossRef] [Green Version]
  11. Kang, B.; Motohashi, K. Academic contribution to industrial innovation by funding type. Scientometrics 2020, 124, 169–193. [Google Scholar] [CrossRef]
  12. Huang, W.L.; Feeney, M.K.; Welch, E.W. Organizational and individual determinants of patent production of academic scientists and engineers in the United States. Sci. Public Policy 2011, 38, 843–870. [Google Scholar] [CrossRef]
  13. Burg, E.V.; Du, J.; Kers, G. When do academics patent outside their university? An in-depth case study. Technovation 2021, 107, 102287. [Google Scholar] [CrossRef]
  14. Lin, J.; Wu, H.-M.; Wu, H. Could government lead the way? Evaluation of China’s patent subsidy policy on patent quality. China Econ. Rev. 2021, 69, 101663. [Google Scholar] [CrossRef]
  15. Mezzanotti, F.; Simcoe, T. Patent policy and American innovation after eBay: An empirical examination. Res. Policy 2019, 48, 1271–1281. [Google Scholar] [CrossRef]
  16. Meyer, M.S.; Tang, P. Exploring the “value” of academic patents: IP management practices in UK universities and their implications for Third-Stream indicators. Scientometrics 2007, 70, 415–440. [Google Scholar] [CrossRef]
  17. Gores, T.; Link, A.N. The Globalization of the Bayh–Dole Act. Ann. Sci. Technol. Policy 2021, 5, 1–90. [Google Scholar] [CrossRef]
  18. Link, A.N.; Hasselt, M.V. On the Transfer of Technology from Universities: The Impact of the Bayh-Dole Act of 1980 on the Institutionalization of University Research. Eur. Econ. Rev. 2019, 119, 472–481. [Google Scholar] [CrossRef]
  19. Geuna, A.; Rossi, F. Changes to university IPR regulations in Europe and the impact on academic patenting. Res. Policy 2011, 40, 1068–1076. [Google Scholar] [CrossRef] [Green Version]
  20. Gong, H.; Peng, S. Effects of patent policy on innovation outputs and commercialization: Evidence from universities in China. Scientometrics 2018, 117, 687–703. [Google Scholar] [CrossRef]
  21. Callaway, B.; Li, T.; Oka, T. Quantile treatment effects in difference in differences models under dependence restrictions and with only two time periods. J. Econom. 2018, 206, 395–413. [Google Scholar] [CrossRef] [Green Version]
  22. O’Neill, S.; Kreif, N.; Grieve, R.; Sutton, M.; Sekhon, J.S. Estimating causal effects: Considering three alternatives to difference-in-differences estimation. Health Serv. Outcomes Res. Methodol. 2016, 16, 1–21. [Google Scholar] [CrossRef]
  23. Bonhomme, S.; Sauder, U. Recovering Distributions in Difference-in-Differences Models: A Comparison of Selective and Comprehensive Schooling. Rev. Econ. Stat. 2011, 93, 479–494. [Google Scholar] [CrossRef]
  24. Eberhardt, M.; Helmers, C.; Yu, Z. What can explain the Chinese patent explosion? Oxf. Econ. Pap. 2017, 69, 239–262. [Google Scholar] [CrossRef]
  25. Amorim, R.; Souza, C. Technology transfer in Brazil: A study of contracts for the exploitation of patents registered by the Brazilian Patent Office, 2001–2006. Inf. Dev. 2011, 27, 46–57. [Google Scholar] [CrossRef]
  26. Li, X. Behind the recent surge of Chinese patenting: An institutional view. Res. Policy 2012, 41, 236–249. [Google Scholar] [CrossRef]
  27. Fisch, C.O.; Block, J.H.; Sandner, P.G. Chinese university patents: Quantity, quality, and the role of subsidy programs. J. Technol. Transf. 2016, 41, 60–84. [Google Scholar] [CrossRef]
  28. Dang, J.; Motohashi, K. Patent statistics: A good indicator for innovation in China? Patent subsidy program impacts on patent quality. China Econ. Rev. 2015, 35, 137–155. [Google Scholar] [CrossRef]
  29. Ling, W. Patenting-promoting policies and regional utility patent output: Evidence from provincial level data. In Proceedings of the 2015 Portland International Conference on Management of Engineering and Technology (PICMET), Portland, OR, USA., 2–6 August 2015. [Google Scholar]
  30. D’Este, P.; Iammarino, S. The spatial profile of university-business research partnerships. Pap. Reg. Sci. 2010, 89, 335–350. [Google Scholar] [CrossRef] [Green Version]
  31. Cao, Q.; Tan, M.; Yu, Q.; Wang, P. Research on the quantity, quality and economic performance of scientific research achievements in Chinese universities. Technol. Anal. Strateg. Manag. 2020, 32, 1–14. [Google Scholar] [CrossRef]
  32. Parra, A. Sequential innovation, patent policy, and the dynamics of the replacement effect. RAND J. Econ. 2019, 50, 568–590. [Google Scholar] [CrossRef] [Green Version]
  33. Baldini, N.; Grimaldi, R.; Sobrero, M. Institutional changes and the commercialization of academic knowledge: A study of Italian universities’ patenting activities between 1965 and 2002. Res. Policy 2006, 35, 518–532. [Google Scholar] [CrossRef]
  34. Grimm, H.M.; Jaenicke, J. What drives patenting and commerzialisation activity at East German universities? The role of new public policy, institutional environment and individual prior knowledge. J. Technol. Transf. 2012, 37, 454–477. [Google Scholar] [CrossRef]
  35. Rai, A.K.; Cook-Deegan, R. Racing for academic glory and patents: Lessons from CRISPR. Science 2017, 358, 874. [Google Scholar] [CrossRef] [PubMed]
  36. Shane, S. Encouraging university entrepreneurship? The effect of the Bayh-Dole Act on university patenting in the United States. J. Bus. Ventur. 2004, 19, 127–151. [Google Scholar] [CrossRef]
  37. Van Holm, E.J.; Jung, H.; Welch, E.W. The impacts of foreignness and cultural distance on commercialization of patents. J. Technol. Transf. 2021, 46, 29–61. [Google Scholar] [CrossRef]
  38. Kang, B.; Kazuyuki, M. Local Industry Influence on Commercialization of University Research by University Startups. In RIETI Discussion Paper Series 20-E-086; Research Institute of Economy, Trade and Industry (RIETI): Tokyo, Japan, 2020. [Google Scholar]
  39. Ambos, T.C.; Mäkelä, K.; Birkinshaw, J.; D’Este, P. When Does University Research Get Commercialized? Creating Ambidexterity in Research Institutions. J. Manag. Stud. 2008, 45, 1424–1447. [Google Scholar] [CrossRef]
  40. Singh, J.; Marx, M. Geographic Constraints on Knowledge Spillovers: Political Borders vs. Spatial Proximity. Manag. Sci. 2013, 59, 2056–2078. [Google Scholar] [CrossRef] [Green Version]
  41. Perret, J.K. Knowledge spillovers via patent citations across the regions of the Russian Federation—Evidence from European patent data. Int. J. Innov. Reg. Dev. 2015, 6, 376–403. [Google Scholar] [CrossRef]
  42. Xu, S.; Sam, A.G. Diversity Or Specializarion? Understanding Knowledge Spillover Mechanisms In China. Reg. Sci. Inq. 2021, 13, 225–238. [Google Scholar]
  43. Fischer, M.M.; Varga, A. Geographic Spillovers of University Research: On Patent Activities of the High Technology Sectors in Austria. In The Emergence of the Knowledge Economy: A Regional Perspective; Acs, Z.J., de Groot, H.L.F., Nijkamp, P., Eds.; Springer: Clam, Switzerland, 2002; pp. 139–153. [Google Scholar]
  44. Leprince, M.; Paty, S.; Reulier, E. Choice of Taxation and Spatial Interaction between Local Governments. Biomed. Tech. 2005, 37, 155–161. [Google Scholar]
  45. Revelli, F.; Tovmo, P. Revealed yardstick competition: Local government efficiency patterns in Norway. J. Urban Econ. 2007, 62, 121–134. [Google Scholar] [CrossRef]
  46. Mallinson, D.J. Who Are Your Neighbors? The Role of Ideology and Decline of Geographic Proximity in the Diffusion of Policy Innovations. Policy Stud. J. 2019, 49, 46–88. [Google Scholar] [CrossRef]
  47. Mitchell, J.L. Does Policy Diffusion Need Space? Spatializing the Dynamics of Policy Diffusion. Policy Stud. J. 2018, 42, 424–451. [Google Scholar] [CrossRef]
  48. Gu, J. Spatiotemporal context and firm performance: The mediating effect of strategic interaction. Growth Chang. 2021, 52, 371–391. [Google Scholar] [CrossRef]
  49. Gu, J. Spatial Dynamics between Firm Sales and Environmental Responsibility: The Mediating Role of Corporate Innovation. Sustainability 2021, 13, 1648. [Google Scholar] [CrossRef]
  50. Anselin, L.; Griffith, D.A. Do Spatial Effects Really Matter in Regression Analysis? Pap. Reg. Sci. 1988, 65, 11–34. [Google Scholar] [CrossRef]
  51. Gu, J. Spatiotemporal dynamics of the patent race: Empirical evidence from listed companies in China. Asian J. Technol. Innov. 2020, 1–29. [Google Scholar] [CrossRef]
  52. Gu, J. Determinants of biopharmaceutical R&D expenditures in China: The impact of spatiotemporal context. Scientometrics 2021, 6, 1–21. [Google Scholar]
  53. Golish, B.L.; Besterfield-Sacre, M.E.; Shuman, L.J. Comparing Academic and Corporate Technology Development Processes. J. Prod. Innov. Manag. 2008, 25, 47–62. [Google Scholar] [CrossRef]
  54. James, S.L.; Gubbins, P.; Murray, C.J.; Gakidou, E. Developing a comprehensive time series of GDP per capita for 210 countries from 1950 to 2015. Popul. Health Metr. 2012, 10, 12. [Google Scholar] [CrossRef] [Green Version]
  55. Nolan, B.; Roser, M.; Thewissen, S. GDP Per Capita Versus Median Household Income: What Gives Rise to the Divergence Over Time and how does this Vary Across OECD Countries? Rev. Income Wealth 2019, 65, 465–494. [Google Scholar] [CrossRef]
  56. Jones-Evans, D.; Klofsten, M. Universities and local economic development: The case of Linkping. Eur. Plan. Stud. 1997, 5, 77–93. [Google Scholar] [CrossRef]
  57. Karen, D. Pupil/teacher ratios are worst for 15 years. Public Financ. 2000, 8, 14. [Google Scholar]
  58. Kuo, P.F.; Shen, C.W.; Chiu, C.S. The impact of large-scale events: A difference-in-difference model for a Pokémon go safari zone event in Tainan and its effect on bikeshare systems. Transp. Res. Part A Policy Pract. 2021, 149, 283–299. [Google Scholar] [CrossRef]
  59. Chen, H.; Chen, Y.; Lin, B.; Wang, Y. Can short selling improve internal control? An empirical study based on the difference-in-differences model. Account. Financ. 2019, 58, 1233–1259. [Google Scholar] [CrossRef]
  60. Zhou, L.; Zhu, Y.; Yang, G.; Luo, Y. Quantitative evaluation of the effect of prohibiting grazing policy on grassland desertification reversal in northern China. Environ. Earth Sci. 2013, 68, 2181–2188. [Google Scholar] [CrossRef]
  61. González, X.; Pazó, C. Do public subsidies stimulate private R&D spending? Res. Policy 2005, 37, 371–389. [Google Scholar]
  62. Dann, C.; Neumann, G.; Peters, J. Policy Evaluation with Temporal Differences: A Survey and Comparison. J. Mach. Learn. Res. 2014, 15, 809–883. [Google Scholar]
  63. Callaway, B.; Sant’Anna, P.H.C. Difference-in-Differences with multiple time periods. J. Econom. 2021, 225, 200–230. [Google Scholar] [CrossRef]
  64. Legendre, P. Spatial Autocorrelation: Trouble or New Paradigm? Ecology 1993, 74, 1659–1673. [Google Scholar] [CrossRef]
  65. Debarsy, N.; Ertur, C. Testing for Spatial Autocorrelation in a Fixed Effects Panel Data Model. Reg. Sci. Urban Econ. 2010, 40, 453–470. [Google Scholar] [CrossRef] [Green Version]
  66. Kosfeld, R.; Mitze, T.; Rode, J.; Wlde, K. The COVID-19 containment effects of public health measures A spatial difference-in-differences approach. J. Reg. Sci. 2021, 61, 799–825. [Google Scholar] [CrossRef] [PubMed]
  67. Heckert, M. A Spatial Difference-in-Differences Approach to Studying the Effect of Greening Vacant Land on Property Values. Cityscape 2015, 17, 51–60. [Google Scholar]
  68. Heckert, M.; Mennis, J. The economic impact of greening urban vacant land: A spatial difference-in-differences analysis. Environ. Plan. A Econ. Space 2012, 44, 3010–3027. [Google Scholar] [CrossRef]
  69. Jia, R.; Shao, S.; Yang, L. High-speed rail and CO2 emissions in urban China: A spatial difference-in-differences approach. Energy Econ. 2021, 99, 1873–6181. [Google Scholar] [CrossRef]
  70. Delgado, M.S.; Florax, R. Difference-in-differences techniques for spatial data: Local autocorrelation and spatial interaction. Econ. Lett. 2015, 137, 123–126. [Google Scholar] [CrossRef] [Green Version]
  71. Peng, X. Strategic interaction of environmental regulation and green productivity growth in China: Green innovation or pollution refuge? Sci. Total Environ. 2020, 732, 139200. [Google Scholar] [CrossRef]
  72. Song, Y.; Zhang, X.; Zhang, M. Research on the strategic interaction of China’s regional air pollution regulation: Spatial interpretation of “incomplete implementation” of regulatory policies. China World Econ. 2012, 20, 103–120. [Google Scholar] [CrossRef]
  73. Anselin, L.; Florax, R.J.G.M.; Rey, S.J. Advances in Spatial Econometrics: Methodology, Tools and Applications; Springer: Clam, Switzerland, 2004. [Google Scholar]
  74. Sage, J.L.; Pace, R.K. Introduction to Spatial Econometrics; Chapman and Hall/CRC Press: London, UK, 2009. [Google Scholar]
  75. Gu, J. Spatial Diffusion of Social Policy in China: Spatial Convergence and Neighborhood Interaction of Vocational Education. Appl. Spat. Anal. Policy 2015, 9, 1–25. [Google Scholar] [CrossRef]
  76. Drolc, C.A.; Gandrud, C.; Williams, L.K. Taking Time (and Space) Seriously: How Scholars Falsely Infer Policy Diffusion from Model Misspecification. Policy Stud. J. 2021, 49, 484–515. [Google Scholar] [CrossRef]
  77. Baybeck, B.; Berry, W.D.; Siegel, D.A. A Strategic Theory of Policy Diffusion via Intergovernmental Competition. J. Politics 2011, 73, 232–247. [Google Scholar] [CrossRef] [Green Version]
  78. Bonaccorsi, A.; Daraio, C. Exploring size and agglomeration effects on public research productivity. Scientometrics 2005, 63, 87–120. [Google Scholar] [CrossRef]
  79. Anderson, W.A.; Banerjee, U.; Drennan, C.L.; Elgin, S.; Epstein, I.R.; Handelsman, J.; Hatfull, G.F.; Losick, R.; O’Dowd, D.K.; Olivera, B.M. Changing the Culture of Science Education at Research Universities. Science 2011, 331, 152–153. [Google Scholar] [CrossRef] [PubMed] [Green Version]
  80. Gu, J.; Levin, J.S. Tournament in academia: A comparative analysis of faculty evaluation systems in research universities in China and the USA. High. Educ. 2021, 81, 1–19. [Google Scholar] [CrossRef]
  81. Yong, S.L. ‘Technology transfer’ and the research university: A search for the boundaries of university-industry collaboration. Res. Policy 1996, 25, 843–863. [Google Scholar]
  82. Jefferson, G.; Albert, H.U.; Guan, X.; Xiaoyun, Y.U. Ownership, performance, and innovation in China’s large- and medium-size industrial enterprise sector. China Econ. Rev. 2003, 14, 89–113. [Google Scholar] [CrossRef] [Green Version]
  83. Cheung, K.Y. The Impact of Ownership on the Propensity to Innovate in China’s Large- and Medium-Sized Industrial Enterprises. China Int. J. 2007, 5, 228–249. [Google Scholar] [CrossRef]
  84. Tahmooresnejad, L.; Beaudry, C. Impact of government funding on academic publications and patents. Trans. Inst. Br. Geogr. 2008, 33, 186–200. [Google Scholar]
  85. Feng, C.; Qi, D.; Sun, B. Policy Suggestions on Innovation and Development of China’s Industry-University-Research Strategic Alliance. Int. J. Bus. Manag. 2010, 6, 269–273. [Google Scholar] [CrossRef] [Green Version]
  86. Orsini, M.; Saurette, P. ‘Take Two and See me in the Morning’: Reflections on the Political Placebo Effect. J. Mind-Body Regul. 2011, 1, 125–137. [Google Scholar]
  87. Bliege Bird, R.; Alden Smith, E. Signaling Theory, Strategic Interaction, and Symbolic Capital. Curr. Anthropol. 2005, 46, 221–248. [Google Scholar] [CrossRef]
  88. Wu, M.; Zhao, M.; Wu, Z. Evaluation of development level and economic contribution ratio of science and technology innovation in eastern China. Technol. Soc. 2019, 59, 101194. [Google Scholar] [CrossRef]
  89. Spector, B. The social embeddedness of business model enactment: Implications for theory and practice. J. Strategy Manag. 2013, 6, 27–39. [Google Scholar] [CrossRef]
  90. Gu, W.; Luo, J.D.; Liu, J. Exploring small-world network with an elite-clique: Bringing embeddedness theory into the dynamic evolution of a venture capital network. Soc. Netw. 2019, 57, 70–81. [Google Scholar] [CrossRef] [Green Version]
Figure 1. Theoretical model with hypotheses.
Sustainability 13 13459 g001
Table 1. Variable symbols and definitions.
Variable SymbolVariableExplanation of Indicator
NPGNumber of academic patents grantedNumber of academic patents granted in each province
CAPCommercializing academic patentsNumber of academic patents sold divided by number of patents granted in each province (%)
PGDPGDP per capitaGDP per capita in each province (unit: CNY 1000/person)
NCUNumber of universitiesTotal number of universities in each province
TSRTeacher/student ratioRatio of the number of teachers to the number of students in local universities
NIELarge enterprisesNumber of large industrial enterprises above designated size in each province (unit: 1000)
Table 2. Descriptive statistics of variables.
VariableObsMeanS.D.MinMax
NGP3103665.4324257.293127,989
CAP3103.2233.596030.77
PGDP31049.52326.35512.882164.563
NCU31081.82940.2186167
TSR3100.0620.0120.0450.119
NIE31012.13113.5770.05664.364
Table 3. Results of empirical estimation.
NGPCAP
Model 1Model 2Model 3Model 4
Fixed-EffectsRandom-EffectsFixed-EffectsRandom-Effects
PGDP82.174 *** (5.91)77.775 *** (5.93)0.048 * (1.65)0.049 ** (2.31)
NCU200.218 *** (8.46)82.571 *** (5.16)0.195 *** (3.92)0.018 (1.17)
TSR10,9274.4 *** (3.53)72,722.79 ** (2.55)230.979 *** (3.61)18.035 (0.38)
NIE−79.33 *** (−2.74)−52.884 * (−1.83)−0.135 ** (−2.24)−0.091 ** (−2.2)
DID1592.831 ** (2.28)1788.006 ** (2.48)4.394 *** (3.02)3.251 ** (2.24)
Year
2011−961.286 *** (−2.85)−621.957 * (−1.75)−2.409 *** (−3.19)0.692 (0.88)
2012−1253.776 *** (−3.47)−793.466 ** (−2.09)−3.662 *** (−4.18)1.364 (1.45)
2013−1823.482 *** (−4.68)−1158.333 *** (−2.85)−4.572 *** (−4.76)1.684 (−4.19)
2014−2287.648 *** (−5.46)−1473.854 *** (−3.42)−5.363 *** (−4.97)2.193 * (1.89)
2015−2285.566 *** (−4.68)−1319.266 ** (−2.63)−5.979 *** (−5.02)2.586 ** (2.02)
2016−2543.942 *** (−4.56)−1414.3 ** (−2.48)−6.09 *** (−4.94)2.172 * (1.69)
2017−3041.546 *** (−4.79)−1727.648 *** (−2.68)−6.349 *** (−4.9)1.441 (1.12)
2018−3434.307 *** (−4.76)−1964.061 *** (−2.7)−6.84 *** (−4.8)1.258 (0.91)
2019−3547.43 *** (−4.34)−1999.035 ** (−2.44)−6.284 *** (−4.17)0.168 (0.12)
_cons −12,055.71 *** (−5.44) −8.427 ** (−2.41)
ρ0.652 *** (7.89)0.616 *** (−7.2)0.419 ** (2.58)1.864 * (1.77)
Sigma_u 2487.897 2.12
Sigma_e1184.7261242.3242.4672.616
Log likelihood−2374.658−2710.131−649.134−757.967
Wald χ2984.06 ***835.83 ***170.13 ***217.5 ***
Pseudo R20.3250.640.0960.21
Wald test of spatial terms62.25 ***52.83 ***6.66 **100.93 *
Note: *, **, and *** are significant at 0.1, 0.05, and 0.001, respectively.
Table 4. Results of policy effect testing.
NGPCAP
Model 1Model 2Model 3Model 4
Fixed-EffectsRandom-EffectsFixed-EffectsRandom-Effects
Direct Effect1662.371 ** (2.28)1851.767 ** (2.48)4.444 *** (3.02)3.392 ** (2.36)
Indirect Effect2719.377 * (1.78)2617.57 * (1.88)2.914 (1.38)1.305 (1.13)
Total Effect4381.748 ** (2.04)4469.337 ** (2.21)7.358 ** (2.4)4.697 ** (2.11)
Note: *, **, and *** are significant at 0.1, 0.05, and 0.001, respectively.
Table 5. Results of placebo tests.
NGPCAP
Model 5Model 6Model 7Model 8
1 Year Earlier1 Year Later1 Year Earlier1 Year Later
PGDP82.595 *** (5.92)82.703 *** (5.96)0.049 * (1.68)0.049 * (1.7)
NCU201.749 *** (8.5)199.52 *** (8.44)0.199 *** (3.98)0.195 *** (3.91)
TSR106,525.2 *** (3.43)109,694.8 *** (3.55)223.24 *** (3.48)230.945 *** (3.6)
NIE−81.847 *** (−2.82)−76.23 *** (−2.63)−0.141 ** (−2.33)−0.131 ** (−2.15)
DID1480.638 * (1.82)1624.062 ** (2.5)4.687 *** (2.77)3.724 *** (2.74)
Year
2011−1040.216 *** (−3.06)−926.287 *** (−2.75)−2.669 *** (−3.49)−2.31 *** (−3.06)
2012−1308.451 *** (−3.55)−1151.406 *** (−3.2)−3.89 *** (−4.34)−3.353 ** (−3.86)
2013−1809.462 *** (−4.61)−1749.289 *** (−4.55)−4.614 *** (−4.75)−4.289 *** (−4.53)
2014−2320.063 *** (−5.43)−2285.898 *** (−5.47)−5.556 *** (−5.04)−5.238 *** (−4.9)
2015−2276.9 *** (−4.62)−2236.36 *** (−4.62)−6.059 *** (−5.02)−5.723 *** (−4.88)
2016−2541.707 *** (−4.52)−2541.362 ** (−4.57)−6.181 *** (−4.95)−5.951 *** (−4.86)
2017−3044.824 *** (−4.77)−3039.48 *** (−4.8)−6.447 *** (−4.92)−6.224 *** (−4.83)
2018−3443.006 *** (−4.75)−3433.771 *** (−4.77)−6.951 *** (−4.83)−6.722 *** (−4.74)
2019−3564.955 *** (−4.34)−3546.779 *** (−4.35)−6.407 *** (−4.22)−6.186 *** (−4.11)
ρ0.654 *** (7.91)0.65 *** (−7.86)0.41 ** (2.5)0.432 *** (2.71)
Sigma_e1188.5051182.6732.4732.473
Log likelihood−2375.575−2374.145−649.826−649.908
Wald χ2976.29 ***988.22 ***167.69 ***167.99 ***
Pseudo R20.3230.3250.0950.093
Wald test of spatial terms62.63 ***61.76 ***6.23 **7.33 ***
Note: *, **, and *** are significant at 0.1, 0.05, and 0.001, respectively.
Table 6. Results of empirical estimation with spatial inverse-distance contiguity weight.
NGPCAP
Model 9Model 10
Fixed-EffectsFixed-Effects
DID1335.697 ** (1.98)4.19 *** (2.91)
ρ0.457 *** (8.5)0.325 *** (3.4)
Log likelihood−2365.264−646.419
Wald χ21062.18 ***179.34 ***
Pseudo R20.360.076
Wald test of spatial terms72.32 ***11.54 **
Note: **, and *** are significant at 0.05, and 0.001, respectively.
Table 7. Results of placebo tests with spatial inverse-distance contiguity weight.
NGPCAP
Model 11Model 12Model 13Model 14
1 Year Earlier1 Year Later1 Year Earlier1 Year Later
DID1156.851 (1.47)1383.757 ** (2.2)4.313 *** (2.57)3.692 *** (2.76)
ρ0.459 *** (8.52)0.455 *** (−8.48)0.315 *** (3.27)0.34 *** (3.59)
Sigma_e1146.6091182.6732.4442.436
Log likelihood−2375.575−2364.803−647.327−646.844
Wald χ21054.31 ***1066.33 ***176.11 ***178.36 ***
Pseudo R20.3580.360.0770.077
Wald test of spatial terms72.66 ***71.89 ***10.71 ***12.89 ***
Note: **, and *** are significant at 0.05, and 0.001, respectively.
Publisher’s Note: MDPI stays neutral with regard to jurisdictional claims in published maps and institutional affiliations.

