Article

Immobilization of Hazardous Wastes on One-Part Blast Furnace Slag-Based Geopolymers

by
Daniela Carolina Paz-Gómez
1,2,*,
Inês Silveirinha Vilarinho
2,*,
Silvia M. Pérez-Moreno
1,
João Carvalheiras
2,
José Luis Guerrero
1,
Rui Miguel Novais
2,
Maria Paula Seabra
2,
Guillermos Ríos
3,
Juan Pedro Bolívar
1 and
João António Labrincha
2,*
1
Health and the Environment (RENSMA), Research Centre on Natural Resources, Department of Integrated Sciences, University of Huelva, 21007 Huelva, Spain
2
Department of Materials and Ceramic Engineering/CICECO-Aveiro Institute of Materials, Campus Universitário de Santiago, University of Aveiro, 3810-193 Aveiro, Portugal
3
Atlantic Copper S.L.U., 21001 Huelva, Spain
*
Authors to whom correspondence should be addressed.
Sustainability 2021, 13(23), 13455; https://doi.org/10.3390/su132313455
Submission received: 29 October 2021 / Revised: 1 December 2021 / Accepted: 2 December 2021 / Published: 5 December 2021
(This article belongs to the Special Issue Sustainable Environmental Management of Hazardous Wastes)

Abstract

:
The immobilization of hazardous wastes in ordinary Portland cement (OPC)-based materials has been widely studied and implemented. OPC-based materials have a high carbon footprint associated with their production and geopolymer materials are a sustainable and eco-friendly alternative. Therefore, this work aimed to immobilize two hazardous industrial wastes: copper wastewater sludge and phosphogypsum in one-part geopolymer materials. For that purpose, the precursor was partially substituted by these wastes (5, 10 and 20 wt.%) in the formulations. The geopolymer fresh and hardened state properties were evaluated, and the immobilisation of pollutants was determined through leaching tests. In phosphogypsum pastes (PG5, PG10 and PG20) it was observed that the compressive strength decreased with the increase in its amount, varying between 67 MPa and 19 MPa. In copper sludge pastes, the compressive strength of the specimens (CWS5 and CWS10) reached ~50 MPa. The mortars, MPG10 and MCWSs10, had compressive strengths of 13 MPa and 21 MPa, respectively. Leaching tests showed that pastes and mortars immobilise the hazardous species of the wastes, except for As from copper sludge, whose the best result was found in the compact paste (CWSs10) that leached 2 mg/kg of As. Results suggest that optimized compositions are suitable for the construction sector.

Graphical Abstract

1. Introduction

The demand for copper (Cu) continues to increase rapidly due to its crucial role in new technologies [1,2]. World refinery production reached 24 Mt in 2019, an increase of 30% compared to the value reported in 2009, which is in line with the increasing demand for this material. The increase in the copper production also implies that the amount of waste (e.g., dust, sludge, and slag) and gas emissions is increasing [3]. In recent decades, copper manufacturing industries have focused on systems to improve the recycling rate of the wastes and by-products, trying to reduce the environmental impact and achieve economic benefits, which is in concordance with the current European Union strategy for Circular Economy [4,5].
Atlantic Copper S.L.U, whose metallurgy complex is located in Huelva (Southwestern Spain), is one of the biggest copper cathode manufacturers in Europe. The plant produces about 3 × 10⁵ t/y of high-purity copper cathodes (>99.99 wt.% Cu) [6]. The industrial process generates several wastes and by-products, such as sludge that is produced in the liquid effluent treatment plant (LETP), where the heavy metals and other impurities (mainly As) are removed from different liquid effluents. The treatment process involves four steps: homogenization, pre-treatment, polishing, and ultrafiltration. Homogenization is carried out to control the composition and flow that feeds the system. In this stage, the effluents are stored in two tanks, one for acid/neutral effluents and another for alkaline effluents. In the pre-treatment, the effluents are mixed in a lamellar decanter where iron coagulants (FeCl3 and/or FeSO4·7H2O), an oxidizing agent (H2O2), and lime slurry (to adjust pH 10–11.5) are added. The stream is sent to the polishing stage where the arsenic is reduced in a second lamellar decanter, adding CO2 to adjust the pH between 8–9, iron coagulant, and other reactants. The outlet effluent is sent to an ultrafiltration (UF) system where fine particles that remain in the liquid effluent are removed. During the pre-treatment and the polishing stages, metal precipitation generates sludges that are collected in the underflow of the decanters, mixed in the thickener, and sent to pressure filters. The final sludge is here designated CWS (copper wastewater sludge). About 2 × 10³ t/y of CWS (EWC 190813) are produced and stored in a controlled landfill, located 70 km from Huelva city. This management strategy not only involves high transportation and storage costs but also raises environmental concerns.
On another hand, two factories devoted to the phosphoric acid production were active from 1965 to 2010 in Huelva, generating annually about 2.5 Mt of a waste called phosphogypsum (PG). This waste (EWC 060903) was stored in big stacks in the saltmarshes of the Tinto River, located less than 1 km from Huelva city, covering a surface of about 1000 ha, and containing around 80–100 Mt of PG. Therefore, efforts are being made to valorise this waste in other applications in order to reduce its environmental impact. This PG has been characterized in many studies and is made up mainly of gypsum (CaSO4·2H2O) at more than 95%, with the remaining fraction being impurities containing F, P2O5, and other pollutants in trace concentrations [7,8,9].
The immobilization of hazardous wastes in ordinary Portland cement (OPC)-based materials (e.g., mortars and concrete) is widely studied and implemented, despite the low effectiveness in several situations [10,11,12,13]. The use of geopolymer matrices seems more effective in several cases [14,15,16], but there are some papers reporting low immobilization effectiveness [13,17,18]. Moreover, there have been some investigations about PG incorporation in alkali-activated materials (geopolymer materials) [19,20,21]. Whereas there have been no previous studies about CWS incorporations in alkaline active, only some research using secondary material or wastes from the metallurgical and mining industries [22,23,24]. Geopolymers show a lower carbon footprint when compared to OPC, namely, a reduction in CO2 emissions of up to 50% if properly designed [25,26]. Additionally, the geopolymer materials could be designed to have superior properties to binders prepared from OPC [27].
The conventional process (two-part) to obtain a geopolymer involves a reaction between a concentrated alkali solution (e.g., sodium hydroxide or sodium silicate), and a solid aluminosilicate precursor (metakaolin, fly ash or blast furnace slag (BFS)) [28,29]. The geopolymer materials exhibit excellent physico-chemical properties, including high compressive strength, low shrinkage, controllable setting, acid resistance, fire resistance and low thermal conductivity. Consequently, a wide range of potential applications in the construction sector is expected [29,30]. However, the use of corrosive (alkaline) solutions makes it challenging to handle such solutions in real applications. An interesting and realistic alternative for producing these materials is named one-part or “just add water” processing. In this process, a solid alkaline activator is blended with the solid aluminosilicate precursor (dry mixture), and the reaction begins when water is added. In fact, this process is analogous to the preparation of OPC-based materials [31,32].
Consequently, this work is focused on the immobilization of CWS and PG in one-part geopolymer pastes and mortars using blast furnace slag (BFS) as precursor. Geopolymer materials were prepared by substituting 5, 10 and 20 wt.% of BFS for the residues. Fresh and hardened state properties were analysed, and immobilization efficiency was evaluated through leaching test, to determine the pollutant fixation. Leaching tests are procedures widely used to characterize the potential mobility of toxic species from material into the environment. Therefore, in this study, the immobilization efficiency of the specimen will be reflected in the concentration of toxic species in the leachate, immobilization ability being better when lower concentrations of toxic species are in the leachate.

2. Materials and Methods

2.1. Materials

Blast Furnace slag (BFS) from Ecocem, Aix-en-Provence, France, was used as the main solid precursor. BFS is a product made by rapidly cooling a slag melt, obtained by smelting iron ore. The precursor was partially replaced by two hazardous wastes, namely phosphogypsum (PG) and wastewater sludge from copper cathodes production (CWS). PG samples were collected from the PG stacks, which are located in Huelva (Spain). CWS samples were collected in the liquid effluent treatment plant of Atlantic Copper, a copper smelting plant located also in Huelva. After collection, both residues were immediately dried at 60 °C, milled and manually homogenized. CWS residue was further milled in a mill ring (Retsch, RS 100, Haan, Fermany) and then sieved through 63 µm mesh. Granulated anhydrous sodium metasilicate (Na2O = 47–49.5%, SiO2 = 50.5–53%) from Sigma-Aldrich (St. Louis, MO, USA), was used as a solid alkaline activator and, for mortars preparation, commercial natural sand from Weber Saint-Gobain (W), Aveiro, Portugal, was used as aggregate. Sand particles size ranges between 0.5 and 1 mm.

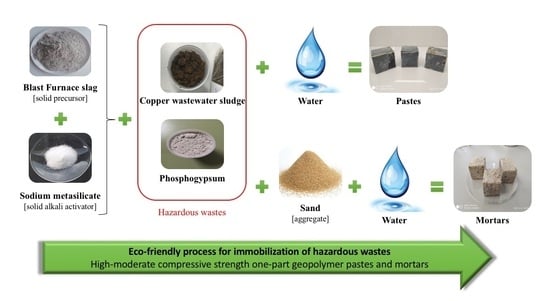
2.2. Preparation of Geopolymer

One-part geopolymer pastes and mortars were prepared, and the composition of specimens is shown in Table 1. The letters stand for the solid precursor used and the numbers for the substitution (mass %): “R” is the reference geopolymer paste prepared only with BFS; “PG” and “CWS” denote the respectively used residues. The “s” indicates that the waste was sieved at 63 µm. Finally, the letter “M” was used to designate the mortars. For example, PG5 is a paste where PG replaced 5 wt.% of BFS and MPG10 is a mortar where PG replaced 10 wt.% of BFS.
The geopolymer pastes and mortar preparation procedure was similar, but in the latter an aggregate was included in the first step. Briefly:
  • The solid components (precursor, activator, and aggregate, if applied) were mixed and homogenized manually in a plastic bag for about 1–2 min.
  • The solids were mechanically mixed while adding the water for 1 min.
  • The fresh paste was manually mixed for 1 min.
  • The fresh paste was, once more, mechanically mixed for 1.5 min.
  • The fresh paste was cast into pieces (40 × 40 × 40 mm), on metallic moulds, and vibrated for 2 min using an electric vibrator.
  • The specimens were covered with a plastic film and kept at ambient temperature during the first 24 h of curing.
  • All the specimens were unmoulded and introduced into the climatic chamber (20 °C and 65% RH) until the 7th and 28th curing day.

2.3. Materials Characterization

The raw materials used to prepare the geopolymer specimens were analysed by different analytical techniques. (1) X-ray fluorescence (XRF), on a Philips Xert PRO MPD spectrometer, was used to determine the major elements (as oxides). (2) X-ray diffraction (XRD), with a Panalytical X’Pert PRO3 diffractometer and X’Pert HighScore Plus software was used to identify crystalline phases. (3) The particles size distribution was determined by laser diffraction technology using a HORIBA Scientific LA-960V2 analyser, working from 10 nm to 3000 µm. (4) Scanning electron microscopy (SEM, Hitachi S4100, Tokyo, Japan), was used to study the microstructure and morphology of the new materials.

2.4. Geopolymer Characterization Tests

The fresh pastes were subjected to three tests: (1) flow table test was used to assess the consistency of the paste, in agreement with the EN 1015-3 standard [33]; (2) setting time (initial and final) was determined using the Vicat apparatus, according to the EN 196-3 standard [34]; (3) The calorimetry test was performed to evaluate the temperature evolution upon the first 24 h of curing. In this test, the relative humidity and temperature were controlled being 65% and 20 °C, respectively.
After 7 and 28 days of curing, the compression strength of the samples was determined using a universal testing machine (Shimadzu AG-25TA, Kyoto, Japan) with a displacement rate of 0.5 mm/min, according to the EN 1015-11 standard [35]. The water absorption of specimens was measured by weight variation after total immersion in water for 24 h. The apparent porosity (P) was estimated by using the results of the water absorption test (Equation (1)). The capillary coefficient was determined by immersing one of the faces of each specimen in 5–10 mm water, according to the EN 1015-18 standard [36]. The apparent density of specimens was also determined, by measuring their mass and volume (cubic regular shape). In all those tests, three replicates were used, and the respective deviation error was calculated.
P   ( % ) = Volume   of   open   pores   Volume   of   specimen × 100  
Further, the geopolymer specimens were characterized after 28 days of curing by some of the previous analytical techniques (XRD and SEM). Additionally, attenuated total reflection Fourier transform infrared spectroscopy (FTIR-ATR), performed on a Perkin Elmer SPECTRUM BX FT-IR apparatus, was used to determine the vibrational bonds (functional groups) formed in the geopolymer. The spectra were obtained over the wavenumber range 4000–400 cm−1, with an 8 cm−1 resolution and 128 scans.
Finally, to evaluate the pollutants mobility on specimens cured for 28 days, a modified version of the EN 12457-2 standard [37] was adopted for the leaching test. The extraction fluid (distilled water), liquid/solid ratio of 10 L/kg (±2%) and the leaching time (24 ± 0.5 h) were adopted. However, neither granular material with a particle size less than 4 mm nor agitation was used in the leaching tests. In the leaching test, the monolithic specimens were submerged in distilled water without agitation for 24 h. Then, the solution was collected and measured in total reflection x-ray fluorescence spectrometer (TXRF—S2 PICOFOX 50 keV), with detection limit raging in the ppb. This test was carried out with duplicates and blanks for every ten samples.

3. Results and Discussion

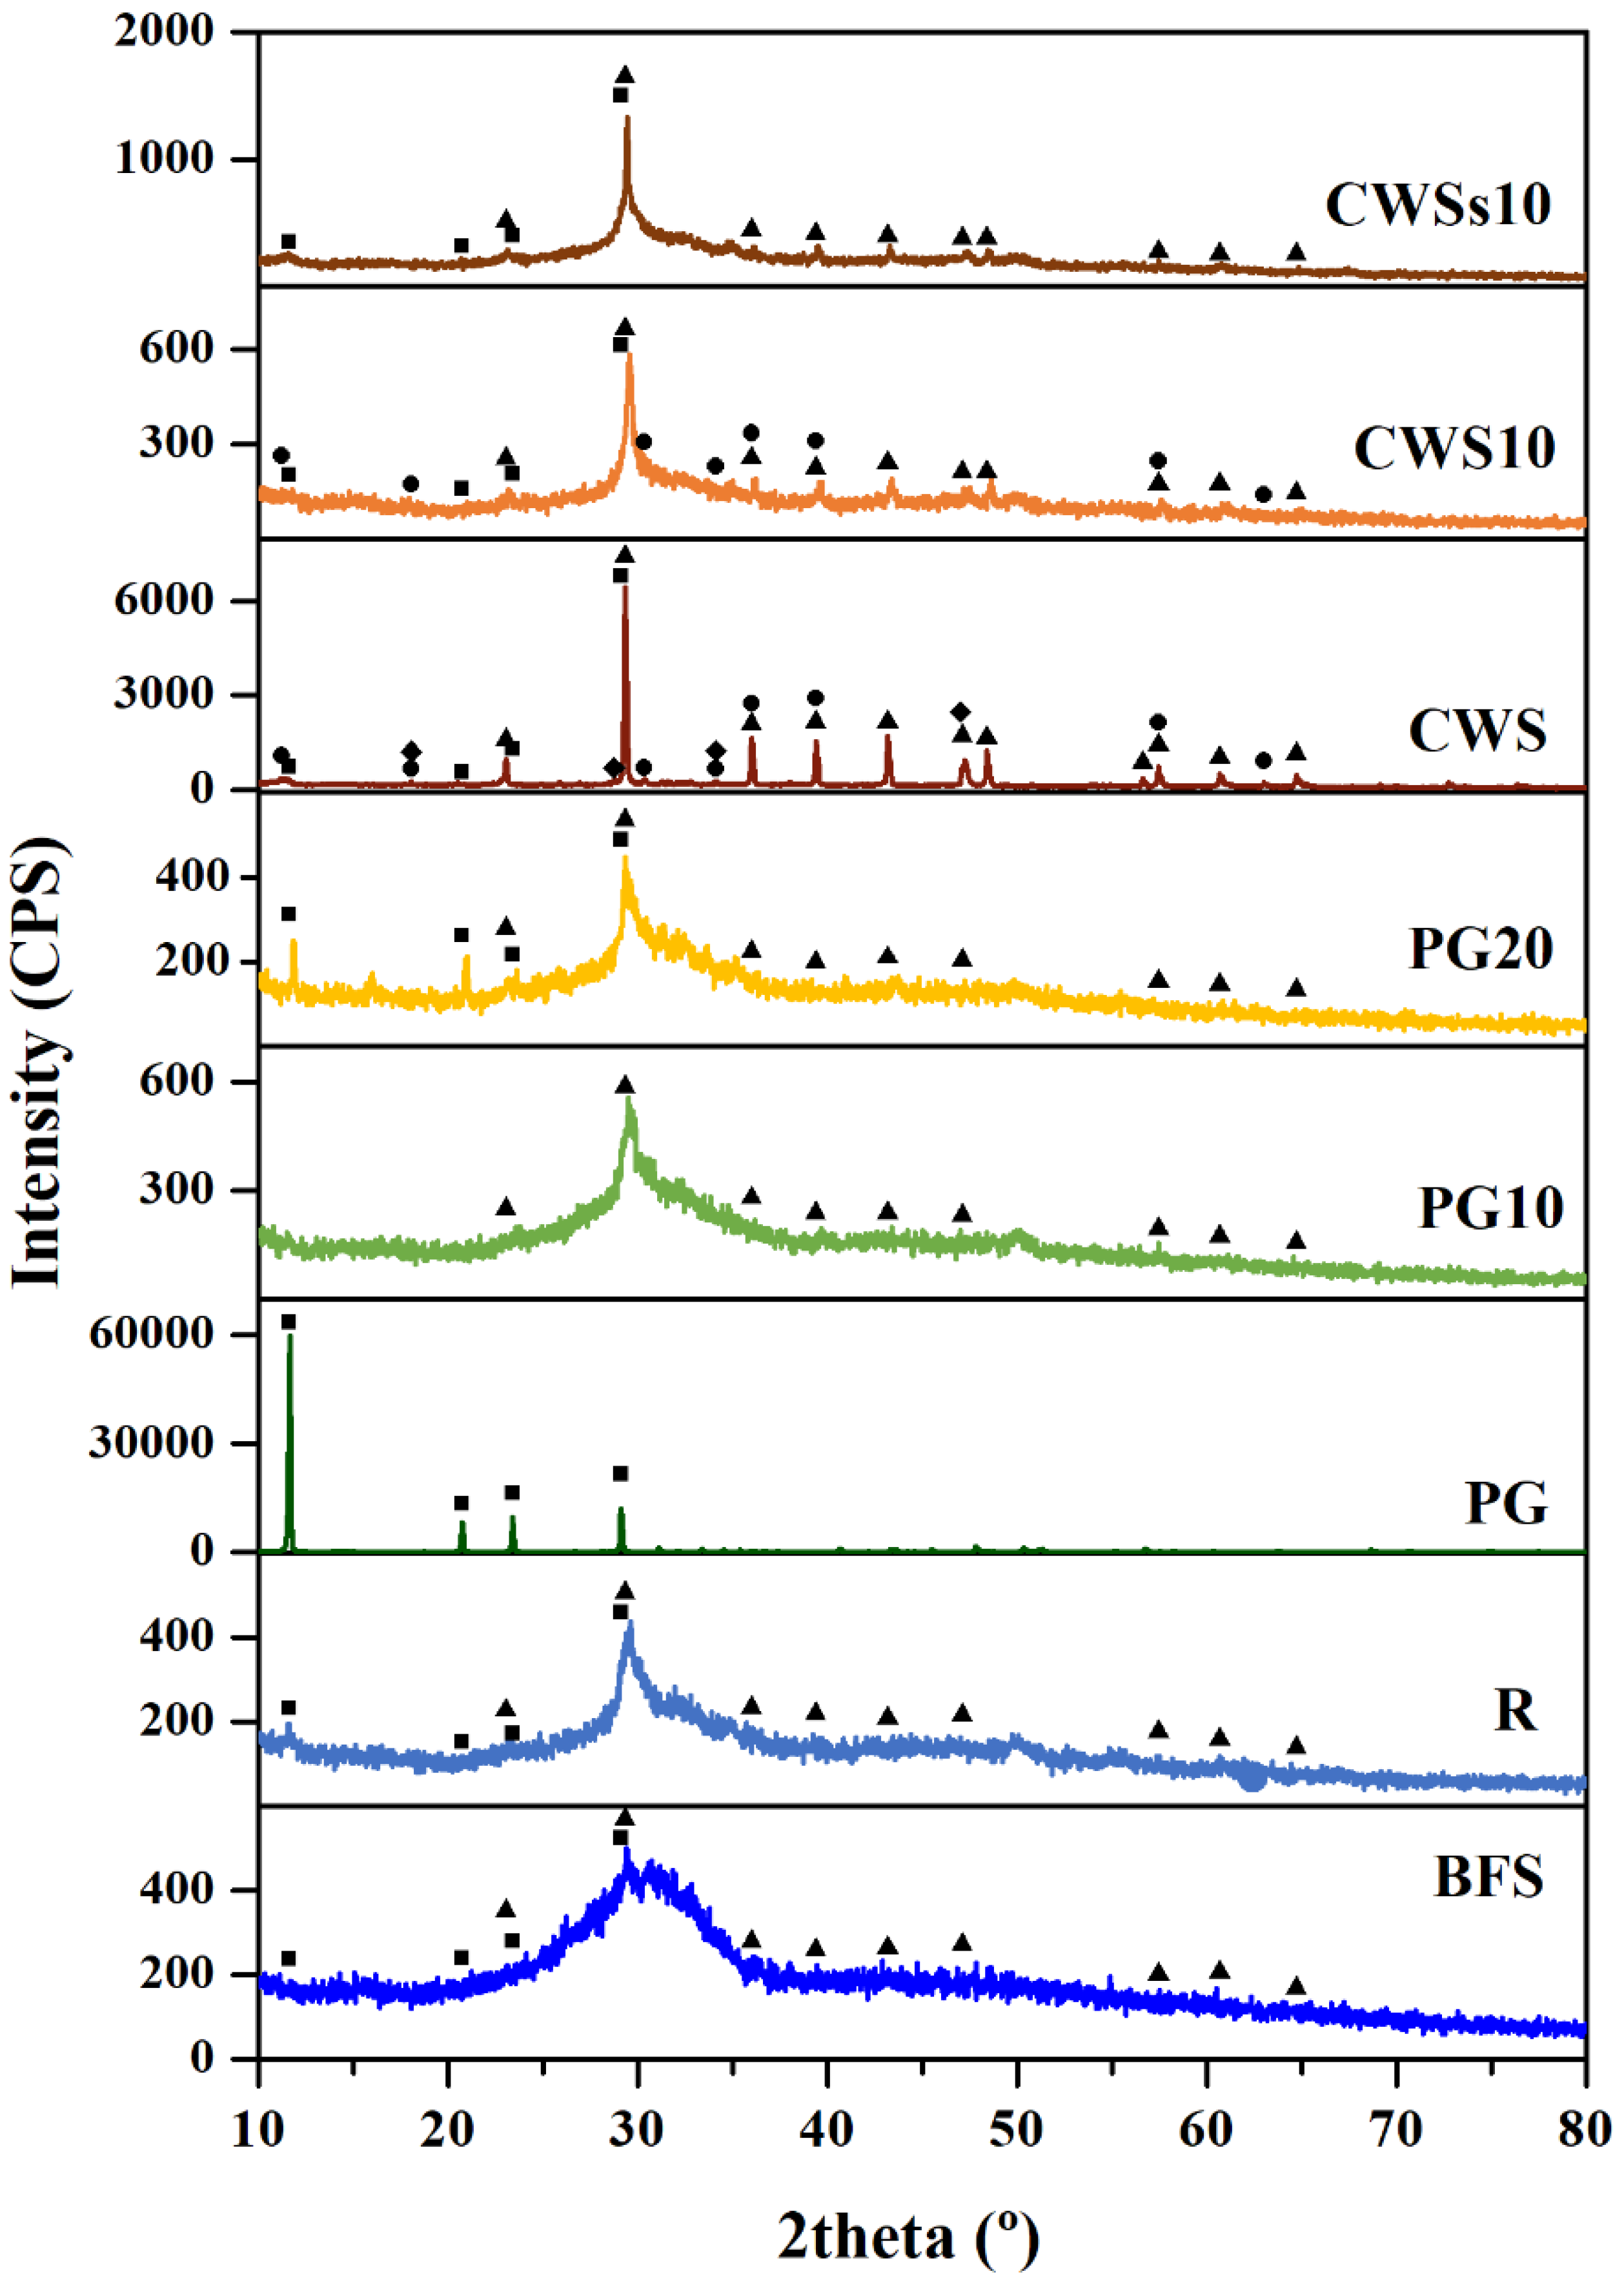
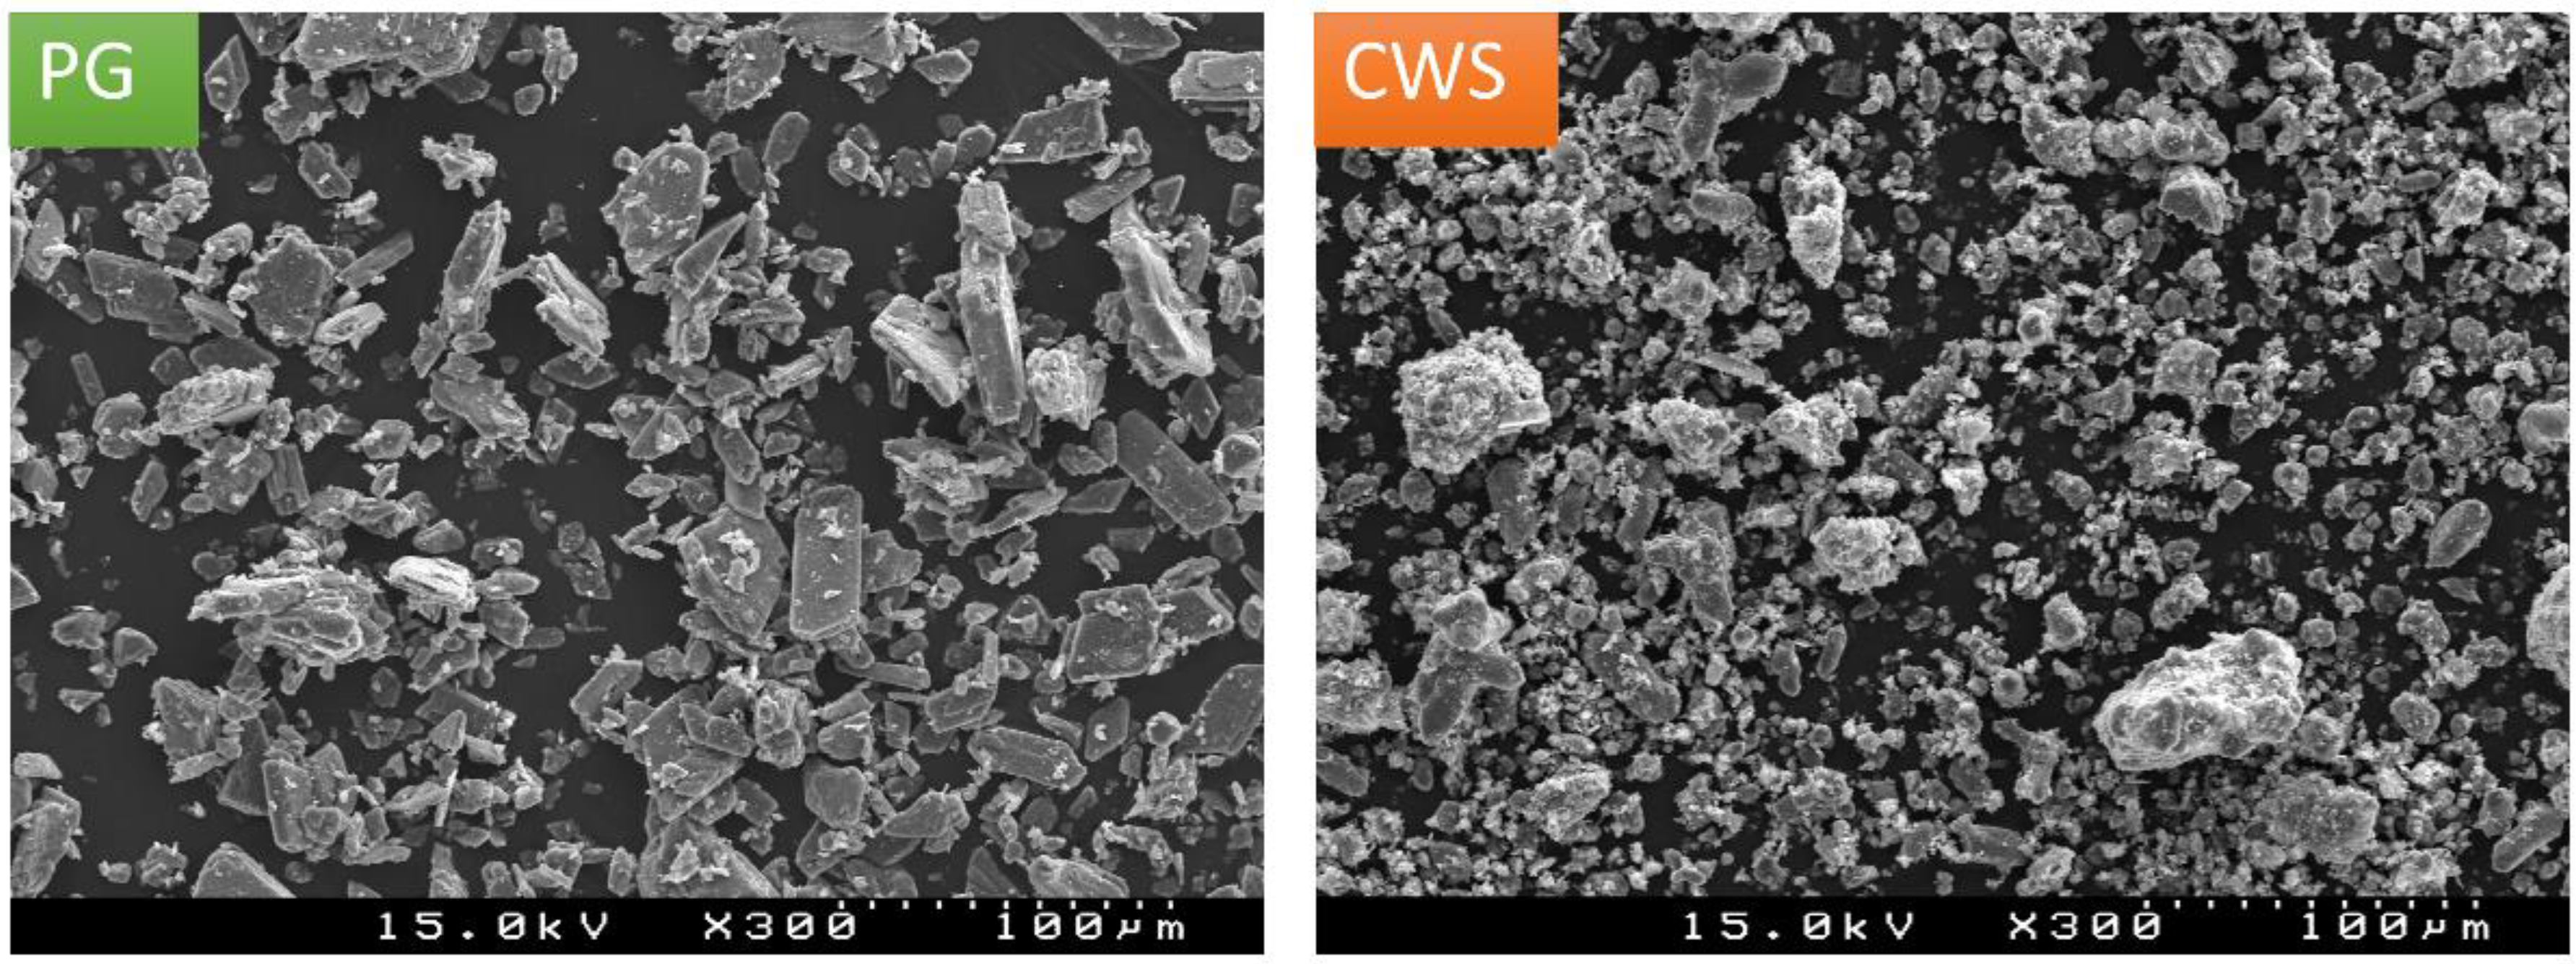
3.1. Raw Materials Characterization

The chemical composition of the materials used as precursors (BFS, PG and CWS) are presented in Table 2. The BFS sample is mainly composed of CaO, SiO2, and Al2O3 (approximately 47 wt.%, 33 wt.% and 9 wt.%, respectively, enabling its use as a solid precursor in the synthesis of geopolymers as reported recently [38]. MgO and SO3 are present in lower proportions (approximately 7 wt.% and 2 wt.%, respectively). PG and CWS also presented a high concentration of CaO (about 40 wt.% and 69 wt.%, respectively), but the amount of SiO2 and Al2O3 is very low (around 2.4 wt.% and 0.40 wt.%, respectively). As expected, PG is very rich in SO3 (around 52 wt.%) and has F in a concentration of 3.3 wt.%. In CWS MgO, SO3 and Fe2O3 contents exist in proportions between 3–15 wt.%. Furthermore, CWS contains As (around 3.4 wt.%) as the main trace (and hazardous) element, and others such as Ba, Cu, Pb, Sb, Sr, and Zn in concentrations less than 1%.
Due to the lack of standards for geopolymers, the EN 197-1 standard [39], was used to define the composition, specification and conformity criteria of geopolymers. This regulation is the European standard that defines and gives the specifications of common cements. The loss on ignition (LOI) of a mixture must be lower than 5%, and this limits the maximum admissible level (14 wt.%) of CWS that shows LOI of 35%. This limit assures that chlorides content is below 0.10 wt.%. SO3 content can vary between 3.5–5% depending on the application. SO3 content was acceptable in BFS and CWS, but is much higher in PG, limiting its admissible incorporation amount to 10 wt.%. Regarding to trace elements, the EN 197-1 standard does not specify the admissible amount.
X-ray diffractogram of BFS, PG and CWS are shown in Figure 1. BFS is highly amorphous, as indicated by the broad halo between 20° and 40° (2θ). Gypsum (CaSO4·2H2O) and calcite (CaCO3) were the identified crystalline phases. Intense peaks of gypsum are observed in PG. The crystalline phases present in the CWS sample are calcite, gypsum, iron oxide hydroxide (Fe21O31(OH)) and portlandite (Ca(OH)2).
The particle size distributions of precursor and wastes are shown in Figure 2. The median particles size (D50) is 6.7 µm, 10.8 µm and 10.9 µm, respectively, for BFS, PG and CWSs, being naturally superior (34.7 µm) for CWS. The milling of CWS waste is adjusted to the size distribution of the PG. BFS shows a broader distribution, including finer particles than the wastes. The observed fineness assures high reactivity in the geopolymerization process. At the same time, fine particles fill the existing space and assure high compactness [40,41].
SEM images of the wastes (PG and CWS) are shown in Figure 3. Gypsum particles in PG are easily denoted by their typical tabular shape. By contrast, CWS particles have irregular shapes and tend to form agglomerates.

3.2. Geopolymers Characterization
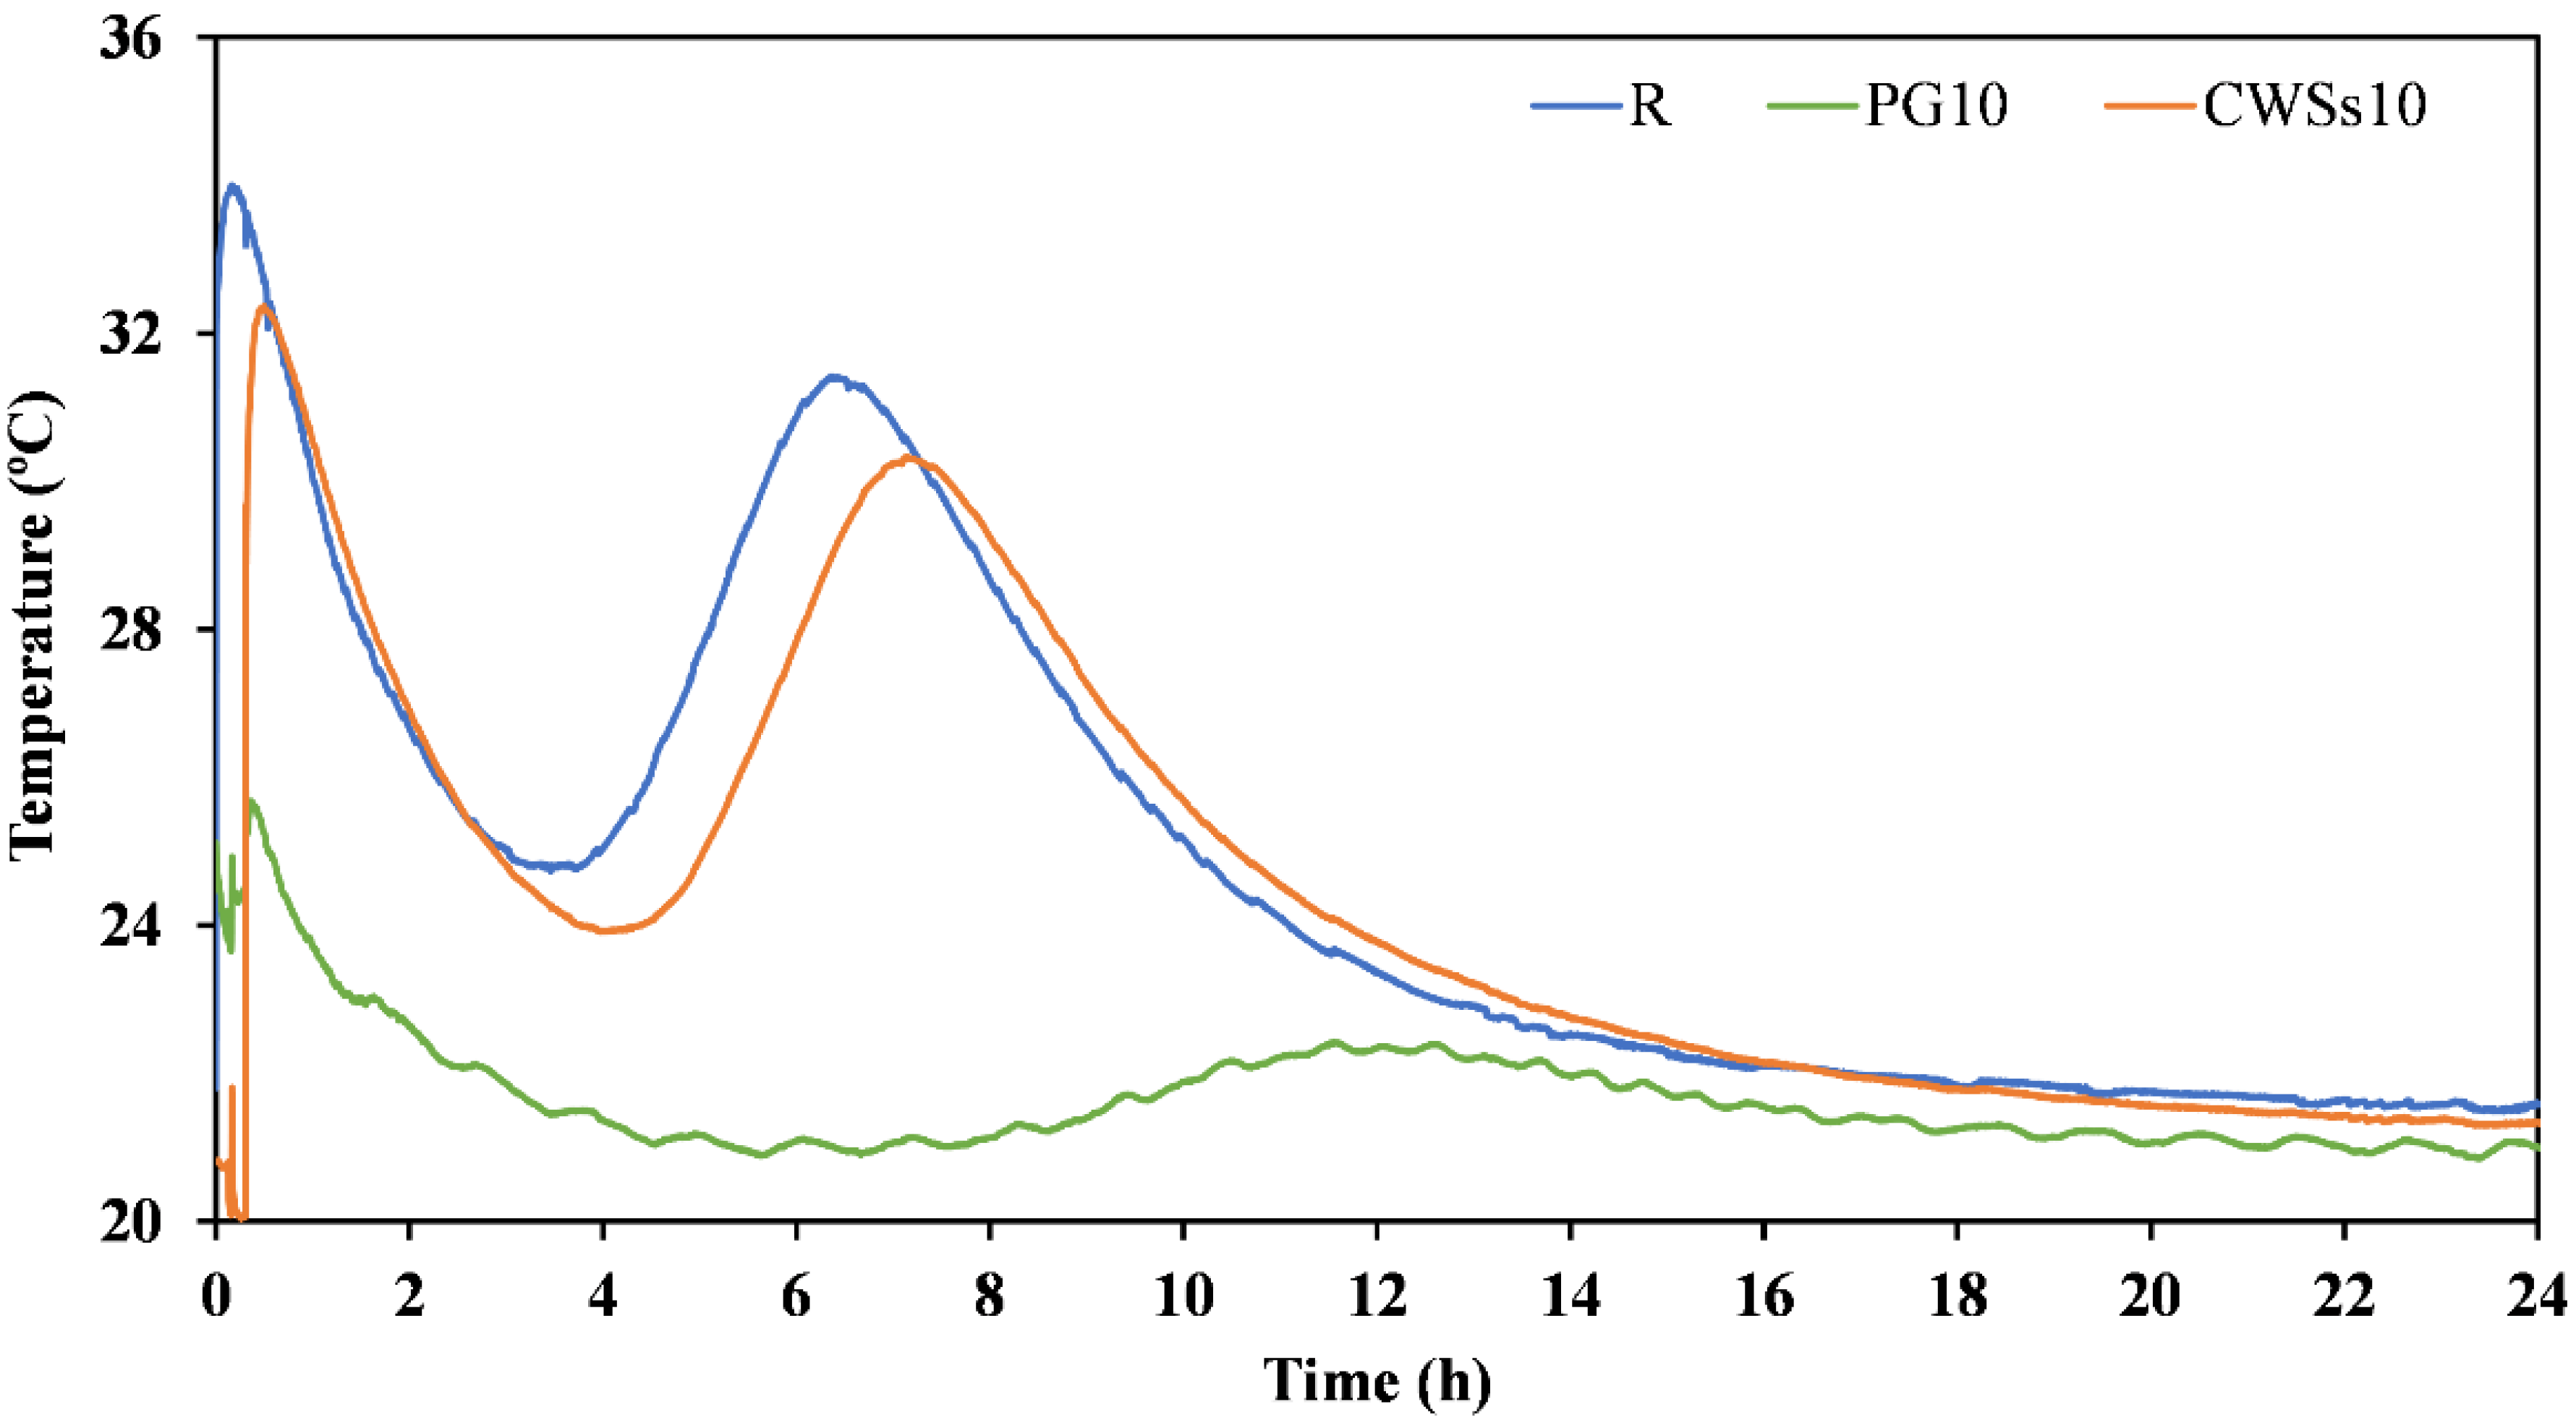
3.2.1. Fresh State

Values of spread in the flow for pastes and mortars are illustrated in Figure 4. The increasing proportion of PG in the mixture (PG5, PG10 and PG20 with water-to-binder ratios (W/B) of 0.37, 0.36 and 0.38, respectively) enhances the flowability. This behaviour can be associated with the calcium sulphate content of the residue since gypsum spreads easily. Additionally, free-sulphate anions (SO42−) can react and consume the alkaline activator and hinder the geopolymerization process [42,43]. Although, the differences in flowability can also be associated with the decrease in the amount of reactive precursor. The reactivity loss is also denoted by the increase in the setting time (Figure 5), again expected for a gypsum-rich component. Spread values also tend to enhance with increasing amounts of CWS, denoting reactivity retarding [31,44]. The setting time is, accordingly, longer. These differences are also observed on mortars but seem less significant than those seen in the pastes, possibly since the effects are attenuated by the presence of sand and the use of a larger W/B ratio (0.71).
According to EN 197-1 [39], the initial setting values of the MPG10 and MSWs10 specimens seem appropriate for real applications without requiring the use of setting retarders or accelerators. Common types of cement (CEM I to CEM V or CEMI-SR 0 to 3) have an initial setting time of 40–60 min.
Figure 6 shows the temperature evolution of selected pastes during the first 24 h of curing. Two exothermic peaks can be seen in all samples. For R specimen, the first peak occurred at about 15 min after the mixing with water and it is the pre-induction period. It corresponds to the wetting and dissolution of the activator (metasilicate). On CWSs10 sample this peak has a similar magnitude but its maximum is observed after 30 min. On PG10 sample the peak has a much lower intensity, confirming the decrease in reactivity of the mixture caused by the presence of CaSO4·2H2O, which changed the alkalinity of the paste [13,45].
On the R sample a second peak can be observed around 7 h after water addition, corresponding to the acceleration and deceleration periods that are associated with polymerization and condensation reactions [27,45]. CSWs10 shows a similar peak, again slightly delayed with respect to R due to the lesser amount of the reactive precursor. For the PG10 sample, this peak is again much less intense, and the delay is more expressive (about 5 h). These observations are in line with the discussed differences in the setting behaviour of the various mixes.

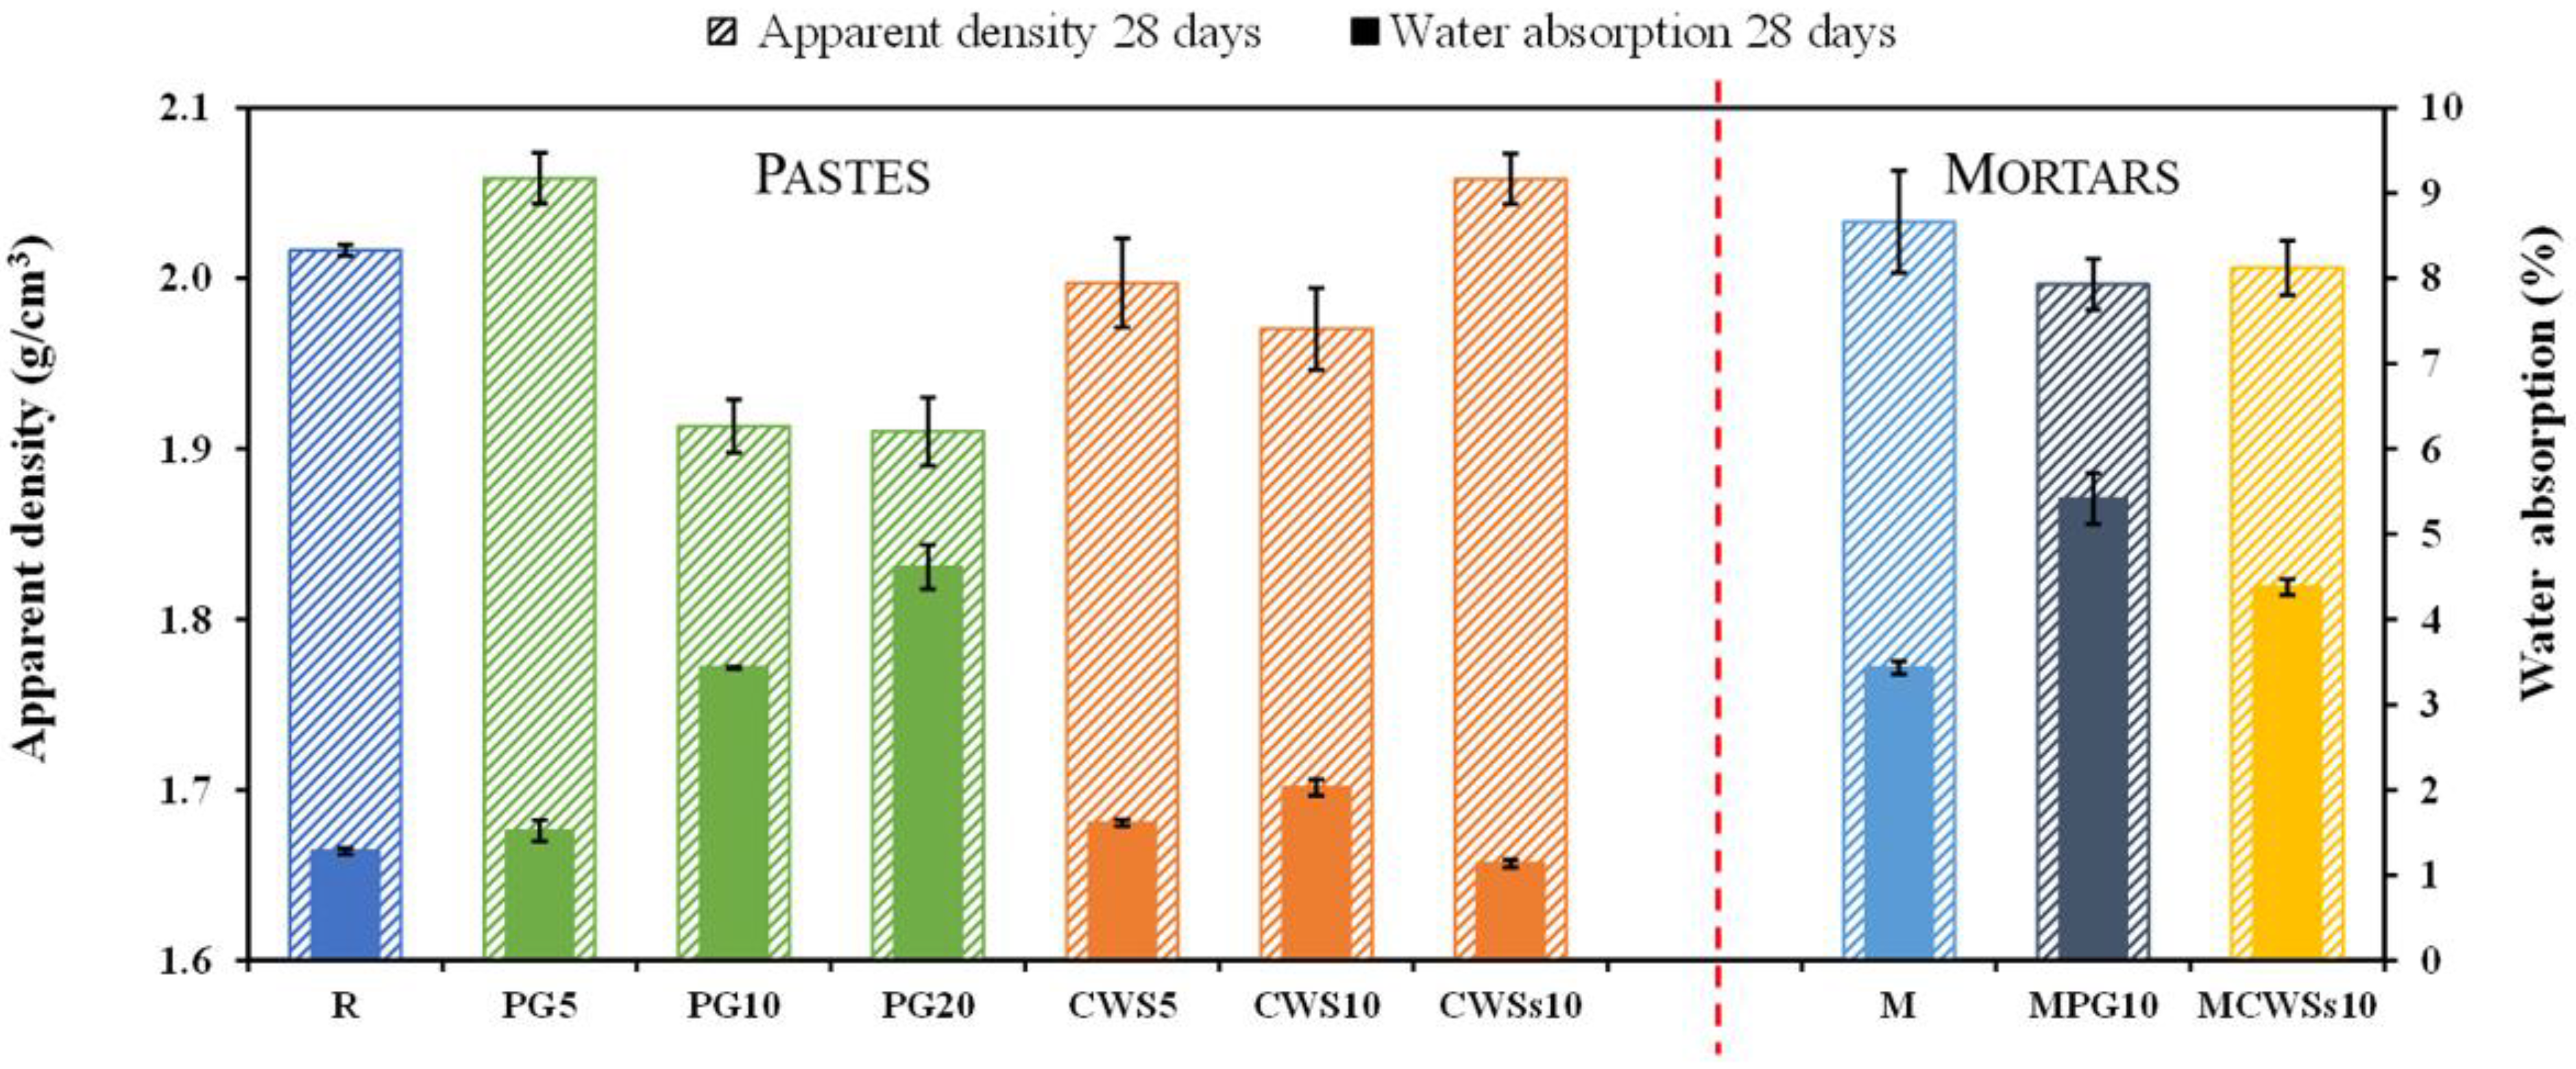
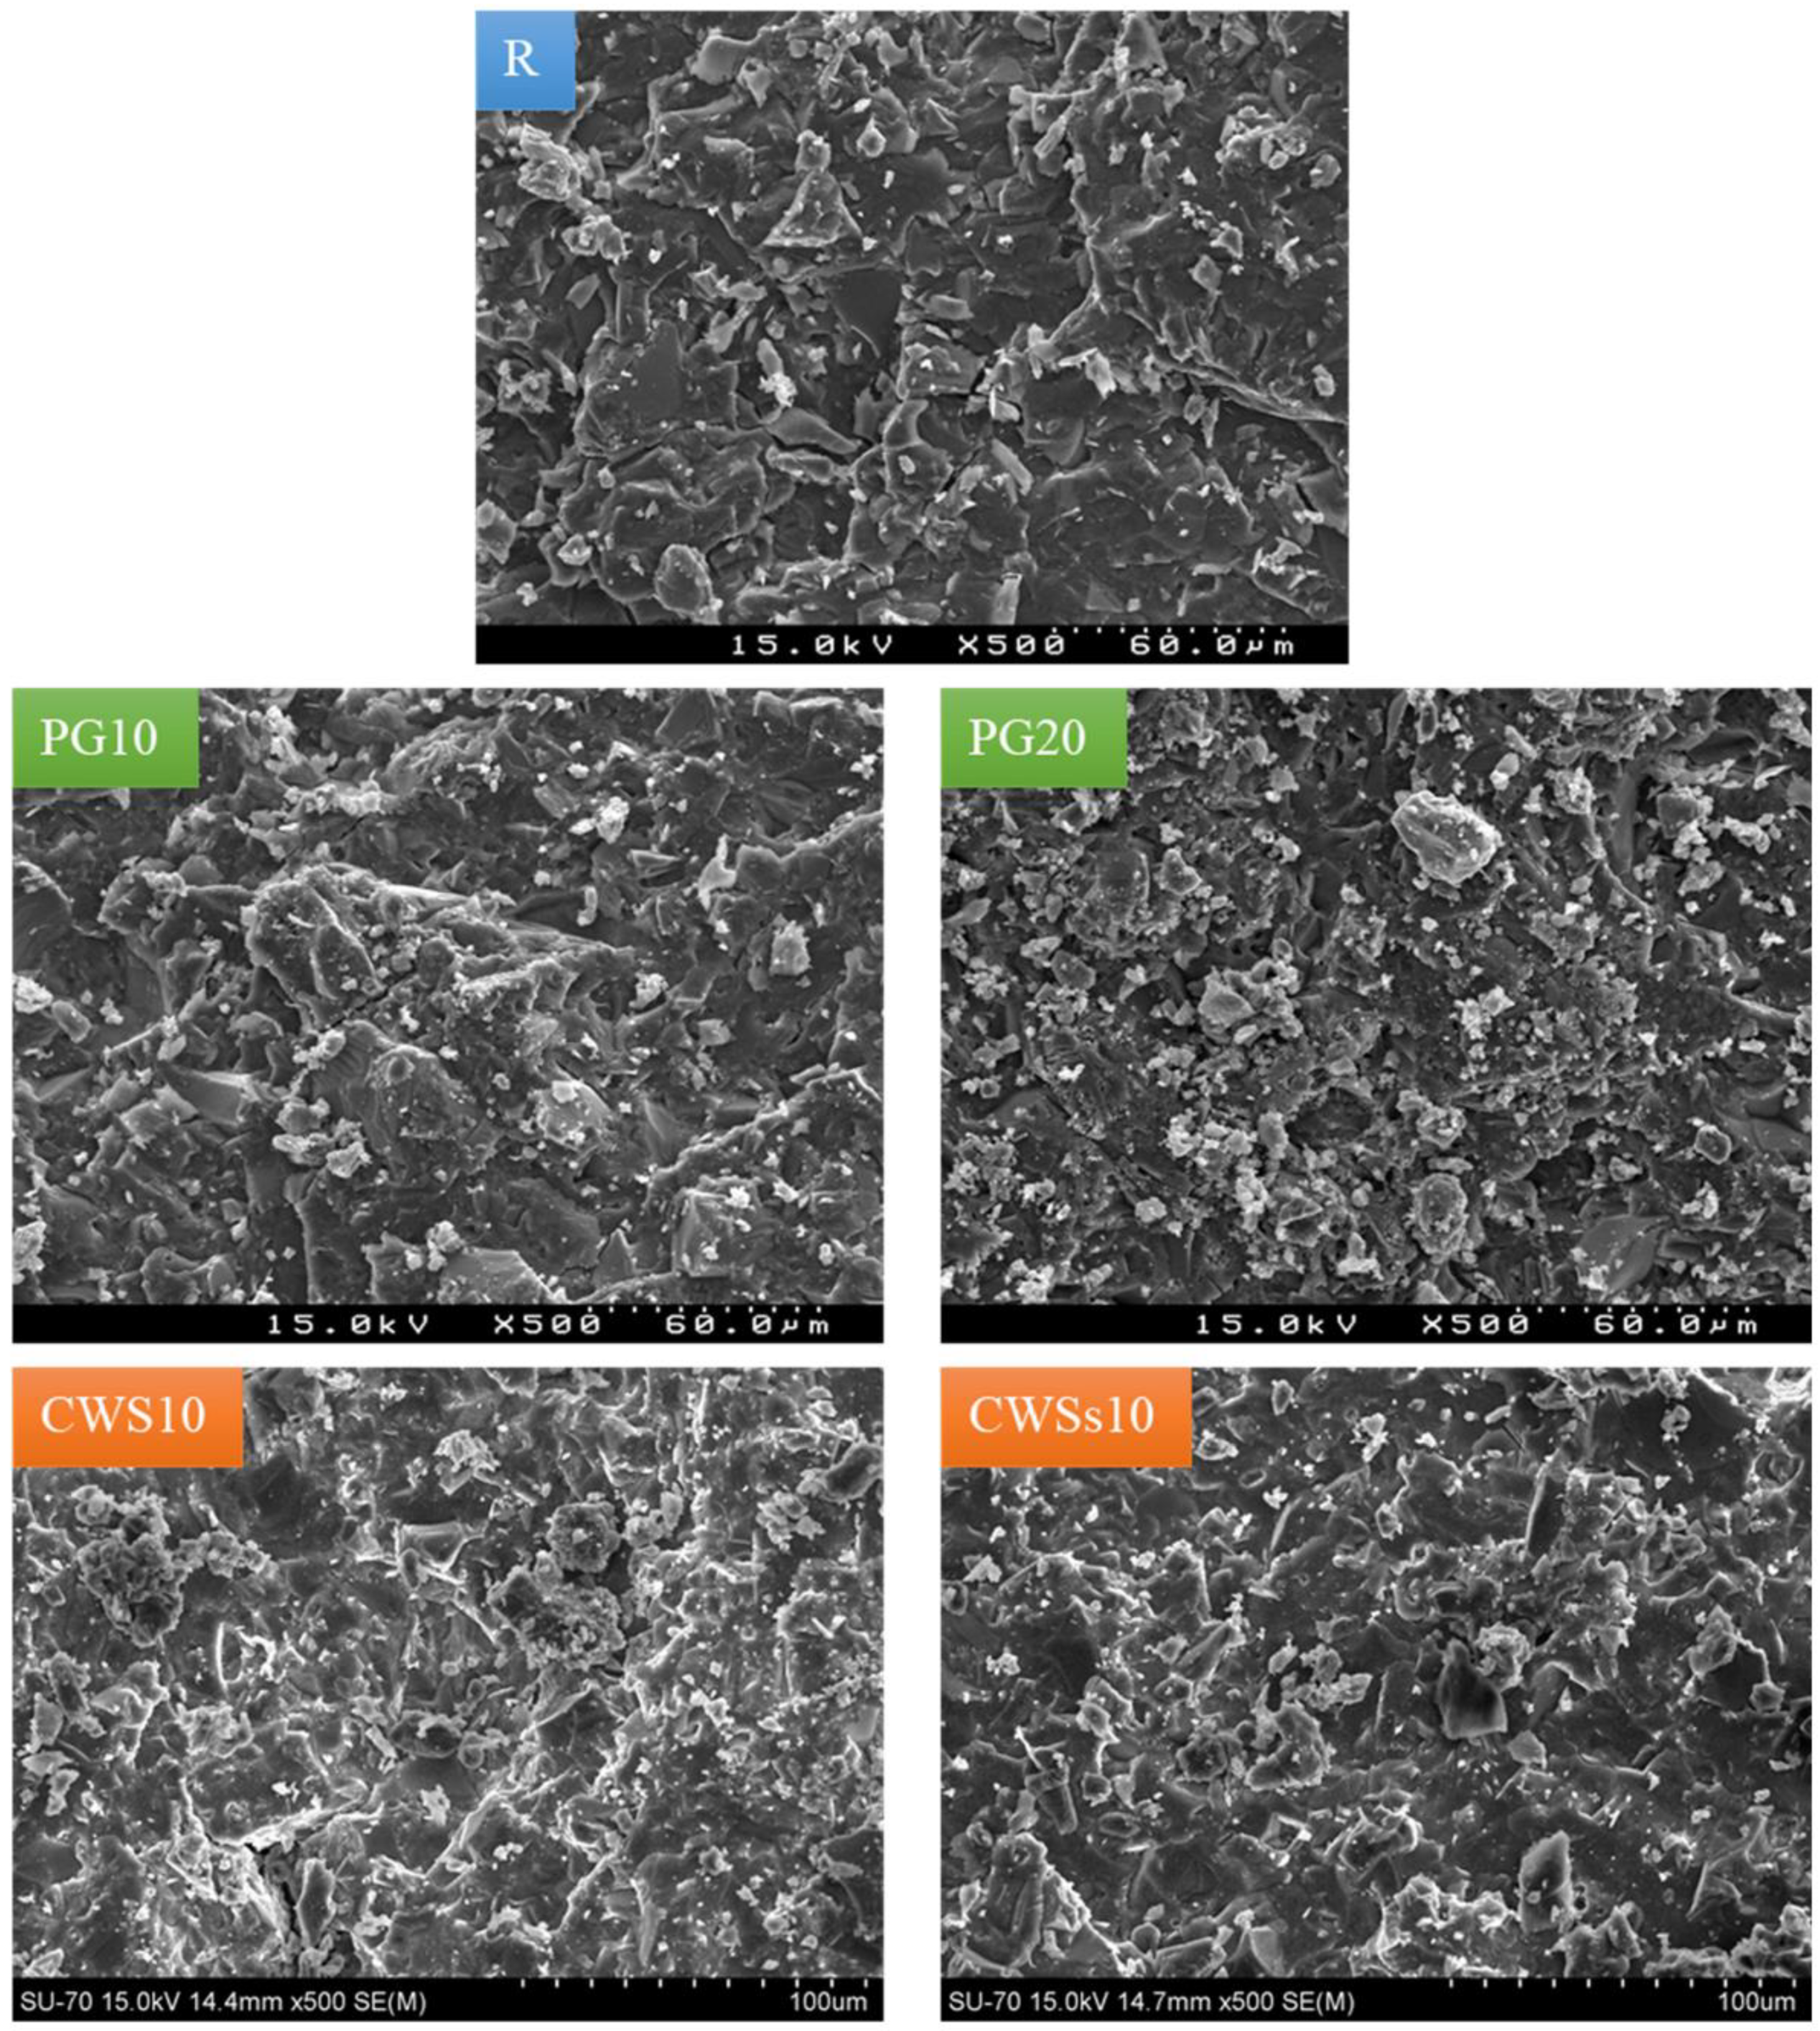
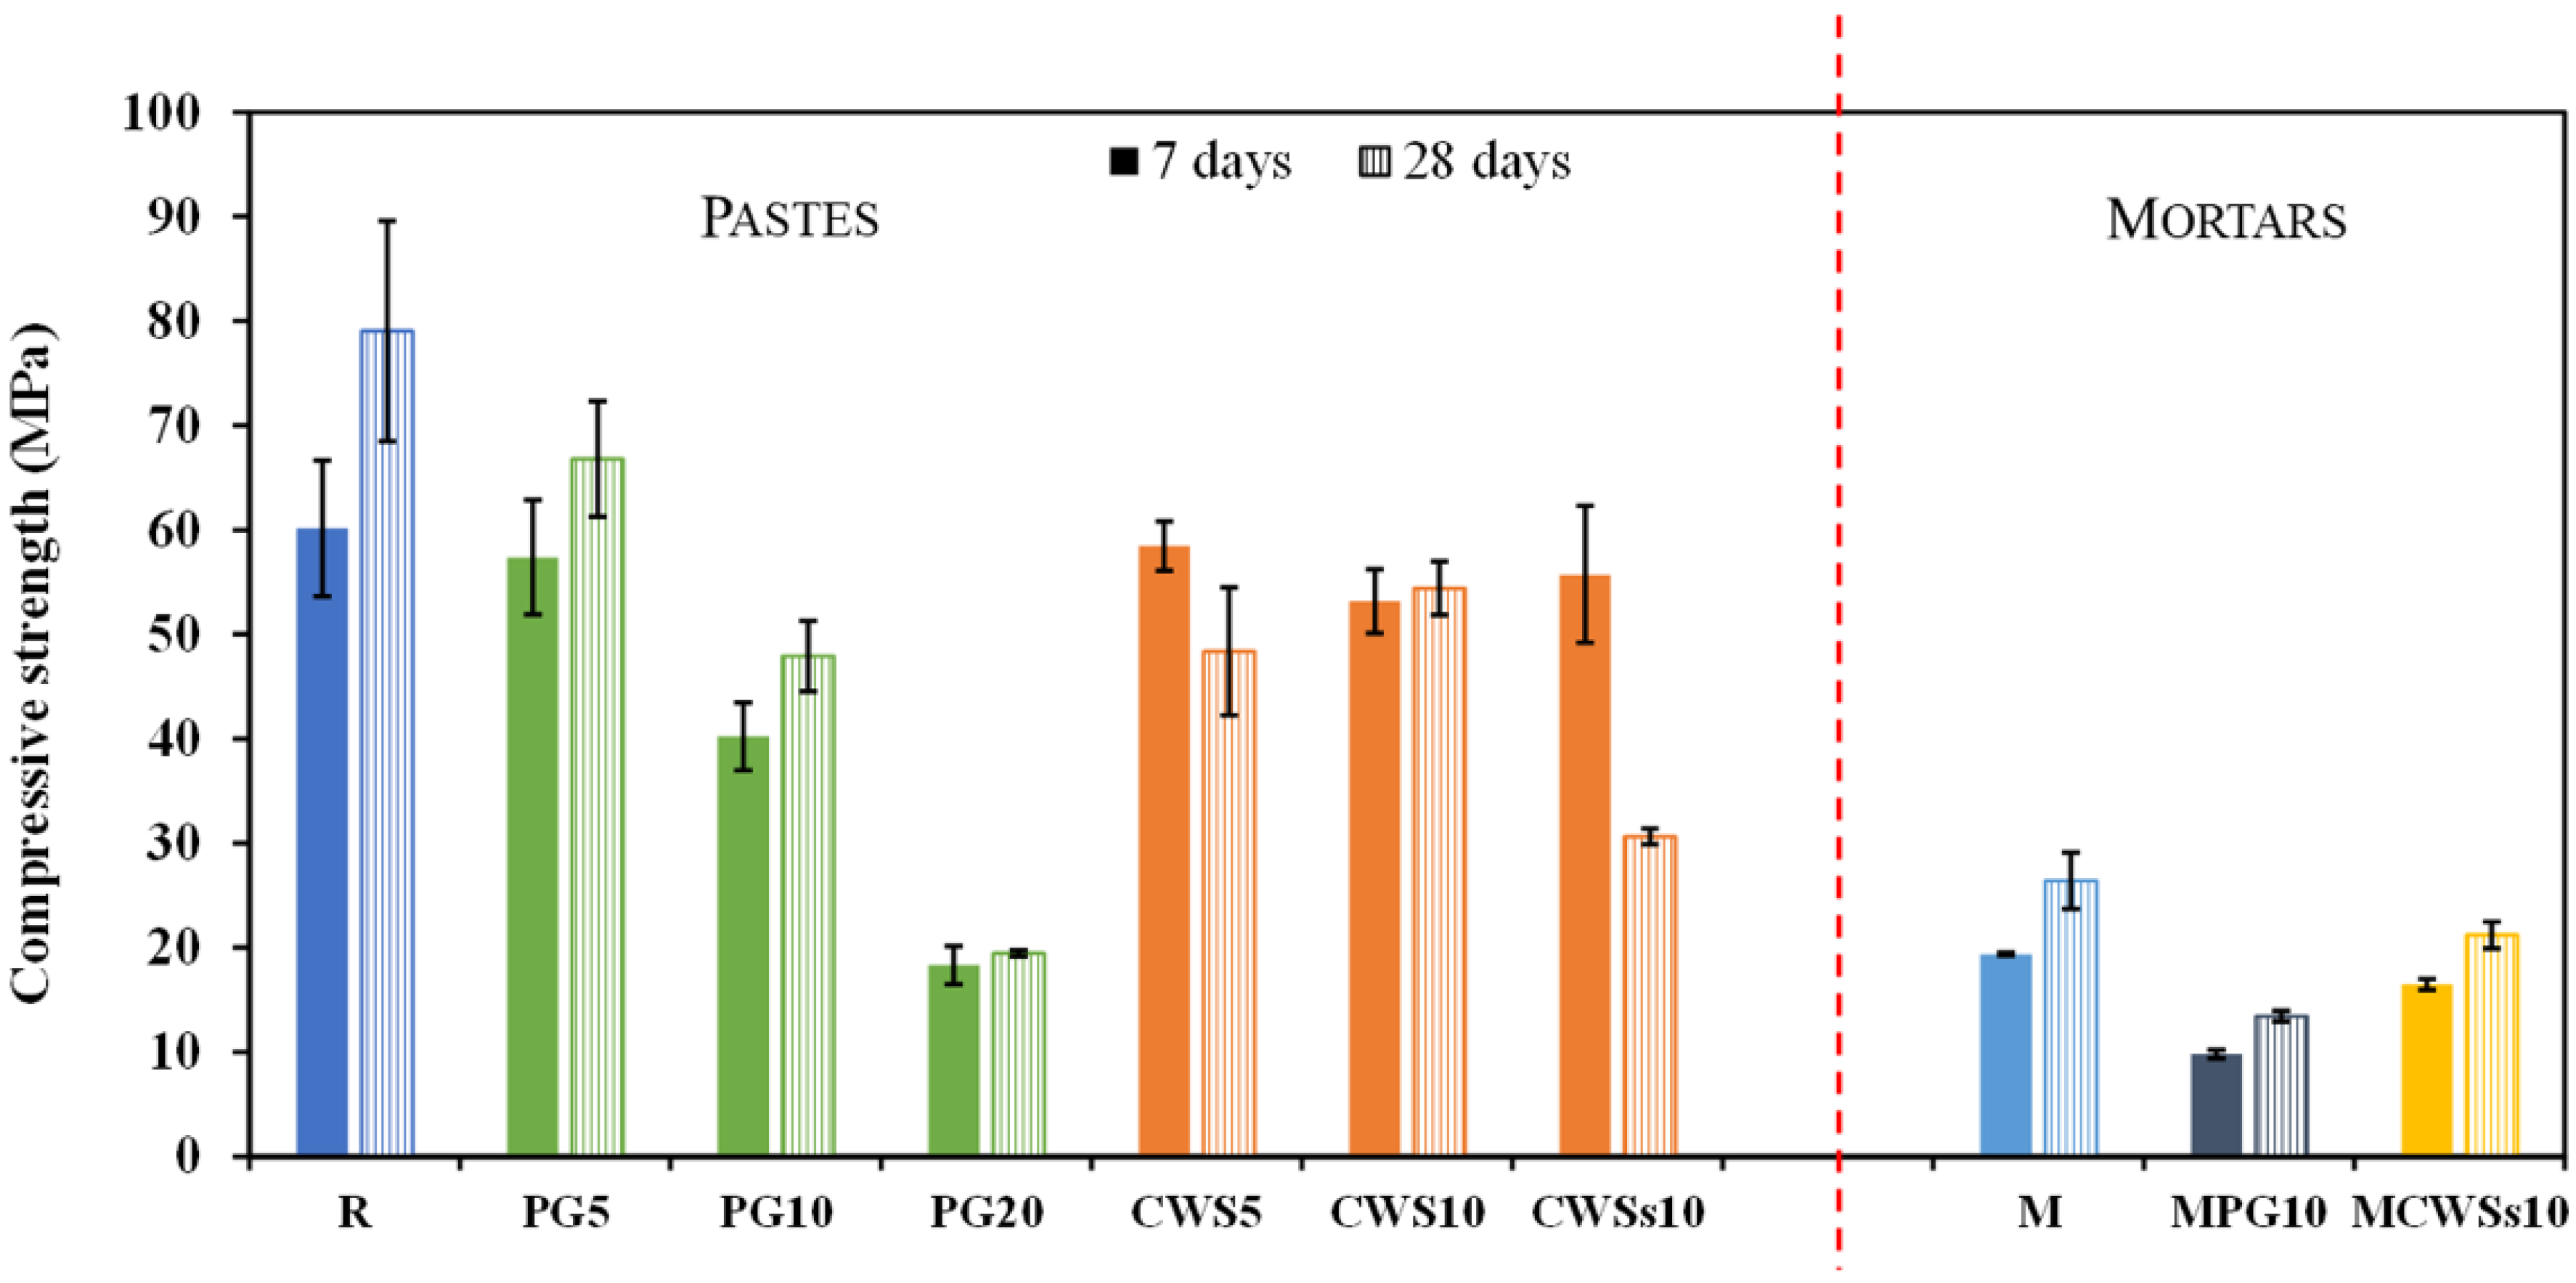
3.2.2. Hardened Samples

Figure 7 shows the compressive strength of the studied specimens cured for 7 and 28 days. Pastes presented higher mechanical resistance (3× more in general) than the corresponding mortars, an expected behaviour since aggregates are not reactive and the binder:aggregates ratio used was 1:4. In general, there was a strength gain from 7 to 28 days, however only the CWSs10 paste revealed an unexpected drop.
R specimens show a compressive strength of about 79 MPa after 28 days of curing. The substitution of BFS by the two wastes induces a decrease in the mechanical resistance that tends to be intensified when their amount rises. The strength of the geopolymer is associated with the solubility of alumina and silica from the precursor (BFS). In the compositions containing wastes, the amount of the reactive precursor decreases (see Table 1) as part of the slag is replaced by a non-reactive material (e.g., PG or CWS). This fact modifies the amount of reactive silica and alumina available for the geopolymerization, possibly inducing a deficit of solubilized Si and Al in the system, which lead to the formation of a geopolymer-matrix with poorer mechanical performance compared to the reference material. PG5 shows 67 MPa while PG20 reached only 19 MPa after 28 days of curing. Looking at the specimens with CWS, relatively high compressive strength is observed for CWS5 and CWS10 samples, over 50 MPa. However, the CWSs10 specimen, prepared with sieved (<63 µm) sludge, shows a drop from 56 MPa to 31 MPa between the 7th and 28th curing days. Microcracking was observed in these samples (see Figure S1, in supplementary materials) upon curing/drying between the two mentioned dates. This feature might be due to the higher compactness of the material that hinders the microstructural evolution during the polycondensation process [31,46]. This paste also required a higher amount of water to achieve the desirable flowability, as a consequence of the higher fineness of sieved sludge particles. More water will then be removed upon drying, causing higher shrinkage and subsequence cracking.
Compressive strength values of 26 MPa, 21 MPa, and 13 MPa were obtained for M, MCWSs10 and MPG10 mortars, respectively. These values are admissible for applications in construction. Following the EN-1992-1-1 [47] mortar can be used in structural applications, while the others (strength values between 10–25 MPa) could be employed as non-structural material. These values can be improved in further trials, by playing with the binder: aggregates ratio and adjusting the particle size distributions. The mortars can be seen in Figure S2, in the supplementary material.
The apparent density of the studied specimens, as well as their water absorption by total immersion are shown in Figure 8. The apparent density of pastes and mortars varied between 1.9 and 2.1 g/cm3. The apparent density of R was 2.02 g/cm3. Looking at the specimens with PG, the incorporation of 5 wt.% of PG (PG5) slightly increased the apparent density (2.06 g/cm3) in comparison with R, but when 10 wt.% and 20 wt.% (PG10 and PG20) was incorporated, apparent density decreased to 1.91 g/cm3. For samples with CWS, the density slightly decreased from 2.00 to 1.97 g/cm3 when 5 wt.% and 10 wt.% of sludge was incorporated. CWSs10 specimen (sieved at 63 µm) is slightly denser (2.06 g/cm3), confirming its higher compactness. Differences between the prepared mortars (M, MPG10 and MCWSs10) are coherent with the variations of the respective pastes.
Water absorption is directly related to the open porosity of the samples (see Table S1 in the supplementary material). In general, denser pastes tend to absorb less water. For the PG5, PG10 and PG20, the apparent porosity increased from 2.8% to 12% (Table S1), explaining the decrease in the specimens’ compressive strength (see Figure 7). Minor differences were seen between the apparent density of the specimens CWS5 and CWS10, at 2.9% and 3.6%, respectively. These results are in line with the similar values observed for the samples’ compressive strength. The only exception is the CWSs10 (P = 2.8%) sample, due to the above-mentioned formation of microcracks. All mortars showed higher water absorption values since the use of coarse aggregates tends to create porosity. Apparent porosity values of 6%, 7% and 11% were obtained for M, MCWSs10 and MPG10 mortars, respectively, explaining their lower mechanical resistance, as already discussed in Figure 7.
Most of the prepared specimens show good quality, with water absorption of less than 3%. Only those specimens that exhibit water absorption values greater than 5% might have significant compressive strength deterioration [48,49]. For conventional (two-part) geopolymers, reported water absorption values are between 5 and 11% [50,51].
Figure 9 illustrates the data of the performed capillarity tests. The capillarity coefficients of the specimens were determined through the slope of the straight line linking the representative points of the measurements performed at 10 min and 90 min. The capillarity coefficient of M, MPG10 and MCWSs10 is 0.08 kg/m2min0.5, 0.09 kg/m2min0.5 and 0.10 kg/m2min0.5, respectively. These results agree with the ones reported in a previous work [38] and are lower than those reported for OPC mortars (0.5–0.9 kg/m2min0.5) [28,52], and for conventional geopolymers (0.3–0.5 kg/m2min0.5) [28,51,53].
The X-ray diffraction patterns for the most representative specimens are shown in Figure 1. Gypsum (CaSO4·2H2O) and calcite (CaCO3) were the only two crystalline phases identified in the R, agreeing with the crystalline phases identified in BFS. In PG10 specimen calcite has the only detected crystalline phase, while in PG20 CaSO4·2H2O was also detected. In CWS10 sample gypsum, calcite and bernalite (Fe(OH)3) were detected, but this last phase was not identified in CWSs10. These data suggest that identified crystalline phases can be inherited from the raw materials (that remain partially unreacted) or might result from recrystallization after the geopolymerization process [27,51,54].
Geopolymerization products are mainly amorphous, like cement hydrates. FTIR-ATR spectra of the most representative specimens after 28 days of curing are shown in Figure 10. Absorption bands located between 3000–1647 cm−1 correspond to stretching vibrations of O-H and O-H-O groups, indicating the presence of water molecules [55,56]. The peak observed around 1398 cm−1 is probably due to the asymmetric stretching of the O-C-O bonds, suggesting the presence of calcite from the raw materials (BFS or CWS) or superficial carbonation of the specimens during curing [55,57,58]. Absorption bands located between 1130–1040 cm−1 are attributed to the asymmetric stretching vibrations of the Si-O-T bonds (T = Si or Al tetrahedral units), indicating the formation of a geopolymeric structure [38,55,57,58,59]. The absorption bands between 803–761cm−1 are related to the Al-O and Si-O symmetric stretching vibrations and the bands around 626–523 cm−1 are assigned to the symmetric stretching vibrations of Si–O–Si and Al–O–Si groups, corresponding to the formation of a geopolymeric network [55,60,61]. The changes in the peaks’ intensities are probably due to the structural reorganization of the geopolymer matrix, giving information on the polymerization degree [55,60]. In Figure 10 it can be seen that the polymerization degree of the PG10 and PG20 specimens is smaller than in SW10 and SWs10 specimens. Whereas R samples had a greater polymerization degree. Observing the peaks intensity, it can be concluded that water content decreased R < CWS10 < CWSs10 < PG10 < PG20.
Figure 11 shows the microstructure of the most representative specimens after 28 days of curing. In general, crystalline phases were not observed in geopolymeric materials. All specimens presented a heterogeneous microstructure composed of geopolymerization gel and partially reacted or unreacted particles. The relative volume of unreacted particles rises with the increase in PG content (PG20 > PG10) and decreases with the use of finer/sieved CWS (CWS10 > CWSs10). Also, a smaller volume of unreacted particles was observed in the reference material (R). A large amount of unreacted particles implies a lower polymerization degree, which affects the compressive strength [55,62]. Furthermore, there are microcracks present in the specimens, suggesting that a change in the curing conditions is needed in future [27].

3.3. Leaching Test

The leaching test results are shown in Table 3. The pH of the leachates varied between 11–12 (highly alkaline), according to the literature [63,64]. The leaching test determined that the reference specimens (R and M) and PG specimens (PG5, PG10 and WPG10) produce leachates with low contents of pollutants, according to the thresholds established in the Directive 2003/33/EC [65], which defines the threshold concentration for non-hazardous (NHM) and hazardous materials (HM). In PG specimens, the leached amount of S (as SO42−) is moderately high but does not exceed the established thresholds. CWS-containing samples can be considered hazardous since the leached concentration of As exceeds 2 mg/kg. Only the CWSs10 sample is within the limit, certainly because of its higher compactness. This occurred despite the identification of microcracks in the sample. However, the higher porosity of the mortar formulated with that paste (MCWSs10) was responsible for the high leached amount from the sample. Consequently, the immobilization of As in such geopolymer matrixes may be possible, but further studies are necessary to determine the optimal processing conditions (e.g., fineness of components, curing conditions, etc.).
Fernández-Jiménez et al. [17] studied the fixation of arsenic in cementitious material activated by alkali, also obtaining a high content of leached As (50–90 mg/L), higher than the content of leached As for all the specimens in this study. However, it is essential to note that they used the TCLP method [66]. Álvarez-Ayuso et al. [67] carried out a leaching test similar to the one used in the present work using distilled water as extraction fluid. These authors observed that elements, such as Ni, Cu, Zn and Pb, had low leaching (<0.2 mg/kg) and oxyanions (As, Se, Sb) had higher leaching (>0.2 mg/kg), especially high release for As were found. Some studies suggest that a low porosity favours the immobilization of oxyanions [13,18,67].

4. Conclusions

Blast furnace slag-based one-part geopolymers were successfully processed showing interesting mechanical properties. Two hazardous wastes, copper wastewater sludge (CWS) and phosphogypsum (PG) were used to partially replace BFS in the geopolymer formulations, with the aim of immobilizing the hazardous species of the wastes. In particular, the immobilization of As from CWS is a challenge.
PG-containing pastes (PG5, PG10 and PG20) showed notable compressive strength reductions, from 67 MPa to 19 MPa, due to the presence/role of calcium sulphate in the waste. The setting was delayed, and the spread increased with the amount of PG. The MPG10 mortar also showed a large reduction (50%) in the mechanical resistance when compared with the reference mortar (26 MPa). In this case, construction applications are envisaged.
In CWS-containing pastes, the increase in sludge content from 5 to 10 wt.% did not alter the compressive strength of the specimens (with values around 50 MPa). The attempt to improve the compactness of the samples by using sieved sludge (CWSs10) generated microcracks upon drying/curing, and the mechanical strength reduced to 31 MPa. The corresponding mortar had a strength of 21 MPa and could be applied in the construction sector. In the fresh state, samples show properties (setting time and spread on flow table) similar to the reference, with the calorimetric behaviour also being close.
The leaching tests showed that pastes and mortars immobilize the hazardous species of the wastes, excepting As from CWS. Therefore, the PG immobilization in the geopolymer matrix has been effective since their leachates had low toxic species concentrations. On the other hand, the CWS immobilization was not successfully achieved since most leachates contained high As concentration. Only the most compact paste (CWSs10) leached 2 mg/kg of As, a value that coincides with the threshold limit for non-hazardous materials. In contrast, it was observed that other toxic species such as Cr, Cu, Ni and Pb had been immobilized. Therefore, further studies are necessary to determine the optimal processing conditions (e.g., fineness of components, curing conditions, etc.) to increase the immobilization efficiency, especially for arsenic.

Supplementary Materials

The following are available online at https://www.mdpi.com/article/10.3390/su132313455/s1.

Author Contributions

Conceptualization, D.C.P.-G., I.S.V., S.M.P.-M., J.C., J.L.G., M.P.S., J.P.B. and J.A.L.; Data curation, D.C.P.-G., I.S.V. and J.C.; Formal analysis, D.C.P.-G., I.S.V., J.C., R.M.N., M.P.S., G.R., J.P.B. and J.A.L.; Funding acquisition, J.P.B. and J.A.L.; Investigation, D.C.P.-G., I.S.V., J.C. and J.A.L.; Methodology, D.C.P.-G., I.S.V., J.C. and M.P.S.; Project administration, J.P.B. and J.A.L.; Resources, M.P.S. and J.P.B.; Supervision, I.S.V., S.M.P.-M., M.P.S., J.P.B. and J.A.L.; Validation, D.C.P.-G., I.S.V. and J.C.; Visualization, M.P.S., J.P.B. and J.A.L.; Writing—original draft, D.C.P.-G., I.S.V. and J.C.; Writing—review & editing, S.M.P.-M., J.L.G., R.M.N., M.P.S., G.R., J.P.B. and J.A.L. All authors have read and agreed to the published version of the manuscript.

Funding

This research was funded by Ministerio de Ciencia e Innovación (MICINN), grant number PID2020-116461RB-C21 and Agencia de Innovación y Desarrollo de Andalucía (IDEA) grant number UHU-1255876. This work was done in the scope of the project CICECO- Aveiro Institute of Materials, UIDB/50011/2020 & UIDP/50011/2020, co-financed by national funds through the FCT/MEC. This research was funded by FCT (Portuguese Foundation for Science and Technology), grant number 2020.01135.CEECIND (R.M.N.) and SFRH/BD/144562/2019 (J.C.).

Institutional Review Board Statement

Not applicable.

Informed Consent Statement

Not applicable.

Data Availability Statement

Data sharing is not applicable to this article.

Acknowledgments

The authors gratefully acknowledge Atlantic Copper S.L.U for providing the waste (CWS), Huelva University for providing waste (PG) from Huelva phosphogypsum stacks and the collaboration with the Department of Materials Engineering of the University of Aveiro, Portugal.

Conflicts of Interest

The authors declare no conflict of interest.

References

  1. Auping, W.L.; Pruyt, E.; Kwakkel, J.H. Analysing the Uncertain Future of Copper with Three Exploratory System Dynamics Models. In Proceedings of the International System Dynamics Conference, St. Gallen, Switzerland, 22–26 July 2012; pp. 1–25. [Google Scholar]
  2. Schipper, B.W.; Lin, H.C.; Meloni, M.A.; Wansleeben, K.; Heijungs, R.; van der Voet, E. Estimating Global Copper Demand until 2100 with Regression and Stock Dynamics. Resour. Conserv. Recycl. 2018, 132, 28–36. [Google Scholar] [CrossRef]
  3. International Copper Study Group (ICSG). The World Copper Factbook 2020; ICSG: Lisbon, Portugal, 2020. [Google Scholar]
  4. Khan, S.A.R.; Yu, Z.; Sharif, A.; Golpîra, H. Determinants of Economic Growth and Environmental Sustainability in South Asian Association for Regional Cooperation: Evidence from Panel ARDL. Environ. Sci. Pollut. Res. 2020, 27, 45675–45687. [Google Scholar] [CrossRef] [PubMed]
  5. Liao, M.I.; Shih, X.H.; Ma, H. wen Secondary Copper Resource Recycling and Reuse: A Waste Input–Output Model. J. Clean. Prod. 2019, 239, 118142. [Google Scholar] [CrossRef]
  6. Atlantic Copper. Annual Environmental Report; Atlantic Copper: Huelva, Spain, 2017. [Google Scholar]
  7. Pérez-Moreno, S.M.; Gázquez, M.J.; Pérez-López, R.; Vioque, I.; Bolívar, J.P. Assessment of Natural Radionuclides Mobility in a Phosphogypsum Disposal Area. Chemosphere 2018, 211, 775–783. [Google Scholar] [CrossRef] [PubMed]
  8. Bolívar, J.P.; Martín, J.E.; García-Tenorio, R.; Pérez-Moreno, J.P.; Mas, J.L. Behaviour and Fluxes of Natural Radionuclides in the Production Process of a Phosphoric Acid Plant. Appl. Radiat. Isot. 2009, 67, 345–356. [Google Scholar] [CrossRef]
  9. Guerrero, J.L.; Gutiérrez-Álvarez, I.; Mosqueda, F.; Gázquez, M.J.; García-Tenorio, R.; Olías, M.; Bolívar, J.P. Evaluation of the Radioactive Pollution in the Salt-Marshes under a Phosphogypsum Stack System. Environ. Pollut. 2020, 258, 113729. [Google Scholar] [CrossRef]
  10. Shively, W.; Bishop, P.; Gress, D.; Brown, T. Leaching Tests of Heavy Metals Stabilized with Portland Cement. J. Water Pollut. Control Fed. 1986, 58, 234–241. [Google Scholar]
  11. Chen, Q.Y.; Tyrer, M.; Hills, C.D.; Yang, X.M.; Carey, P. Immobilisation of Heavy Metal in Cement-Based Solidification/Stabilisation: A Review. Waste Manag. 2009, 29, 390–403. [Google Scholar] [CrossRef] [PubMed]
  12. Al-Kindi, G.Y. Evaluation the Solidification/Stabilization of Heavy Metals by Portland Cement. J. Ecol. Eng. 2019, 20, 91–100. [Google Scholar] [CrossRef]
  13. Provis, J.L.; Van Deventer, J.S.J. Alkali Activated Materials, 1st ed.; Provis, J.L., van Deventer, J.S.J., Eds.; RILEM State-of-the-Art Reports; Springer: Dordrecht, The Netherlands, 2014; Volume 13, ISBN 978-94-007-7671-5. [Google Scholar]
  14. Minaříková, M.; Škvára, F. Fixation of Heavy Metals in Geopolymeric Materials Based on Brown Coal Fly Ash. Ceram.-Silik. 2006, 50, 200–207. [Google Scholar]
  15. Van Jaarsveld, J.G.S.; Van Deventer, J.S.J.; Lorenzeni, L. The Potential Use of Geopolymeric Materials To Immobilise Toxic Metals: Part I. Theory and Applications. Miner. Eng. 1997, 10, 659–669. [Google Scholar] [CrossRef]
  16. Bankowski, P.; Zou, L.; Hodges, R. Using Inorganic Polymer to Reduce Leach Rates of Metals from Brown Coal Fly Ash. Miner. Eng. 2004, 17, 159–166. [Google Scholar] [CrossRef]
  17. Fernández-Jiménez, A.; Palomo, A.; Macphee, D.E.; Lachowski, E.E. Fixing Arsenic in Alkali-Activated Cementitious Matrices. J. Am. Ceram. Soc. 2005, 88, 1122–1126. [Google Scholar] [CrossRef]
  18. Vu, T.H.; Gowripalan, N. Mechanisms of Heavy Metal Immobilisation Using Geopolymerisation Techniques—A Review. J. Adv. Concr. Technol. 2018, 16, 124–135. [Google Scholar] [CrossRef] [Green Version]
  19. Vaičiukynienė, D.; Nizevičienė, D.; Kielė, A.; Janavičius, E.; Pupeikis, D. Effect of Phosphogypsum on the Stability upon Firing Treatment of Alkali-Activated Slag. Constr. Build. Mater. 2018, 184, 485–491. [Google Scholar] [CrossRef]
  20. Gijbels, K.; Iacobescu, R.I.; Pontikes, Y.; Schreurs, S.; Schroeyers, W. Alkali-Activated Binders Based on Ground Granulated Blast Furnace Slag and Phosphogypsum. Constr. Build. Mater. 2019, 215, 371–380. [Google Scholar] [CrossRef]
  21. Rashad, A.M. Potential Use of Phosphogypsum in Alkali-Activated Fly Ash under the Effects of Elevated Temperatures and Thermal Shock Cycles. J. Clean. Prod. 2015, 87, 717–725. [Google Scholar] [CrossRef]
  22. Li, Y.C.; Min, X.B.; Ke, Y.; Chai, L.Y.; Shi, M.Q.; Tang, C.J.; Wang, Q.W.; Liang, Y.J.; Lei, J.; Liu, D.G. Utilization of Red Mud and Pb/Zn Smelter Waste for the Synthesis of a Red Mud-Based Cementitious Material. J. Hazard. Mater. 2018, 344, 343–349. [Google Scholar] [CrossRef]
  23. Chen, M.; Zhang, Z.; Hu, X.; Tian, J.; Wang, J.; Wan, R.; Cui, X.; Zhou, X.; Liu, D. Adsorption of Si(OH)4 and Al(OH)4 onto Arsenopyrite Surface: Exploring the Sealing Feasibility of Geopolymer to Arsenopyrite. Miner. Eng. 2021, 170, 107017. [Google Scholar] [CrossRef]
  24. Zhou, X.; Zhang, Z.F.; Yang, H.; Bao, C.J.; Wang, J.S.; Sun, Y.H.; Liu, D.W.; Shen, P.L.; Su, C. Red Mud-Metakaolin Based Cementitious Material for Remediation of Arsenic Pollution: Stabilization Mechanism and Leaching Behavior of Arsenic in Lollingite. J. Environ. Manag. 2021, 300, 113715. [Google Scholar] [CrossRef]
  25. Yang, K.H.; Song, J.K.; Song, K. Il Assessment of CO2 Reduction of Alkali-Activated Concrete. J. Clean. Prod. 2013, 39, 265–272. [Google Scholar] [CrossRef]
  26. Assi, L.; Carter, K.; Deaver, E.; Anay, R.; Ziehl, P. Sustainable Concrete: Building a Greener Future. J. Clean. Prod. 2018, 198, 1641–1651. [Google Scholar] [CrossRef]
  27. Luukkonen, T.; Abdollahnejad, Z.; Yliniemi, J.; Kinnunen, P.; Illikainen, M. Comparison of Alkali and Silica Sources in One-Part Alkali-Activated Blast Furnace Slag Mortar. J. Clean. Prod. 2018, 187, 171–179. [Google Scholar] [CrossRef]
  28. Mobili, A.; Telesca, A.; Marroccoli, M.; Tittarelli, F. Calcium Sulfoaluminate and Alkali-Activated Fly Ash Cements as Alternative to Portland Cement: Study on Chemical, Physical-Mechanical, and Durability Properties of Mortars with the Same Strength Class. Constr. Build. Mater. 2020, 246, 118436. [Google Scholar] [CrossRef]
  29. Komnitsas, K.; Zaharaki, D. Geopolymerisation: A Review and Prospects for the Minerals Industry. Miner. Eng. 2007, 20, 1261–1277. [Google Scholar] [CrossRef]
  30. Duxson, P.; Fernández-Jiménez, A.; Provis, J.L.; Lukey, G.C.; Palomo, A.; Van Deventer, J.S.J. Geopolymer Technology: The Current State of the Art. J. Mater. Sci. 2007, 42, 2917–2933. [Google Scholar] [CrossRef]
  31. Luukkonen, T.; Abdollahnejad, Z.; Yliniemi, J.; Kinnunen, P.; Illikainen, M. One-Part Alkali-Activated Materials: A Review. Cem. Concr. Res. 2018, 103, 21–34. [Google Scholar] [CrossRef]
  32. Hajimohammadi, A.; van Deventer, J.S.J. Characterisation of One-Part Geopolymer Binders Made from Fly Ash. Waste Biomass Valorization 2017, 8, 225–233. [Google Scholar] [CrossRef]
  33. CEN: European Committee for Standardization. EN 1015-3 Methods of Test for Mortar for Masonry—Part 3: Determination of Consistence of Fresh Mortar (by Flow Table), Brussels; CEN: Brussels, Belgium, 1998; p. 9. [Google Scholar]
  34. CEN: European Committee for Standardization. EN 196-3 Methods of Testing Cement Part 3—Determination of Setting Times and Soundness; CEN: Brussels, Belgium, 2005; p. 3. [Google Scholar]
  35. CEN: European Committee for Standardization. EN 1015-11 Methods of Test for Mortar for Masonry—Part 11: Determination of Flexural and Compressive Strength of Hardened Mortar; CEN: Brussels, Belgium, 1999; p. 15. [Google Scholar]
  36. CEN: European Committee for Standardization. EN 1015-18 Methods of Test for Mortar for Masonry Part 18—Determination of Water- Absorption Coefficient Due to Capillary Action of Hardened Mortar; CEN: Brussels, Belgium, 2002; p. 8. [Google Scholar]
  37. CEN: European Committee for Standardization. EN 12457-2 Leaching—Compliance Test for Leaching of Granular Waste Materials and Sludges—Part 2: One Stage Batch Test at a Liquid to Solid Ratio of 10 L/Kg for Materials with Particle Size below 4 Mm (without or with Size Reduction); CEN: Brussels, Belgium, 2002; p. 30. [Google Scholar]
  38. Gonçalves, M.; Vilarinho, I.S.; Capela, M.; Caetano, A.; Novais, R.M.; Labrincha, J.A.; Seabra, M.P. Waste-Based One-Part Alkali Activated Materials. Materials 2021, 14, 2911. [Google Scholar] [CrossRef] [PubMed]
  39. CEN: European Committee for Standardization. EN 197-1 Cement—Part 1: Composition, Specifications and Conformity Criteria for Common Cements; CEN: Brussels, Belgium, 2000; p. 38. [Google Scholar]
  40. Sambucci, M.; Sibai, A.; Valente, M. Recent Advances in Geopolymer Technology. A Potential Eco-Friendly Solution in the Construction Materials Industry: A Review. J. Compos. Sci. 2021, 5, 109. [Google Scholar] [CrossRef]
  41. Assi, L.N.; Eddie Deaver, E.; Ziehl, P. Effect of Source and Particle Size Distribution on the Mechanical and Microstructural Properties of Fly Ash-Based Geopolymer Concrete. Constr. Build. Mater. 2018, 167, 372–380. [Google Scholar] [CrossRef]
  42. Lancellotti, I.; Barbieri, L.; Leonelli, C. Use of Alkali-Activated Concrete Binders for Toxic Waste Immobilization; Woodhead Publishing Limited: Sawston, UK, 2015; ISBN 9781782422884. [Google Scholar]
  43. Rattanasak, U.; Pankhet, K.; Chindaprasirt, P. Effect of Chemical Admixtures on Properties of High-Calcium Fly Ash Geopolymer. Int. J. Miner. Metall. Mater. 2011, 18, 364–369. [Google Scholar] [CrossRef]
  44. Zhang, P.; Zheng, Y.; Wang, K.; Zhang, J. A Review on Properties of Fresh and Hardened Geopolymer Mortar. Compos. Part B Eng. 2018, 152, 79–95. [Google Scholar] [CrossRef]
  45. Criado, M.; Walkley, B.; Ke, X.; Provis, J.L.; Bernal, S.A. Slag and Activator Chemistry Control the Reaction Kinetics of Sodium Metasilicate-Activated Slag Cements. Sustainability 2018, 10, 4709. [Google Scholar] [CrossRef] [Green Version]
  46. Lee, S.; van Riessen, A.; Chon, C.M. Benefits of Sealed-Curing on Compressive Strength of Fly Ash-Based Geopolymers. Materials 2016, 9, 598. [Google Scholar] [CrossRef] [Green Version]
  47. CEN: European Committee for Standardization. EN 1992-1-1 Eurocode 2: Design of Concrete Structures—Part 1-1: General Rules and Rules for Buildings; CEN: Brussels, Belgium, 2004; Volume 1. [Google Scholar]
  48. Yahya, Z.; Abdullah, M.M.A.B.; Talib, S.Z.A.; Razak, R.A. Comparative Study on Early Strength of Sodium Hydroxide (NaOH) Activated Fly Ash Based Geopolymer. AIP Conf. Proc. 2017, 1887, 6–11. [Google Scholar] [CrossRef] [Green Version]
  49. Vilarinho, I.S.; Carneiro, J.; Pinto, C.; Labrincha, J.A.; Seabra, M.P. Development of Coloured Stoneware Bodies through the Incorporation of Industrial Cr/Ni Electroplating Sludge. Sustainability 2021, 13, 1999. [Google Scholar] [CrossRef]
  50. Mermerdaş, K.; Manguri, S.; Nassani, D.E.; Oleiwi, S.M. Effect of Aggregate Properties on the Mechanical and Absorption Characteristics of Geopolymer Mortar. Eng. Sci. Technol. Int. J. 2017, 20, 1642–1652. [Google Scholar] [CrossRef]
  51. Novais, R.M.; Carvalheiras, J.; Senff, L.; Labrincha, J.A. Upcycling Unexplored Dregs and Biomass Fly Ash from the Paper and Pulp Industry in the Production of Eco-Friendly Geopolymer Mortars: A Preliminary Assessment. Constr. Build. Mater. 2018, 184, 464–472. [Google Scholar] [CrossRef]
  52. Deboucha, W.; Leklou, N.; Khelidj, A.; Oudjit, M.N. Natural Pozzolana Addition Effect on Compressive Strength and Capillary Water Absorption of Mortar. Energy Procedia 2017, 139, 689–695. [Google Scholar] [CrossRef]
  53. Saeli, M.; Senff, L.; Seabra, M.P.; Labrincha, J.A. Alkali-Activated Fly Ash-Based Mortars for Green Applications in Architecture and Civil Engineering. Int. J. Struct. Civ. Eng. Res. 2019, 8, 1–9. [Google Scholar] [CrossRef]
  54. Mádai, F.; Kristály, F.; Mucsi, G. Microstructure, Mineralogy and Physical Properties of Ground Fly Ash Based Geopolymers. Ceram.-Silik. 2015, 59, 70–79. [Google Scholar]
  55. Qiu, J.; Zhao, Y.; Xing, J.; Sun, X. Fly Ash/Blast Furnace Slag-Based Geopolymer as a Potential Binder for Mine Backfilling: Effect of Binder Type and Activator Concentration. Adv. Mater. Sci. Eng. 2019, 2019, 2028109. [Google Scholar] [CrossRef] [Green Version]
  56. Abdollahnejad, Z.; Pacheco-Torgal, F.; Aguiar, J.B.; Jesus, C. Durability Performance of Fly Ash Based One-Part Geopolymer Mortars. Key Eng. Mater. 2015, 634, 113–120. [Google Scholar] [CrossRef] [Green Version]
  57. Bernal, S.A.; Provis, J.L.; Rose, V.; Mejía De Gutierrez, R. Evolution of Binder Structure in Sodium Silicate-Activated Slag-Metakaolin Blends. Cem. Concr. Compos. 2011, 33, 46–54. [Google Scholar] [CrossRef]
  58. Buruberri, L.H.; Tobaldi, D.M.; Caetano, A.; Seabra, M.P.; Labrincha, J.A. Evaluation of Reactive Si and Al Amounts in Various Geopolymer Precursors by a Simple Method. J. Build. Eng. 2019, 22, 48–55. [Google Scholar] [CrossRef]
  59. Hakem Aziz, I.; Mustafa Al Bakri Abdullah, M.; Arif Anuar Mohd Salleh, M.; Victor Sandu, A. The Incorporation of Sodium Hydroxide (NaOH) Concentration and CaO-Si Components on Ground Granulated Blast Furnace Slag Geopolymers. IOP Conf. Ser. Mater. Sci. Eng. 2020, 864, 012005. [Google Scholar] [CrossRef]
  60. Kumar, S.; Kumar, R. Mechanical Activation of Fly Ash: Effect on Reaction, Structure and Properties of Resulting Geopolymer. Ceram. Int. 2011, 37, 533–541. [Google Scholar] [CrossRef]
  61. Panias, D.; Giannopoulou, I.P.; Perraki, T. Effect of Synthesis Parameters on the Mechanical Properties of Fly Ash-Based Geopolymers. Colloids Surfaces A Physicochem. Eng. Asp. 2007, 301, 246–254. [Google Scholar] [CrossRef]
  62. Yousefi Oderji, S.; Chen, B.; Ahmad, M.R.; Shah, S.F.A. Fresh and Hardened Properties of One-Part Fly Ash-Based Geopolymer Binders Cured at Room Temperature: Effect of Slag and Alkali Activators. J. Clean. Prod. 2019, 225, 1–10. [Google Scholar] [CrossRef]
  63. Xu, P.; Zhao, Q.; Qiu, W.; Xue, Y. The Evaluation of the Heavy Metal Leaching Behavior of Mswi-Fa Added Alkali-Activated Materials Bricks by Using Different Leaching Test Methods. Int. J. Environ. Res. Public Health 2019, 16, 1151. [Google Scholar] [CrossRef] [PubMed] [Green Version]
  64. Keulen, A.; van Zomeren, A.; Dijkstra, J.J. Leaching of Monolithic and Granular Alkali Activated Slag-Fly Ash Materials, as a Function of the Mixture Design. Waste Manag. 2018, 78, 497–508. [Google Scholar] [CrossRef] [PubMed]
  65. Council of the European Union Directive. 2003/33/EC of 19 December 2002 Establishing Criteria and Procedures for the Acceptance of Waste at Landfills Pursuant to Article 16 of and Annex II to Directive 1999/31/EC. Off. J. Eur. Communities 2003, 11, 27–49. [Google Scholar]
  66. US EAP. SW-846 Test Method 1311: Toxicity Characteristic Leaching Procedure; US EAP: Washington, DC, USA, 1992.
  67. Álvarez-Ayuso, E.; Querol, X.; Plana, F.; Alastuey, A.; Moreno, N.; Izquierdo, M.; Font, O.; Moreno, T.; Diez, S.; Vázquez, E.; et al. Environmental, Physical and Structural Characterisation of Geopolymer Matrixes Synthesised from Coal (Co-)Combustion Fly Ashes. J. Hazard. Mater. 2008, 154, 175–183. [Google Scholar] [CrossRef] [PubMed]
Figure 1. XRD patterns of the raw materials (BFS, PG and CWS) and the R, PG10, PG20, SW10 and SWs10 specimens. Minerals phases identified: gypsum-CaSO4 × 2H2O (■), calcite-CaCO3 (▲), iron oxide hydroxide-Fe21O31(OH) (●) and portlandite-Ca(OH)2 (♦).
Sustainability 13 13455 g001
Figure 2. Particle size distribution of BFS and wastes: PG and CWS.
Sustainability 13 13455 g002
Figure 3. SEM images of PG and CWS.
Sustainability 13 13455 g003
Figure 4. Flow diameters of the specimens (pastes and mortars).
Sustainability 13 13455 g004
Figure 5. Setting times of prepared mortars.
Sustainability 13 13455 g005
Figure 6. Calorimetry curves upon the first 24 h of curing for selected specimens: R, PG10 and CWSs10.
Sustainability 13 13455 g006
Figure 7. Compressive strength at 7 and 28 days of curing of geopolymer: pastes and mortars.
Sustainability 13 13455 g007
Figure 8. Apparent density and water absorption by total immersion of samples cured for 28 days.
Sustainability 13 13455 g008
Figure 9. Capillarity of mortars after 28 days of curing.
Sustainability 13 13455 g009
Figure 10. FTIR-ATR spectra of specimens without sand: R, PG10, PG20, CWS10 and CWSs10.
Sustainability 13 13455 g010
Figure 11. SEM images of the specimens: R, PG10, PG20, CWS10 and CWSs10.
Sustainability 13 13455 g011
Table 1. Compositions of specimens and designation.
Specimen NameMixture Proportion (g)
BFSWasteSodium metasilicateSandWater/Binder
PastesR100-10-0.38
PG59550.37
PG1090100.36
PG2080200.38
CWS59550.38
CWS1090100.39
CWSs1090100.38
MortarsM100-104000.71
MPG1090100.71
MCWSs1090100.71
Table 2. Chemical composition of the materials used in the preparation of geopolymers, estimated by XRF (major components represented as oxides).
BFSPGCWS BFSPGCWS
Major Components wt. %Minor Componentswt. %
Al2O39.10.400.40As--3.4
CaO474069Ba0.060.020.80
Fe2O30.330.2315Ce0.04--
K2O0.580.03-Cl0.02-0.36
MgO6.70.043.6Cu-0.010.65
MnO0.21-0.09F-3.3-
Na2O0.230.130.24Pb--0.29
P2O50.010.950.14Sb--0.06
SiO2332.42.3Sr0.060.080.05
SO31.7523.8Zn--0.34
TiO20.800.04-Zr0.020.01-
LOI0.202.436
Table 3. Leaching results for all specimens. The concentrations are expressed in mg of element leached per kg of original material, according with Directive 2003/33/EC. Colour system: elements that are below established thresholds (green), close (yellow), above (red) and elements not regulated (blue).
RPG5PG10PG20CWS5CWS10CWSs10MMPG10MCWSs10NHMHM
ElementLeached Concentration (mg/kg)
As----13.4 ± 0.340 ± 32.01 ± 0.02--34.8 ± 0.2225
Ba----------100300
Br0.10 ± 0.010.21 ± 0.010.19 ± 0.10.11 ± 0.01---0.11 ± 0.010.04 ± 0.01---
Ca25 ± 249 ± 1812 ± 1117 ± 127 ± 322 ± 219.3 ± 0.29.2 ± 0.245.0 ± 0.210.7 ± 0.2--
Cd----------15
Cl6.7 ± 0.114.4 ± 0.4--17.0 ± 0.324 ± 18.8 ± 0.3--1.5 ± 0.315,00025,000
Cr0.05 ± 0.01---------1070
Cu----0.07 ± 0.010.14 ± 0.010.03 ± 0.01--0.42 ± 0.0250100
Fe0.68 ± 0.040.27 ± 0.010.3 ± 0.11.21 ± 0.010.32 ± 0.030.20 ± 0.010.26 ± 0.010.13 ± 0.020.11 ± 0.010.49 ± 0.02--
Hg-0.09 ± 0.020.10 ± 0.040.14 ± 0.01------0.22
K105 ± 398 ± 251 ± 751 ± 1103 ± 1106 ± 674.2 ± 0.418.5 ± 0.432.1 ± 0.212.4 ± 0.3--
Mo----------1030
Ni0.03 ± 0.010.06 ± 0.010.03 ± 0.010.02 ± 0.01-0.02 ± 0.01----1040
Pb----------1050
Rb0.35 ± 0.010.35 ± 0.010.30 ± 0.010.42 ± 0.010.44 ± 0.010.45 ± 0.010.33 ± 0.010.13 ± 0.010.10 ± 0.010.06 ± 0.01--
S-372 ± 24880 ± 220853 ± 483 ± 390 ± 923 ± 1-647 ± 270 ± 1--
SO42−-1100 ± 702600 ± 6602500 ± 12250 ± 9271 ± 2770 ± 3-1900 ± 6210 ± 320,00050,000
Sb----------0.75
Se0.01 ± 0.010.01 ± 0.010.02 ± 0.01-0.08 ± 0.010.21 ± 0.010.01 ± 0.01--0.20 ± 0.010.57
Sr0.08 ± 0.010.17 ± 0.040.08 ± 0.011.51 ± 0.02-0.11 ± 0.01--0.16 ± 0.01---
Ti0.99 ± 0.010.11 ± 0.020.17 ± 0.030.16 ± 0.020.10 ± 0.020.13 ± 0.020.14 ± 0.02-----
V0.14 ± 0.040.13 ± 0.020.14 ± 0.01-0.06 ± 0.020.19 ± 0.01------
Zn0.01 ± 0.01---0.01 ± 0.010.03 ± 0.010.02 ± 0.01--0.06 ± 0.0150200
Publisher’s Note: MDPI stays neutral with regard to jurisdictional claims in published maps and institutional affiliations.

