2. Literature Overview
The use of machine translation in everyday communication and issues related thereof [
5,
6,
7,
8] constitute an emerging research area in the contemporary academic field of translation. Machine translation in everyday personal communication is usually applied while communicating with overseas relatives or traveling. However, the acceptability of such experiences can be mixed [
8]. Success was reported when using machine translation apps to communicate with relatives overseas; however, participants struggled between the spoken and written forms of languages, and issues appeared relating to grammar and syntax, making communication difficult [
8].
Machine translation is a widely used tool for multilingual groups because it allows all members to speak (write) and listen (read) in almost any language [
5,
9]. When machine translation is used for multilingual communication purposes, it is critical that the quality of machine translation is excellent. However, not every user is aware of the errors and risks related to this technology when it comes to everyday usage; according to research, the quality of today’s machine translation systems is insufficient for supporting intercultural conversation [
10]. Many authors pay attention to the serious risks that machine translation errors pose in the field of health care, legal services, culture and media as well as many areas of social life [
1,
11,
12]. The misuse of machine translation can have particularly serious consequences in high-stakes settings [
1]. Rossetti et al. [
13] also focused on risk involving contexts and performed a study to learn more about the role and impact of machine translation and post-editing knowledge on public understanding and confidence in communications messages broadcast for alerting the public about a certain emergency. They [
13] asked 61 people to read crisis communication messages and rate comprehensibility and trust in the messages using ratings and open-ended questions. The most common explanation of why the participants used machine translation was assimilation, which demonstrated that the end users were potentially using machine translation to translate crisis messages provided in a language they were unfamiliar with [
13]. Overall, machine translation is not only a means for personal or everyday communication but is also being relied on in scenarios of utmost significance.
Despite the fact that machine translation is improving in terms of speed, language compatibility and mobility, it also has some drawbacks in terms of accuracy, and cannot yet totally replace humans unless they develop their language abilities and knowledge and are able to grasp and appropriately use words without the aid of machine translation or without the assistance of a translator [
3]. Therefore, it is necessary to research how people perceive and accept machine translation. According to [
14], the acceptability of machine translation is measured via usability, satisfaction and quality, where usability may be measured via tasks recorded using an eye tracker, quality may be evaluated via a translation quality assessment questionnaire answered by professional translators, and satisfaction may be measured via surveys, post-task questionnaires and translators’ rankings. The study accomplished by [
15] reveals that different languages have different thresholds of machine translation quality [
15]. For example, machine translation will have problems in many languages that contain a lot of homonyms. Vieira et al. [
1] claimed that the results of quality assessments of machine translation for health care tend to be more favorable for language pairs involving English and other Western European languages [
16,
17]. On the other hand, when it comes to minor language use, e.g., Lithuanian–English pair, it is assumed that machine translation systems still need more extensive training to provide high quality of translation [
18].
It is also important to compare not only different language combinations, but also different machine translation systems, which was attempted by [
19], who reviewed two machine translation systems and six types of machine-generated texts in order to see which system is more acceptable and useful from the perspective of the end-user, and found out that Google Translate is more acceptable. Vanjani and Aiken [
20] compared eight translation systems and seven languages in all combinations in order to determine which machine translation system was the most useful to users and found out that Google Translate produced better results overall, although it was more accurate when the source and target languages were similar.
One of the wide areas of application of automated translation is user-generated content. Saadany et al. [
21] tested the ability of a machine translation online system to translate user-generated content. The researchers uncovered a variety of linguistic obstacles in translation and concluded that using neural machine translation technologies to translate raw texts could be harmful, as it could send users a message that is distinct from or even contradicts the intended meaning [
21]. Poncelas et al. [
22] also investigated the use of a machine translation system to translate user-generated content in order to see if machine-translated sentences have the same meaning and are as fluent as the original ones. Despite the fact that the machine translation system produced comprehensible translations, the meaning, connotations and associations expressed by the source sentence were not always the same [
22].
Though research into perception towards machine translation is very recent, there have been several attempts to conduct surveys of users’ views on machine translation and their strategies in assessing such translations. Pérez Macías et al. [
23] with the help of a preliminary survey, selected 10 translators with experience in the migratory context and conducted a qualitative study about translators’ perceptions towards machine translation and post-editing as well as the usefulness of machine translation in the context of migration. The results of their research showed that the translators were aware of the increasing popularity of machine translation and post-editing in the translation market but they had generally negative attitudes towards both machine translation and post-editing [
23]. A theoretical description of the translators’ resistance to post-editing work was attempted by Sakamoto [
24] who relied on Bourdieu’s sociological framework of analysis in order to examine the positions of translators and post-editors in the field of translation and its mechanism of emotional impact. Sakamoto [
24] distinguished the post-editor’s position as a new category of workers in the social system of translation and emphasized the fact that this position in the overall system of post-edited machine translation is yet to be determined.
Translation quality was also at the focus of the study carried out by Gaspari et al. [
25] who surveyed a group of 438 translators, teachers and language service providers. According to the study, the majority of respondents (68%) used free online machine translation systems and acknowledged that these were not adapted to their needs. Garcia [
26] suggested that rather than assessing the quality of translation using criteria for human translation assessment, a more pragmatic approach should be taken so that the translation is understood “by the educated bilingual rather than by the professional translator” [
26] (p. 10). The assessment of quality, therefore, needs to not only reflect the context of the source document, but also the simplicity of the language [
12]. Rossi and Chevrot [
27] researched the current usage, perceptions and acceptance of machine translation and post-editing in 15 language departments at the European Commission by carrying out a survey analysis and conducting interviews in addition to other methods. The researchers have found out that technology adoption was high but the perceptions of machine translation had a significant impact on the perceived usefulness of machine translation [
27]. Other researchers conducted studies on how end-users evaluate machine translation [
28,
29] and concluded that machine translation technology has made people’s daily work easier by offering quick access to information collection, processing and communication, but it is not free of biases affecting users and society as a whole. Therefore, bearing in mind that machine translation is designed for people and by people, it is critical to consider the backgrounds of those working in machine translation development at all levels and those using machine translation for various purposes and contexts.
There is also a growing body of research on how machine translation can be implemented for various purposes in multilingual settings, e.g., in healthcare systems [
12,
30], legal spheres [
31], migratory contexts [
23,
32] and other areas, which have prompted investigations on how machine translation is used in a certain context or how it is perceived or assessed [
1]. Thus, in a broad sense, the usability, quality and user satisfaction with end machine translation and the impact it has on society belong to a research field that comes into focus and deserves a deeper analysis. Therefore, it is essential to create sustainable measures in order to reduce risks associated with the misuse of machine translation [
33,
34] and ensure that machine translation is developed and used in a sustainable manner.
3. Materials and Methods
3.1. Research Instrument
For the purposes of this research, in July through October 2021, a survey was conducted in order to determine the perceptions of use, quality, acceptability overall, and impact on the society of machine translation in Lithuania. The survey was designed and conducted using LimeSurvey. An emphasis in the survey was put on the end-user experience while using machine translation tools and the perceived satisfaction with the generated quality of the machine-translated text. In total, 402 respondents filled in the questionnaire online. The survey was multifaceted, covering different questions, namely those related to demographic data of the respondents (age, gender, place of residence, education, occupational status, and proficiency in languages), reasons for not using machine translation, questions related to the particular machine translation systems (e.g., Google Translate, DeepL, Microsoft Bing, and Apple Translate), digital devices (computer, tablet PC and smart phone) and machine translation types (text-to-text, speech-to-text, text-to-speech, speech-to-speech, and image-to-text) used by the respondents, the purposes of machine translation usage (work, studies, household environments, entertainment, traveling, public and private sector services, medical and legal environments, personal communication, news, etc.), as well as a satisfaction evaluation with the generated quality, and additional actions taken to improve the text. The analysis of the results reported in this paper are based on the variables of age and education.
The questionnaire for the survey was designed based on the previous research on the components of acceptability of machine translation [
14,
19], societal impacts of machine translation [
1,
3], machine translation in small and low-resource languages [
35], the attitudes towards machine translation [
23], etc. A pilot survey was tested on 30 volunteering respondents. Based on their remarks and suggestions, the final version of the survey was designed. The survey questionnaire was freely available online and was open for 5 months. Social media channels were used to attract respondents representing the entire population.
3.2. Research Participants
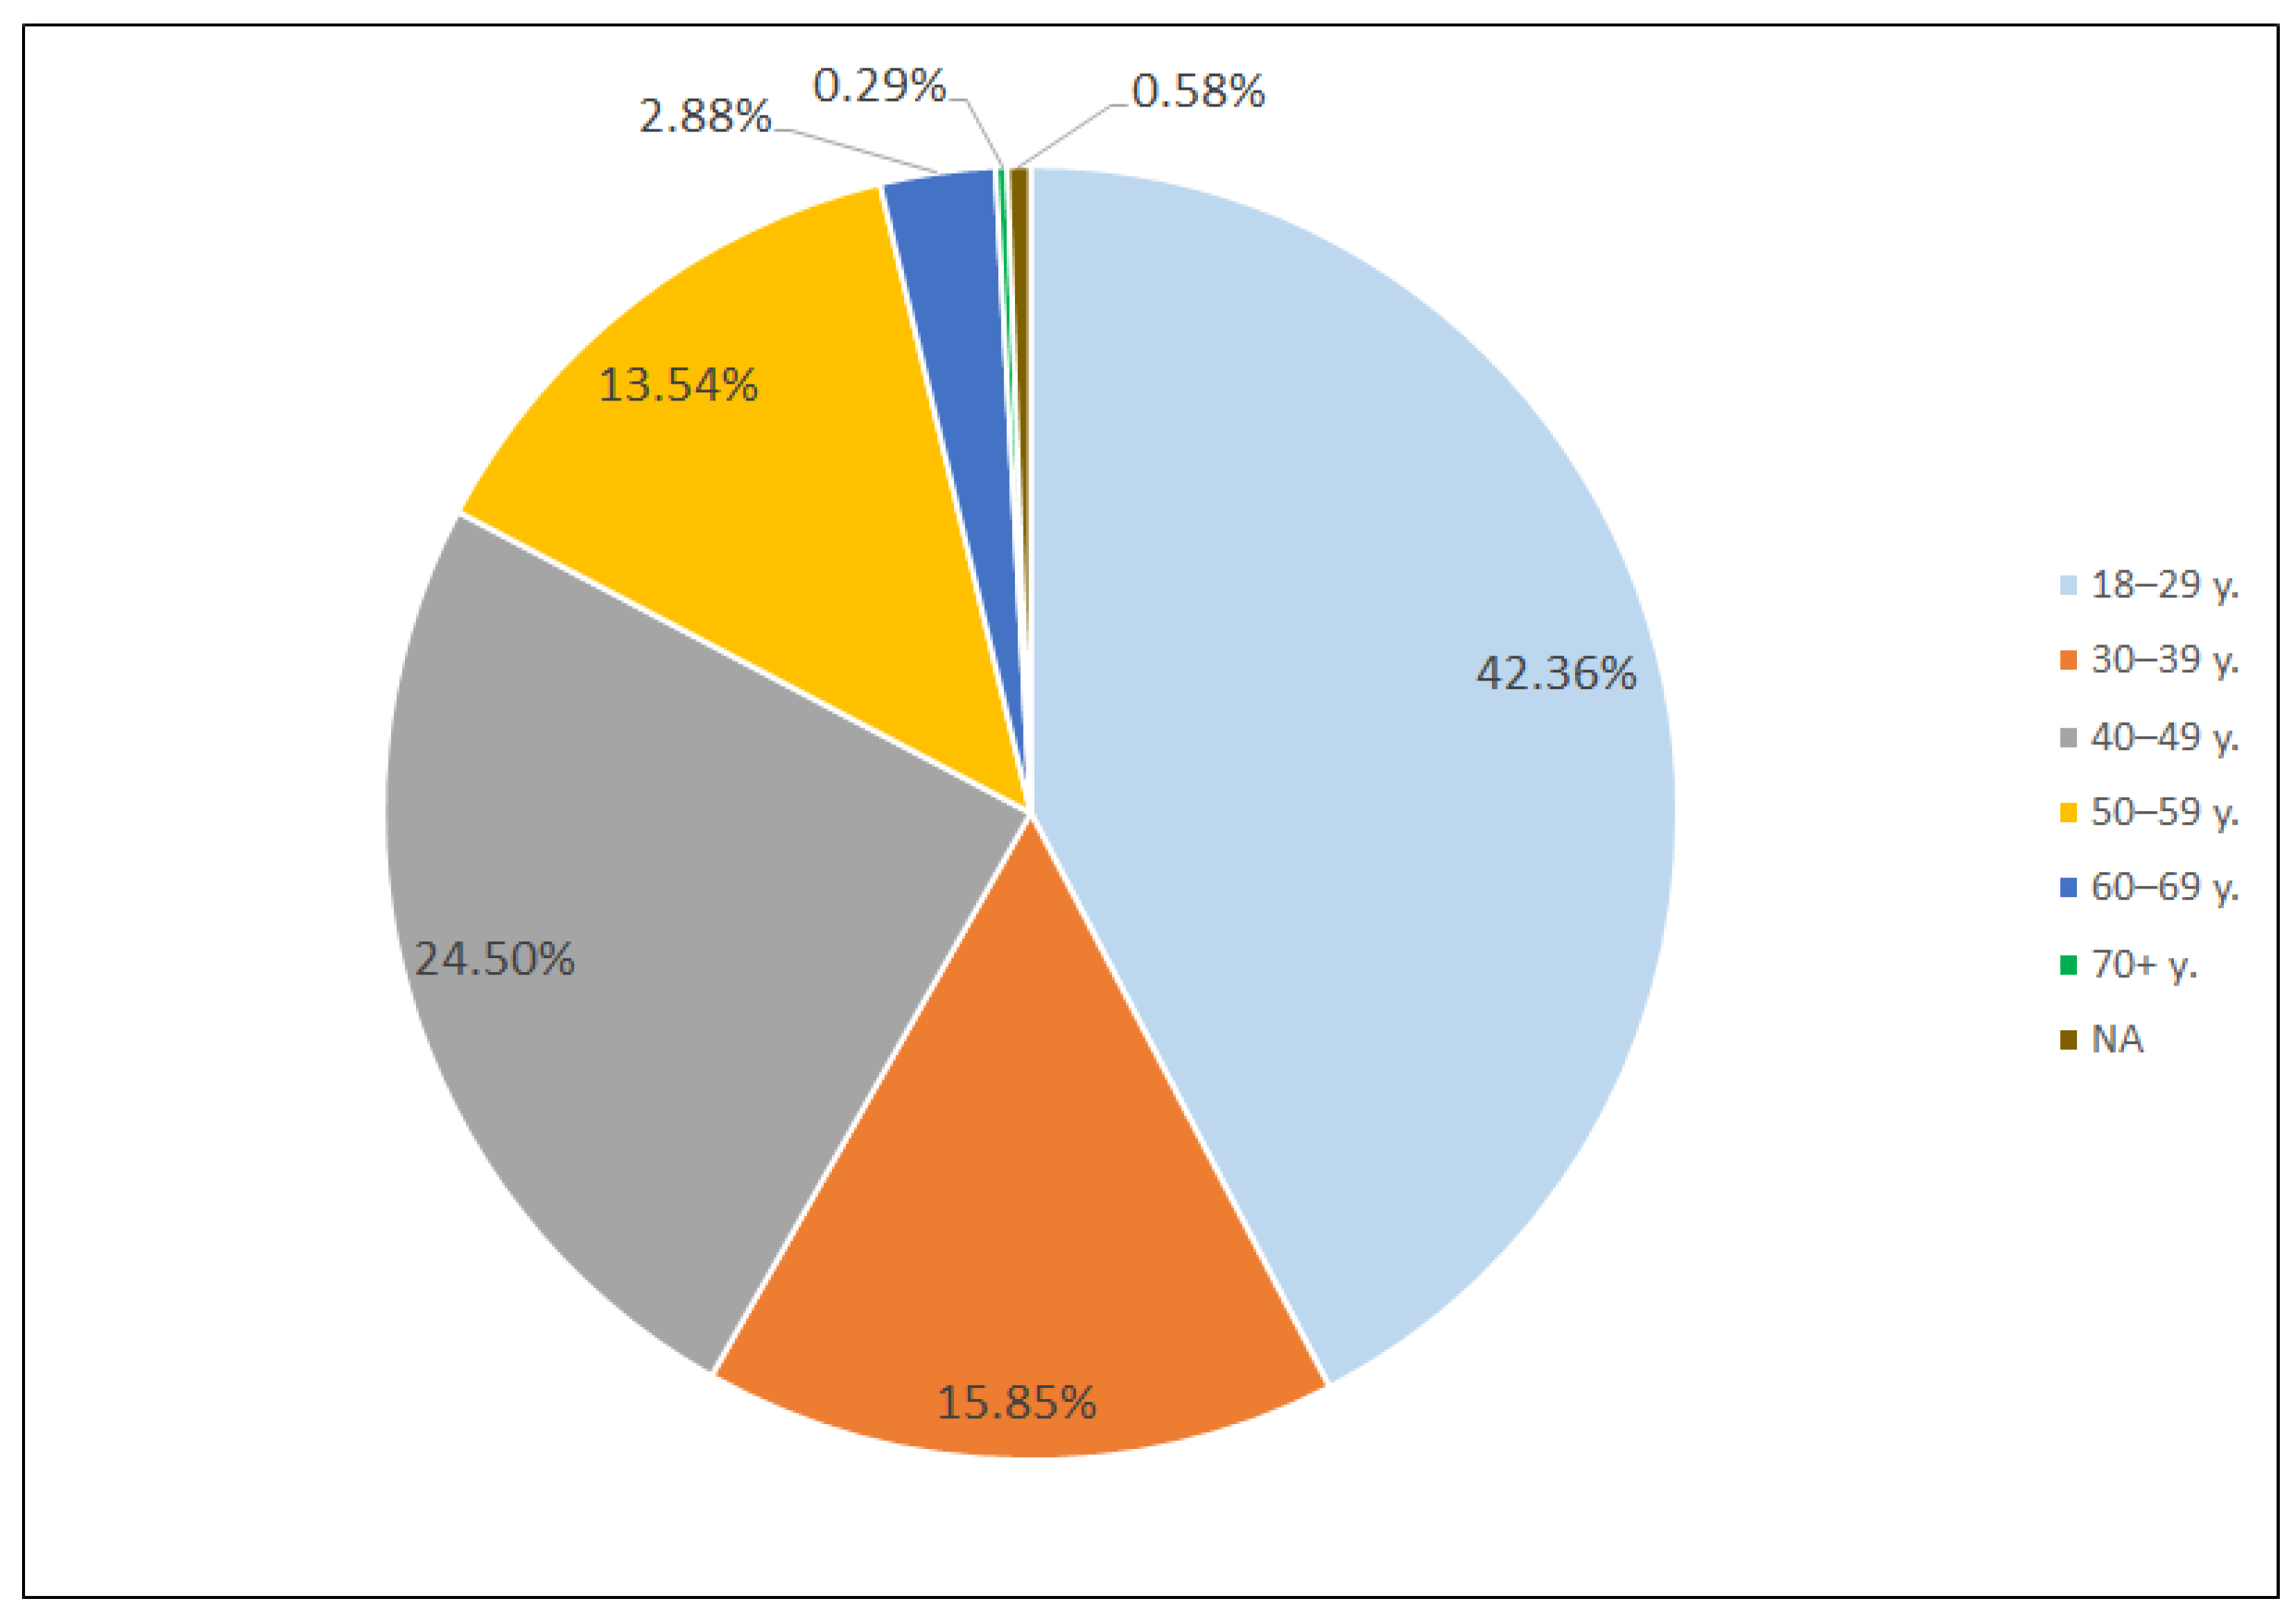
The survey was targeted at all age groups, except for those aged 17 years old and under. The majority of the respondents represented the age group of 18–29 years (38%). The second largest group was that of respondents aged 40–49 years (24%), followed by those aged 30–39 years (16%) and 50–59 years (14%). The smallest age groups represented in the survey were 70 years and more (1%) and 60–69 years (4%). Although respondents who were 17 years old and under were not targeted in the survey, there were 2% of the total number of responses within the age group. The answers of such respondents were excluded from the questionnaire. The question about the occupation was optional in the survey. Of those who indicated their occupation in the group of the respondents aged 18–29 years, the majority was students, but other occupations indicated by the respondents were administrators, project managers, transport managers, librarians, etc. In the groups of the respondents aged 30–39, 40–49 and 50–59 years, the occupations mentioned were social workers, researchers, teachers, IT specialists, lawyers, communications specialists, engineers, doctors, among others. In many cases, these professions require a higher education in Lithuania. Among the respondents aged 60–69 and over 70 years, the majority were retired, but some also mentioned working as librarians, teachers, marketing managers, administrators, drivers. There were 81% of women and 17% of men, while 2% chose not to indicate their gender. The absolute majority of the respondents (96.8%) indicated Lithuanian as their mother tongue. Russian speakers represented 2.6%, while 1% of the respondents indicated other languages as their mother tongues, namely Polish, Latvian, Italian, etc. All respondents whose native language was something other than Lithuanian indicated knowing it to the level of a proficient user or a native speaker. A total of 60.5% of all respondents indicated knowing English and 36.9% indicated knowing Russian to the level of a proficient user or a native speaker.
In terms of education, there were 70% of the respondents with higher education, 11% had incomplete higher education, 10% had high school (secondary) education, 4% had vocational training, 3% indicated having not finished their secondary school, and 1% did not indicate their education level. The questionnaire also asked questions about the occupational (employment) status of the respondents. There were 51% of fully employed respondents, 23% of students, 6% of freelancers, 4% had their own business, and 4% were secondary school students. There were 3% of part-time employed and retired each. A total of 2% of the respondents were not working, but were looking for a job, and 1% of the respondents were unemployed and not looking for job. There were 3% of the respondents who did not indicate their occupational status and chose the option “other”.
The residence place of the majority of respondents was indicated as large cities and suburbs of the country (71%), followed by smaller cities and towns (18%), and villages (6%). A small number of the respondents (2%) indicated their place of residence to be abroad, i.e., a foreign country, and 2% did not indicate their place of residence. Approximately 11% (N = 46) of the respondents indicated that they did not use machine translation. Their answers are not included into data analysis. These respondents provided reasons for not using machine translation. The majority did not use machine translation, as they were unfamiliar with the technology (37%), were not satisfied with the output quality (20%), or had no needs to use it (15%). Other indicated reasons were reliance on professional translators, lack of trust in the service, inconvenient machine translation tools, etc. The total number of the responses included into the data analysis was 347.
3.3. Data Analysis
IBM SPSS Statistics 27 was used for descriptive and relationship analysis. Descriptive statistics were calculated for quantitative nominal and ordinal data. The relationships between ordinal data were evaluated by Spearman correlation coefficients. The relationship was considered statistically significant when p < 0.05. MS Excel was used for plotting and data analysis.
4. Results
The existing scientific literature measures acceptability from three different perspectives, namely usability, quality and satisfaction. In this study, the responses relevant for each component were analyzed employing frequency calculations and the Spearman correlation coefficient.
Among the users of machine translation, the age group of 18–29 years was dominant (see
Figure 1).
In terms of different machine translation systems, the vast majority of the respondents (96.6%) indicated using Google Translate as the main machine translation tool, of whom 56.2% indicated using Google Translate very frequently and 19.4% frequently. There were 8% who used other machine translation systems (Apple Translate, Tilde, Microsoft Bing, Yandex, or eTranslation). The respondents indicated using them rarely, except for DeepL, which was indicated by 16.4% of the respondents, of whom 6.5% used it very often, and 4.5% used often.
The responses on the usage of machine translation in different digital devices were varied. However, the majority of the respondents (95%) indicated using machine translation on a computer and approximately three-fourths of them used it on a smart phone (78%). Meanwhile, only 15% indicated using tablet PCs for machine translation purposes.
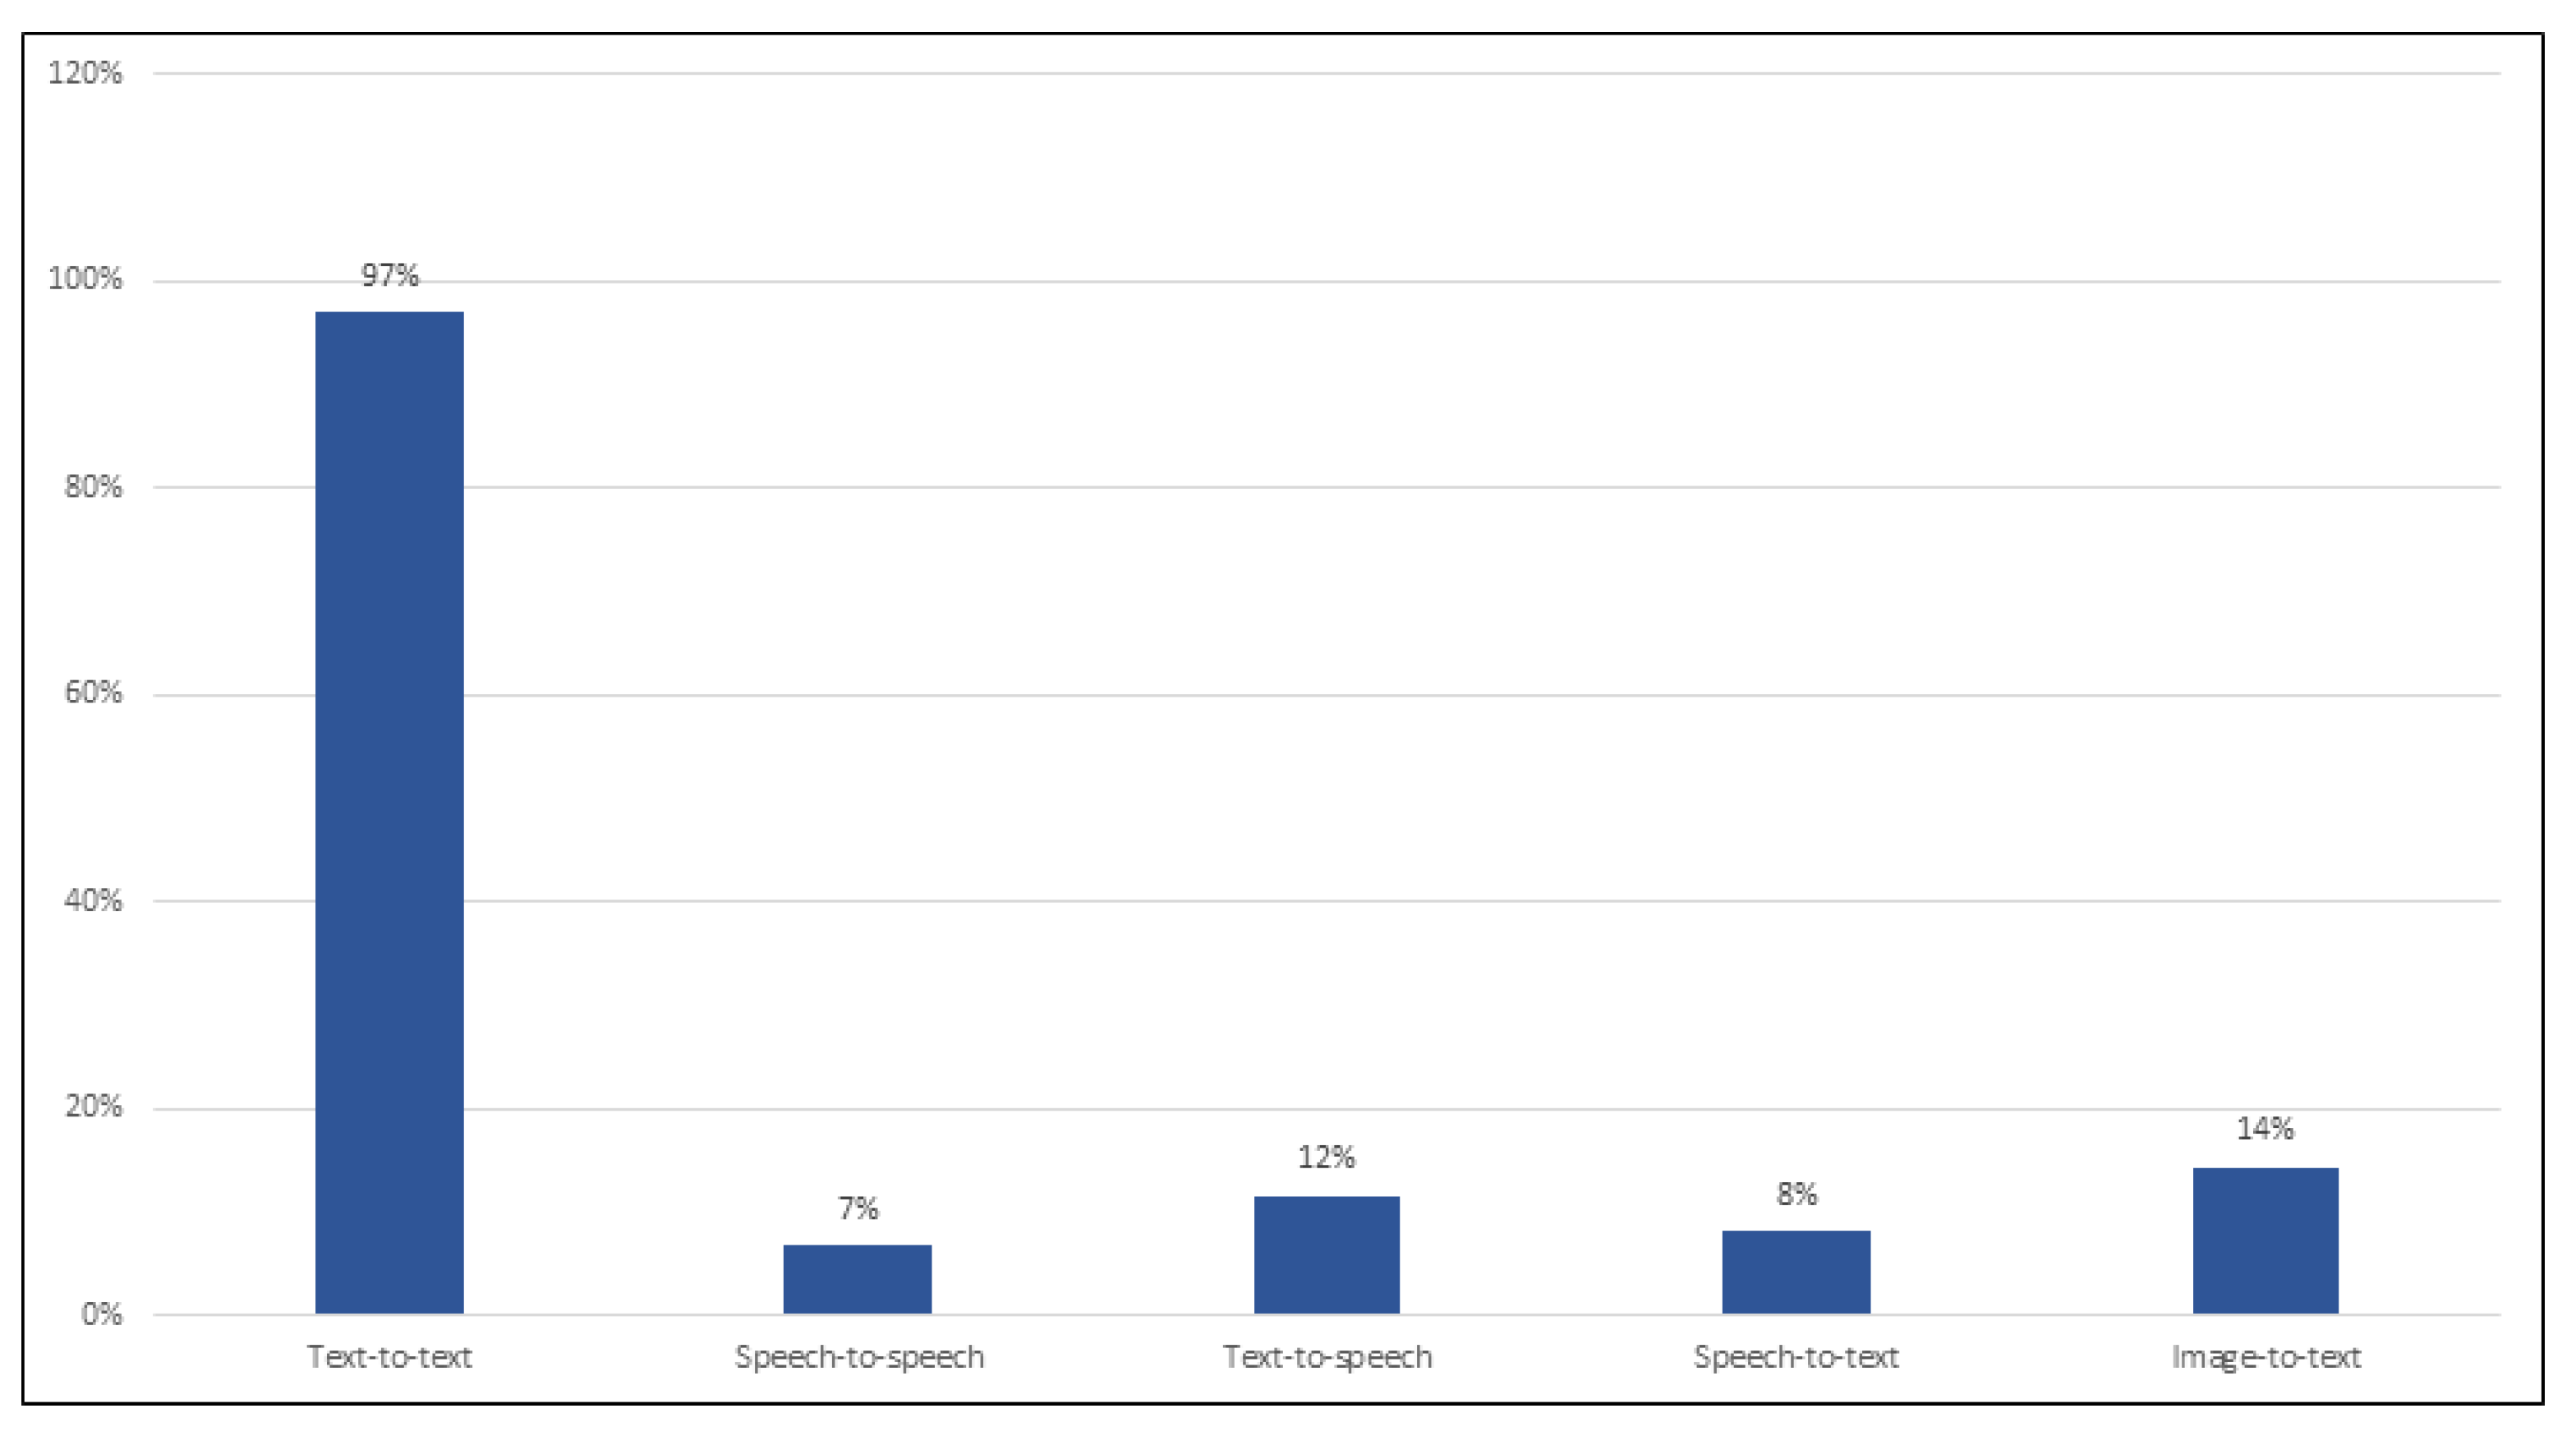
Figure 2 presents the results of the usage of machine translation types, namely text-to-text, speech-to-text, text-to-speech, speech-to-speech, and image-to-text. As seen, the vast majority of the respondents (97%) noted using text-to-text translation. Other types were used by a small number of the respondents: image-to-text—14%; text-to-speech—12%; speech-to-text—8%; and speech-to-speech—7%.
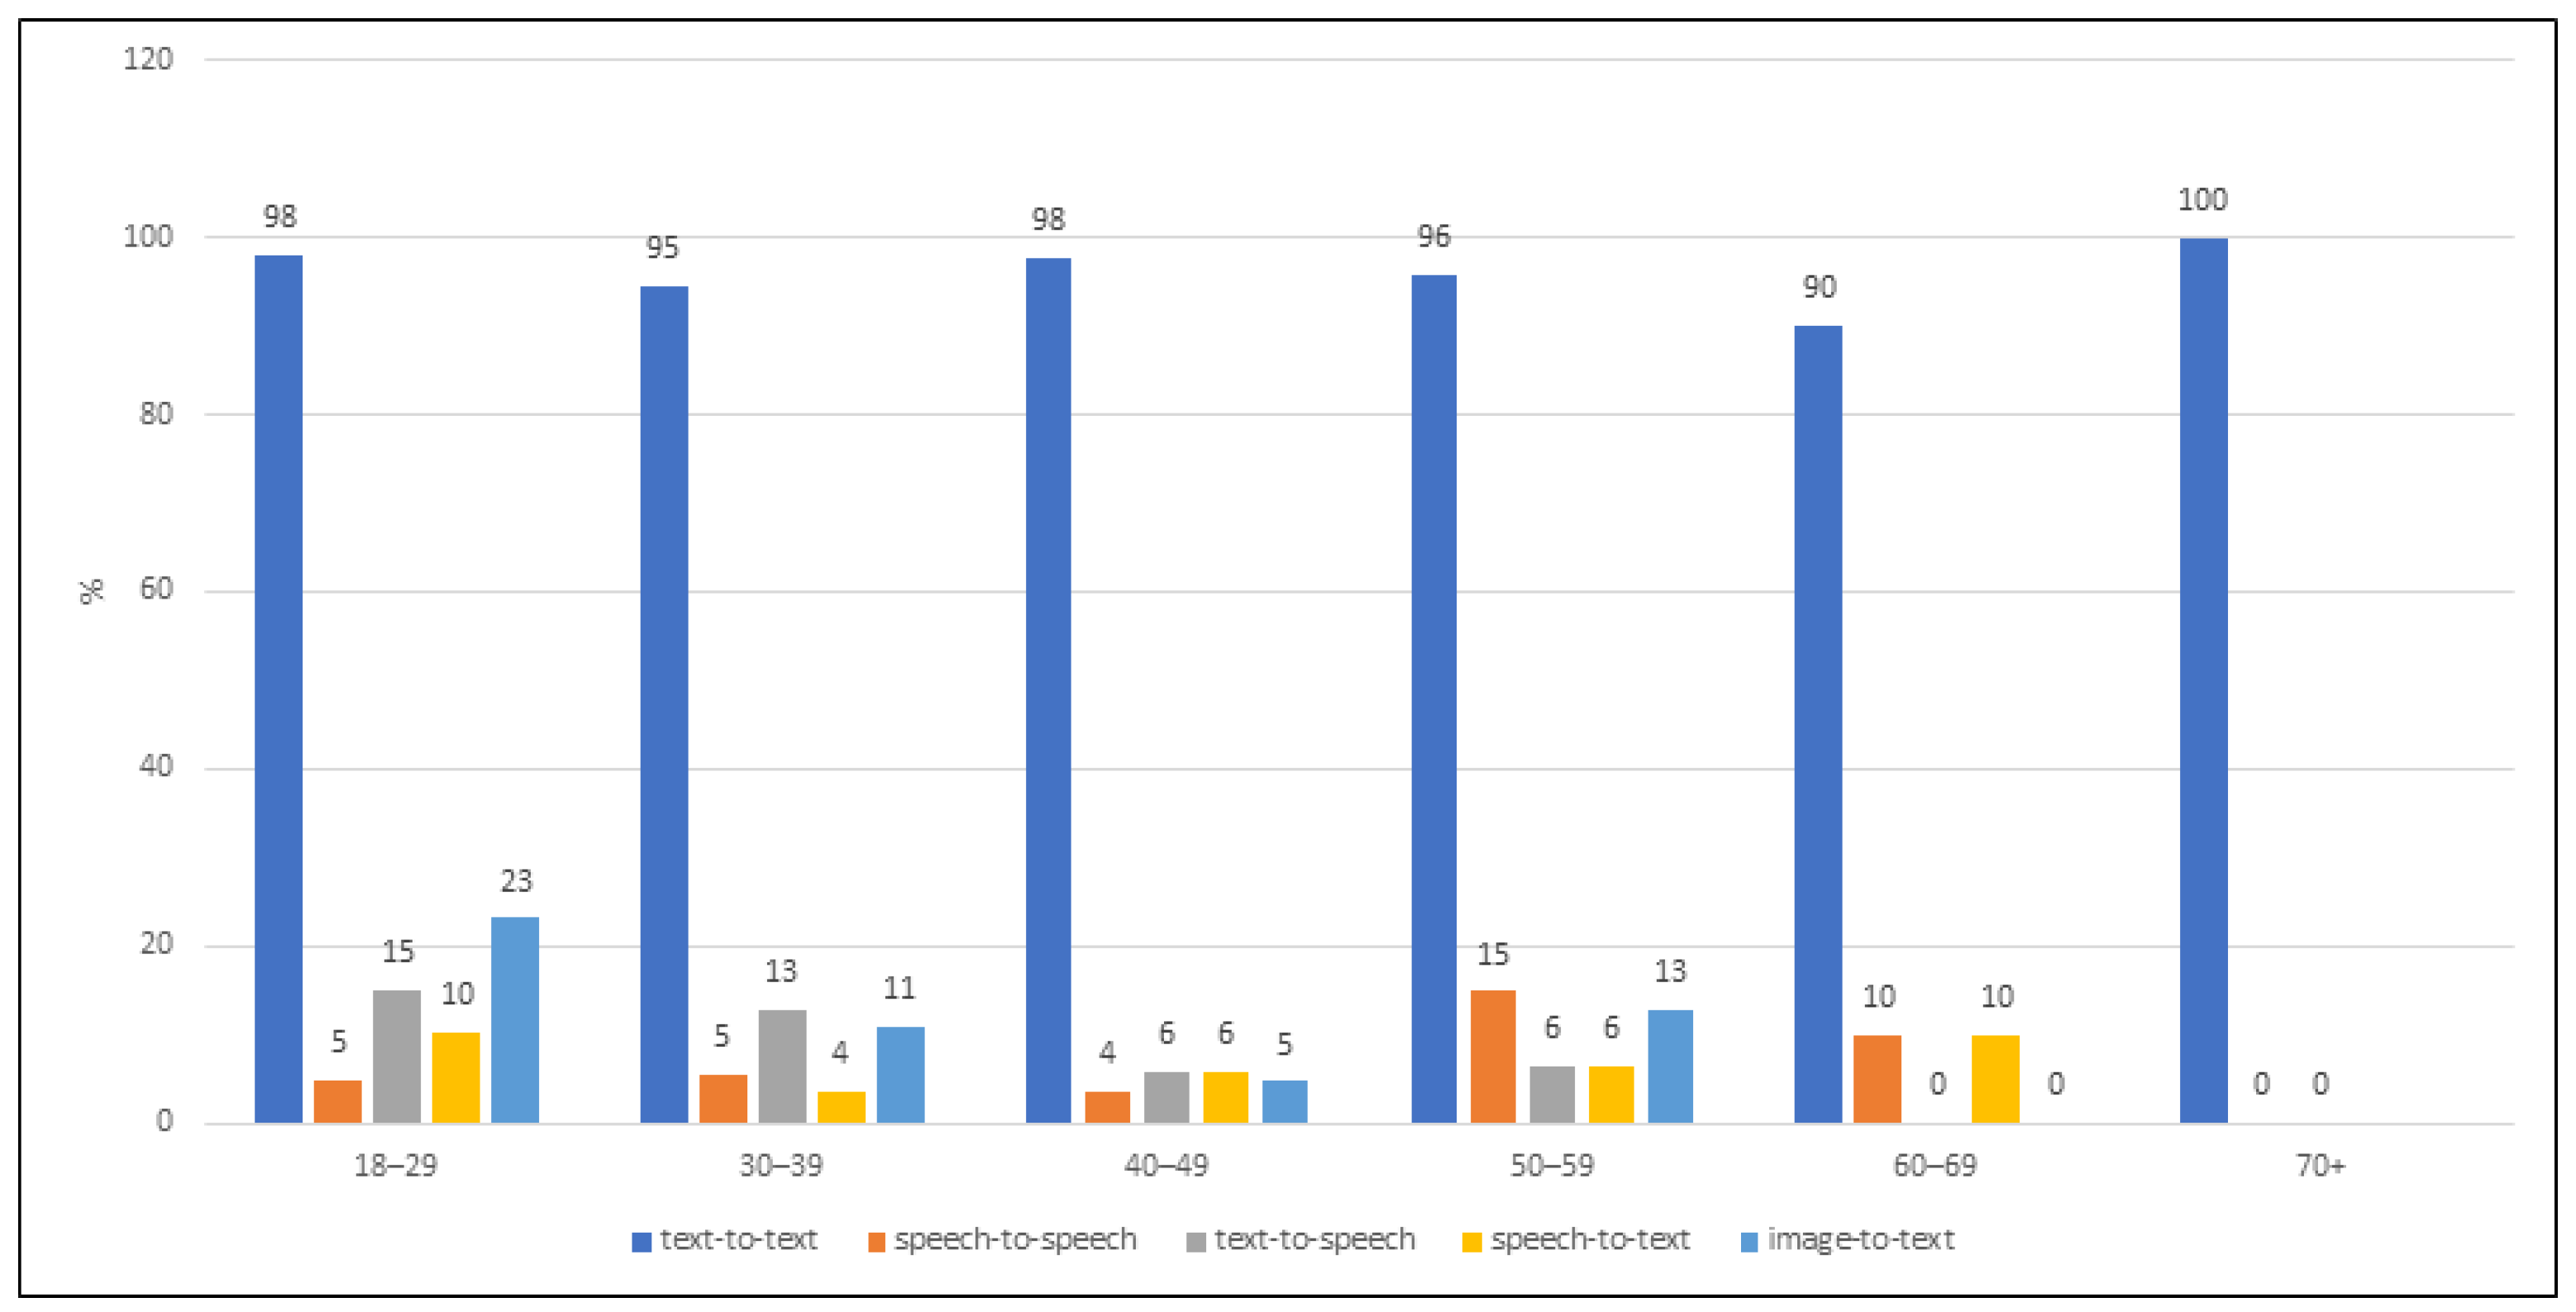
Figure 3 presents the overview how the respondents of different age use different machine translation types. As seen, text-to-text machine translation type was prevalent in all age groups. The respondents aged 70 years and over used text-to-text machine translation type exclusively. The younger the age, the greater the variety of machine translation types used was reported.
The answers of the respondents statistically significantly differed in terms of usage of machine translation types. A statistically significant negative Spearman correlation coefficient (−0.263; ) was found between the age group and the number of used machine translation types, which implies that the younger respondents were more willing to use multiple types of machine translation. A statistically significant positive correlation (0.183; ) was found between the respondents’ age group and the text-to-text type, which implies that older age groups tend to use text-to-text more often. Although the number of the respondents using speech-to-speech type was low, a statistically significant positive correlation (0.200; ) was determined between the age group and use of the speech-to-speech machine translation type.
Figure 4 presents the purposes of machine translation use. The majority of the respondents indicated using machine translation for work (N = 283) and for research or studies (N = 174). Other purposes were indicated as follows: household tasks (N = 145), entertainment (N = 119), personal communication (N = 116), news (N = 81), travel (N = 82), internet shopping (N = 77), legal services (N = 2), health care (N = 8), and public and private sector services (N = 17).
Differences between the age groups were determined in terms of purposes for using machine translation (see
Table 1). As presented in
Table 1, the respondents of the age group of 18–29 years used machine translation mostly for the purposes of research and studies (77.6%), and less often for work, entertainment, personal communication, news, traveling, household, internet shopping, public and private sector services, health care, legal situations, etc. The respondents of the age group of 30–39 years used machine translation mostly for the purposes of work (78.2%), and less often for research and studies, household, entertainment, personal communication, etc. The respondents of the age group of 40–49 years used machine translation mostly for the purposes of work (85.9%), and less often for household, research and studies, traveling, etc. The respondents of the age group of 50–59 years used machine translation mostly for the purposes of work (76.6%), and less often for household, personal communication, entertainment, etc. The respondents of the age group of 60–69 years used machine translation mostly for the purposes of personal communication (50%), and less often for work, household, entertainment, and other purposes. The respondents of the age group of 70 and more years indicated using machine translation exclusively for household and health care purposes.
There were statistically significant differences between different age groups in terms of the purposes of machine translation usage. A statistically significant negative Spearman correlation coefficient (−0.210; ) was found between the age group and use of machine translation for research and study purposes. The older the age of the respondents, the less usage of machine translation for research and study purposes. There was a statistically significant correlation determined between the age group and use of machine translation for work (0.345; ). Statistically significant correlations were found between the age group and the use of machine translation for traveling purposes (0.173; ); use of machine translation for services in private and public sectors (0.173; ); use of machine translation legal situations (0.171, ); use of machine translation for health care purposes (0.206; ); and use of machine translation for internet shopping (0.172; ).
Figure 5 provides the results of the satisfaction of the respondents with machine translation. Almost half of the respondents (47%) were neither satisfied nor dissatisfied with the quality of machine translation. Only 4% of the respondents were very satisfied, 40% were satisfied, 7% were dissatisfied, and 1% of the respondents were very dissatisfied. A statistically significant negative correlation (−0.171;
) was determined between the age group and satisfaction with the machine translation quality level.
Additionally, we also asked the respondents to indicate the source and the target languages when they used machine translation. Of all respondents, 40.6% indicated using machine translation when translating from a native language to a foreign language very often or often; 48.1% indicated using such systems when translating from a foreign language to a native language; and 28.8% indicated using it when translating from a foreign to another foreign language. Since the machine translation quality is somewhat lower with Lithuanian as a low-resource language, the findings on satisfaction of users with machine translated may be considered predictable.
Education is another factor that may affect the machine translation practices of end-users. According to the education level, the respondents were mostly representatives of the higher education (71.7%, N = 281), followed by those with incomplete higher education (11.5%, N = 45), secondary education (9.7%, N = 38), vocational training (4.1%, N = 16), and incomplete secondary education (1.8%, N = 7), NA (1.3%, N = 5). This finding is not at all surprising and relates to the statistical data that the greater part of the Lithuanian population (approximately 68% of women and approximately 47% of men) have a higher education of at least the bachelor’s level [
36].
In the study, we analyzed the interrelation between the level of education and the purposes for which machine translation was used (see
Table 2). The respondents with the higher education indicated using machine translation mostly for work (79.0%), and less often for household tasks, research and studies, entertainment, personal communication, traveling, news, internet shopping, etc. The respondents with the incomplete higher education indicated using machine translation mostly for research and studies (88.6%), and less often for household tasks, entertainment, personal communication, and less often for work, traveling, news, internet shopping, and public and private sector services. The respondents with the secondary education indicated using machine translation mostly for research and studies (97.1%), household tasks (63%), personal communication (51%), and less often for entertainment (49%), news, work, traveling, internet shopping, health care, and public and private sector services. The respondents with the vocational training indicated using machine translation mostly for work (55%), and less often for research and studies, personal communication, entertainment, household tasks, news, traveling, and health care. The respondents with the incomplete secondary indicated using machine translation mostly for research and studies (100%), entertainment (54%), and news (54%), and less often for household tasks, personal communication, traveling, work, public and private sector services, and internet shopping. These findings reveal that the respondents with a higher level of education tend to use machine translation more for work purposes. However, generally, the most common purposes of machine translation use indicated by all respondents are work, research and studies, and household tasks. Health care, legal situations, public and private sector services, and internet shopping were the less frequently mentioned purposes of machine translation use by all respondents.
Figure 6 presents the results of the usage of machine translation types, namely text-to-text, speech-to-text, text-to-speech, speech-to-speech, and image-to-text among the respondents with a different education level. As seen, the text-to-text machine translation type was used by the majority of the respondents in all groups (ranging from 91% in the group of the respondents with vocational training to 100% in the group of the respondents with incomplete secondary education). The speech-to-speech machine translation type was the least frequently chosen option in all groups (ranging from 6% in the group of respondents with higher education to 18% in the group of the respondents with vocational training).
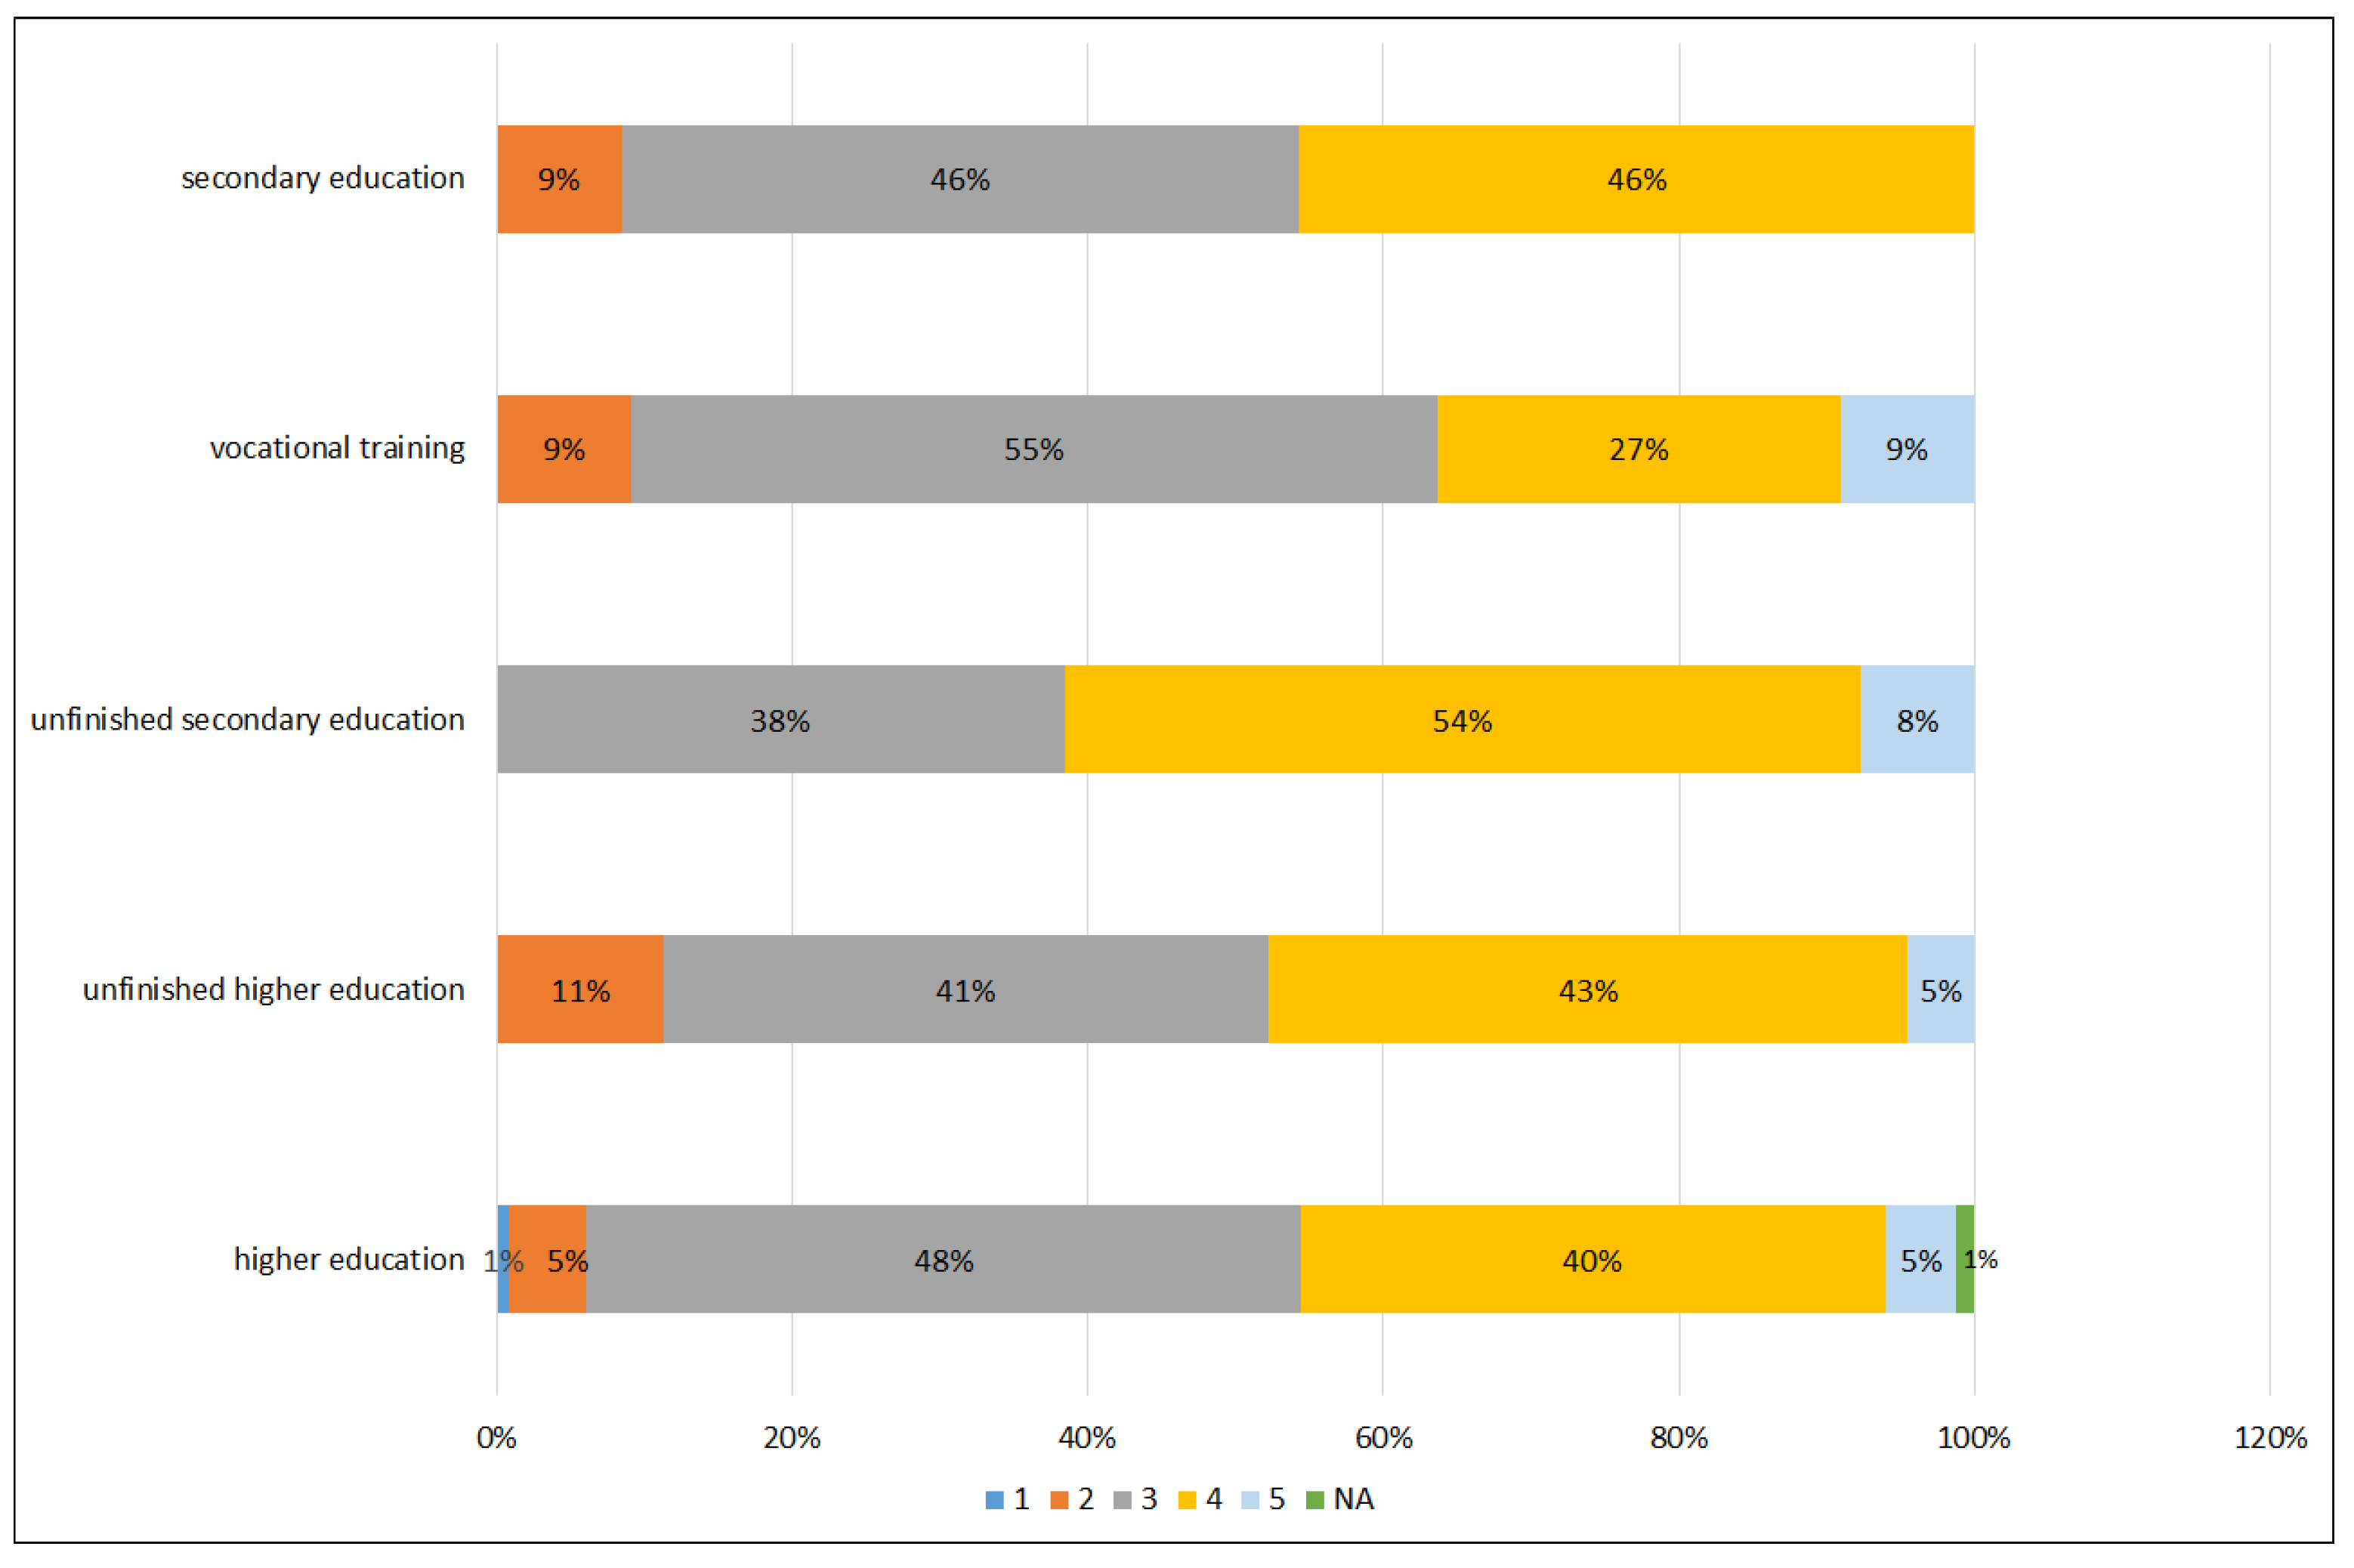
Figure 7 presents the results of satisfaction with machine translation from the perspective of the education level. The mean satisfaction level is 3.4, the median is 3, the mode is 3, and the standard deviation is 0.7. It may be inferred from the data that there were only 5% of respondents with a higher education who were very satisfied with machine translation quality, followed by 40% of those who were satisfied. Half of the respondents (48%) were neither satisfied nor dissatisfied. Only a small number of the respondents with the higher education were dissatisfied (5%) and very dissatisfied (1%) with the quality of machine translation. The distribution of the respondents who had incomplete higher education was as follows: 5% very satisfied, 43% satisfied, 41% neither satisfied nor dissatisfied, and 11% dissatisfied. The distribution of the respondents who had secondary education was as follows: 46% satisfied, 46% neither satisfied nor dissatisfied, and 9% dissatisfied. The distribution of the respondents who had vocational training was as follows: 9% very satisfied, 27% satisfied, 55% neither satisfied nor dissatisfied, and 9% dissatisfied. The distribution of the respondents who had incomplete secondary education was as follows: 8% very satisfied, 54% satisfied, and 38% neither satisfied nor dissatisfied. All these findings seem to reveal that the respondents with a lower level of education were more satisfied with machine translation than dissatisfied in comparison with those who have a higher level of education. Yet the correlation proved to be statistically insignificant (Spearman correlation coefficient −0.014,
).
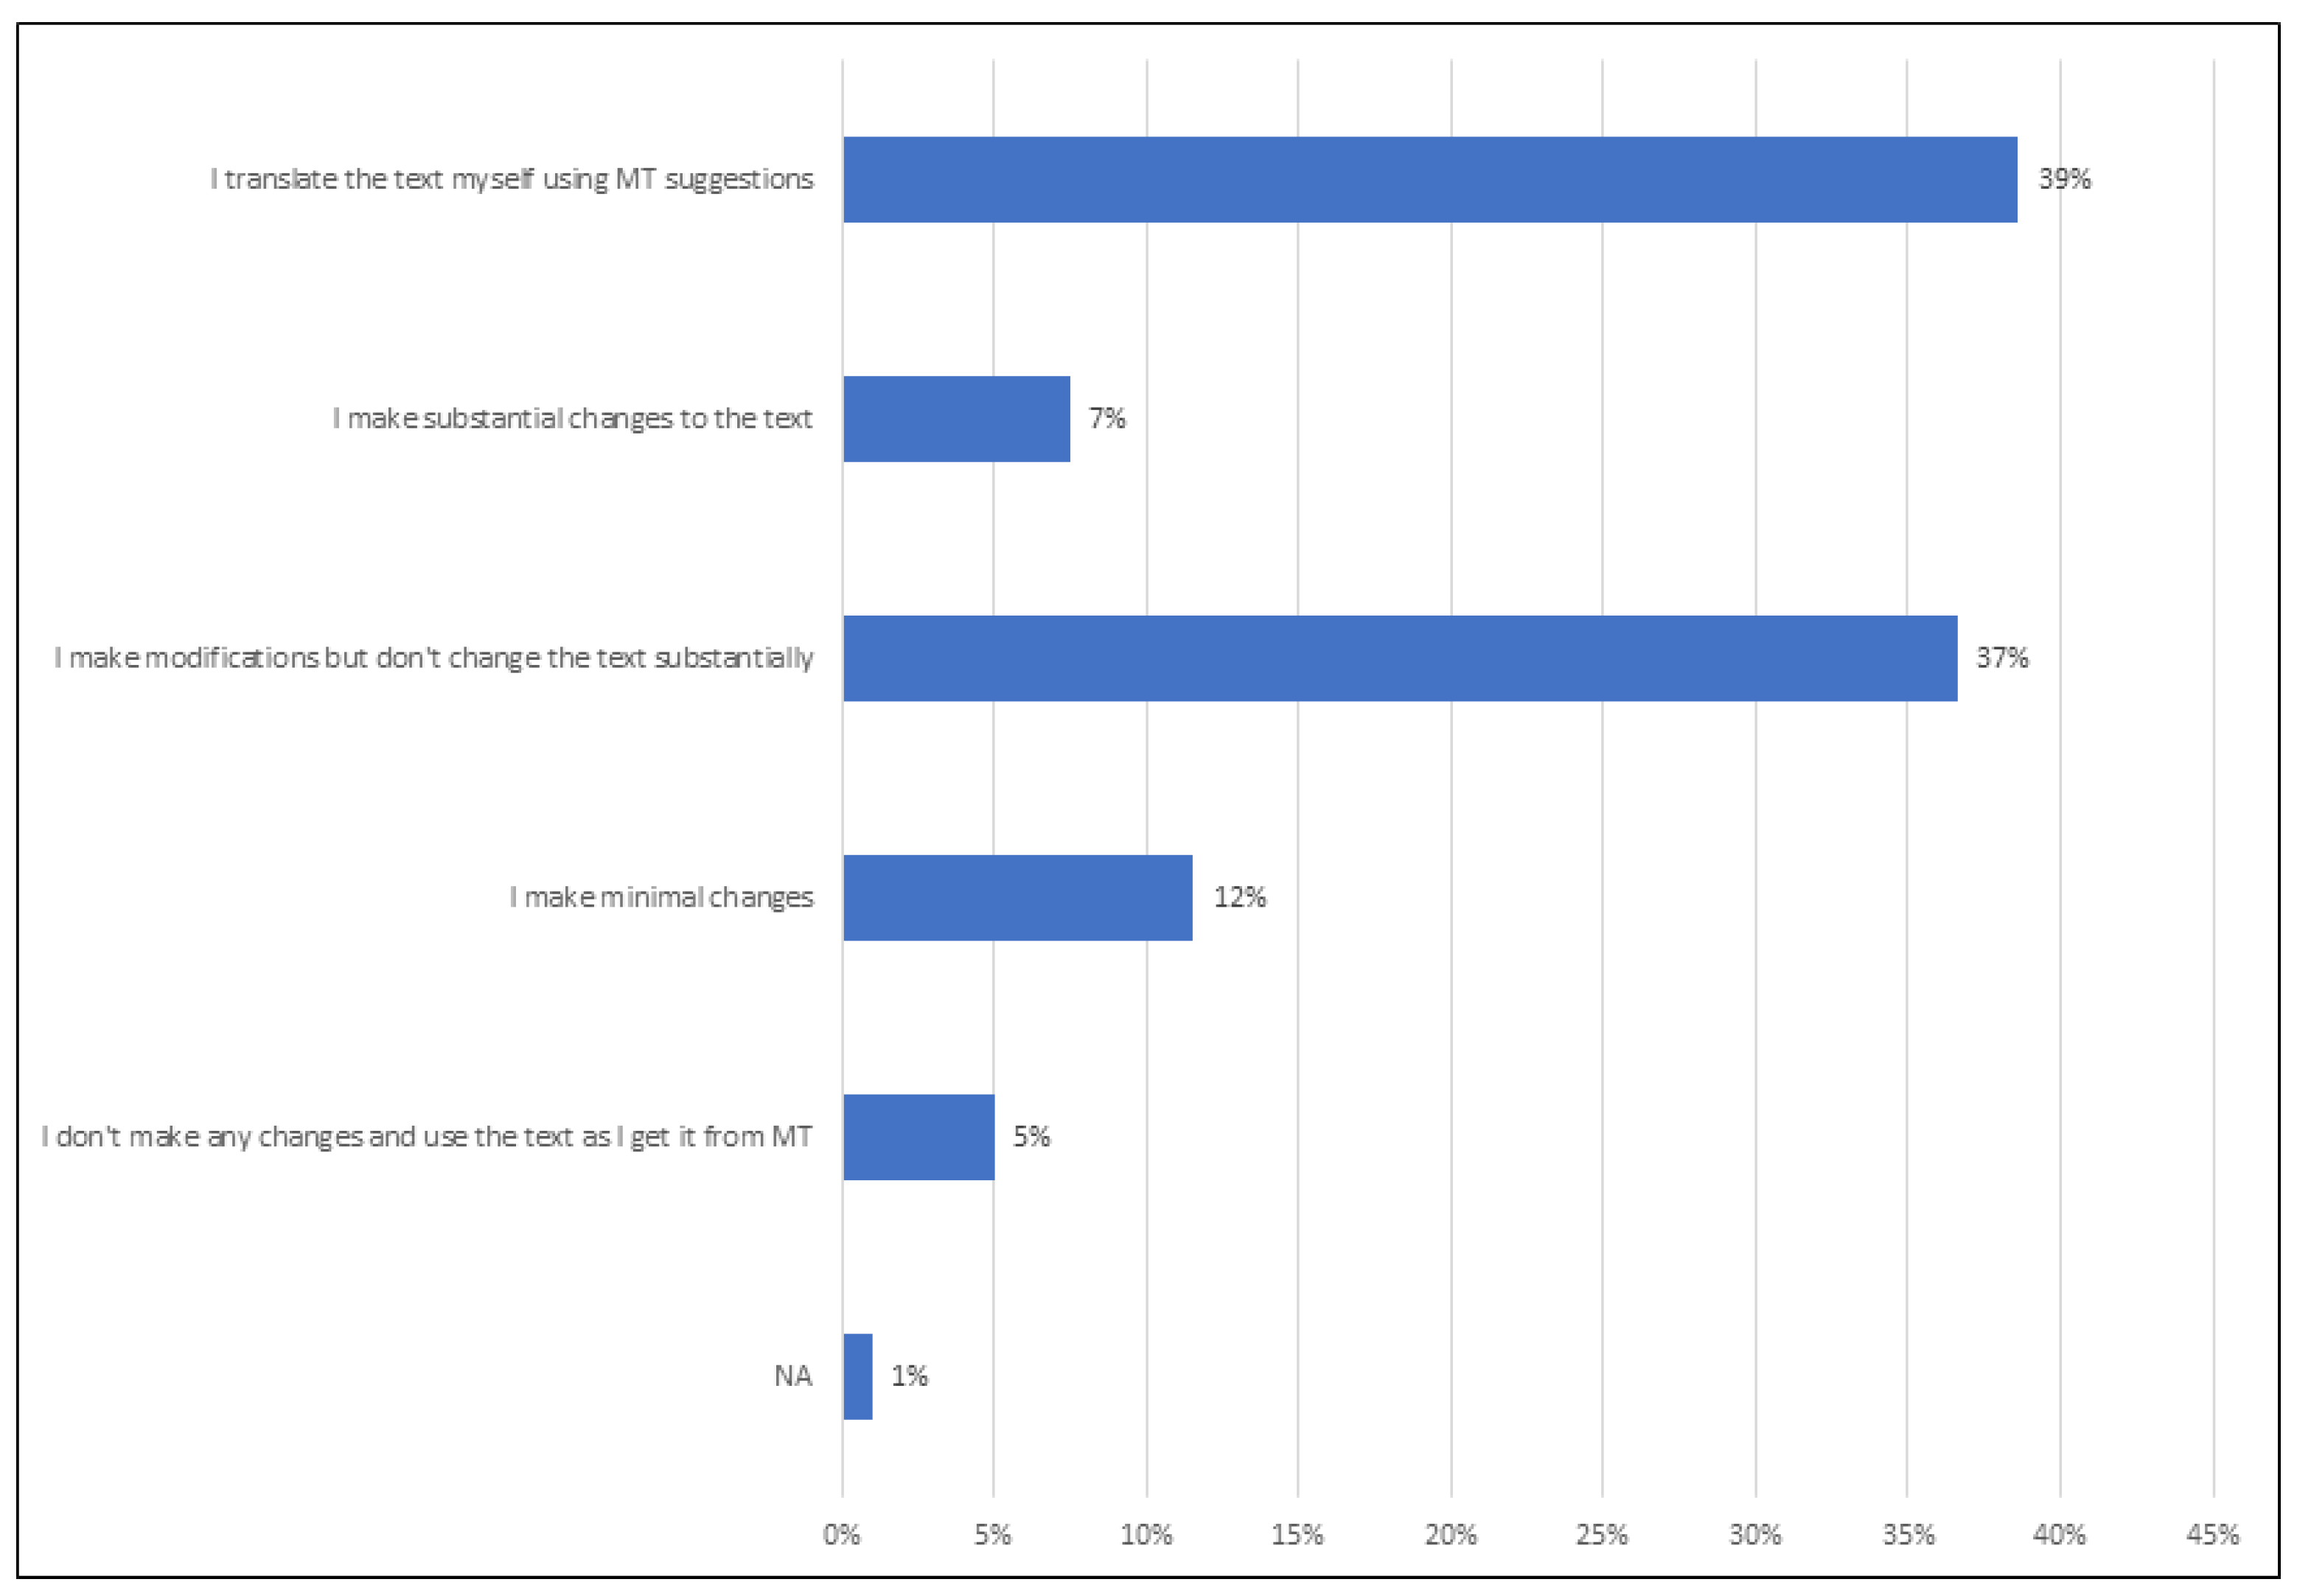
The respondents also provided answers as to the additional actions taken to change and modify the raw machine translated text in order to improve it (see
Figure 8). The respondents mostly indicated that they made modifications but did not change the text substantially (37%), followed by 12% of the respondents who made minimal changes, and 7% of the respondents who made substantial changes. Only 5% of the respondents indicated making no changes at all and using the raw text as generated by a machine translation system.
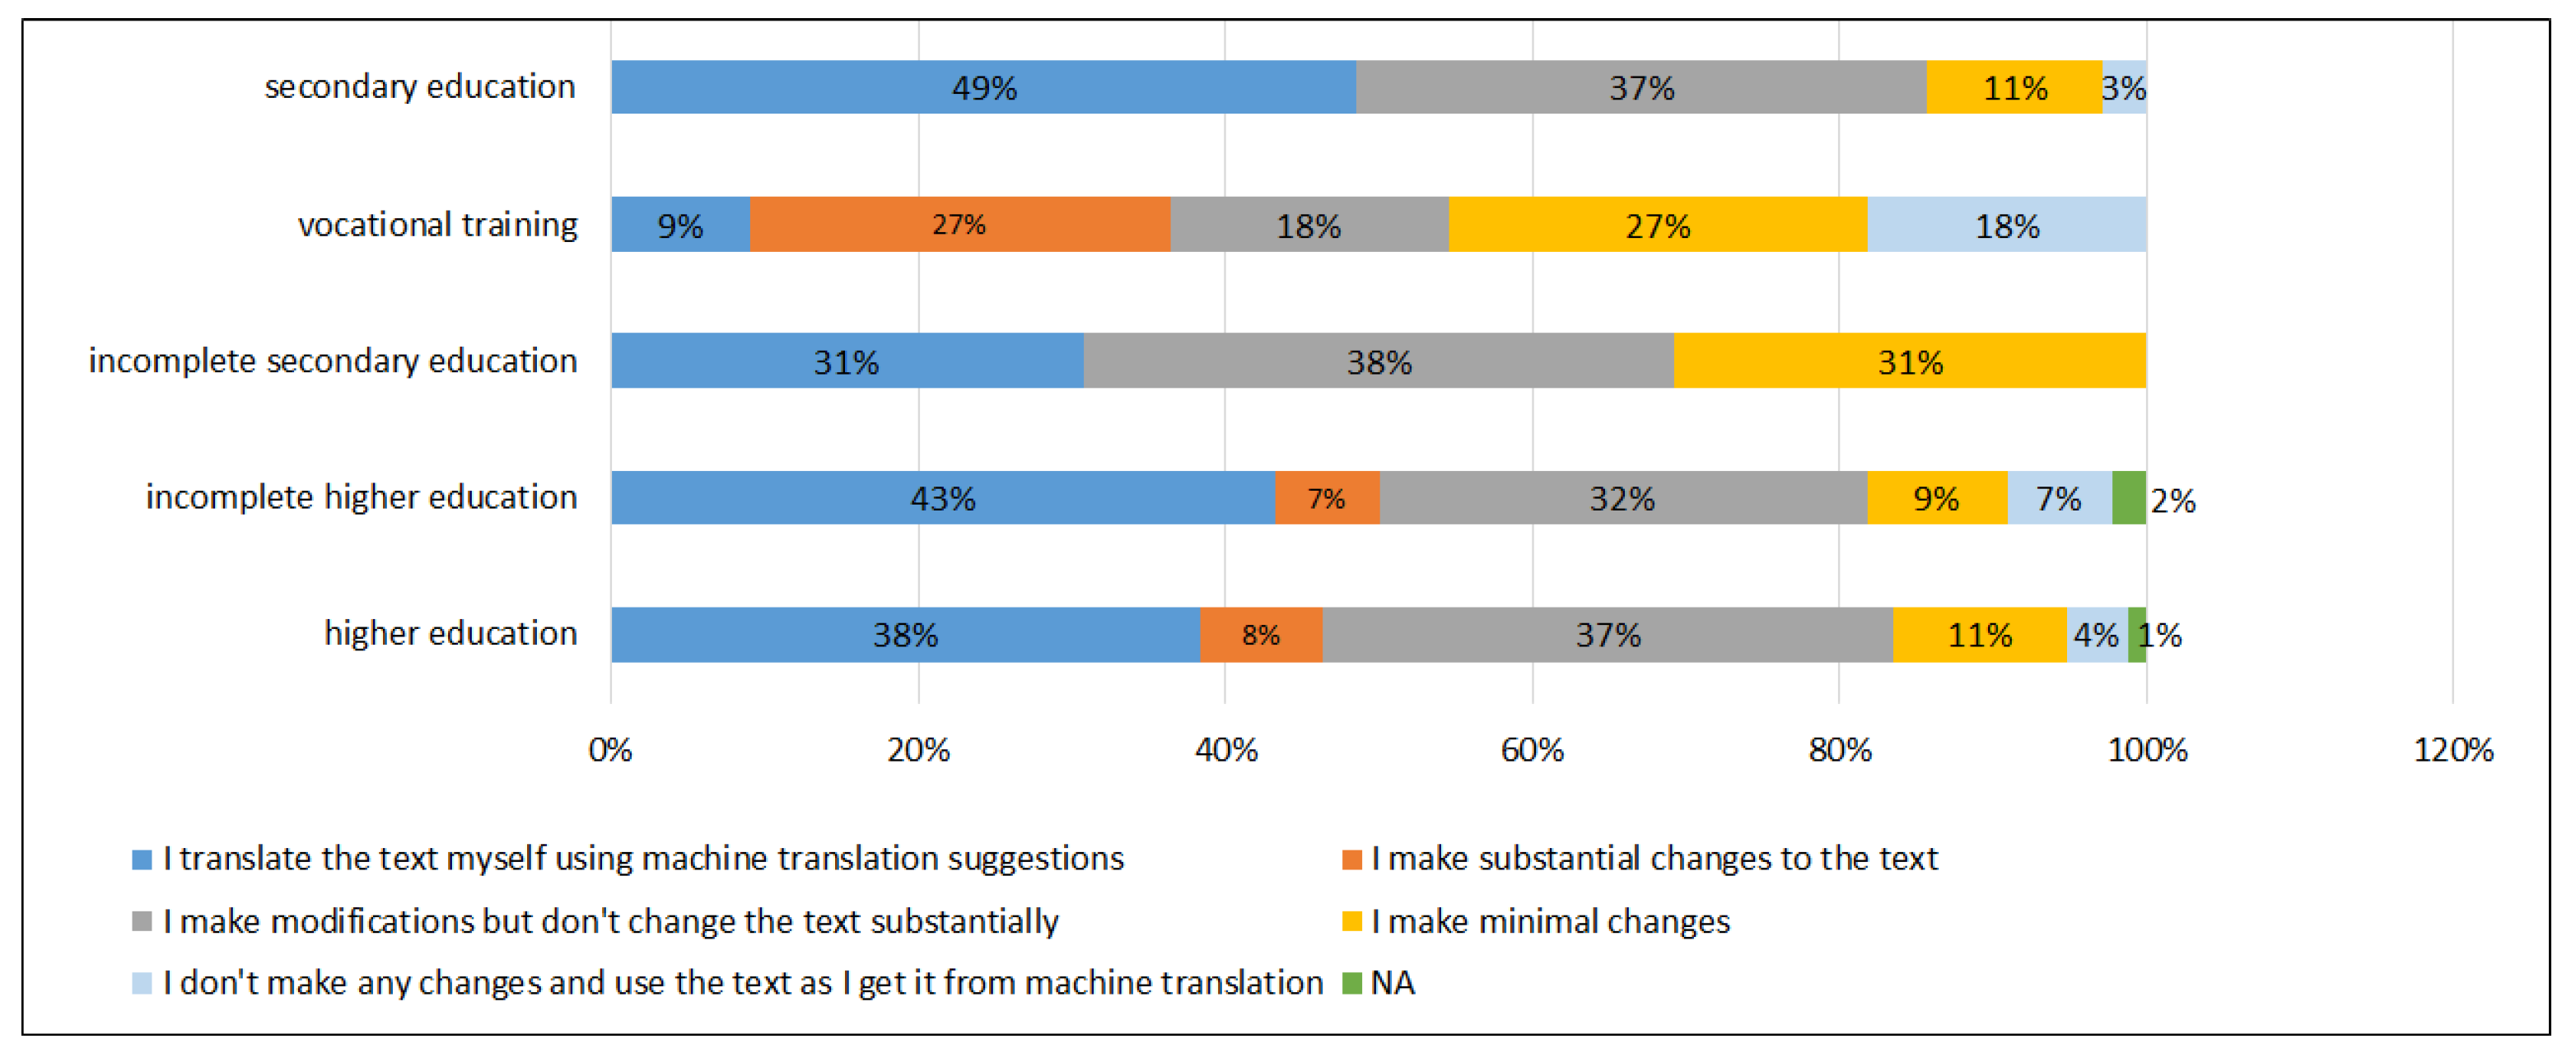
The data on additional actions taken to change and modify the raw machine translated text for its improvement were analyzed for groups of the respondents with a different level of education (see
Figure 9).
It was determined that in all groups, the respondents tended to translate texts themselves using machine translation suggestions (38% in the group of the respondents with higher education; 43% in the group of the respondents with incomplete higher education; 49% in the group of the respondents with secondary education; and 31% in the group of the respondents with incomplete secondary education), except for the group of the respondents with vocational training (9%). The respondents who indicated making substantial changes to the text were those with vocational training—27%, higher education—8%, and incomplete higher education—7%. The option of making some changes without substantial modification to the text was chosen by 37% of the respondents with higher education and secondary education each, 38% of the respondents with incomplete secondary education, 32% of the respondents with incomplete higher education, and 18% of the respondents with vocational training. Minimal changes were made by the respondents as follows: incomplete secondary—31%, vocational training—27%, higher education and secondary education—11% each, and incomplete higher education—9%. At the same time, the respondents with vocational training mostly indicated making no changes and using the raw text as generated by a machine translation system (18%). There were only 4% of the respondents with higher education, 7% with incomplete higher education, and 3% of the respondents with secondary education who did not make any changes and used the raw machine translated text. The correlation between the education level and the reported level of text changes was found to be statistically insignificant (Spearman correlation coefficient 0.024, ).
5. Discussion
There is scarce research in relation to machine translation usage among end-users as noted by other researchers conducting studies in this field [
1,
37]. The research on machine translation conducted by researchers in various countries mainly focuses on professional translation practices and impacts of machine translation in the translator’s profession.
Our study focuses around the purposes of using machine translation, perceived quality of the generated output, and actions taken to improve the quality by users with various backgrounds. The results of this study reveal the uses of machine translation by different groups of population in terms of age and education. Although previous studies have highlighted the risks in relation to machine translation used for legal and healthcare purposes [
1], our study results indicate that ordinary end-users very rarely use machine translation for these purposes. This fact might be interpreted as the Lithuanian population and context being relatively monolingual and monocultural, requiring no multilingual communication in legal and healthcare or public and private sector services. Nevertheless, the legal and medical sectors have to deal with immigrants and foreign residents, who may encounter difficulties by not being able to speak the local language. In such settings, they are left with very few options, and in emergency situations, they might rely on machine translation. In further studies, it might be relevant to target such respondents in order to find out what difficulties they face in multilingual communication. On the other hand, the purposes indicated for the use of machine translation might also be the result of the sample with students representing approximately one-fourth of the respondents who might need to use machine translation for research and studies purposes more often than for other reasons.
The quality of machine translation was researched in a plethora of research studies, yet mostly from the professional users’ perspectives. Perceived end-user quality was studied in various experimental research designs. In our study, the results indicate that end-users acknowledge the drawbacks of machine translation and are not fully satisfied with the generated output. The higher the level of education, the less satisfied the respondents are with the machine translation quality. This finding may relate to other numerous research studies conducted with professional translators and language experts ([
38,
39,
40], among others). From the perspective of the education level, it might be argued that our results are, to some extent, in line with those by other authors, showing dissatisfaction with the quality of machine translation increasing with the higher level of education. However, all respondents seem to be unsure when asked about their satisfaction with the quality of machine translation output, as approximately half of them do not have a clear opinion about it. They are neither satisfied nor dissatisfied, which may also be related to the fact that to a greater or lesser extent, they make additional actions to the raw machine translated text in order to improve it. Only a small part of the respondents did not take any action and used the raw machine-translated text. This finding relates to the observations that it is important to improve the quality of the translations, even in such non-formal situations as personal communication [
10].
Machine translation is becoming more and more popular not only because of its technical advancement, but also due to its accessibility to end-users who may choose different modes of translation, i.e., translation not only that is text-to-text, but also translation from/to speech and images. The results of the current study show that the majority of the respondents use translation from text to text but they are also aware of and use translation for image to text, text to speech, speech to text and even speech to speech. What is more, the end-users who indicated that they relied on translation from speech to speech belonged to a younger age group and those who mainly used translation from text to text belonged to older age groups.
The findings of our study are hardly comparable with other research conducted on machine translation in other languages. As Lithuanian may be considered a low-resource language, the machine translation output is consequently of lower quality in comparison with that obtained for such big languages as Chinese, English, Russian, French, or Spanish, which receive far greater investment into data acquisition and parallel corpora development. Since the absolute majority of the respondents in the survey were Lithuanians who mostly indicated using machine translation when translating either from or to the Lithuanian language, their lower satisfaction with, perceived quality of machine translated text, and consequently acceptability might have been predicted to some degree. Users of machine translation output in Lithuanian might be dissatisfied with the machine translation, as, generally, the raw output demonstrates issues of fluency and accuracy, resulting in mistranslation, ambiguous translation, untranslated text, omission, and addition, as well as grammatical errors, such as agreement, incorrect part of speech, etc. [
18,
41]. This might imply that users of machine translation output in Lithuanian are generally more dissatisfied and, therefore, should be cautious about using raw machine translated text and taking them for granted. Therefore, sustainable measures, including different means to increase awareness of end-users as to the quality generated by machine translation system, should be established based on the perceptions of different social groups in different environments and settings.
