Article

Inspection and Assessment of Masonry Arch Bridges: Ivanjica Case Study

1
Faculty of Architecture, University of Belgrade, 11000 Belgrade, Serbia
2
Faculty of Construction Management, University-Union Nikola Tesla, 11000 Belgrade, Serbia
*
Authors to whom correspondence should be addressed.
Sustainability 2021, 13(23), 13363; https://doi.org/10.3390/su132313363
Submission received: 11 October 2021 / Revised: 29 November 2021 / Accepted: 29 November 2021 / Published: 2 December 2021

Abstract

:
The importance of masonry arch bridges as a traffic network element calls for a thorough analysis focused on both structural stability and loading capacity of these historical structures, considering the usage of these bridges in contemporary traffic conditions. This paper focuses on the analysis of longitudinal cracks in a single span masonry arch bridge to evaluate its influence on structural behaviour of the system. As longitudinal cracks do not necessarily present an inevitable collapse mechanism, analysis of the causes is crucial for evaluating the serviceability and functionality of the bridge investigated. The methodology is based on the following: literature review, observation of the stone bridge in Ivanjica, geological testing of the site, geophysical testing of the bridge, laboratory testing of mechanical characteristics of stone used for the bridge construction and biological analysis of the samples of implemented materials on the bridge. Finite element analysis of the bridge was conducted to define the causes of the longitudinal cracks. The 3D simulation model was based on the data collected through observation and experimental analysis. This paper provides extensive research on a single span masonry bridge, examining how different deterioration mechanisms, in conjunction, can lead to the appearance of cracks in masonry arch bridges and provide remedial measures accordingly.

1. Introduction

Older stone bridges are part of the rich historical heritage. Only a few of them remain to date in Balkan countries. after many of them suffered damage in their past. Nowadays, they are witness to cultural and social features of the period they were built in. Most of these bridges were designed centuries ago, being built according to empirical rules not matching the loads of contemporary traffic. The excellent durability and carrying capacity of masonry arch bridges is shown through their continuous use, as they are still in service with the massive use of motor vehicles that replaced carts [1]. The Industrial Revolution led to the development of new materials, mainly steel, and thus reinforced concrete, consequently, led to gradually declining masonry structures. The appearance of cracks, which is common in masonry structures, as well as the aging of materials and structural deformations, result in a decrease in stiffness requiring an investigation into the structural behaviour to ensure long-term stability [2]. Consequently, these structures need to be inspected to minimise damage risk since there is a possibility of experiencing significant economic and social losses [3]. The primary maintenance method of these bridges is focused on the proper direction of water runoff as well as on control of growing vegetation that appears on bridge structures [4]. Among stone bridges in Serbia, there are only a few that have not been altered before since most of them needed repairs and restoration in the length of time. Any further intervention on these structures requires a careful and cautious approach to maintain structural stability and another usage without compromising its architectural and monumental value. Hypotheses can be made based on the previously observed and read as follows: To establish the proper treatment of a masonry arch bridge to prevent any further deformation and opening of the existing cracks, it is necessary to study their structural behaviour as well as to determine the causes of the damage. These can only be conducted based on the analysis of features of both the bridge itself and building materials used.

2. Research Objectives

The case study of the old stone bridge in Ivanjica, Serbia, will be considered in this paper. According to the defined hypothesis in this paper, the following research objectives are set as follows:
  • Active investigation of the site to determine the condition of the bridge and to ensure that adequate measures can be taken for the protection and safeguarding of this historic structure as well as the unique spirit and landmark quality of the entire Spatial Cultural-Historical Units of Great Importance in the Republic of Serbia.
  • Conducting all necessary research to provide the protection measurements, the maintenance of stability and preservation of the integrity:
    -
    Geological testing for determination of soil quality and foundation stability;
    -
    Geophysical testing using geoelectrical tomography to determine the physical characteristics of the internal bridge structure;
    -
    Laboratory physical–mechanical testing of stone structure samples to determine physical and mechanical characteristics;
    -
    Biological analysis of damaged stones to determine degradation level;
    -
    Structural analysis through the numerical model for determining the causes of longitudinal cracks on the arch barrel.
  • Perceiving the results of conducted research to determine the causes of deformations and cracks of the stone arch bridge.
  • Systemise the obtained facts about the causes of deformations of the bridge and analyse its structural behaviour, assessing the stability of the structure, and suggest necessary measures to preserve this historic structure and prevent further deterioration.
  • Enhancing knowledge about the possibility of protecting stone bridges to prevent further degradation, particularly the development of new cracks.
  • Enhancing consciousness concerning the values and methods of historical monuments preservation.

Literature Review

Even though masonry arch bridges usually follow simple forms [5], the complexity of their understanding and investigation lies in the variety of ground conditions, geometries of the structure, sensitivity of materials used, weathering conditions and maintenance measures [6]. In masonry arch bridges, the damages can be followed by various problems that must be thoroughly investigated. For the structure to be restored and its further deformations prevented, the causes of the damages must be analysed. Masonry arches, as a result of inhomogeneous composition, show complex patterns of failure. Before the loss happens, significant damage with the formation of numerous hinges can occur, which raises the question, what range of damage is acceptable for serviceability of the structure [7].
Masonry arch barrels transmit live loads in two perpendicular directions: longitudinal and transverse. Longitudinal (yz plane) is the one corresponding to bridge span and transverse directions correspond to the bridge depth (xz plane) (Figure 1). The main criteria for transferring the load in the longitudinal direction is the behaviour of the arch barrel. The response in the transverse direction is the pressure on the inner side of the spandrel and wing walls [8]. This lateral pressure can cause the overturning of the walls and often causes detachment of wall and longitudinal cracks between the spandrel and the arch ring [9]. Garrity recognised materials deterioration, spandrel wall detachment, arch barrel defects and foundation disruption as the primary defects in masonry arches [6]. This author’s summary is in accordance with other authors who investigated potential sources of failure and collapse of masonry arches [10,11,12,13,14]. The focus of this paper is longitudinal cracks observed in the case study of the Ivanjica bridge. Contrasting to transverse cracks that appear on the barrel’s intrados and lead to development of additional hinges, thus altering the stability of the structure, longitudinal cracks can appear without endangering structural stability [15]. Barrels built as a single span masonry arch bridge are highly statically indeterminate, fairly extensive cracks do not usually cause the collapse, as the alternative load paths are developed, providing that the forces applied to the structure can still be transferred to the supports [16,17]. Few phenomena lead to the development of longitudinal cracks. The first phenomenon is out-of-plane movement of the spandrel wall, embodied in the form of leaning, bulging and development of longitudinal cracks on the contact zone of the spandrel wall and an inner area of the arch. On the one hand, bending of the arch barrel under live load produces shear stresses in the inner part of the bridge, whilst the stiffer spandrel wall responds differently, which causes the appearance of longitudinal cracks on their contact zone [9,15,18,19,20]. Traffic load will produce flexing of the arch ring due to shear stresses in the ring at a relatively flexible part with only fill above [21]. When this happens, both the inner and outer zone of the bridge continue working separately. The structure’s collapse mechanism depends on the arch barrel’s response in the transversal direction, i.e., on the appearance of a sufficient number of hinges that could convert structure to the mechanism. Moreover, this kind of crack can appear in the middle parts of the arch barrel, usually in its second third, resulting from traffic overload and deflections in that area [22]. On the other hand, the physical changes in the fill material can generate out-of-plane behaviour of the spandrel wall. When exposed to moist conditions and low temperatures, pores of the fill material are suitable for ice formation, followed by material expansion and thus induction of horizontal pressure on the spandrel wall [15,17,22,23,24,25]. Additionally, the reason for longitudinal cracks can be the wash out of bridge foundation [23], usually provoked by the suffusion of bearing soil beneath the foundations, and such cracks appear in the lower zones of the bridge closer to them.
The second group of deterioration mechanisms that do not directly influence the stability of the structure are physical processes that lead to deterioration of material and, consequently, influence the structural behaviour of the structure. One of the main accompanying processes that is recognised in literature is leakage of eater into the arch barrel, which promotes washing out of the finer particles, and the acid nature of water can be a catalyst for dissolution of carbonate products, followed by the possible freezing cycles [15,25]. Softening of materials, associated with the appearance of cracks, can lead to the change in structural behaviour and redistribution of stresses.
Nonetheless, to conduct a thorough structural analysis and determine the cause of damages on the arch stone bridge in the case study, it is necessary to analyse the geometry of the bridge, which is crucial for the stability of masonry bridges [26,27], but also to explore the materials built into the bridge [28]. The analysis of the condition of building material is especially important for the overall stability of the bridge. However, this research focuses on investigating the current condition of the Ivanjica bridge, investigating possible causes for the state found, and predicting possible future behaviour whilst proposing remedial measures.

3. Case Study Methodology

Since this research aims to analyse the longitudinal cracks found on the arch barrel of the bridge in Ivanjica, in the following part of the paper, possible causes for this problem will be investigated. For the research shown in this paper, the following methodology is applied:
  • Data analysis using literature review, analysis of previous studies and the systematisation of knowledge about the problem of cracks on arch stone bridges.
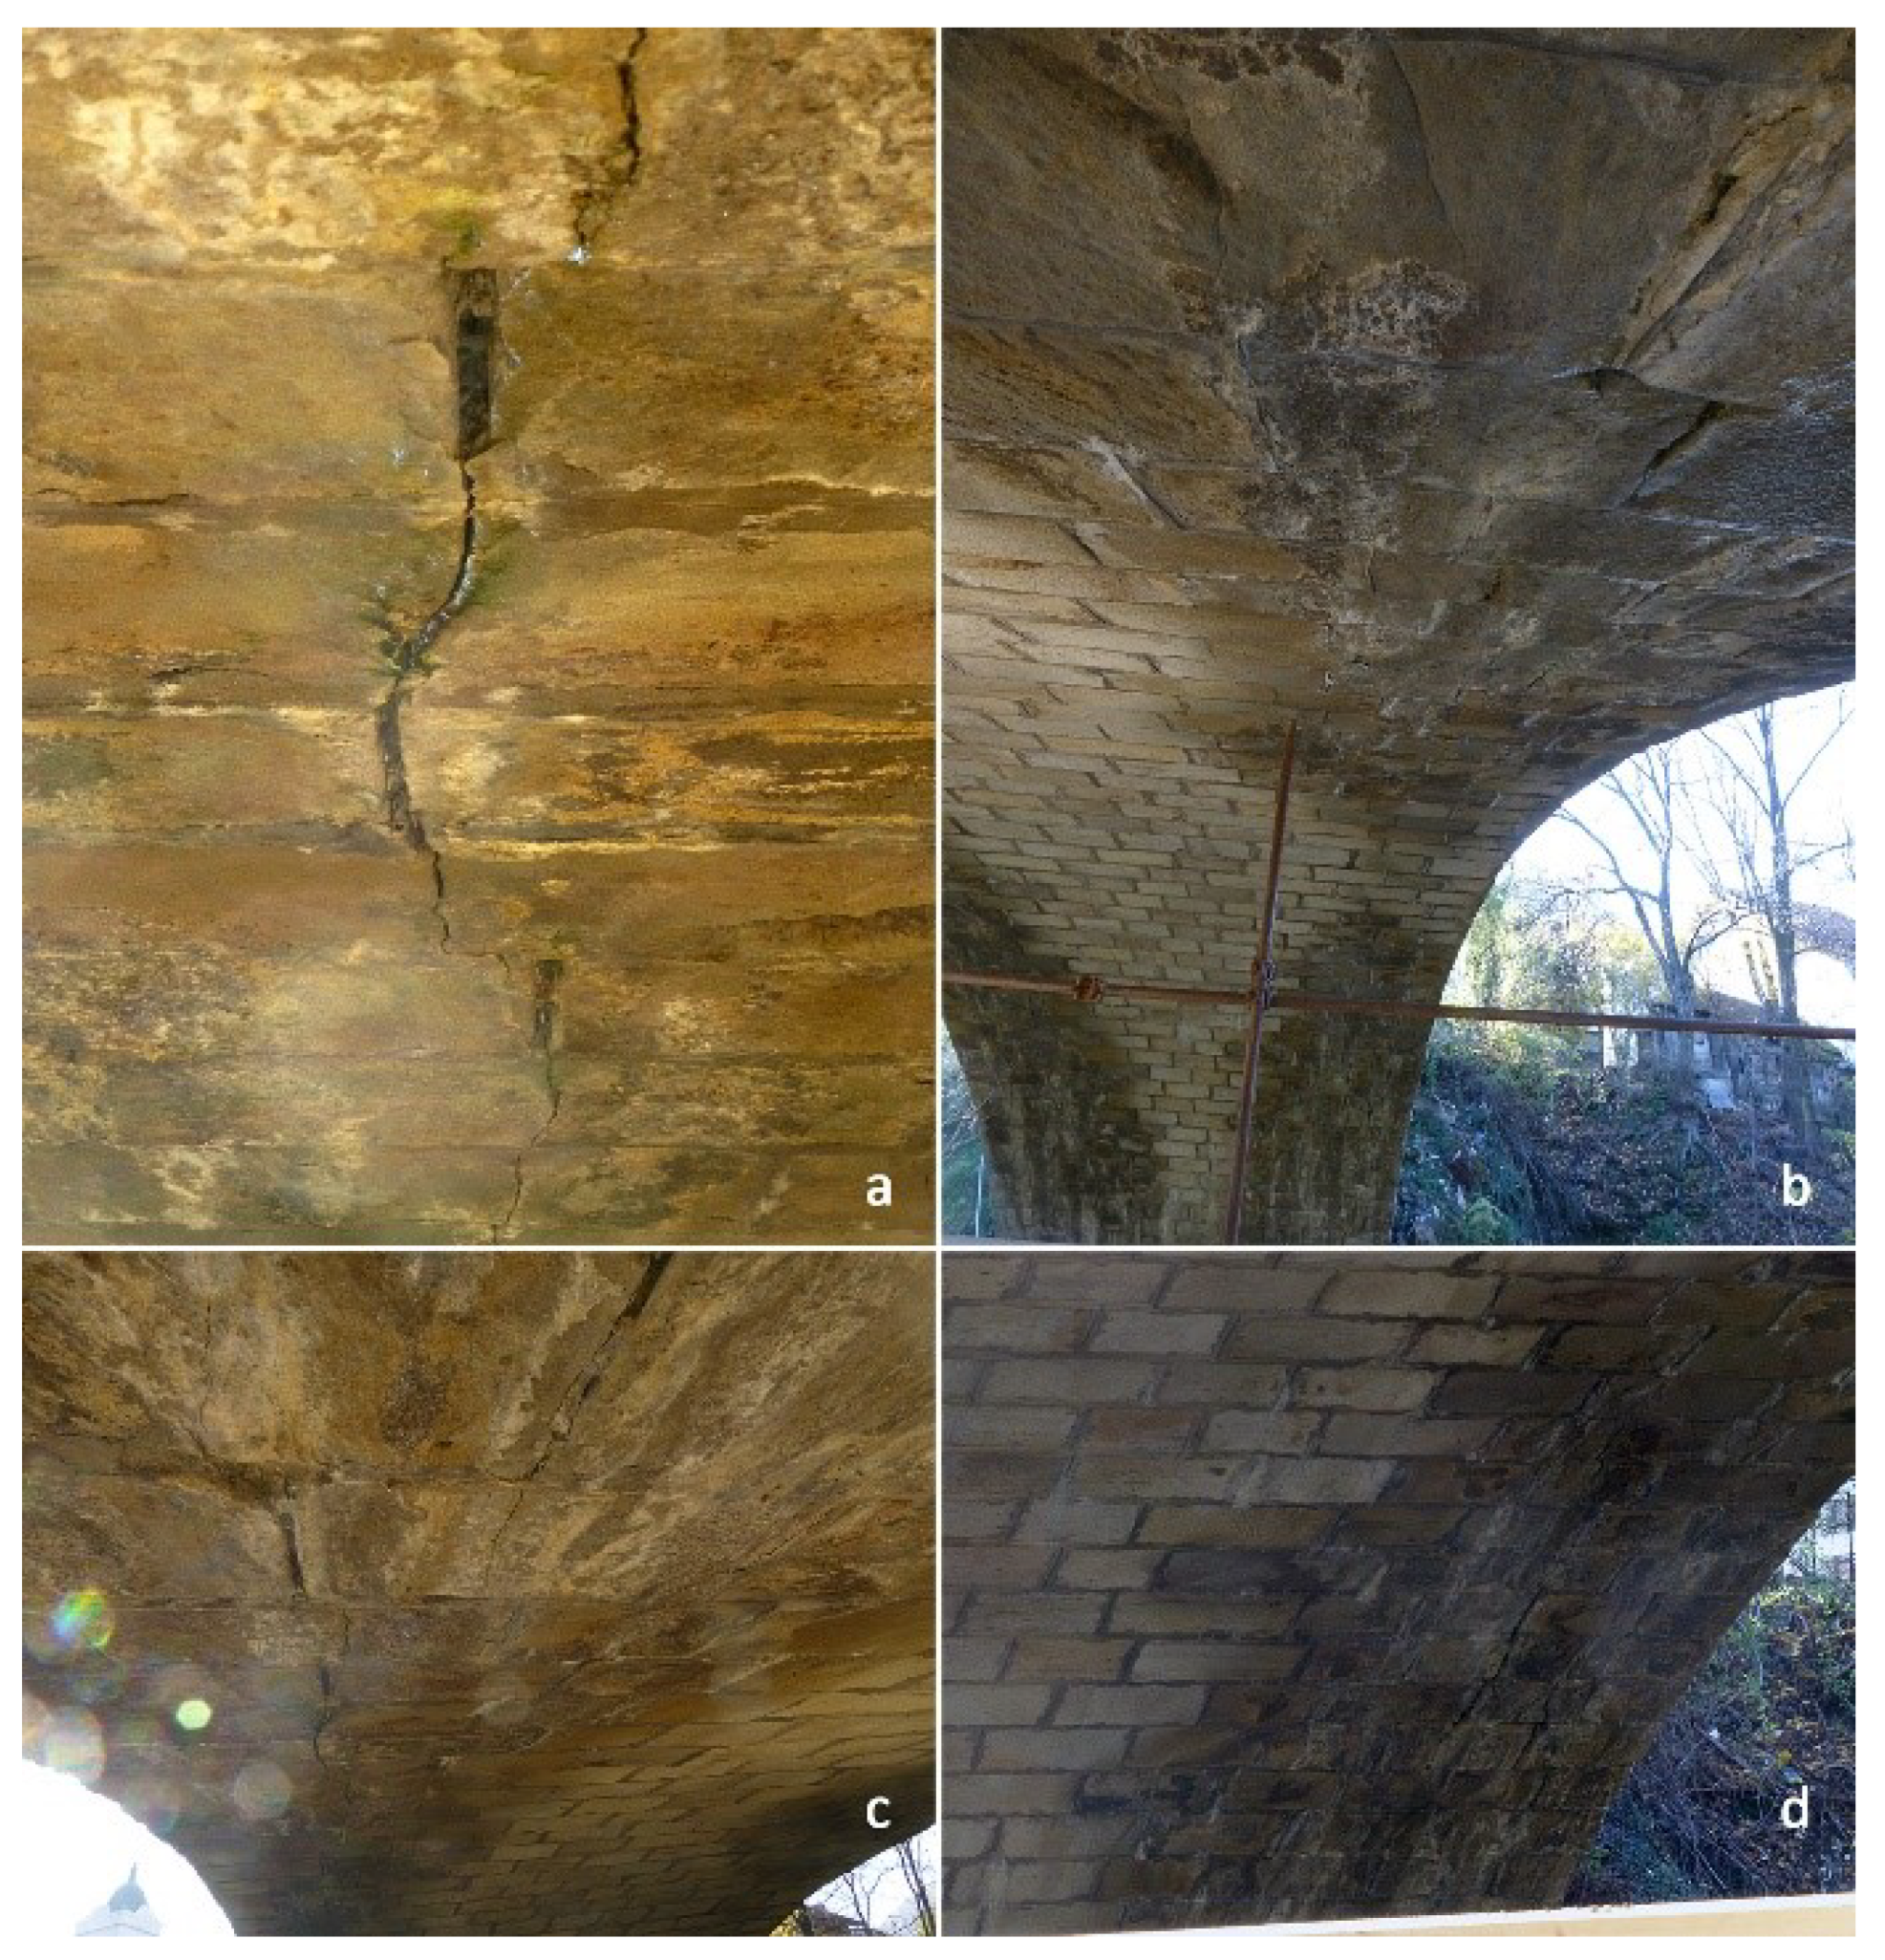
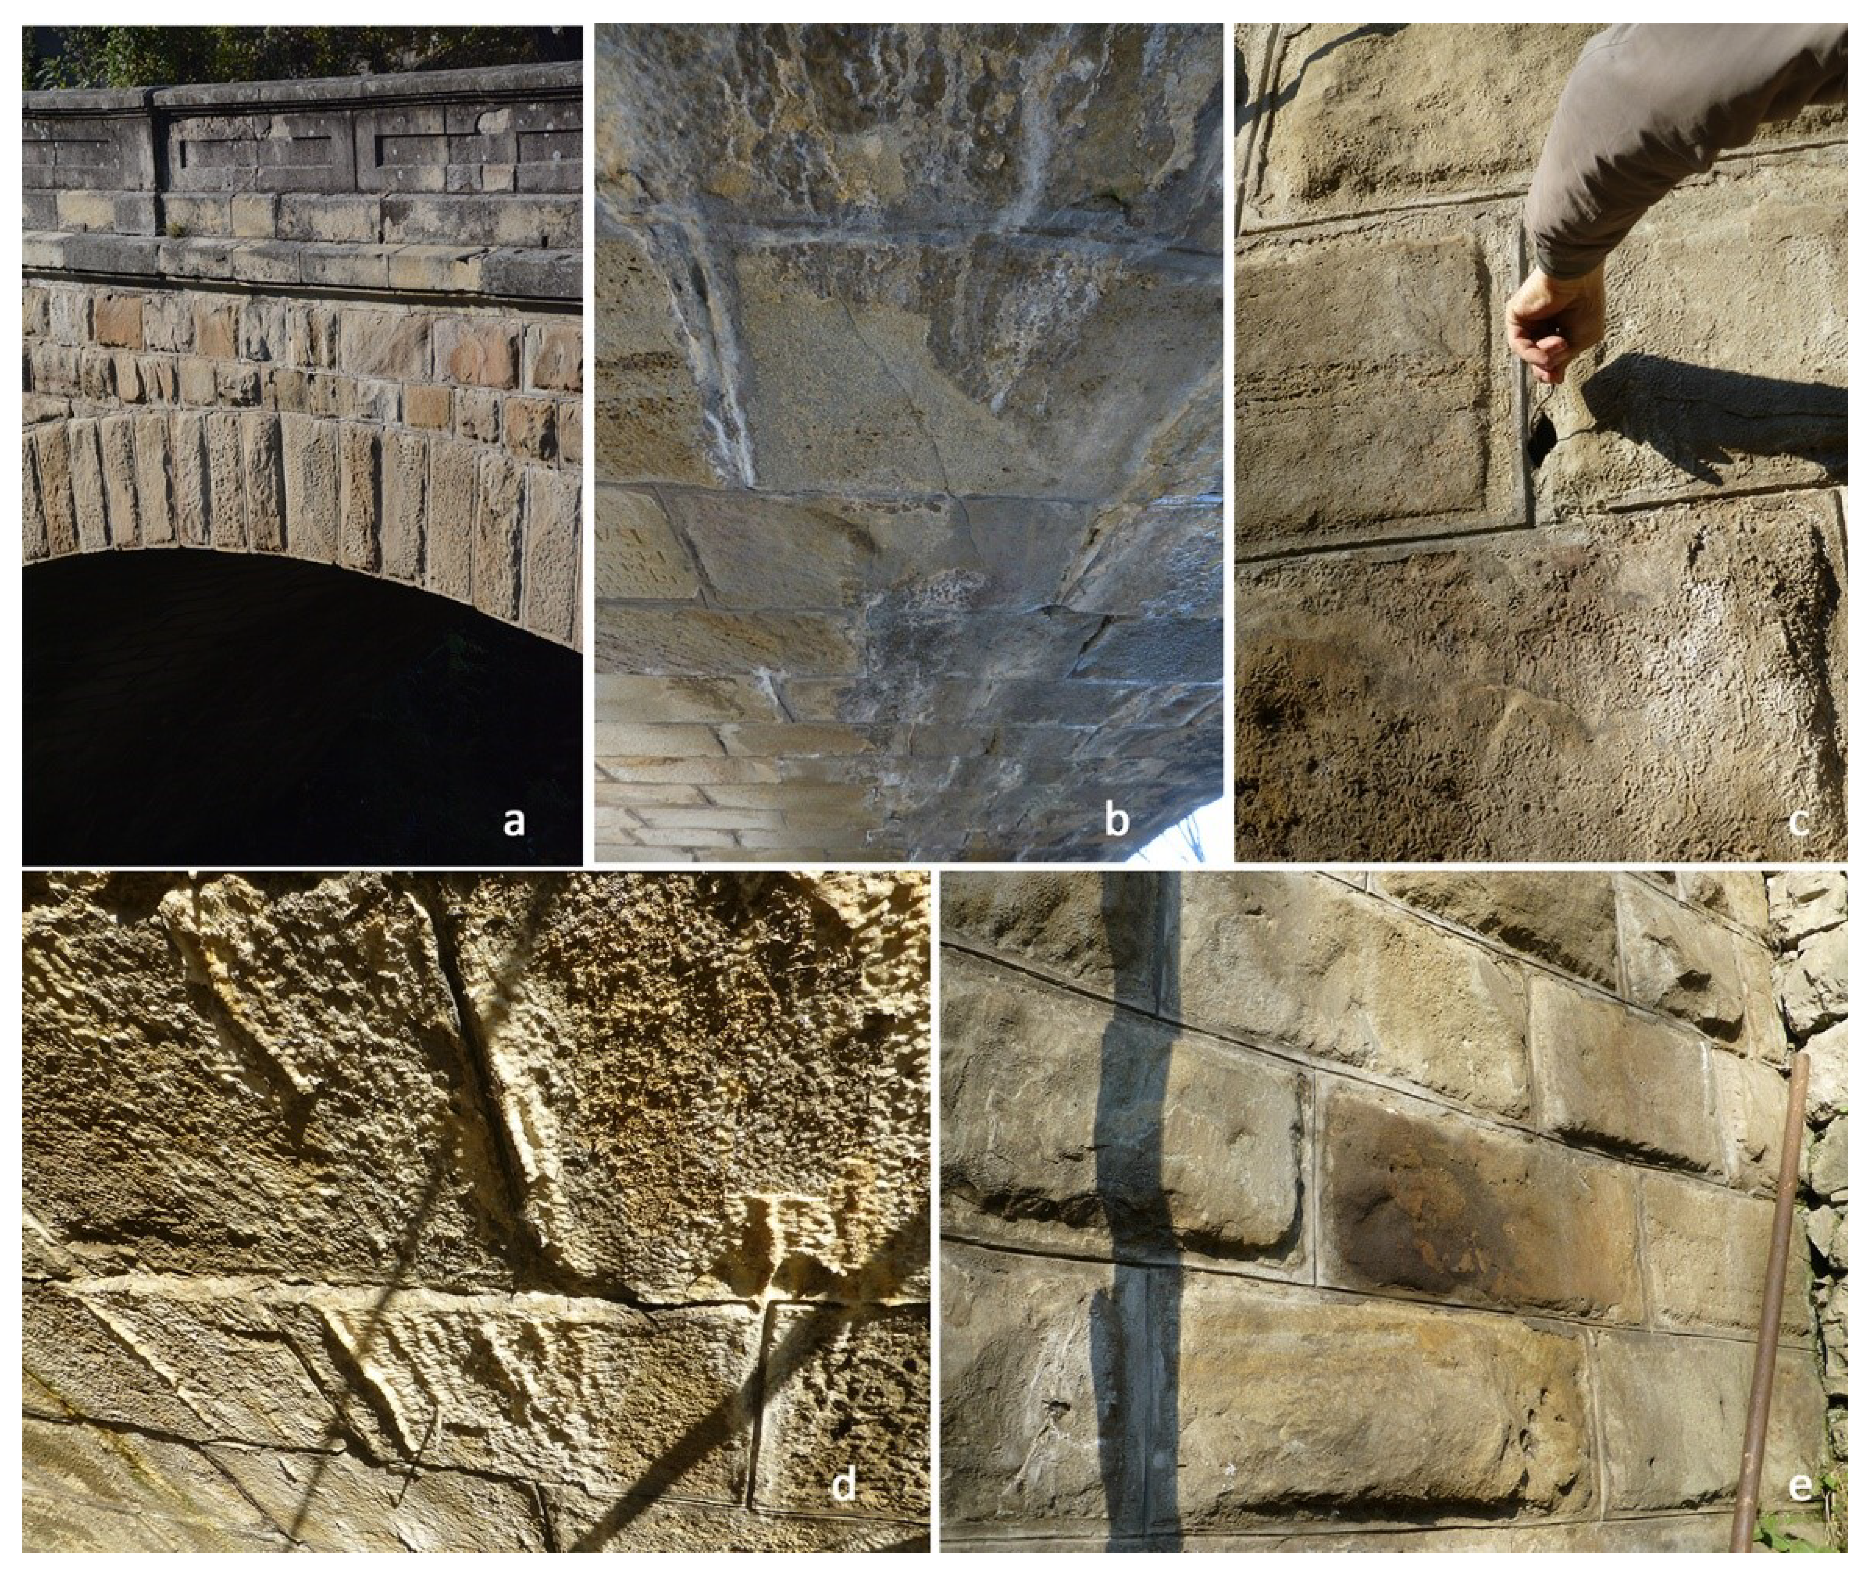
  • Observation on the site focused on the built-in materials state, monitoring of supporting elements and the soil beneath the foundation, detection of cracks on the bridge’s arch barrel and detection of other damages related to the degradation of the stone structure on the bridge’s parapet.
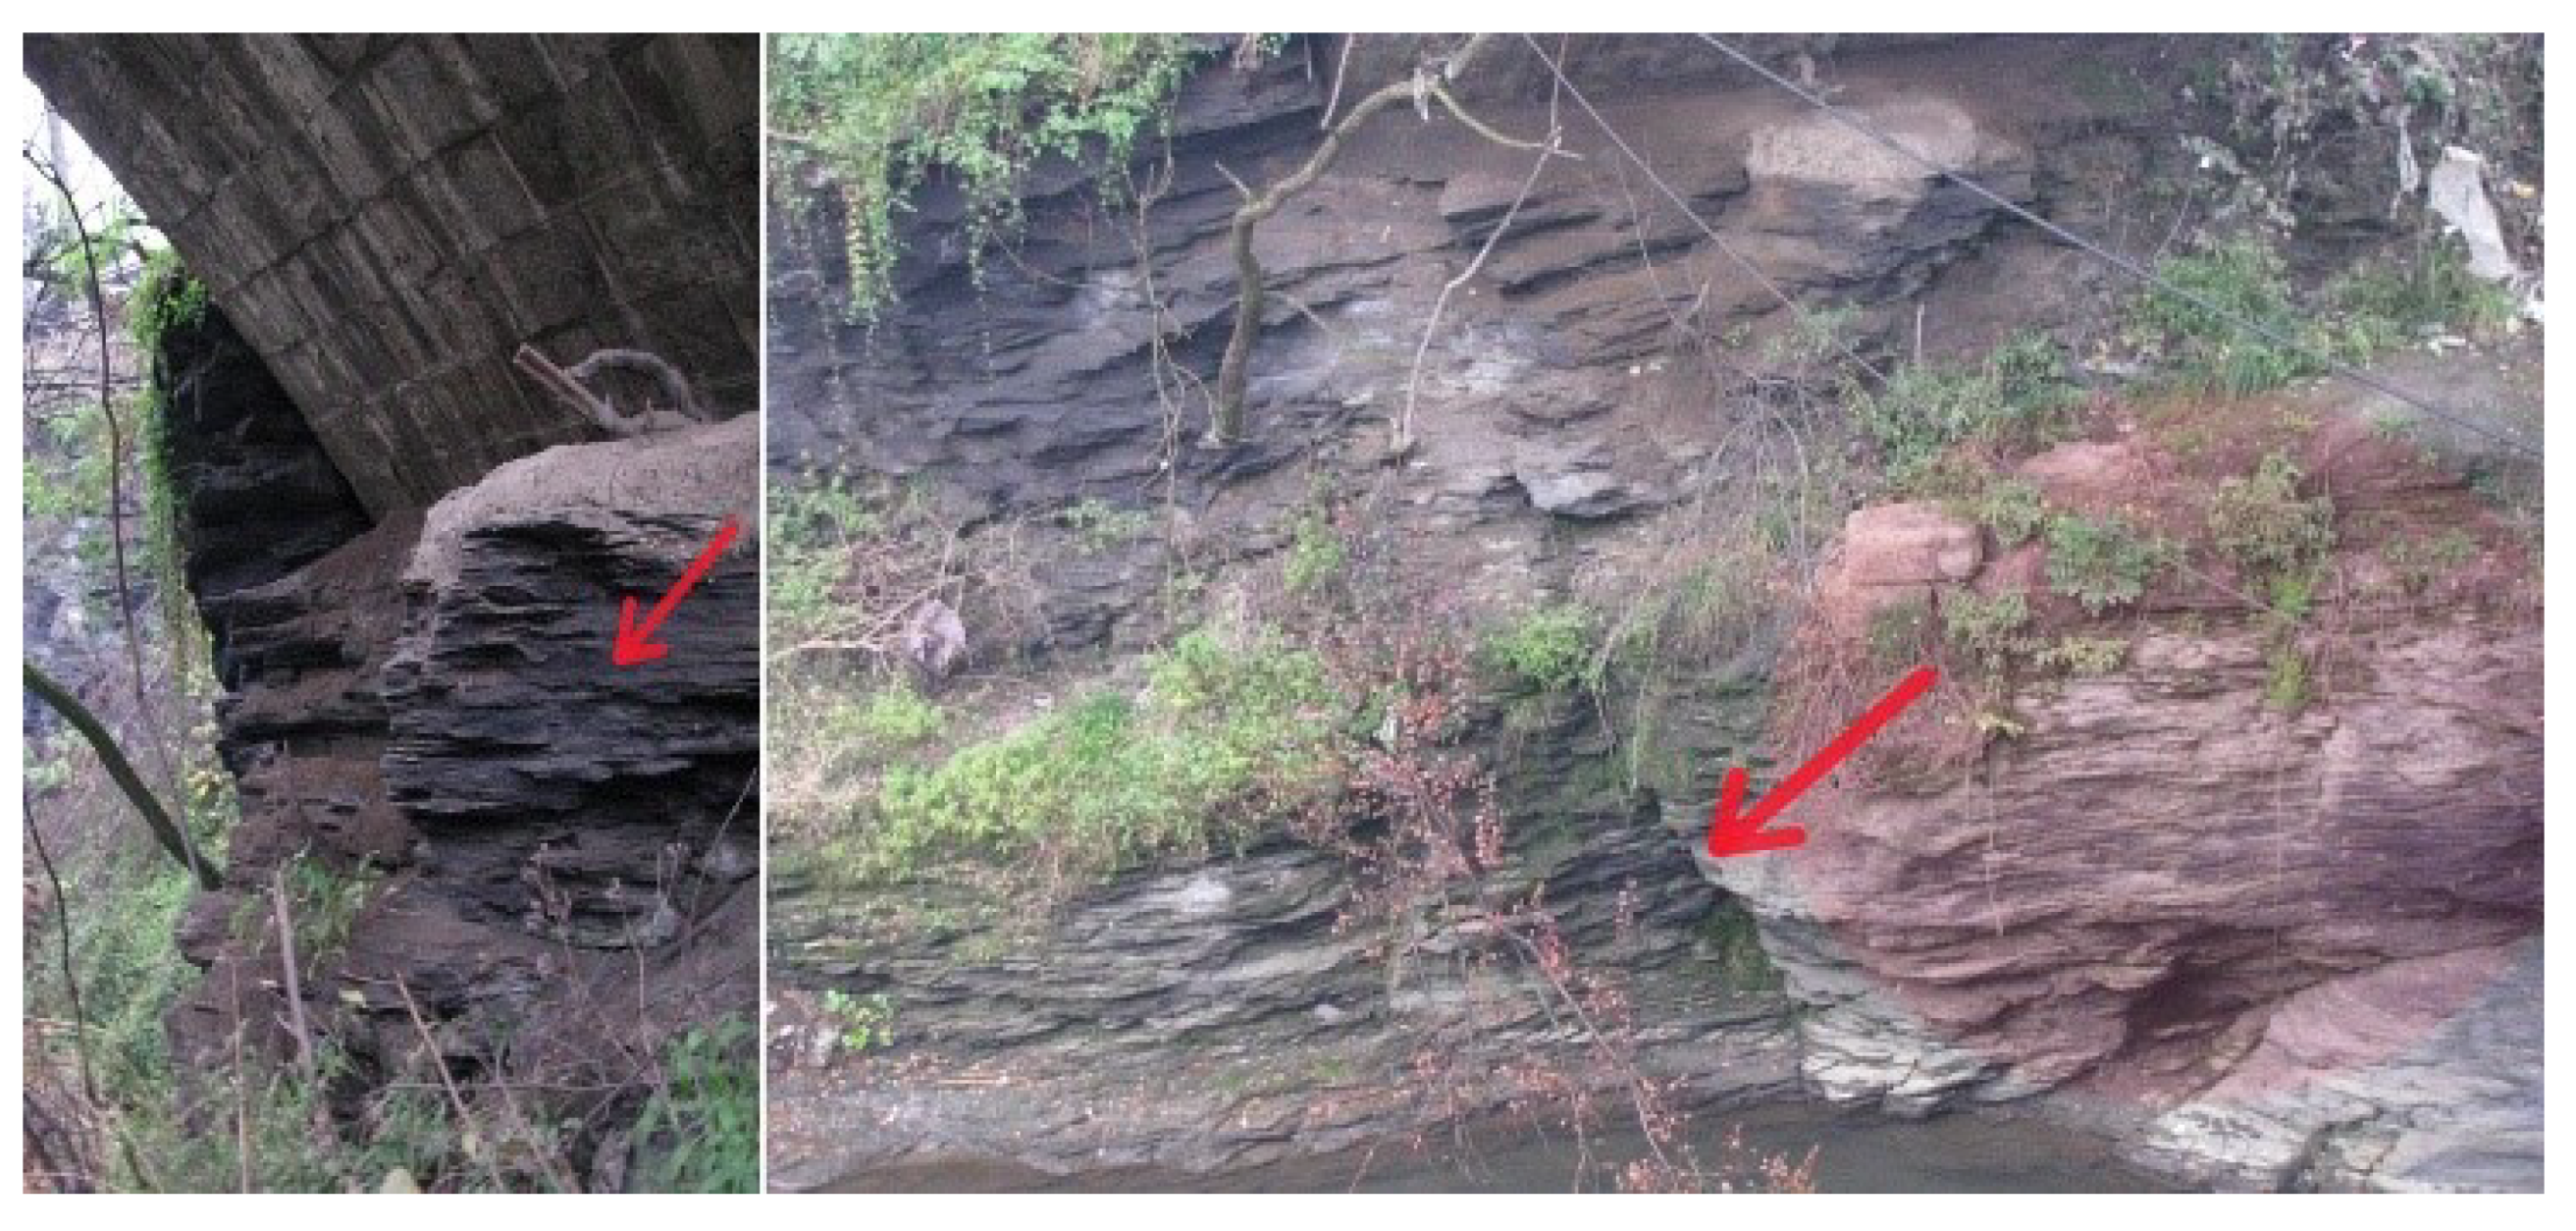
  • Geological research of the characteristics of the soil beneath the foundation of the stone bridge in Ivanjica and research of the geological and engineering properties of the geological substrate and its influence on the structural stability of the construction.
  • Geophysical testing using a non-destructive method of electrical-scanning tomography and the analysis of the results.
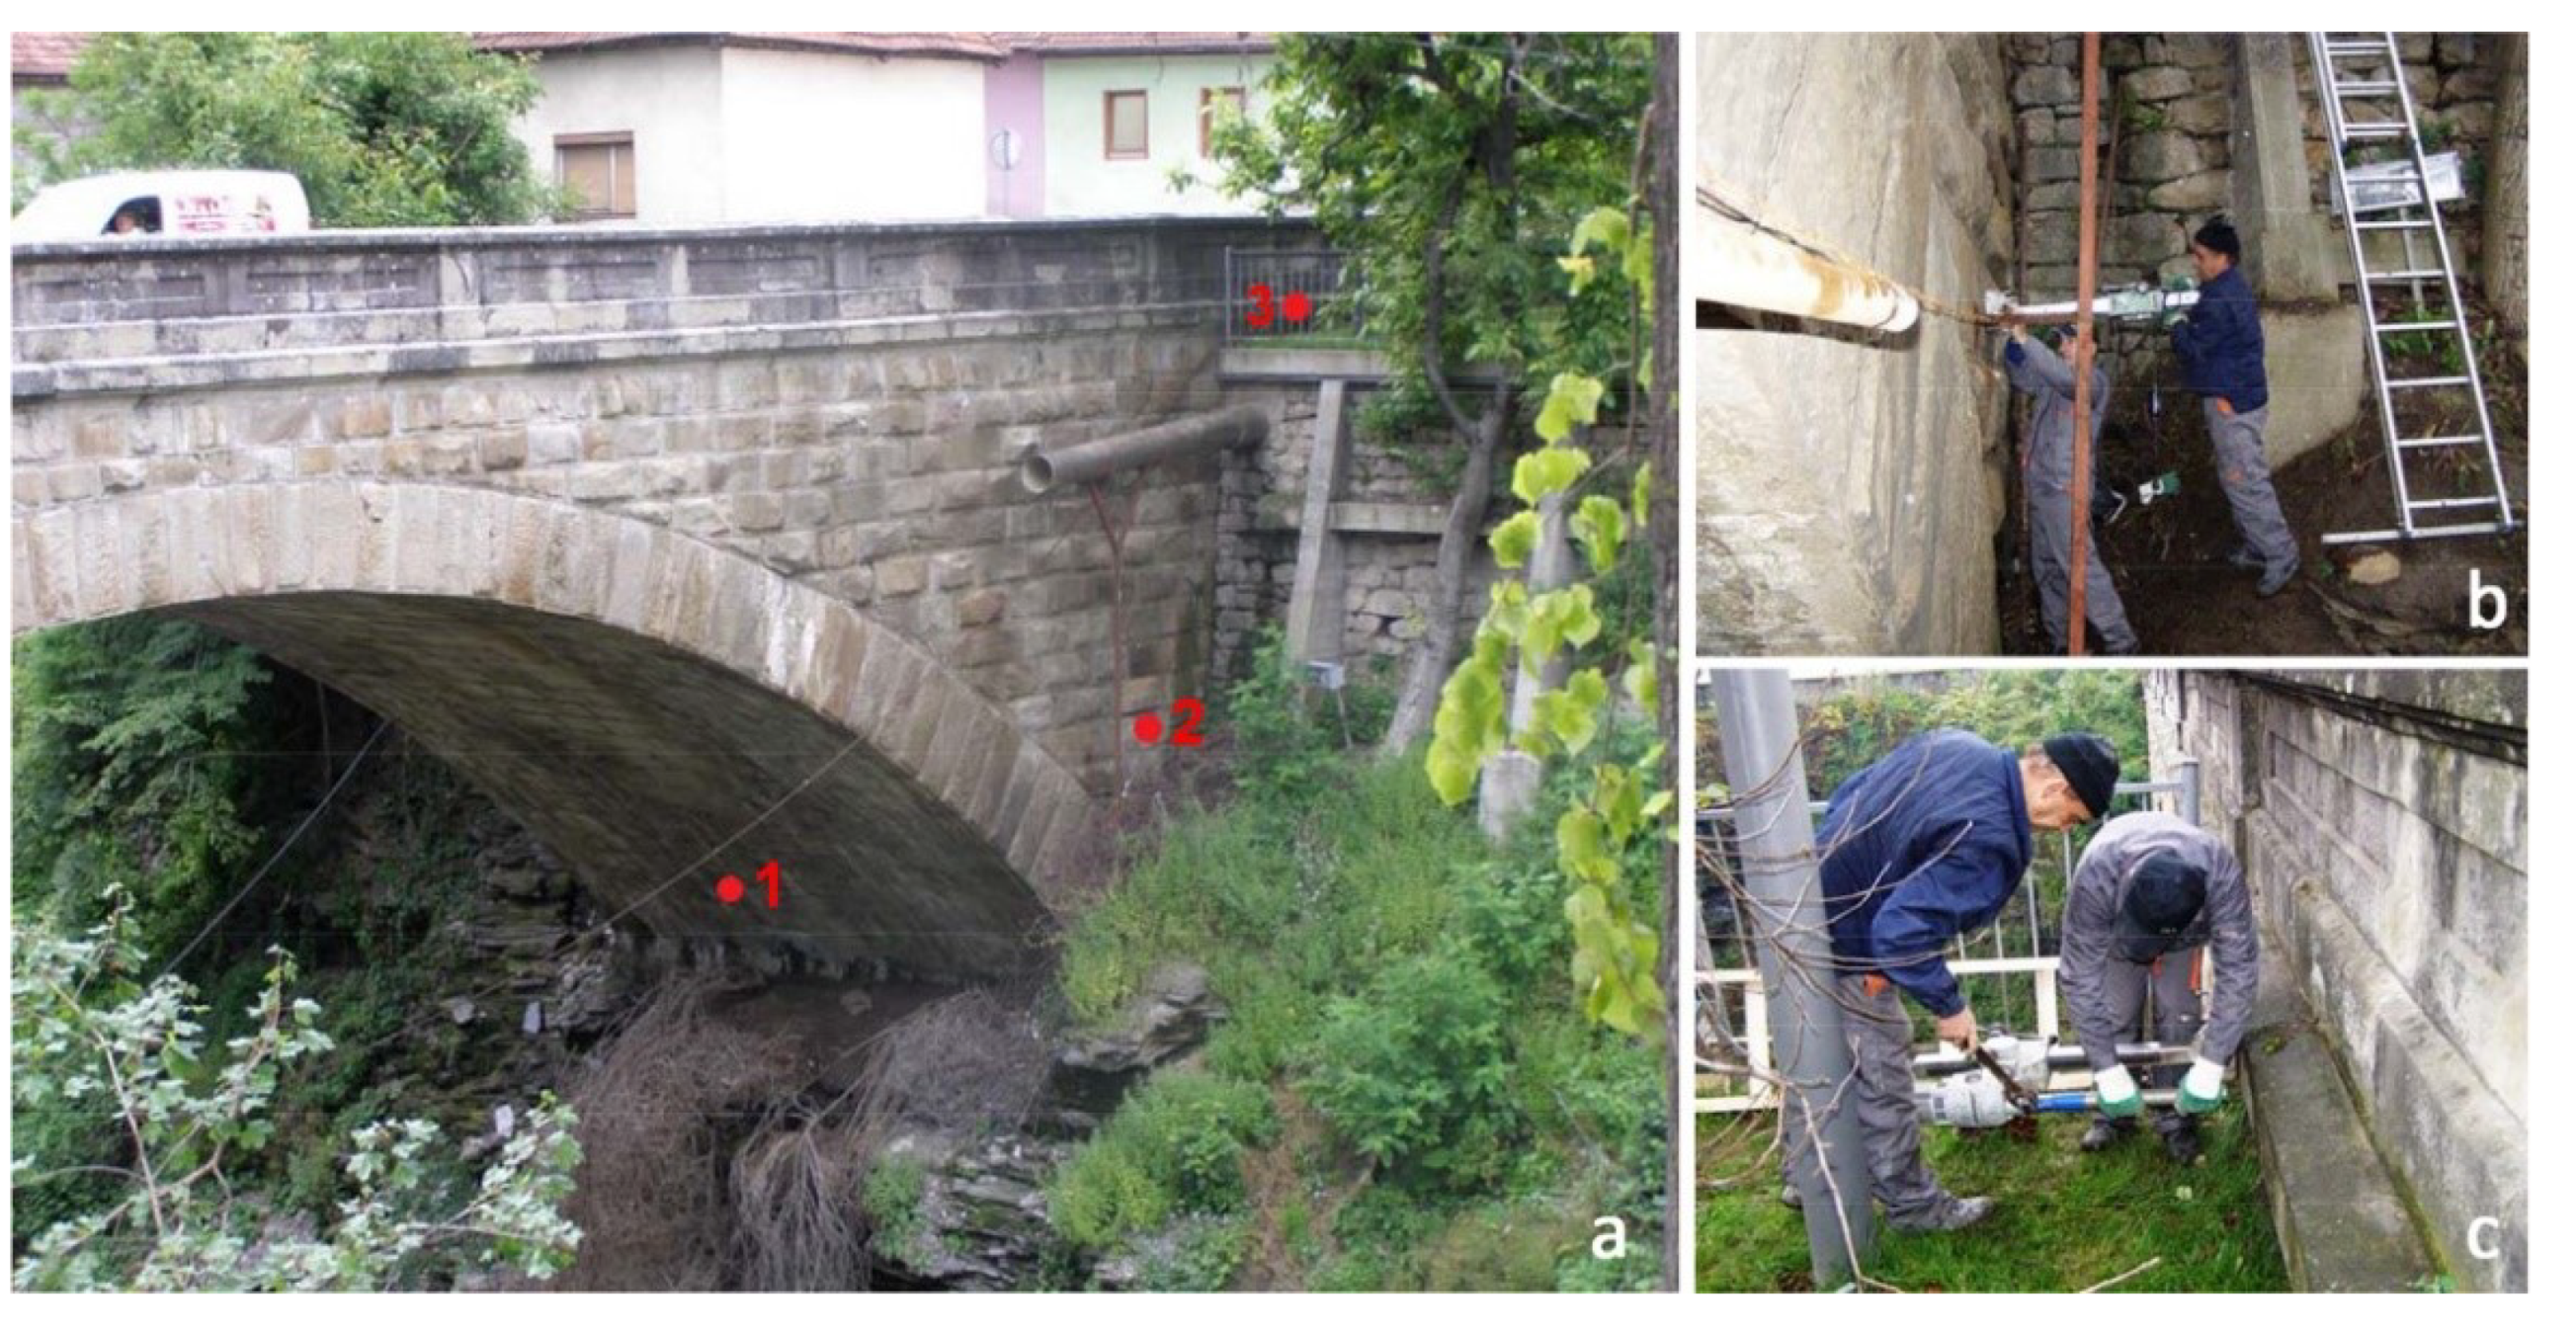
  • Physical–mechanical testing of stone characteristics used for the bridge structure based on stone samples gained using the mechanical sample destructive-extraction method for analysis. Laboratory testing also included the testing of mineral petrographic properties of stone, axial stress strength, volumetric of stone with and without the pores, stone porosity and its hygroscopic characteristics.
  • Biological (mycological) analysis of the substrate samples from the stone bridge using macroscopic and microscopic examination.
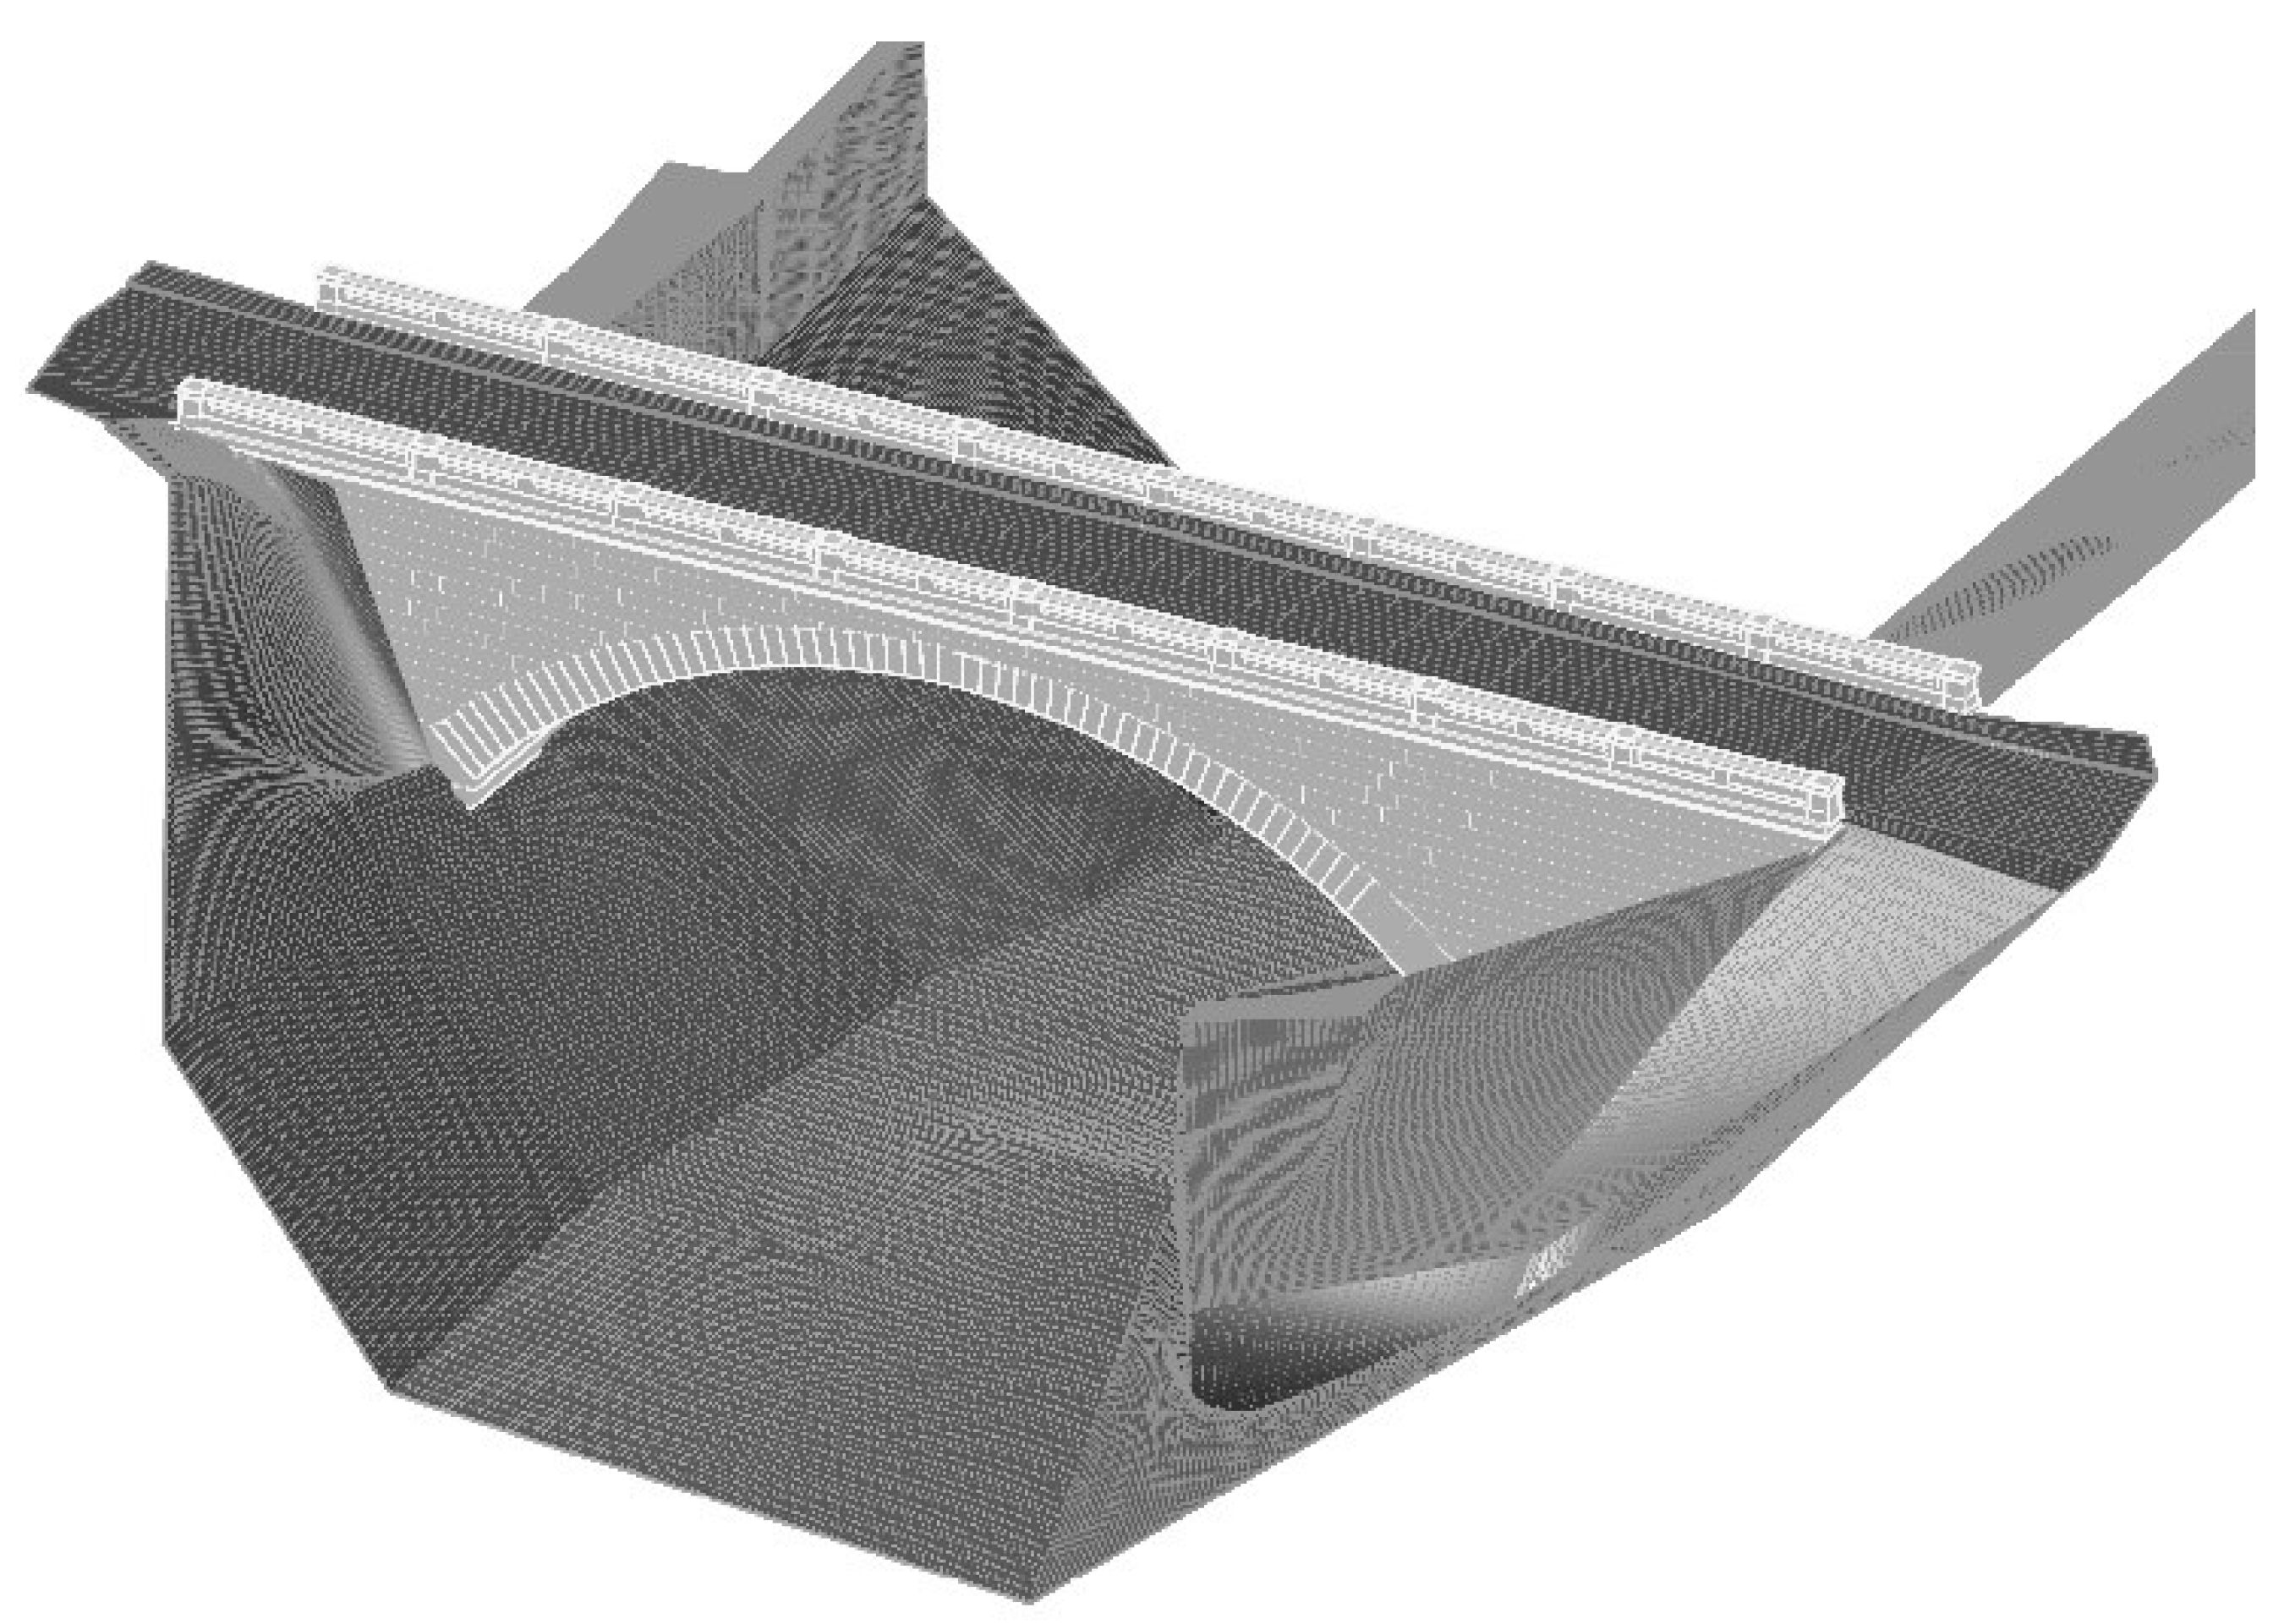
  • Three-dimensional model simulation based on finite element method and bridge analysis under loads (Radimpex Software: Tower7).
  • Discussion regarding previous analysis and developing conclusions about causes of bridge damages and the appearance of cracks.
  • Proposition for the restoration of the arch stone bridge in Ivanjica based on the data given through previous analysis.

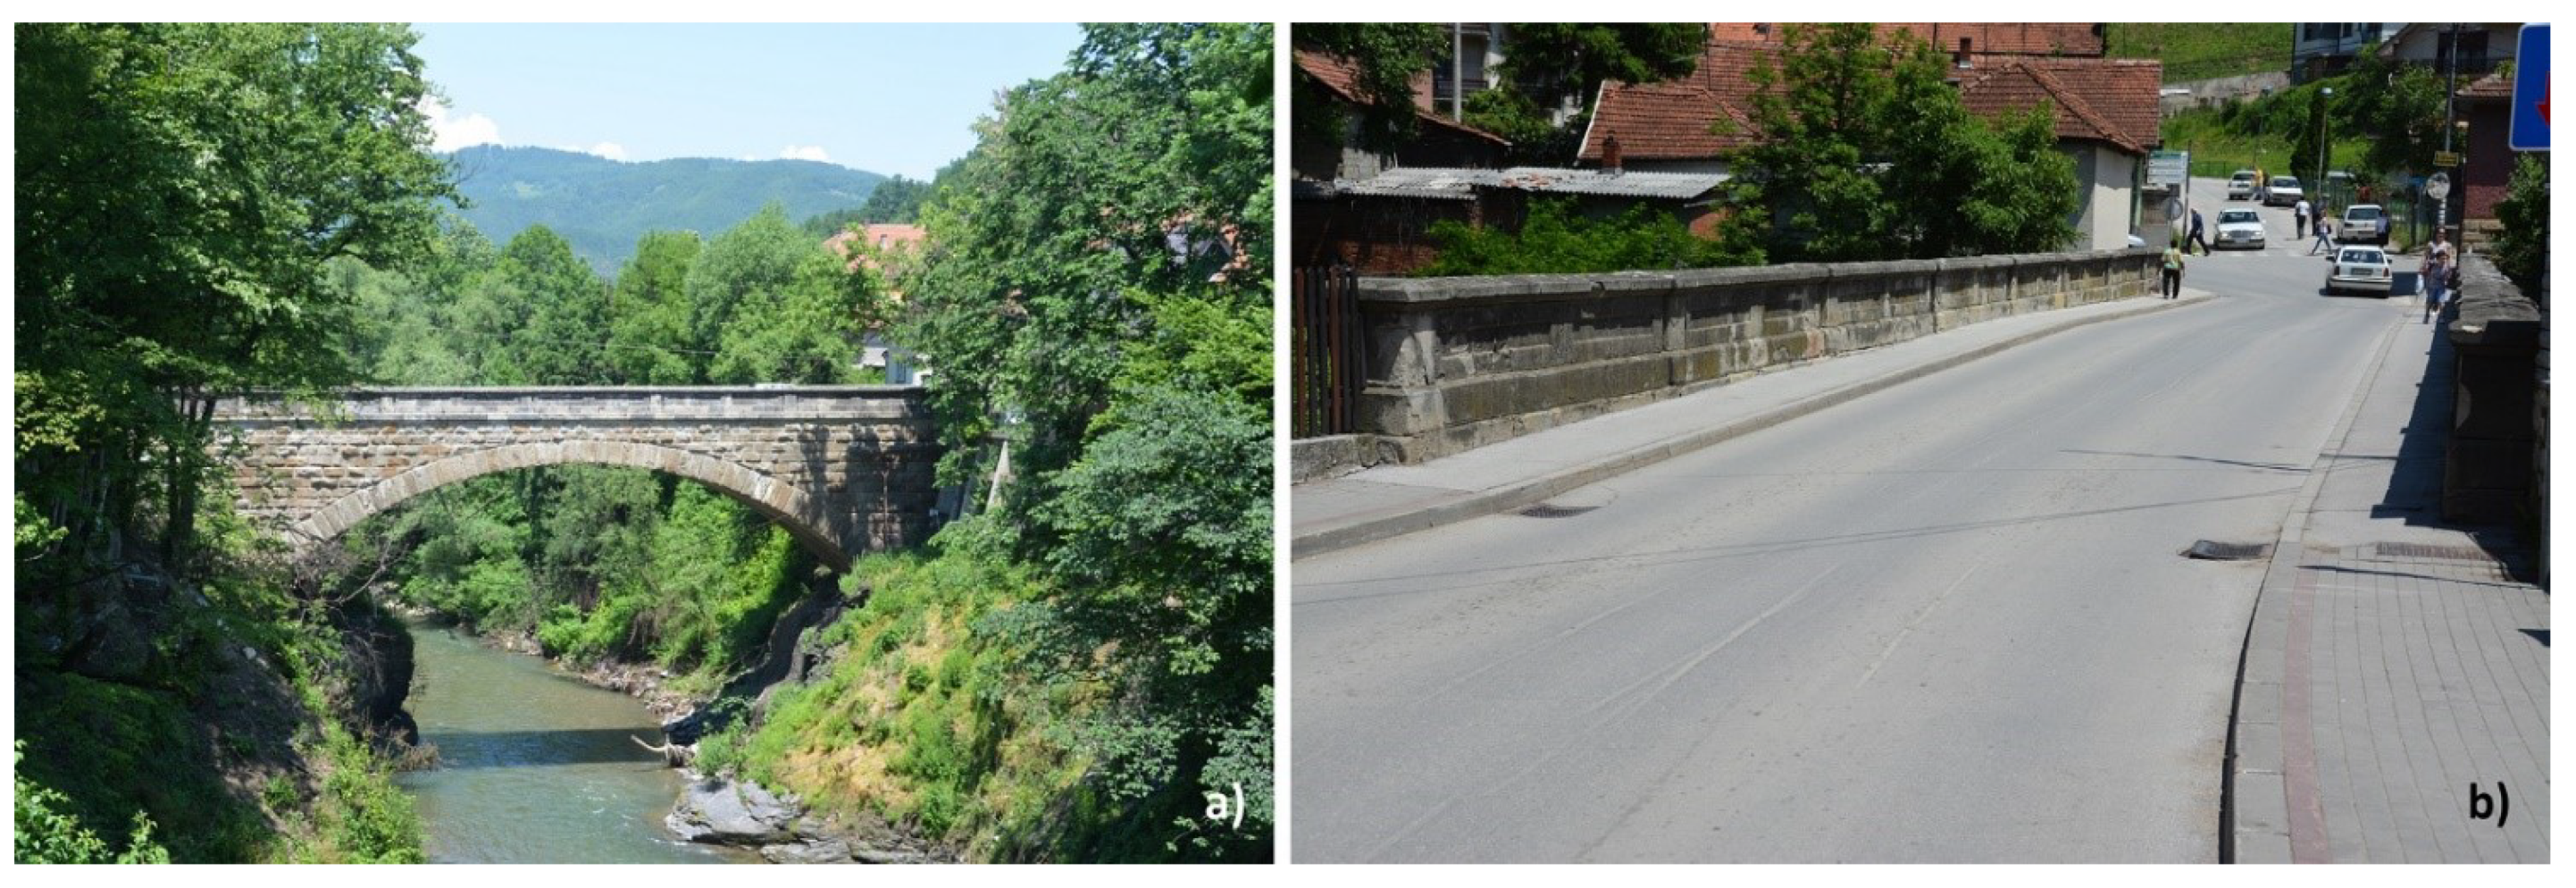
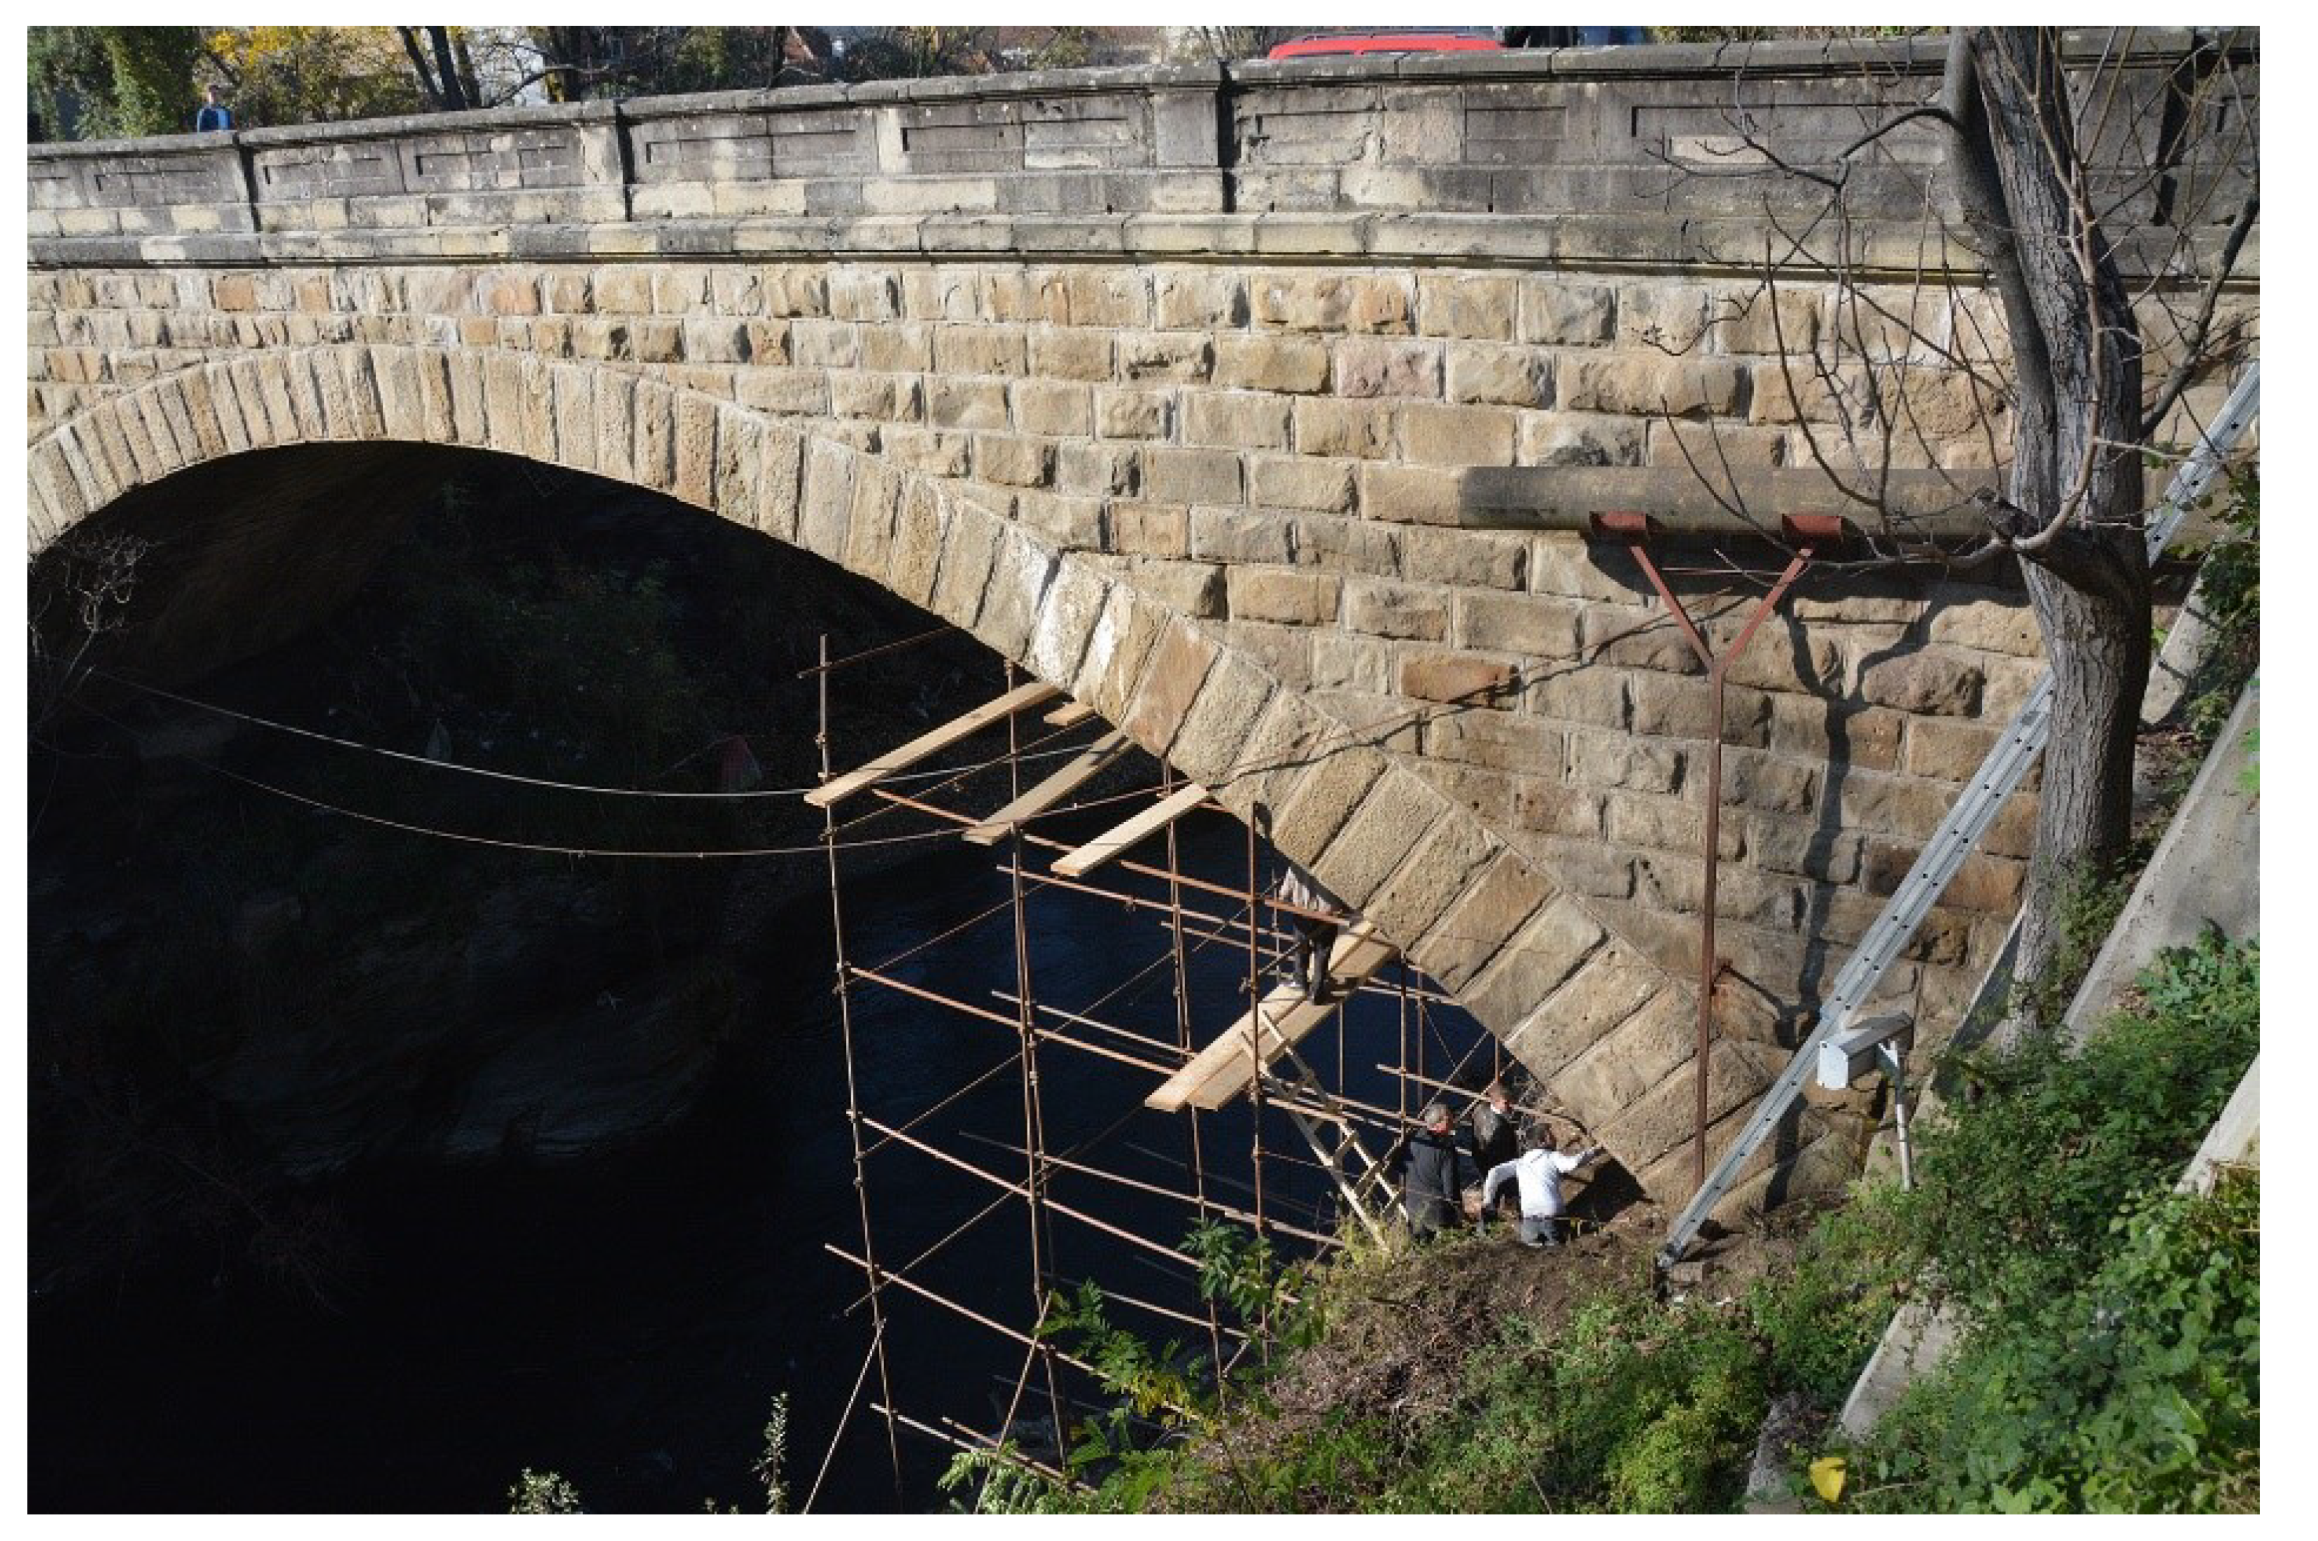
3.1. Ivanjica Stone Arch Bridge Background

The subject of this case study is the single-arch stone bridge in Ivanjica (Figure 2), located in the southwestern part of Serbia. The bridge is situated in the city centre and it connects the coasts of the Moravica river. It was built between 1904 and 1906 and designed by Milenko Trudic. Construction of the bridge was funded by the Kingdom of Serbia and performed by the local construction company of Blagoje Lukovic, as testified by the inscriptions on the bridge. To date, it has not gone through any significant repairs or restoration. Because of the visible damages, since 2014, the heavy vehicles on the bridge have been banned. Nowadays, it is used by light motor vehicles and pedestrians only. This bridge is listed as the Spatial Cultural-Historical Unit of Great Importance in Serbia and protected by the state.

3.2. Bridge Construction

The construction of the bridge and its current condition was determined during site visiting. Bridge survey was conducted using dual-axis compensation Total Station Leica TC407 7”, an instrument that records accurate measurements: distance 2 mm + 2 ppm, angular 7” (displays to 1”). Measurements obtained were transferred in AutoCAD software using Leica Instrument Tools software—Data Exchange Manager. A 3D model of the bridge (Figure 3) with its precise construction was performed in AutoCAD software using collected measurements. Measurement accuracy was essential for determining the exact position of bridge supports. Detailed inspection of the arch barrel and measuring the cracks was conducted through observation from the formwork, placed on the right side of the river. Dimensions of stone blocks were measured on site.
The bridge is a single span construction in the form of a segmental arch, with the span of s = 27.3 m and rise of r = 6.0 m, arch radius on the intrados is R = 19.3 m, the width of the arch barrel is 7.9 m and it is 13.5 m above river level (Figure 4). The bridge’s total length is 49 m and its usable width is 6.6 m (2 lines × 0.9 m of walking zone + 4.8 m traffic zone). During measuring on the site, it was determined that the bridge is asymmetrical, and its abutments are on different heights. The height difference is 0.48 m (Figure 4). As a consequence, the difference in wing wall height from the abutments to the belt course on the left side of the bridge is 6.9 m and it is 6.4 m on the right, while the height in the middle of the bridge, from the intrados to the belt course, is 2.1 m. The crown of the bridge varies in height because of different radiuses of extrados (22.5 m) and intrados (19.3 m). The difference between their centres of curvature is 2.28 m. This bridge falls into the group of large span bridges 15.0 < s (m) with a shallow arch r/s = 0.22 < 0.25 [29]. The formwork was supposed to be used for construction based on its shape and quality, even though there is no record (Figure 4).
Level of the bridge was formed close to the horizontal line with minimum incline for water drainage, which is not common for bridges in the Balkans since they were mostly built with high incline under the Turkish builders’ influence. The traffic and pedestrian zones are asphalted.
Natural carved sandstone was used to construct the bridge, with the addition of metallic cramps to provide adequate stone interlocking. All the embedded stone blocks were box shaped and of different dimensions as measured on-site [30]:
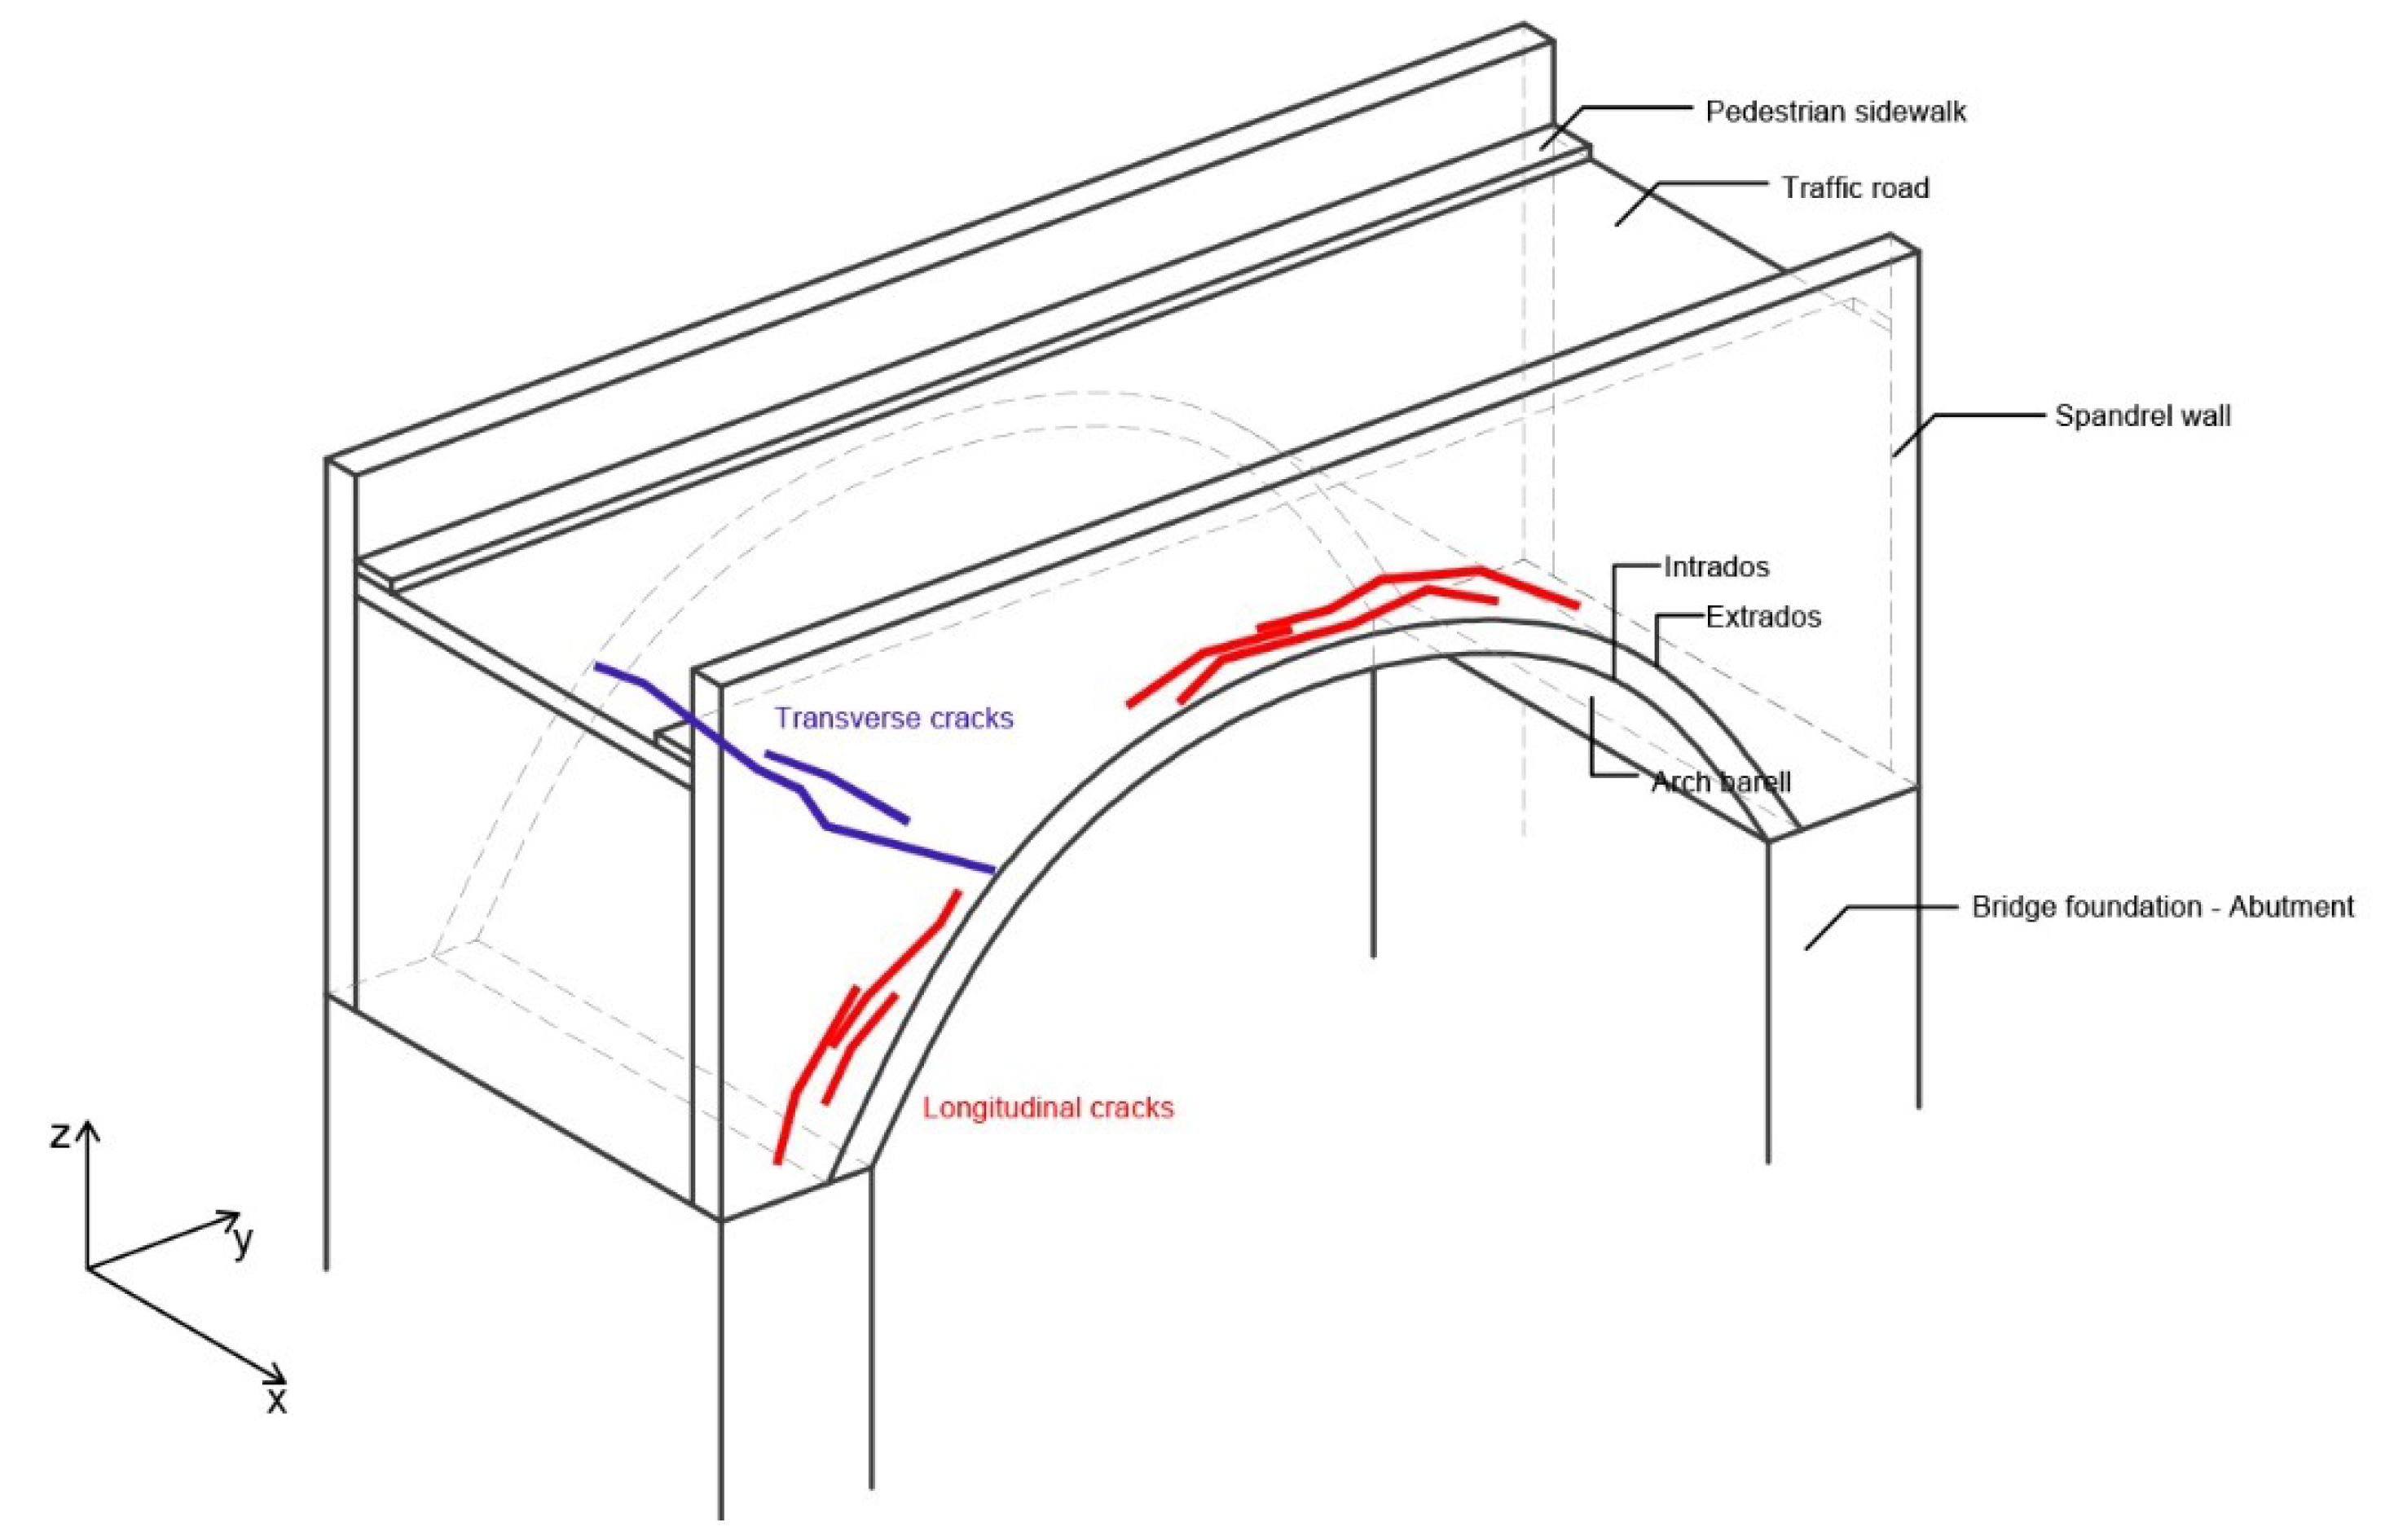
  • Spandrel and wing wall were formed in a regular pattern, in thirteen horizontal lines, with the height of the blocks 44 cm, while the length is varying and goes up to 140 cm. The third dimension could not be measured by visual inspection.
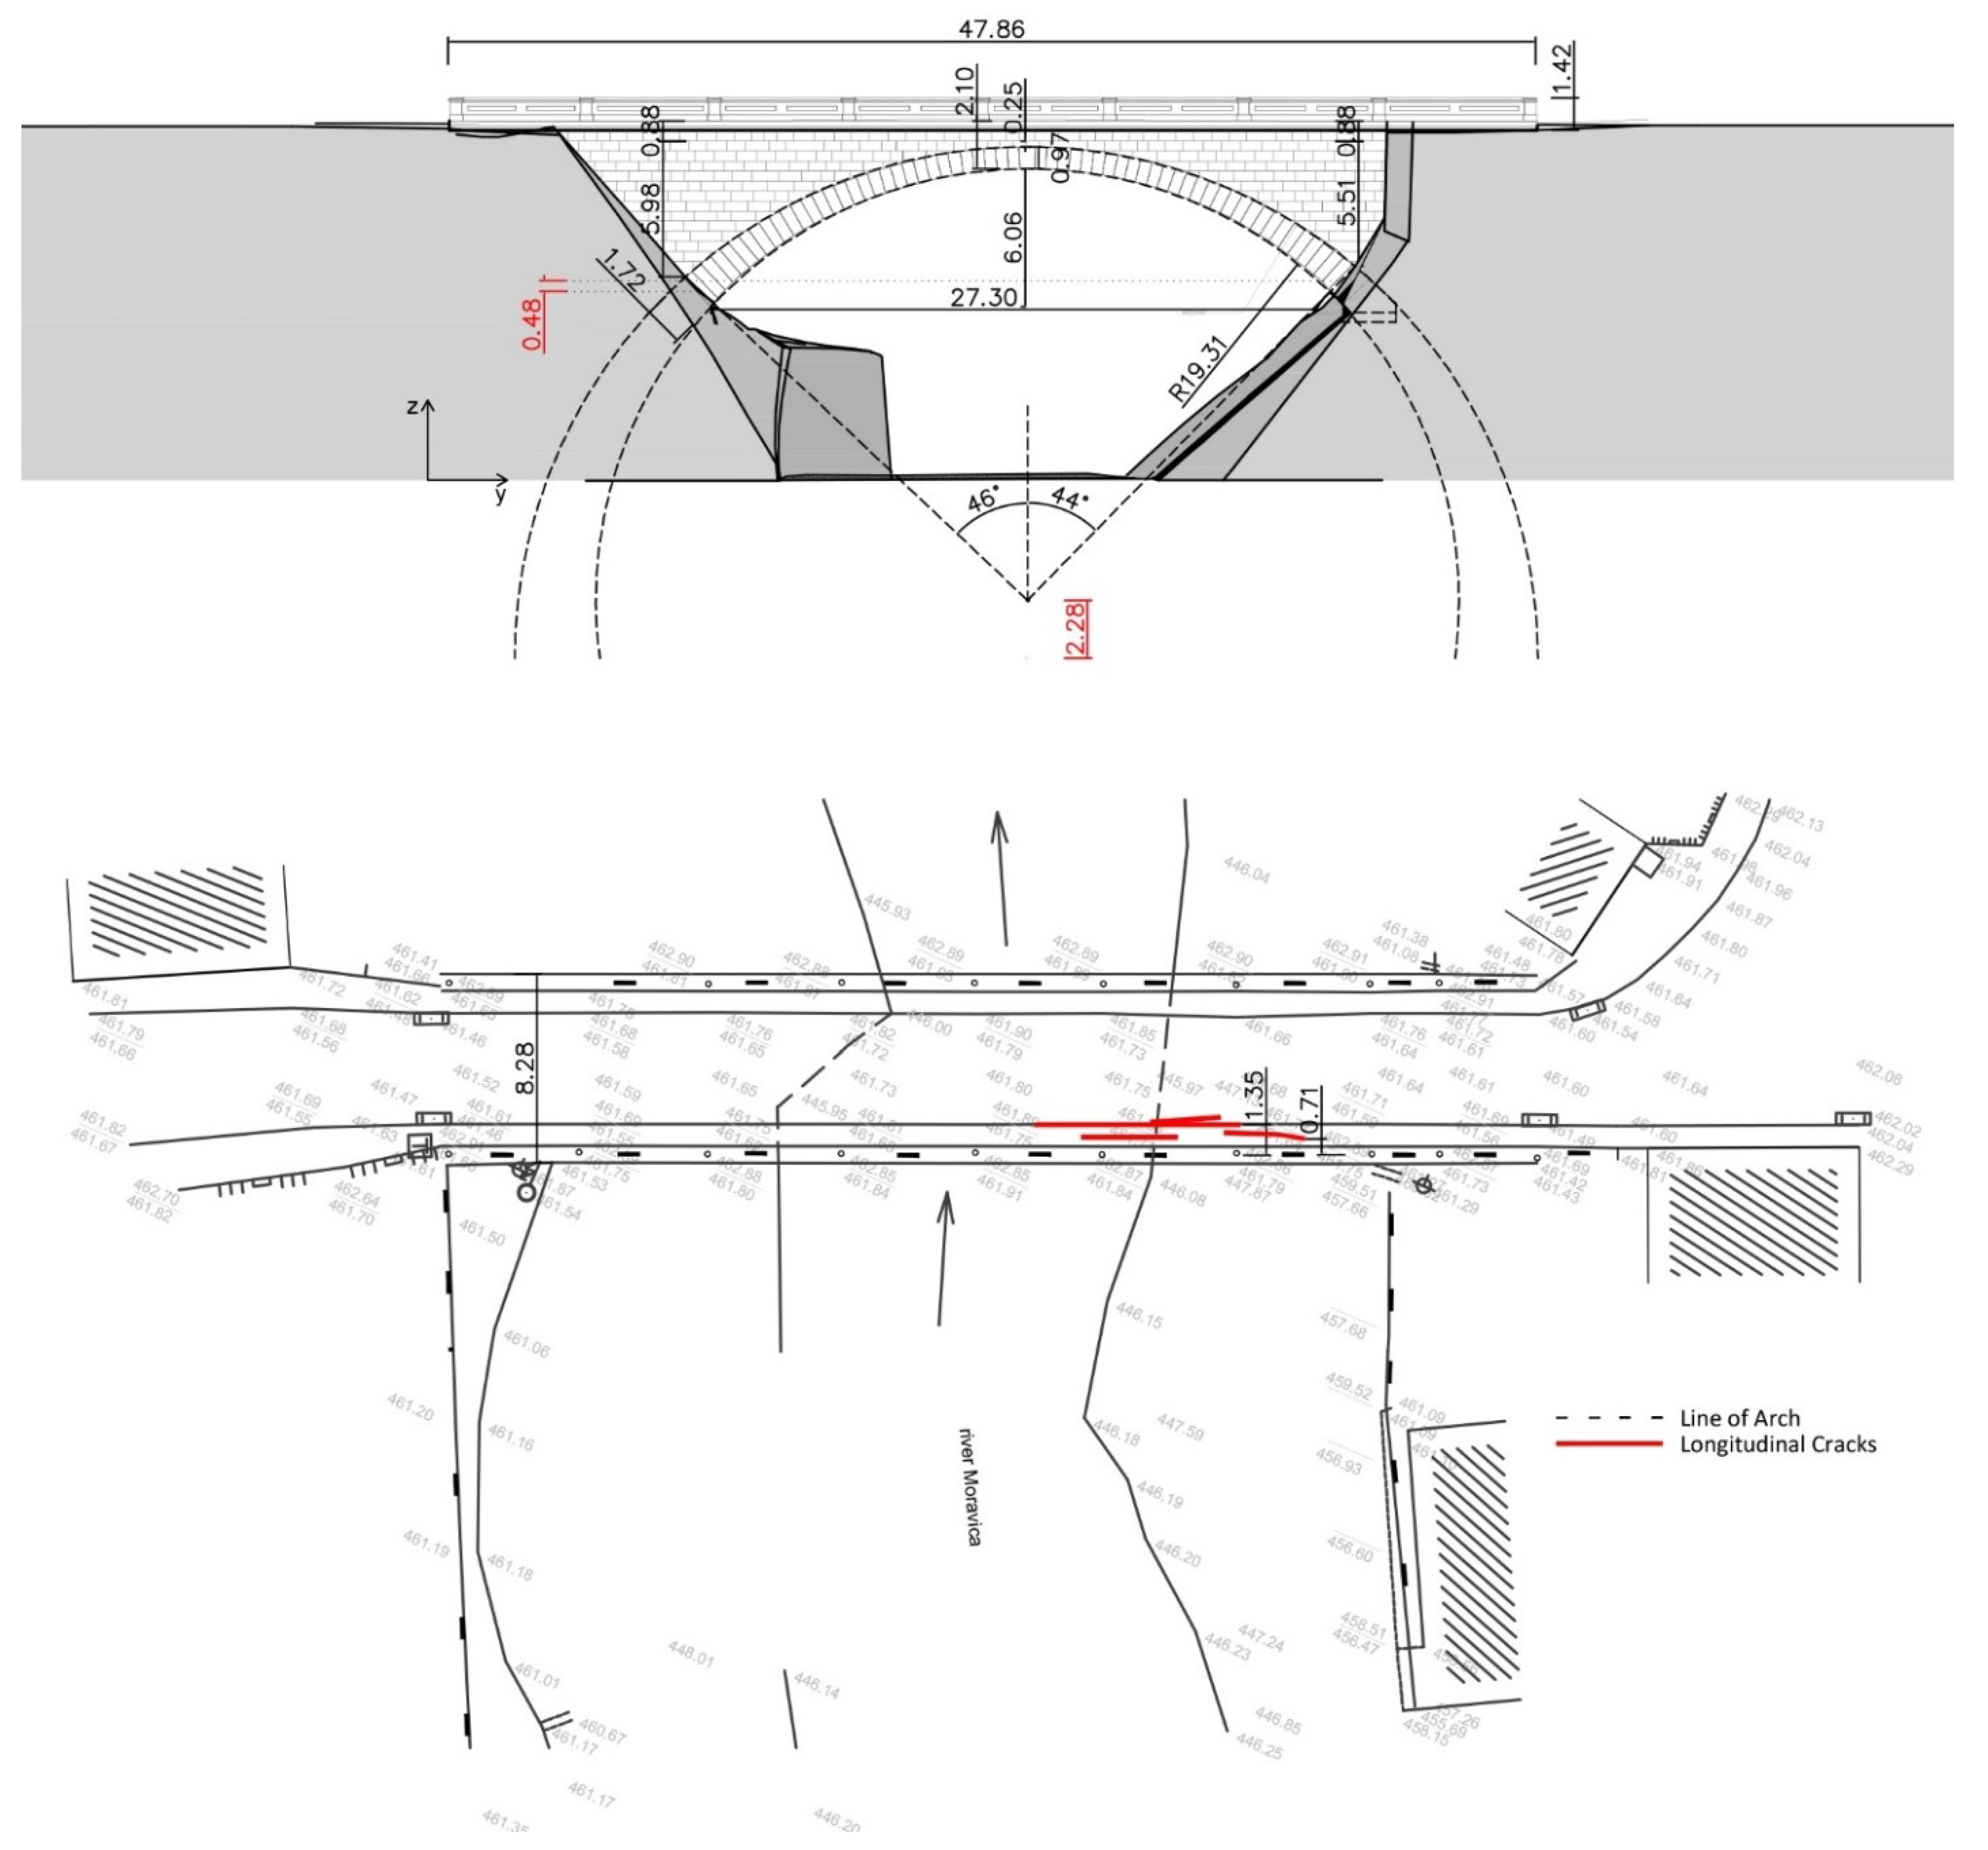
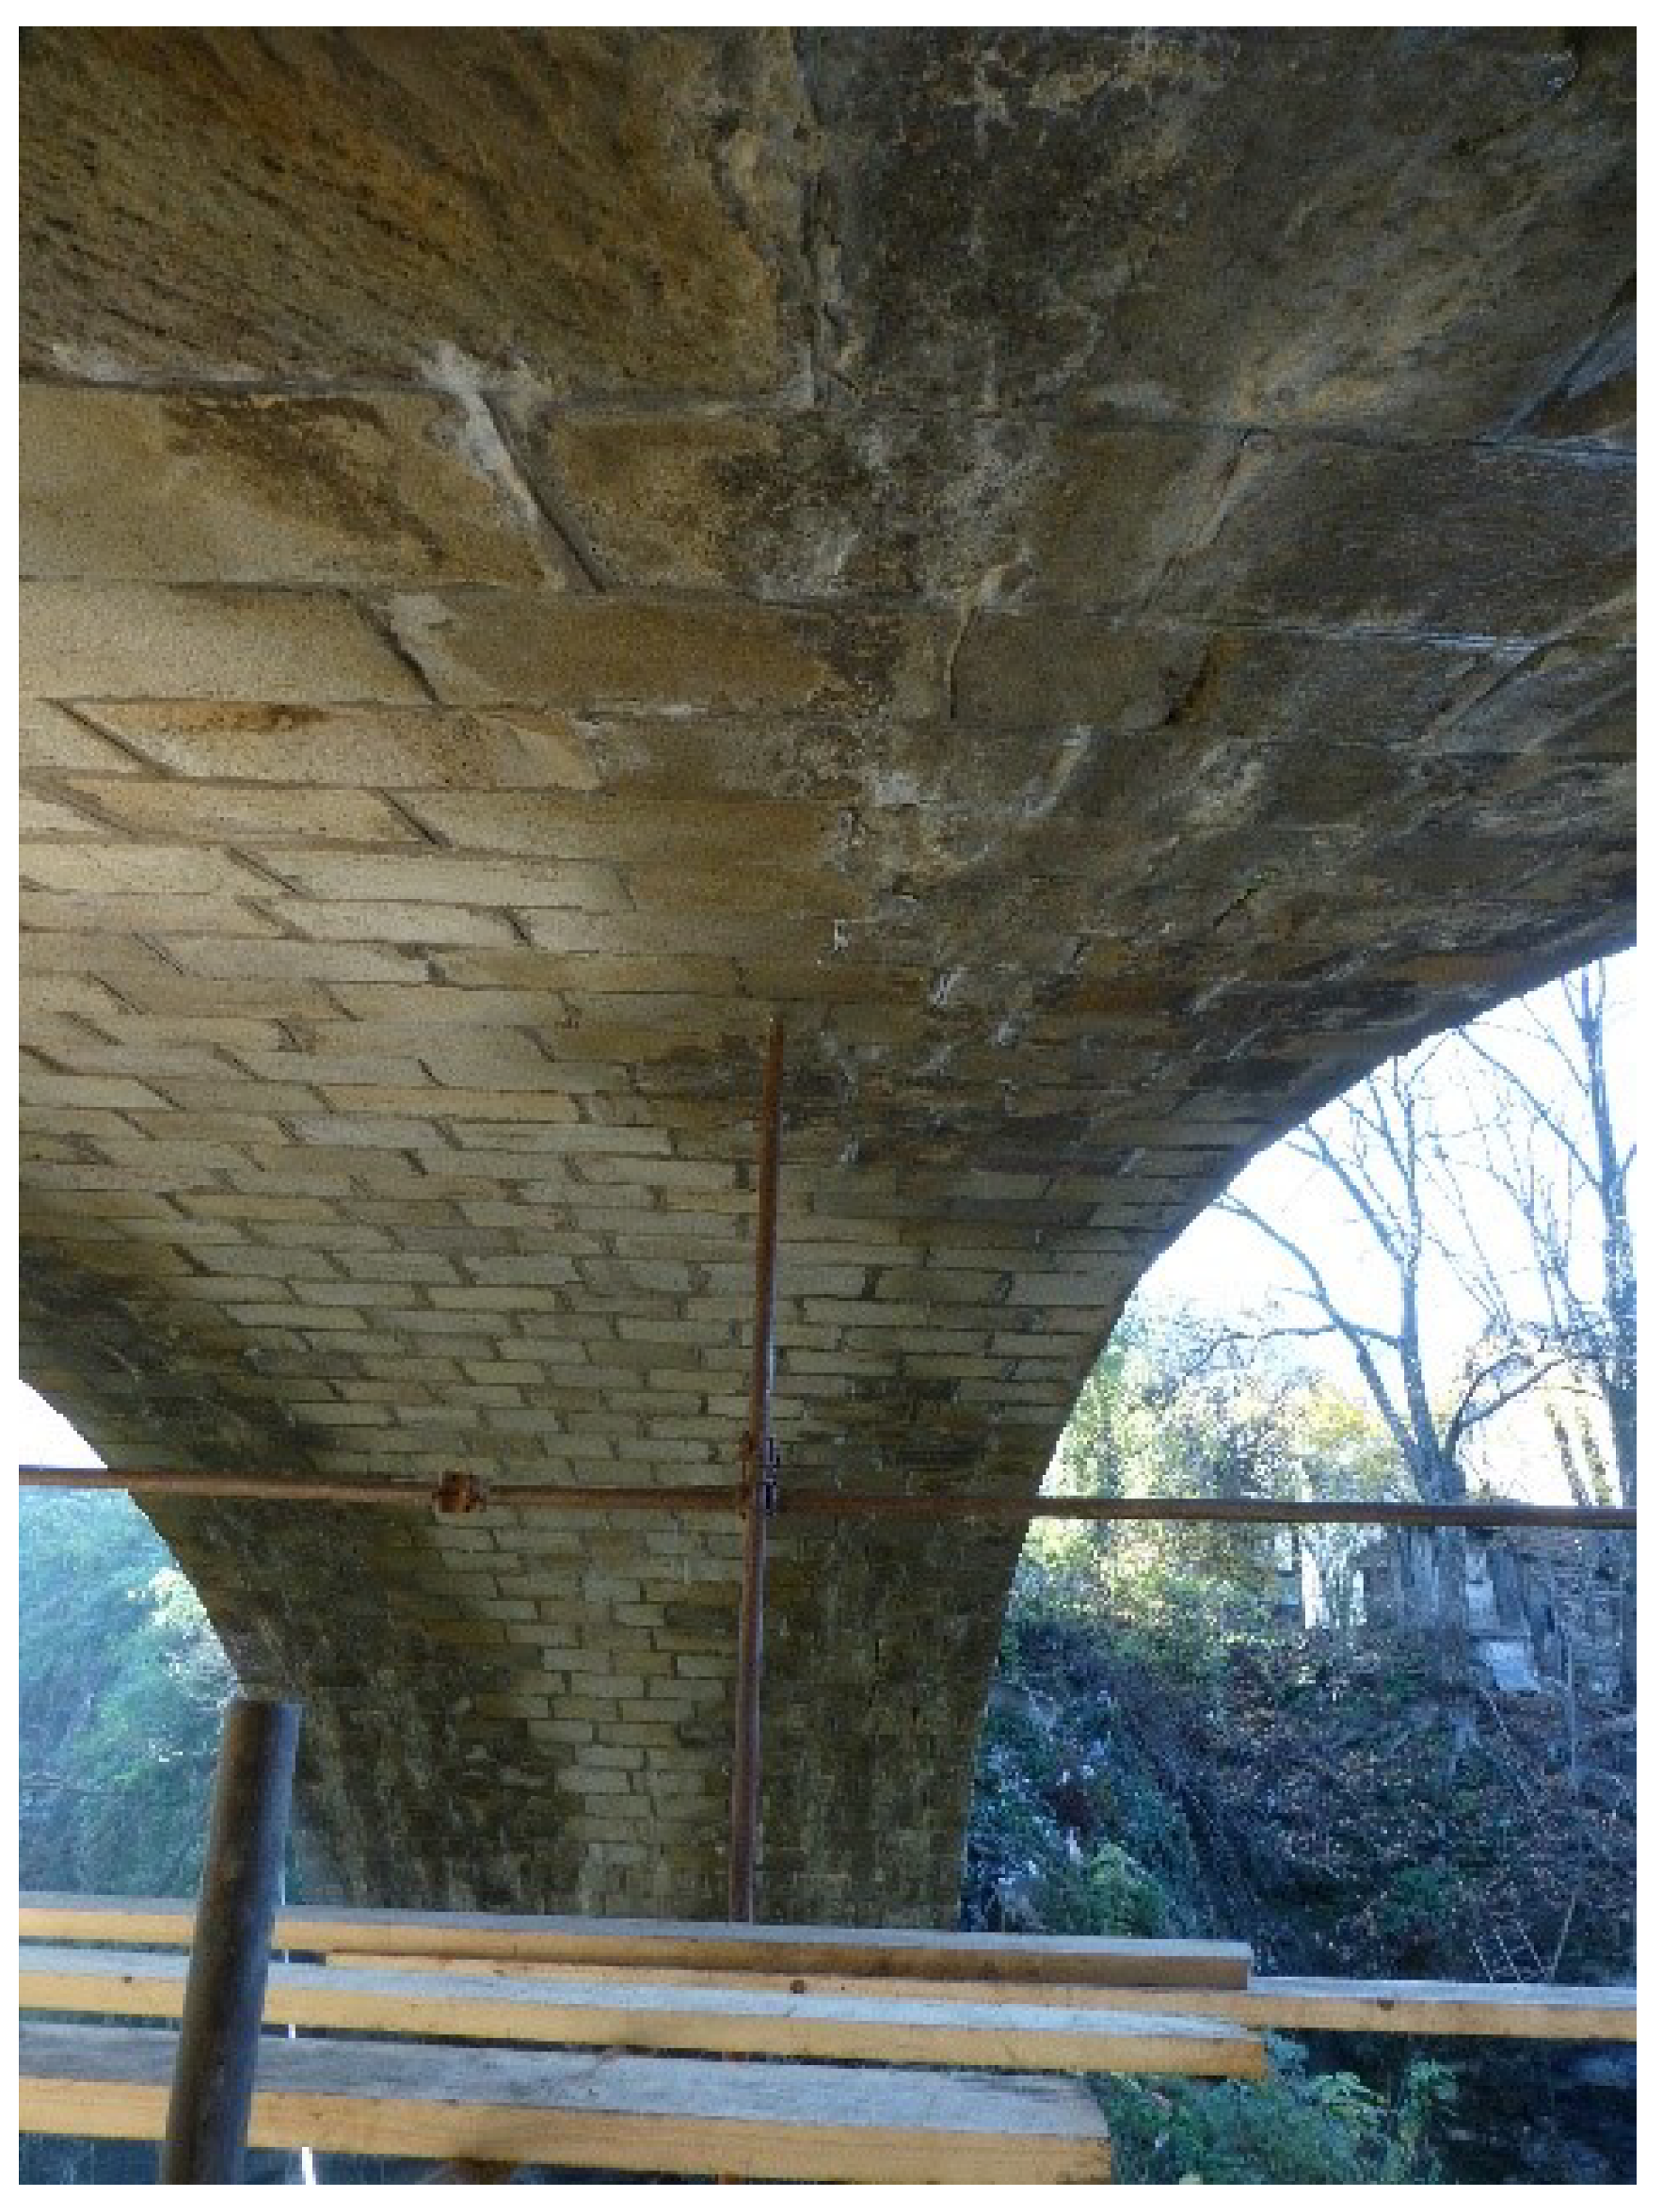
  • Spandrel of the arch barrel’s cross section varies and the height of the stone at the keystone is 97 cm, up to 172 cm in the abutments. Stone is 51 cm wide, and its depth varies from 55 to 77 cm, which can be seen from the inner side of the arch barrel (Figure 5 and Figure 6). So, the dimensions of stone blocks are 97–172 cm × 51 cm × 77 cm and 97–172 cm × 51 cm × 55 cm. Joints between stone blocks are radially oriented towards the centre of the arch barrel’s radius.
  • Arch barrel is built in a regular pattern. The dimensions of the blocks are 84 cm × 50 cm and the third dimension (the height) is 97–172 cm.
Parapet and belt course were also made of natural sandstone with punch finishes. Belt course stones’ height is approximately 20 cm, and it overhangs above the spandrel and wing walls, protecting them from changeable climatic conditions. The exposure to environmental effects affected the stone and led to the decay of some parts. Stone testing has proven that the parapet has suffered severe deterioration [30], followed by the building up of sediments, bio-colonisation, stratification, falling or loss of stone material (Figure 5).
The deterioration of stone structure, presence of moisture and of longitudinal cracks were spotted by visual inspection. The presence of moisture on the arch barrel is more significant on the northern side and near its side edges (Figure 6), as expected. Longitudinal cracks were formed in several places, following either the stone structure of the bridge or its joints. The greatest cracks are in the crown zone, while there are none near the foundations. Observation of the exact position of the cracks (Figure 4) shows that the cracks are near the edges of the arch barrel, i.e., shorter cracks are 50–75 cm from the edge and a great crack is 135 cm from the edge. The observation showed that these cracks are related to the change of zones (Figure 7), from motor vehicles to pedestrians, which will be discussed later in the paper.
Observation of foundations on the site led to the conclusion that the bridge’s foundations are formed on a rock. To confirm that, the soil was examined by geological testing.

3.3. Geological Testing

One of the most critical stability factors in the entire bridge structure represents the stability of the soil on which it is founded. According to geological researchers and field analyses in the vicinity of the bridge, the basis of this area consists of a Palaeozoic series in the Dinaric fraction, composed predominantly from Palaeozoic schists and slate sandstones. Geological researchers show that the bridge is founded on a rocky mass belonging to the Carbon part of “Internal Dinarides”. The location of the bridge itself belongs to the area of Phyllite (Ph) and the Sericite shale (Sse). Sericite shales are rocks created by a progressive metamorphosis of feldspathic and quartz sandstones. In contrast, the phyllites are formed by a metamorphosis of the clay and alevrolite sediments, rich with organic matter [31].
Engineering geological characteristics of the site show that the bridge is well-positioned in relation to the flow of the river and the close environment. The axis of a bridge with an azimuth 240° (60°) is normal to the foliation of the rock. River flow has the same azimuth constantly as the river progresses, so the river erosion on this part of the stream is minimal. However, just outside the bridge, on the right and left coastal side, fewer rift structures and crack systems (Figure 8) are partly filled and partly open. The fill is mainly made of clay minerals or shale detritus. These small rifts usually originated from shale, which the ground structure is made of, with a lower degree of crystallinity. Each of these properties, including the genesis of the rocks, makes them less resistant to the atmospheric influences.
The measurements and observations showed no movements and changes in the bridge structure that would significantly affect the structural stability. To prevent the loss of rock material and the creation of rifts and cracks, it is necessary to maintain the environment around the foundation and prevent the destruction of rocks triggered by vegetation emerging in the cracks of the rocks.

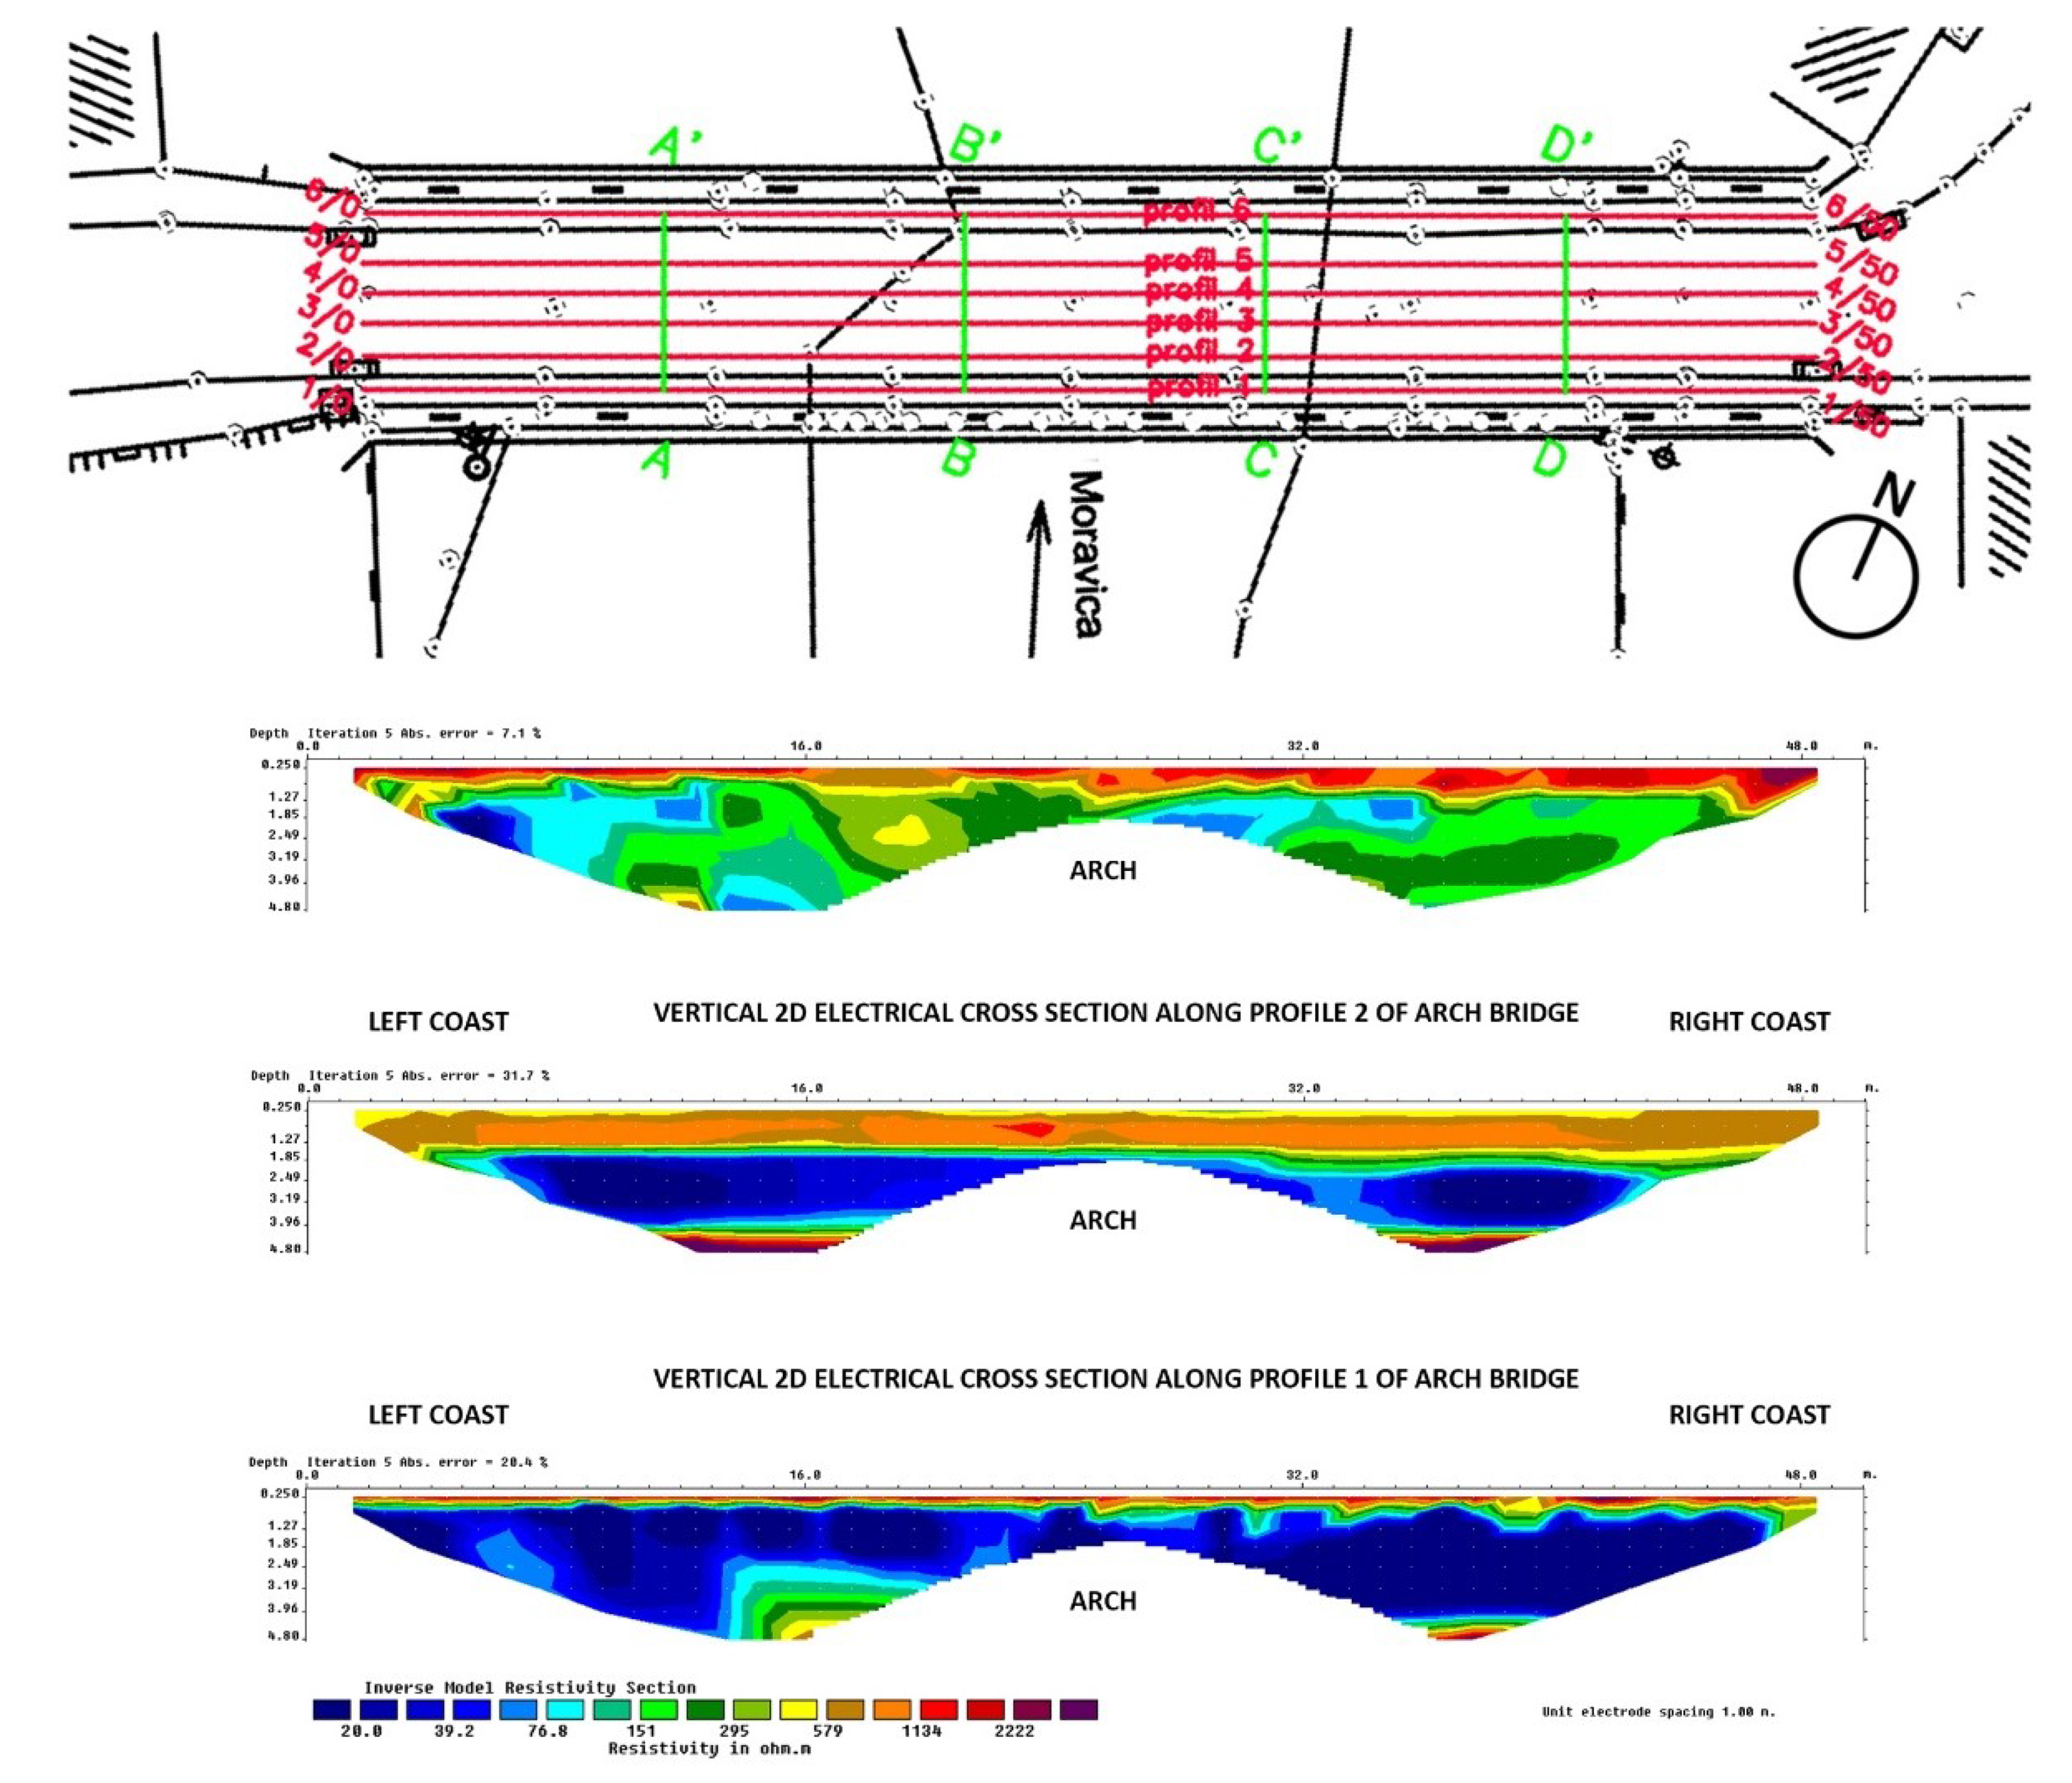
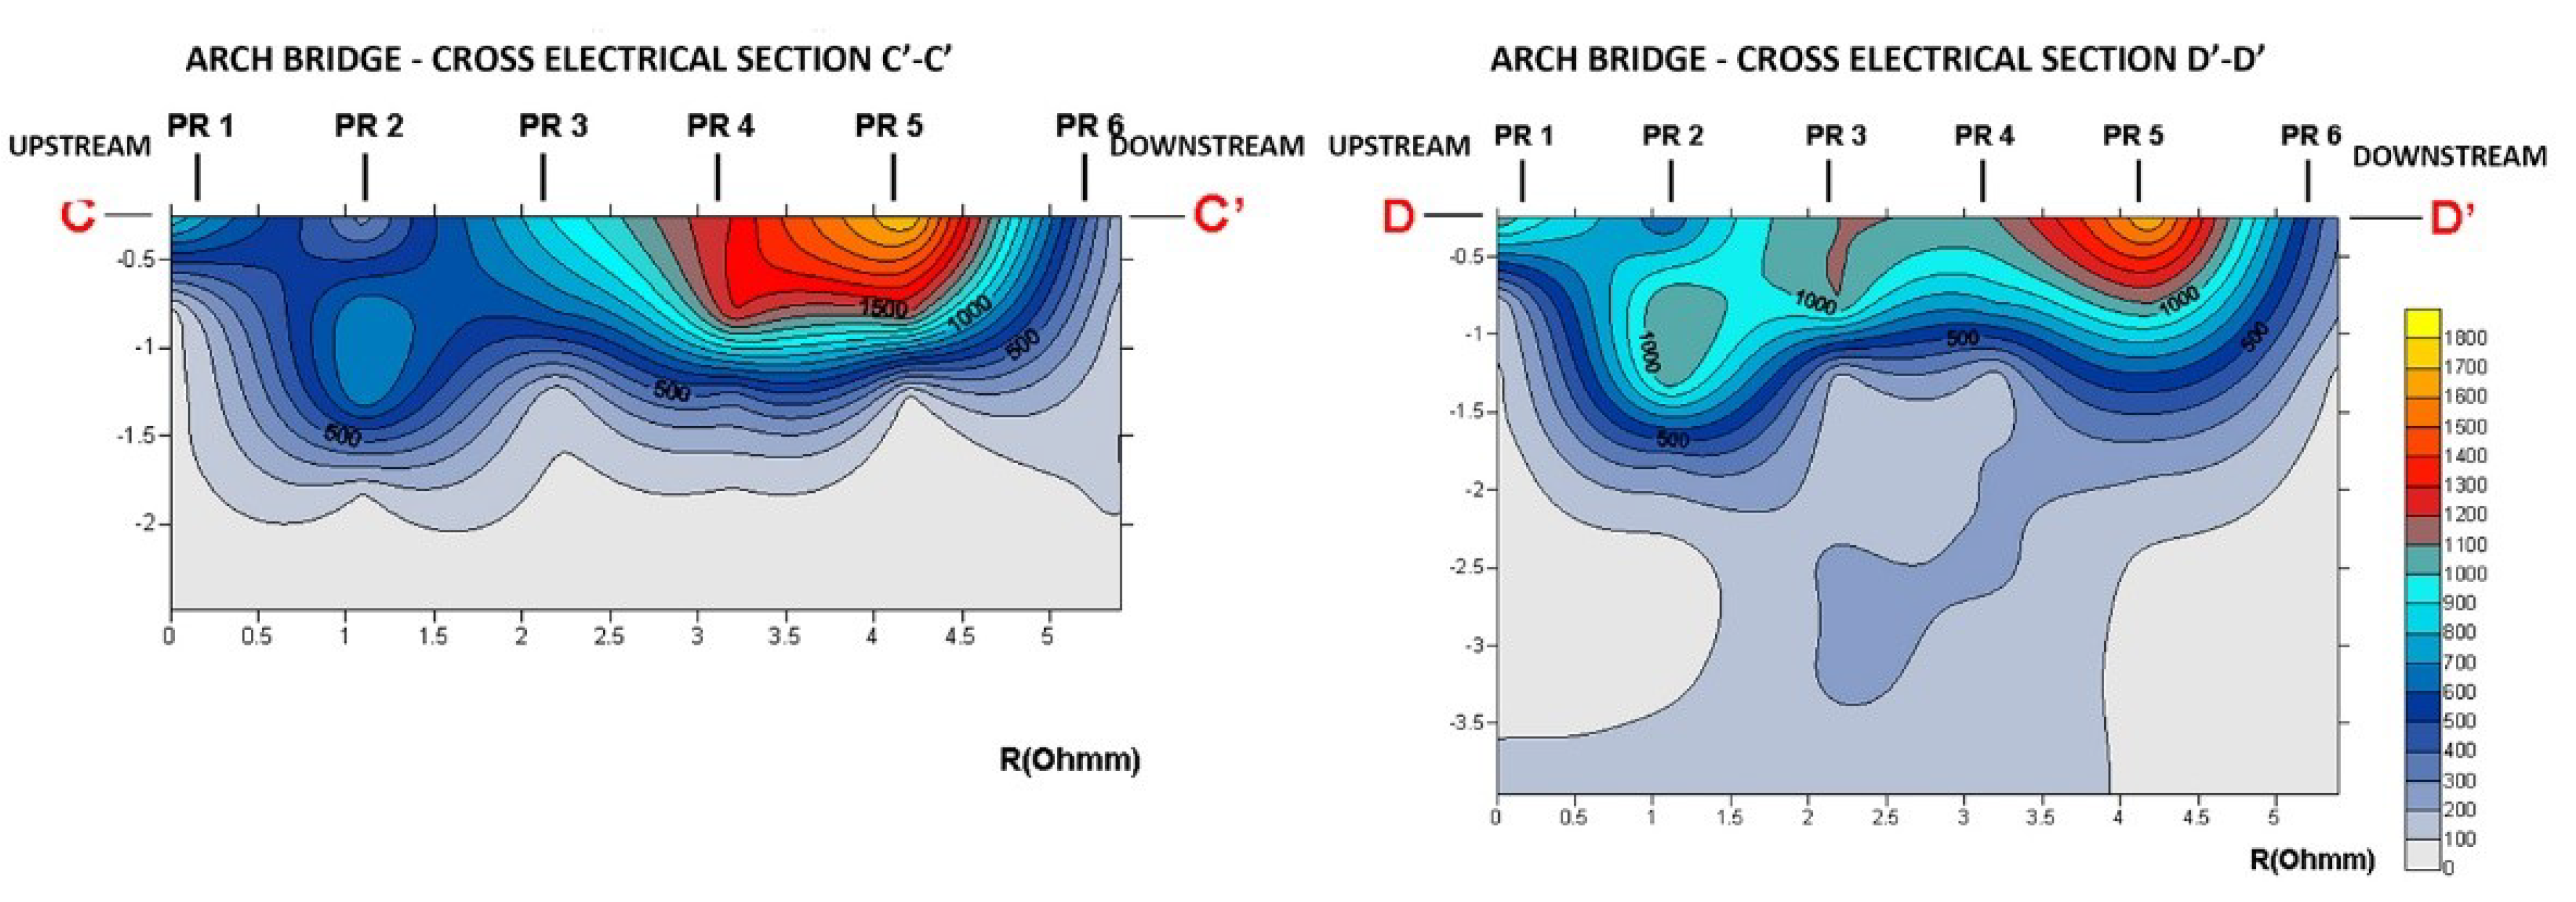
3.4. Geophysical Testing

To obtain a general overview of the bridge, the non-destructive research method was used to determine the physical characteristics of its internal structure. Geophysical exploration was performed using geoelectrical tomography by applying specific electrical resistance parameter along six parallel profiles set along the entire length of the bridge [32]. The primary objectives of this exploration were detection of the bridge’s internal structure and analysis of uniformity of the materials used in bridge fillings. Measuring on the bridge in Ivanjica with a non-destructive method of geo-electrical scanning, according to the specific electric resistance (SER), was performed by semi-automated procedure with digital equipment consisting of the resist meter Geophysical Resistivity, Self-Potential and IP Meter rpm 12 IP and Electrode Selector System ES 4951, made of electro toggle, multi-wire cables and metal electrodes. The obtained results were software processed by the RES2Dinv program and presented in the form of two-dimensional vertical profiles through the bridge’s construction under the tracking surface and pedestrian paths. Measurements on the stone bridge were performed according to the rectilinear profiles of the standard length of 50 m according to the Wenner dispositive with operative depth grip, which indicates the presence of filling material up to the arch structure under the footpaths and pavement surfaces.
Based on the obtained scan results along 6 (six) profiles placed on track and along pedestrian paths, six electric 2D models were obtained. The profile positions are shown on the basis (Figure 9), and 2D models are shown graphically in appropriate colours, ranging from 20 to 3100 Ω⋅m. For a spatial understanding of the distribution of electrical resistivity below the bridge’s surface, four cross sections, A-A’, B-B’, C-C’ and D-D’, were made (Figure 10). Cross-section profiles are created from data obtained from longitudinal profiles using software SURFER 8.
The attachment shows three longitudinal profiles (1-1, 2-2, 3-3). The first profile, 1-1, is positioned on a pedestrian walkway near the edge of the arch. The dominant value of the lower electrical resistivity is 40 to 80 Ω⋅m, which is probably the result of a significant presence of moisture in the materials. More values, from 500 to over 3000 Ω⋅m (from yellow to dark red on the legend), indicate the presence of dry materials, both in the zone of filling and just below the tracking surface and pedestrian paths. Immediately below the traffic and pedestrian zones, to a depth of 1.5 to 2 m, high electrical resistance also indicates the presence of various building materials used during the installation of infrastructure along the bridge (water supply, electric cables, etc.). By observing the results obtained by geo-electric scanning, primarily shown in Section 3.3, it has been found that the filling of the bridge is heterogeneous and, most likely, there are well-cured rocky crumblings and earth materials that are mutually mixed.
Based on the results analysed, it was found out that the infill of the bridge is heterogeneous and well-compacted rock fragments and pottery are most likely present mixed materials. The obtained electrical resistivity values vary extensively, from 40 to 80 to over 3000 Ω⋅m (from blue to dark red colour on the legend of obtained 2D electrical models). Inside the bridge, there are no cavities filled with water or air in the filling zone, affecting the pavement ribbons’ settlement. Lower electrical resistivities from 40 to 80 Ω⋅m (variants of blue on the legend of obtained 2D electrical models) are most likely due to the significant presence of moisture in the materials. There is no doubt that the filling materials in the bridge’s construction have often been there before being moistened by atmospheric precipitation. Higher values, from 500 to over 3000 Ω⋅m (from yellow to dark red on the legend of obtained 2D electric models), indicate the presence of drier materials, both in the filling zone and immediately below the pavement and pedestrian trail. Immediately below the road surface and footpaths, to depths of 1.5 to 2 m, high electrical resistivities indicate various construction materials used during the burial of infrastructure installations along the bridge (plumbing, electrical cables, etc.).
However, it should be noted that lower electrical resistance is due to the presence of moist material, very likely in the fill of the bridge, due to its inability to be drained by gravity. Moreover, by observing the bridge, it was noticed that its parts closer to the edges, primarily located on the north side, are affected by moisture, which can potentially endanger the structure of the stone material. To prevent damage of the bridge under the influence of water and moisture, it is necessary to check the drainage channels and waterproofing of the bridge during the repair.
To also examine the spatial distribution of electrical resistivities in the form of transverse cross sections, values of electrical resistivities are taken from 2D electrical models and cross sections are made at 10, 20, 30 and 40 m, looking from left to right, along with 2D electrical models, which are marked as A-A’ , B-B’, C-C’ and D-D’. The data are processed using SURFER 8 software. We can also see higher electrical resistivity materials on transverse electrical cross sections, corresponding to the materials used to cover the pavement surface and for additional construction works. The material’s electrical resistivity is above 500 Ω⋅m and isolines will, most probably, follow the spatial and shape form of burial of infrastructural installations.
Through the comparative analysis of the position of the cracks at the arch bridge and the results of the geo-electric scan, it can be noticed that the cracks are most pronounced between the profiles 1-1 and 2-2 in the longitudinal section, that is, positioned around the C-C profile to the D-D profile in the cross section. By cr-cutting these profiles, it can be concluded that the lowest value of electrical resistivity (blue colour) was recorded in the cracks due to the presence of moisture in the fill. As mentioned above, under the traffic load, the filling puts pressure on the side walls, which can cause separation of the wing walls of the bridge from the vault, causing the appearance of longitudinal cracks. This lateral pressure is higher and more pronounced if the fill of the bridge is moistened.

3.5. Physical–Mechanical Testing of Stone Structure

To determine the quality of stone material that the bridge is made of and its physical and mechanical characteristics, laboratory tests were conducted on stone samples obtained by destructive method—by drilling the material (Figure 11b,c). Sampling was performed with a 5 cm inner bore drill, three drill core samples were extracted, each with a length of 40 cm, and five testing samples were made from each of them. Samples were taken from the arch barrel, the spandrel wall and the stone wall. Sampling areas are shown in Figure 11a [30].
Studies have shown that sandstone with an arenaceous structure and cluster size between 0.05 and 2 mm and massive texture, or homogeneous assembly, was used to construct the bridge, which indicates a uniform quality of the built-in stone. The degradation process that led to the decay of stone arises to the depth of 1 cm, after which the stone is homogenous and does not show any signs of deterioration. Based on the tested values of the physical–mechanical properties shown in Table 1, we can conclude that according to the volume mass, the stone used belongs to a medium-hard stone, with high porosity and the water absorbency [33].
The compressive strength of the stone in the dry state is moderate, visible on the KIA 0068/14 AGK sample, and it is classified between low and moderate, KIA 0069-70/14 AGK. All the values obtained correspond to the properties of sandstone. Based on the tests, it can be concluded that the degradation processes do not affect the deeper parts of the stone blocks but only their surface layer.

3.6. Biological Analysis of Damage on the Stone Bridge

As mentioned above, visual inspection showed both high degree of stone degradation and loss of stone material, which is expressed on the arch bridge but also on the parapet. The most destructive form of stone decomposition in the bridge is the formation of black crust, manifested through separating a thinner or thicker layer of material from the parapet. In addition, morphological changes of the stone surface in the form of relief decomposition of the stone are also noticed, manifested by the rounding of edges, corners or entire stone surfaces, alveolar impairments or flushing of stone components, and thus causing cracks of irregular shape. Figure 12a shows the appearance of decolourisation on both the parapet and spandrel wall, which is a consequence of physical and chemical factors. This is particularly visible on the parapet of the bridge where the black crust is detected by depositing solid particles of soot, dust and other harmful aerosols on the surface and within the available pores of the stone.
At the face of the bridge, seen from the upstream side, several spots are observed in the spotlight in the form of white stains and edges (Figure 12b), indicating the direction and level of circulation/movement of moisture that was carried by dissolved salts. Moreover, the efflorescence can be seen on the arch barrel (Figure 12d). Though visible to the naked eye, this form of degradation, apart from aesthetically diverting white stains, is less harmful than subflorescence, which mechanically destroys the stone structure inside the assembly. In the northern part of the bridge, the dominant bio-colonisation is represented by lower plants (lichens, algae, mushrooms and moss) and, to a lesser extent, by higher plants.
By biological testing, a high degree of biodegradation of the surface of the embedded stone was determined, and in the well-developed biofilm, there are lichens, moss, RIF (microcolonial mushrooms), filamentous micromycetes, yeasts and bacteria. Chemical testing on a sample of hardened crust from the vault of the bridge diagnosed that the crust is brighter, with a thickness of up to 3 mm, and that in the composition of this crust is CaCO3.

3.7. Structural Analysis

The structural behaviour of the bridge is based on a numerical model of the structure for static and dynamic analysis of construction. Behaviour under load is crucial for determination of causes of deformations along the structure, i.e., for determining the causes of longitudinal cracks on the arch barrel of the bridge. This kind of numerical analysis can also be used for structural analysis after reinforcement (static restoration).
Analysis was conducted on a 3D simulation model using Tower software that is based on finite element analysis. It was used to trace the flexible behaviour of the arch barrel under loads. A numerical model with the exact geometry of the arch barrel, its loads and characteristics of used materials was made based on the data gathered through surveying, measuring and observation of the structure on site (Chapter 3.2), as well as the data from laboratory testing—materials testing [19], characteristics of the terrain [20] and geophysical testing [21]. Due to deterioration of stone [19], which also affected the stones on the arch barrel (thickness of deterioration 1 cm), the effective height of the stone would be reduced to 95 cm (keystone) and to 170 cm (abutments) based on the factor of safety. The initial height of the stone is given in Section 3.2, where height of the keystone is 97 cm, up to 172 cm in the abutments. The value of Young’s module of elasticity ‘E’ would be E = 1.5 × 10⁷ kN/m2, as it is for the masonry structures [22]. Model was made as an arch of 1 m width.

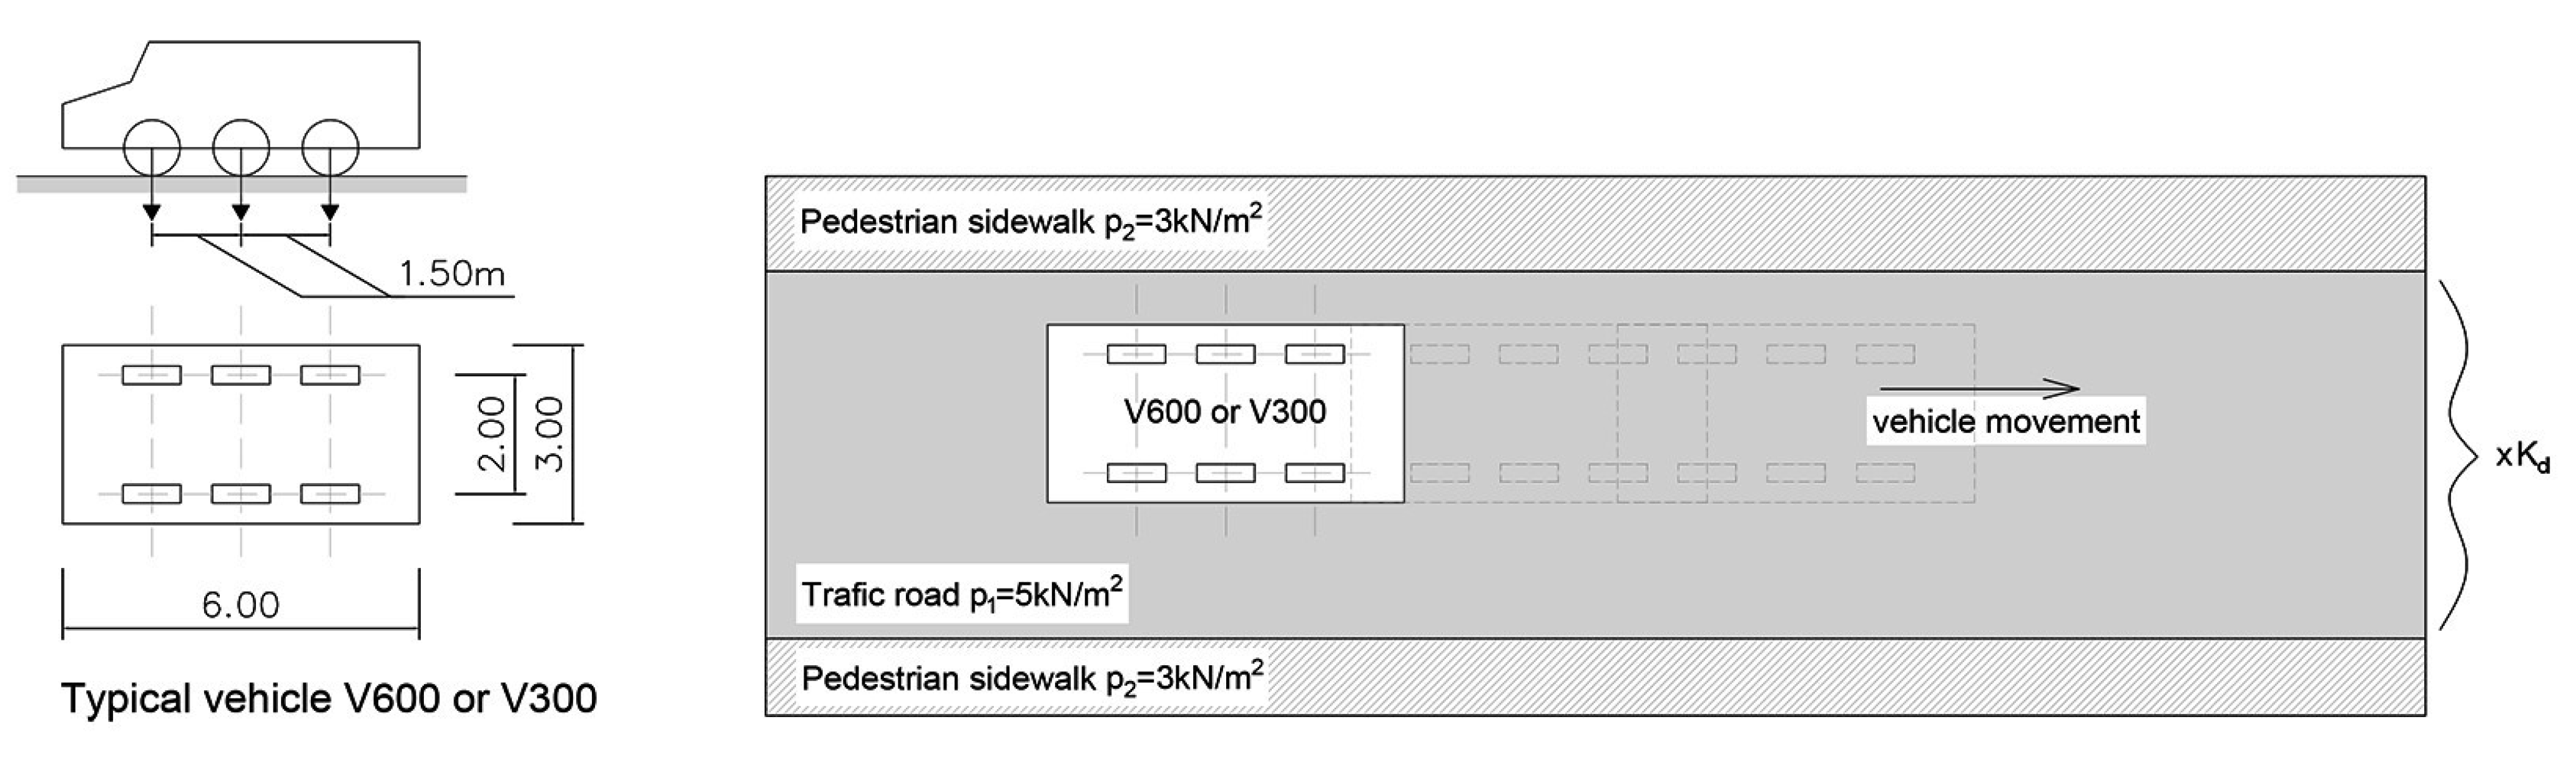
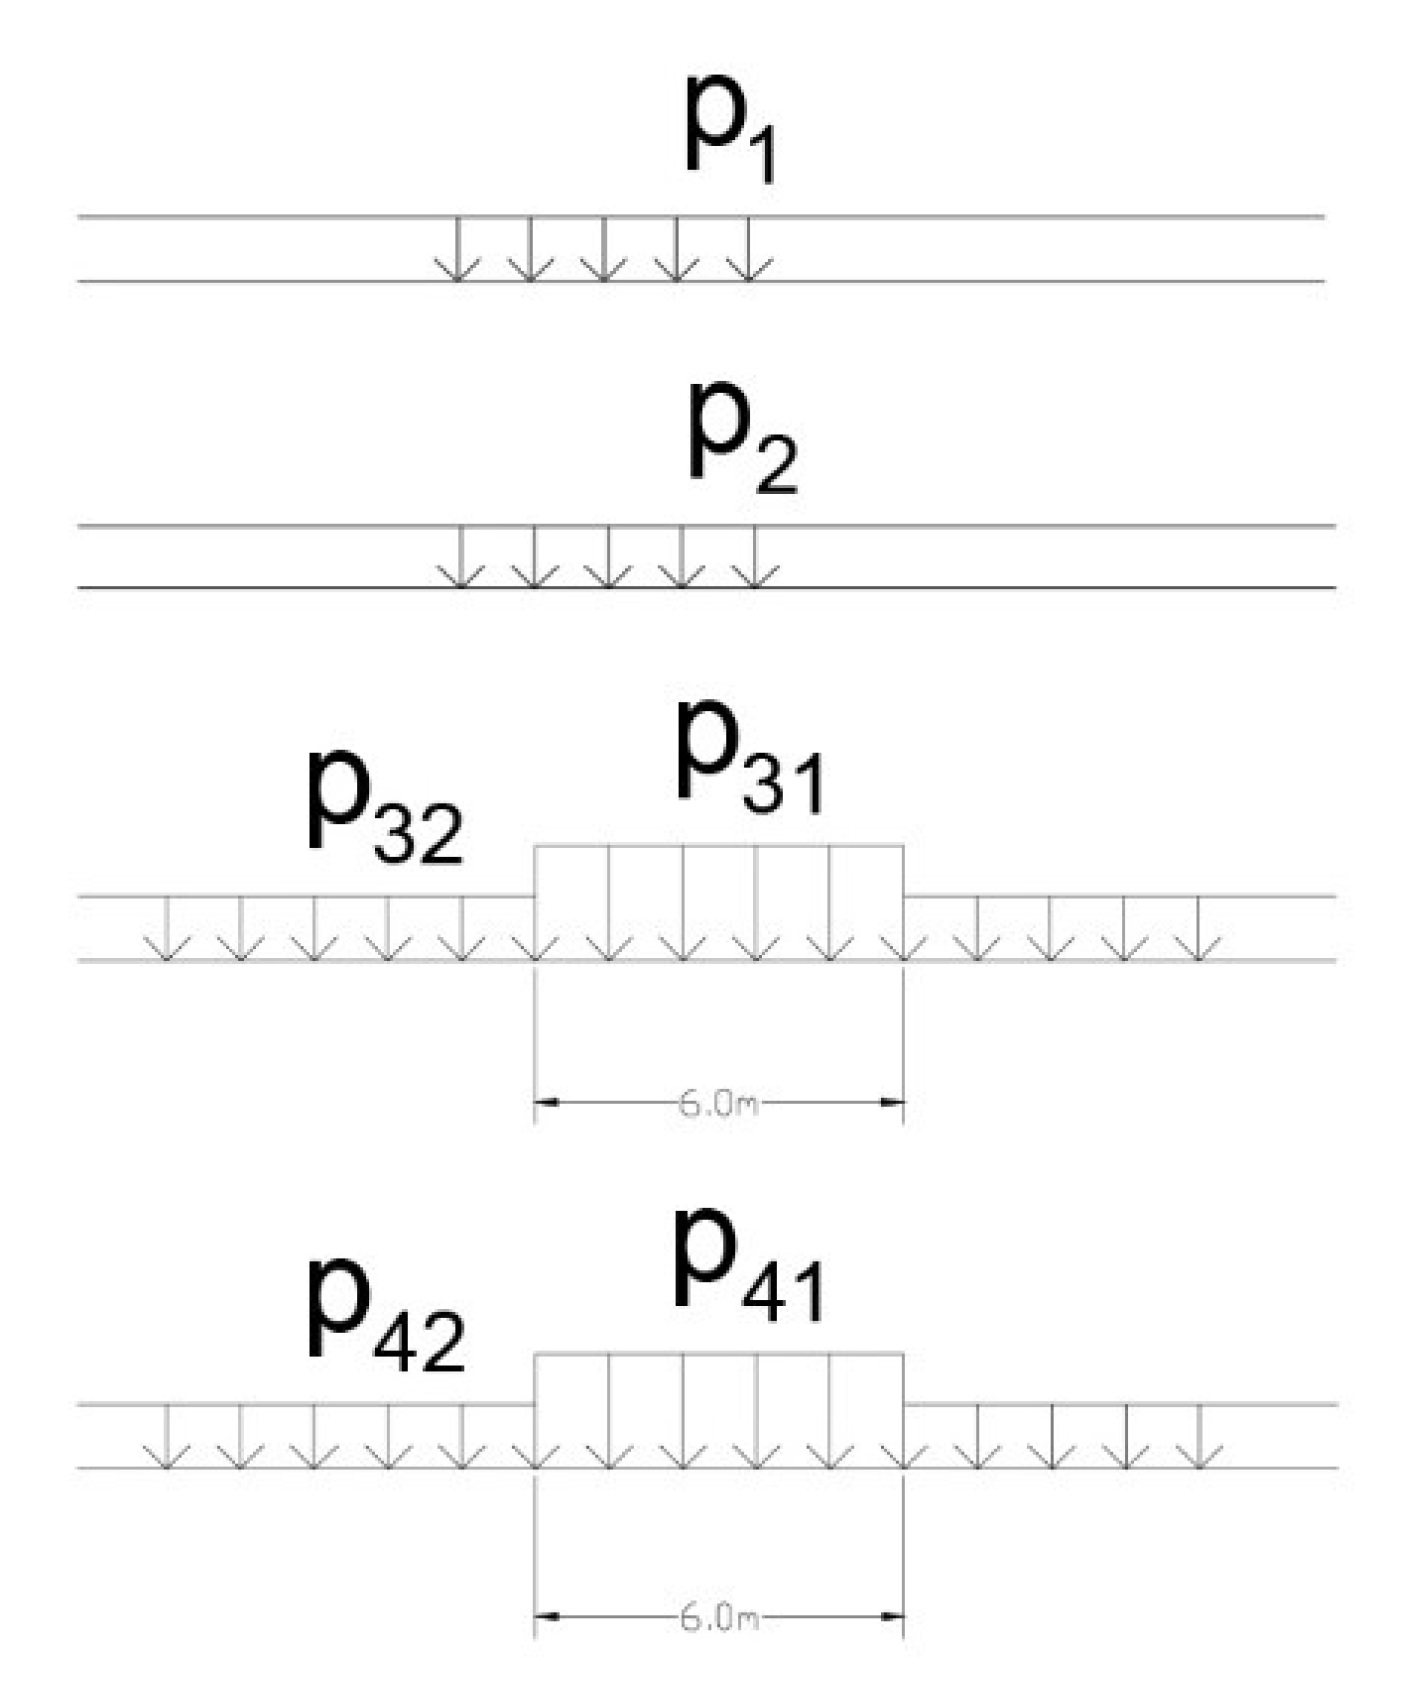
3.7.1. Load Analysis

Geophysical testing has confirmed that the fill of the bridge was made of well-cracked stone and earth materials and that, in some parts of the bridge, the material was wet, which was taken into account. Thus, the dead load of the bridge in the model was 20 kN/m3. The weight of the roadway was also considered as dead load. It was made of stone mass with asphalt as the finishing layer—the total height ≈ 90 cm. Installations were placed in this layer, so in the model, for safety reasons, the whole dead load of the roadway was 23 kN/m3. Calculations were made for the maximum load case when the load from the fill of the bridge is gravitationally applied on the arch barrel, but the angle of distribution of the load was not calculated. Load analysis was calculated the same as the arch barrel for the depth of 1 m, and it is shown in Table 2.
Besides the self-load of the structure and the dead load from the fill of the bridge, there are live loads caused by traffic. According to valid regulations in the Republic of Serbia about the values of loads on bridges [34], this bridge can be classified in two categories (Table 3): II category—bridges on a trunk road, regional road and arterial road bridges, and III category—bridges on all other roads. Thus, they correspond to two traffic load calculating schemes, V600 and V300, that would be taken into consideration (Figure 13). For the II category bridges calculation scheme V600, it means that, during the load calculation, the considered load of a typical vehicle is 600 kN, applied to the most inconvenient area of the roadway (Figure 13, scheme V600). This force was replaced in the model with a uniform distributed load of 33.3 kN/m2. For III category roads that have the calculation scheme V300, it means that all the load from scheme V600 will be divided by half. All live loads on the roadway are applied with the coefficient for dynamic load Kd, calculated using the formula Kd = 1.4 − 0.008 L ≥ 1.00 for road bridges. The effective span between supports ‘L’ is approximately 1.2 m.
K d = 1.4 0.008 × 28.8 = 1.17 1.2 1.0
Because of the location of the longitudinal crack on the bridge, the numerical analysis will be conducted using four loading schemes (Figure 14):
  • Uniform distributed load  p1 = 3 kN/m2
  • Uniform distributed load  p2 = 5 kN/m2
  • Scheme V600        p = q × K d
    p31 = 33.33 × 1.2 = 40 kN/m2    p32 = 5 × 1.2 = 6 kN/m2
  • Scheme V300        p = q × K d
    p41 = 16.66 × 1.2 = 20 kN/m2    p42 = 5 × 1.2 = 6 kN/m2

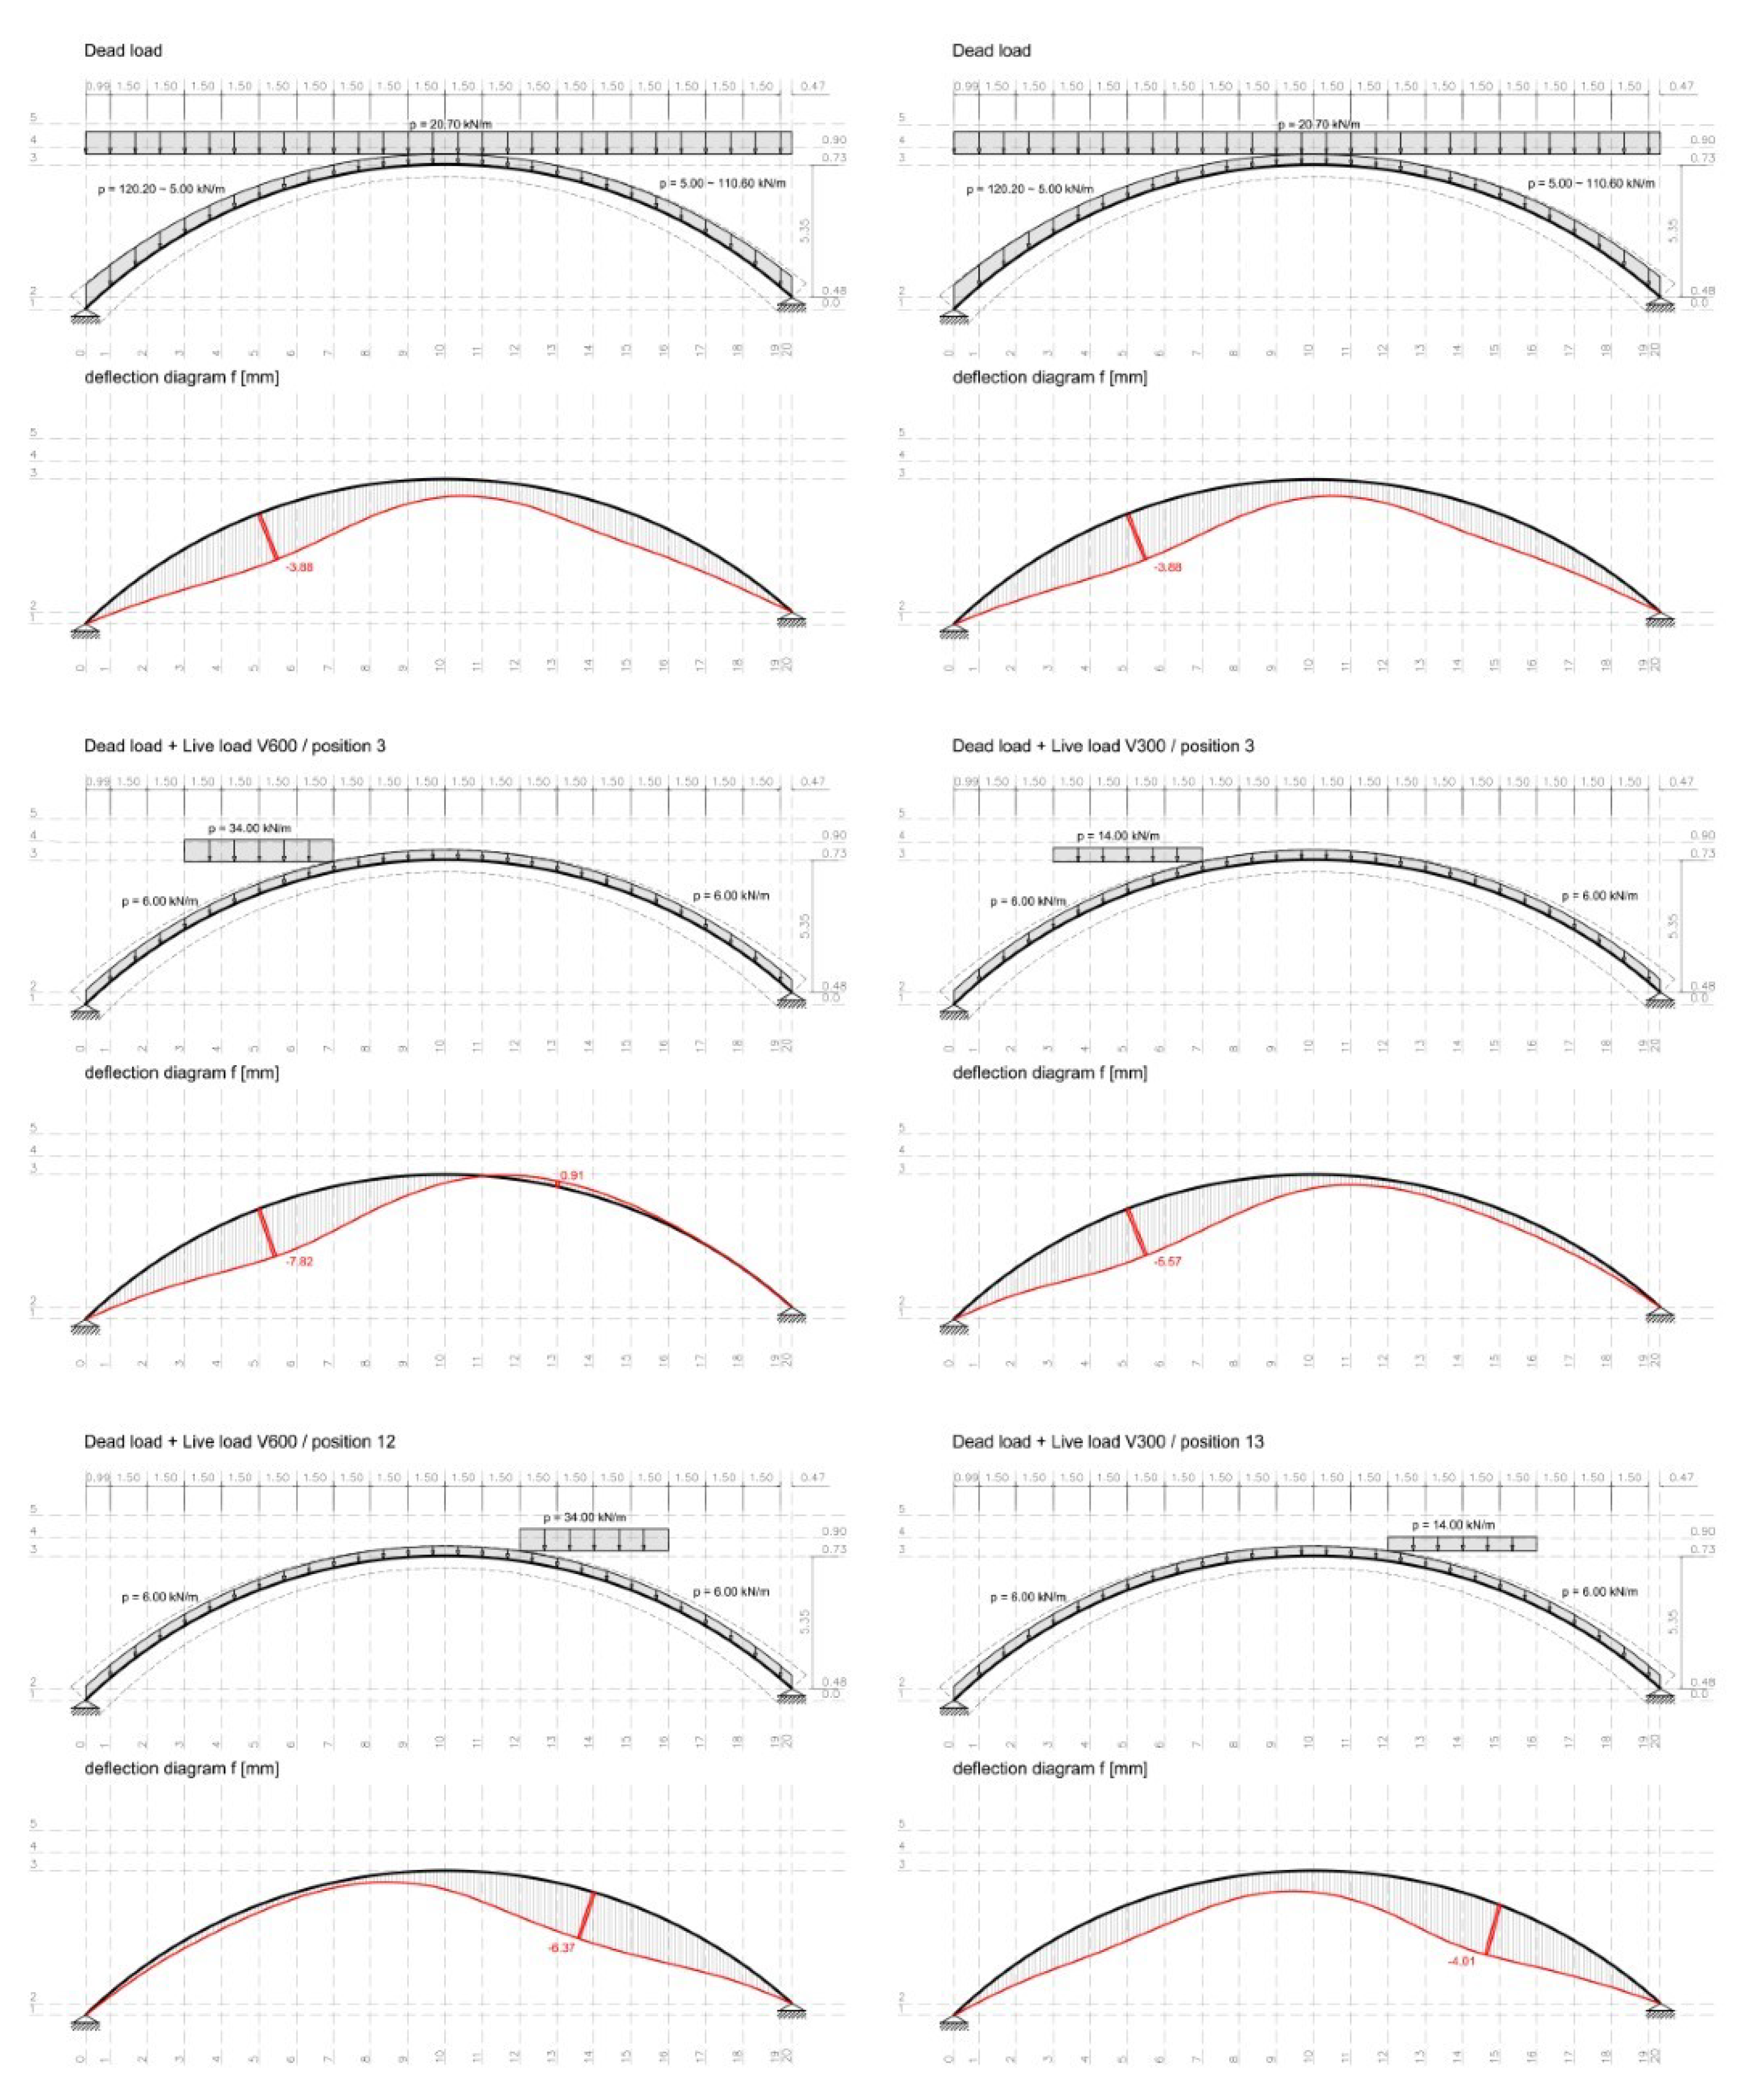
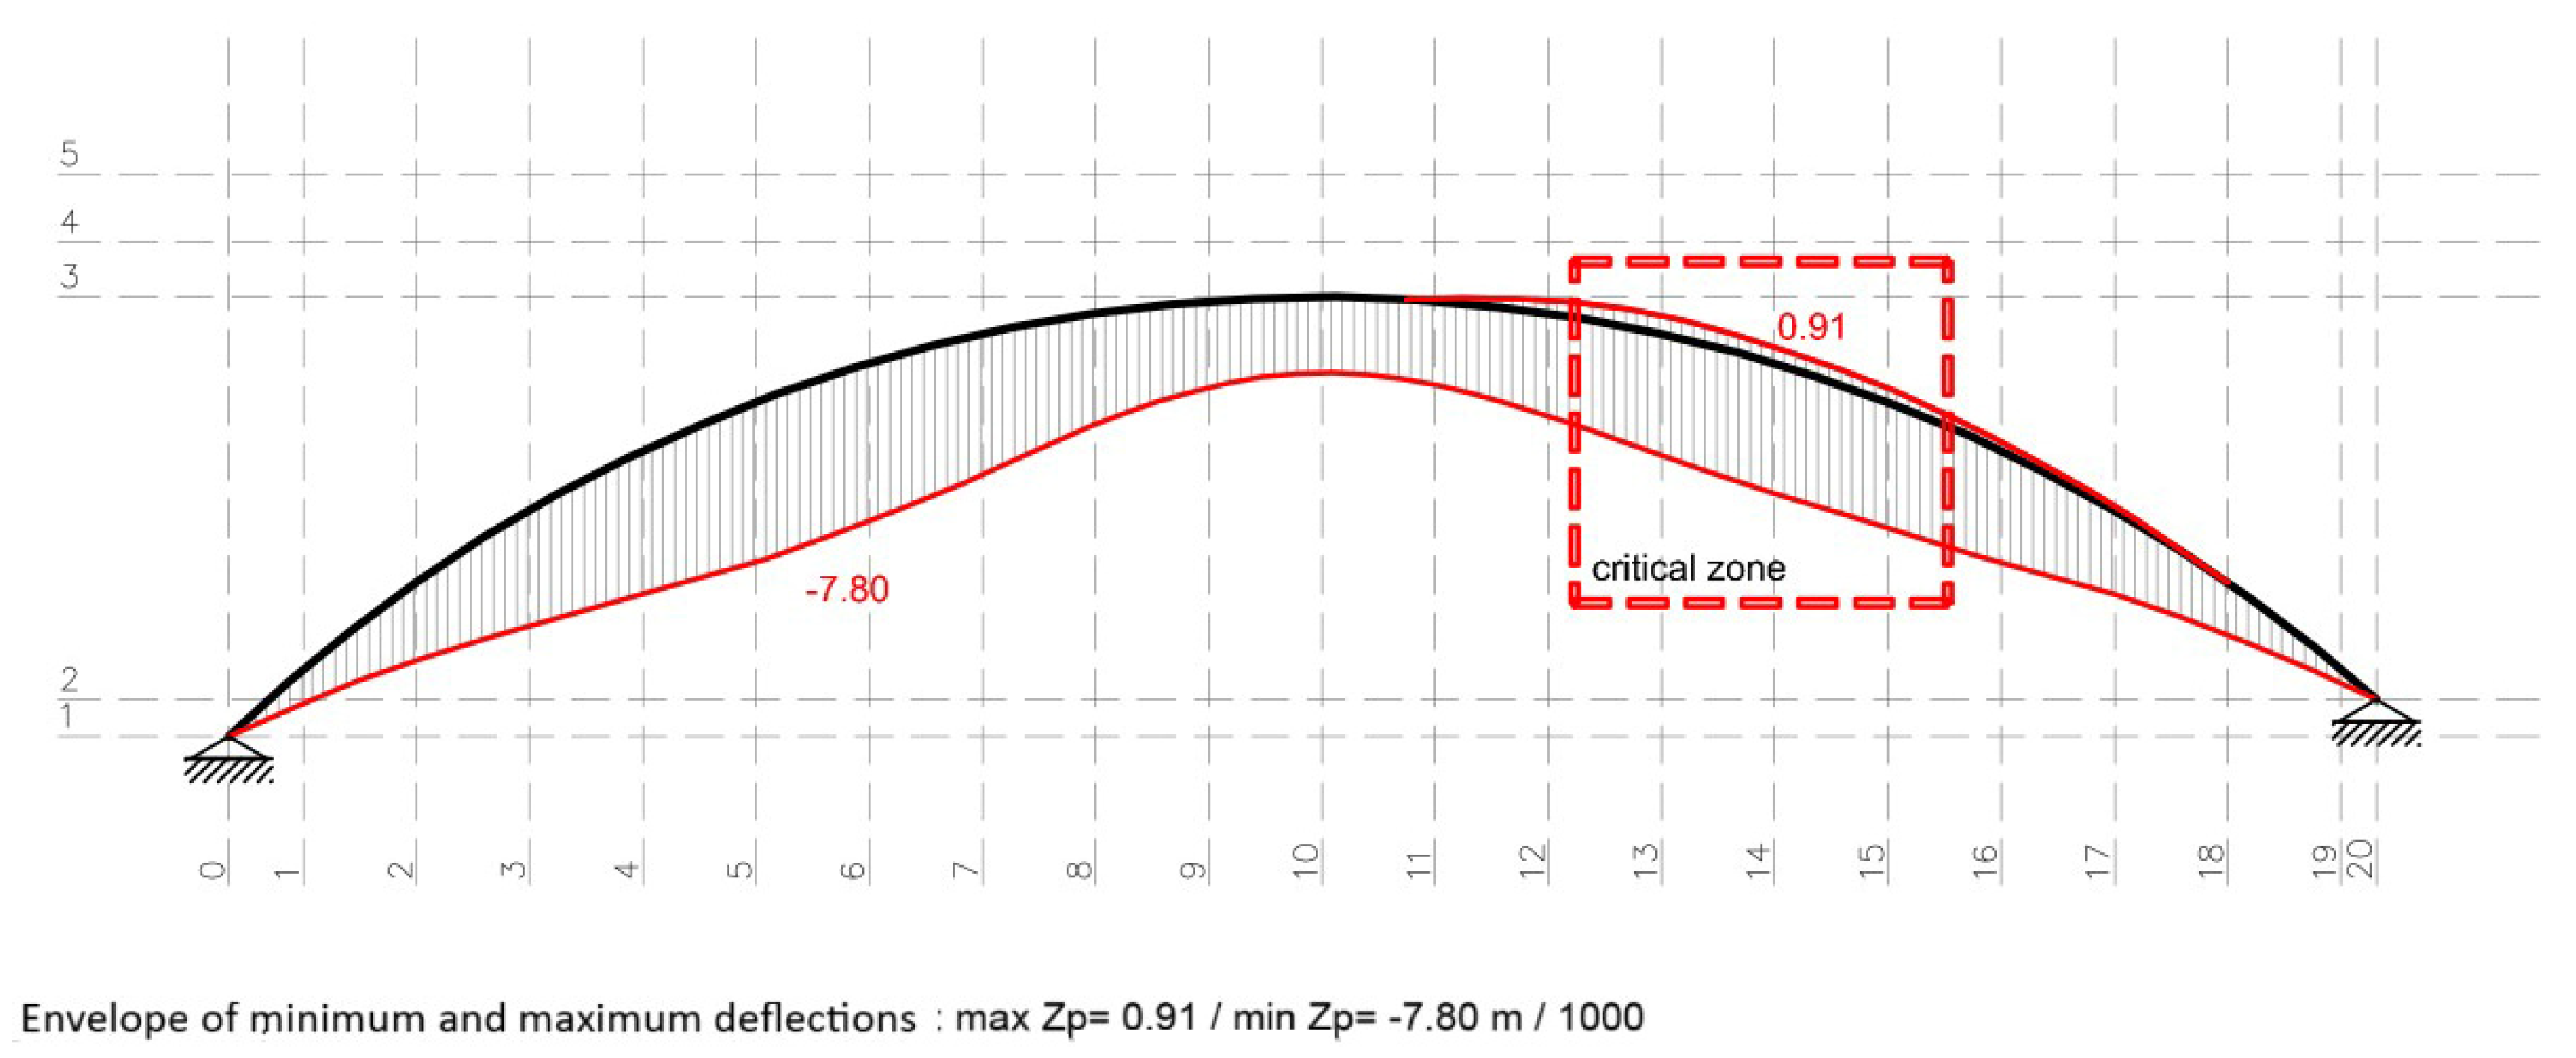
3.7.2. Deformation Analysis of the Structure

Using a 3D structural model, the behaviour of the arch was analysed based on the finite element method. Structural analysis and deformation (deflection) calculations were carried out for dead loads, and four cases of live load situations were given through load analysis. Figure 14 shows the exact position of live loads that effect the greatest deflections of the arch barrel for each of the considered cases, and the numerical analysis with deflections is shown in Table 4. The occurrence of asymmetric deformations on the arch barrel under the uniform distributed loads on all of its parts is the consequence of uneven foundation of supports and, because of that, the uneven weight of the fill, which is the main dead load of the bridge. For that reason, all cases of uniform distributed load (loads 1, 2, 3) have the greatest deflections on the left side and in the first quarter of the span, 7 m from the supports. Considering every result, it leads to the conclusion that one of the most inconvenient loads is the live load V600 in the case of position p3, which is the consequence of previously explained regulations that required additional loads on that part of construction. Large deformations can also be seen for the load case V600/position p12, causing the deflection of 6.37 mm on the 3/4 of the span, 20–21 m from the left support.
While observing the deformation model, i.e., the envelope of maximum and minimum deflection (Figure 15), the conclusion could be that the most significant absolute change in deflections occurs 20.40 m from the left support, at the part where large deformation from the live load V600/p12 was read. Deflections from dead load in that area are −2.14 mm, while the ones from V600/p12 are −6.34 mm, so the difference is ∆ƒ = 4.20 mm.
While observing the movement of deformations, i.e., the envelope of maximum and minimum deflection (Figure 16), the conclusion could be that the biggest absolute change in deflections occurs 20.40 m from the left support, at the part where large deformation from the live load V600/p12 was read. Deflections from dead load in that area are −2.14 mm, while the ones from V600/p12 are −6.34 mm, so the difference is ∆ƒ = 4.20 mm.
If we notice the location of the cracks, it is possible to see the location of the greatest crack on the bridge in the same area where the greatest deflection changes happen, on the line which separates the sidewalk from the roadway. For instance, if there are no users on the sidewalk, deflections will result only from self-load. In addition, if in the same moment a vehicle of the category V600 passes, in position p12, i.e., approx. 5 m from the edge of the bridge, the most significant difference in deflection under the sidewalk and roadway will occur. Thus, the difference is ∆ƒ = 4.20 mm and it will cause the appearance of a longitudinal crack that will strive to separate the bridge in two segments. As the most significant crack was spotted on the line between the sidewalk and roadway, the conclusion is that this crack results from the deformation’s amplitude, which occurs under the minimum and maximum loads. There are also the greatest shear stresses in the same area due to the transverse forces which influence further bridge structure damages that appear among stone joints and directly through stone blocks.

4. Discussion

The bridge presented in this case study is listed as a part of the Spatial Cultural-Historical Units of Great Importance in the Republic of Serbia. Due to its position, this bridge still represents one of the primary connections in the city of Ivanjica, which leads to its use daily. The research presented in this paper, including geological, geophysical, structural and biological analysis of the bridge, indicates permeation of different deterioration processes, whose negligence may lead to the system’s severe decay or even collapse.
A detailed approach to data collection and analysis of the bridge structure and the necessary steps for static restoration were previously discussed in the paper. Geological testing was crucial in the analysis process, as longitudinal cracks can also result from foundation disruption [6]. Extensive research in this area eliminated the assumption that movements of the foundation lead to crack development. However, due to the geological composition of the rock, its schistose and that it has the fault occurrence, regular maintenance of the bridge is necessary to prevent the loss of stone material, which can be caused by vegetation as well. On the other hand, geophysical testing gave important observations on the moisture content of materials used. This aspect of the research showed that changes in the electric conductivity of materials used were relevant indicators of the change in moisture content through the bridge’s structure. This information was crucial for a full understanding of the processes occurring and predicting possible future behaviour. The change in moisture content indicated two main problems. Firstly, with this occurring, stiffness of the infill material decreases, forming higher pressure on wing walls, and thus leads to crack propagation. Secondly, the presence of moisture develops a suitable environment for ice formation, thus leading to the degradation of the material’s inner structure. As the sandstone used is classified as medium-hard, appearance of inner stresses could cause significant damage. Nevertheless, biological testing also showed that the material’s inner structure was not degraded by biological colonisation, although superficial changes in colour can be seen with the naked eye. Apart from the aesthetically altered surface caused by the presence of lower plants and the development of black crust, the influence of these degradation processes did not change structural behaviour of the construction so far.
As mentioned above, both physical and mechanical testing was developed, giving all the necessary data for structural analysis. Precise defining of the bridge’s geometry was crucial for further study and numerical models of bridge construction. This research determined the bridge’s asymmetrical foundation, which resulted in a more significant load from the fill of the bridge on the left side of its construction. This has also affected the asymmetrical distribution of loads, causing greater deflections on the left side of construction. Consequently, added traffic loads on this side of the bridge increases deflections in that area but also causes the uplifting of construction elements on the other side, where longitudinal cracks appear. Loads on the right side of the structure also induce deflections, resulting in great dilatations, up to 6 mm, which stones cannot uphold.
A case study showed that the leading cause of the longitudinal cracks are shear stresses that appear when the live load is applied. Significant shear stresses in the transverse direction are expected in the barrel, as the live load defined by standards for vehicle zones is much higher than for pedestrian ones. This leads to fractures in stone structure because of the low capacity of sandstone to shear stresses. The appearance of these cracks did not lead to the collapse of the bridge, as they show limited bearing capacity in the transverse direction, but to the formation of an alternative structural solution, two independent arches. On the other hand, following the ingress of moisture, the existence of a crack leaves an open path for the moisture entrance, thus continuing the process of degradation of the inner structure. It is well known that, even though moisture does not directly influence mechanical degradation, its impact on the degradation of the material’s inner structure is significant. The city of Ivanjica, which belongs to the Moravica district, is famous for its large temperature oscillations, which is a condition that favours processes of physical degradation of material in the presence of moisture content. To investigate potential future behaviour of the bridge that could lead to the collapse, three possible mechanisms have to be evaluated: the opening of additional hinges in the arch barrel, which could lead to the formation of the mechanism; the out-of-plane behaviour of the spandrel wall; and the possible rotation of different parts. This is because the longitudinal crack forms two ‘’L’’ cross sections, whose rotation might lead to the collapse of the system. All three possible failure mechanisms should be investigated more thoroughly to define the limit conditions of the subject of this case study, thus defining its serviceability. Although a significant reserve of strength exists even after the crack formation, the weathering cycles and vegetation growth, recognised and investigated in this research, will modify the structure’s stiffness. In this context, it is essential to provide remedial measures directed towards cleaning biological colonisation and repointing the crack to prevent moisture ingress, allow movement and independent behaviour of separated parts.
This research supports the theory of flexible behaviour of the arch barrel under load as the cause for longitudinal cracks, as was stated in the references [19,20,21]. Moreover, the case study confirms the opinion of the authors shown in the literature review [15,17,22,23,24], that the pressure of the fill of the bridge to the spandrel wall under load can cause cracks between the wing wall and arch barrel, which is proven with some minor cracks happening on the bridge in Ivanjica.
Complete static restoration of the bridge has to be performed to provide further use of the bridge. Static restoration has to eliminate the causes of deformations or reduce their impact and provide further service for contemporary traffic loads. Restoration measures have to be conducted in accordance with the methods of heritage preservation [35].

5. Conclusions

The case study for the arch stone bridge in Ivanjica, Serbia, has shown a part of a research methodology for damaged stone bridge structures and opened new questions for possible future investigation. This case study shows the response to typical problems in masonry arch structures. Based on the research and analysis conducted in this paper, the conclusion is that the only proper way to repair the existing bridge structure is investigating a series of influences that could permeate and apply different types of tests. The main aim of integrated research is to define possible causes of cracks and predict future behaviour of the damaged structure. Historic survey and analysis on the site are vital for the following structural analysis, shown in the paper. Each aspect investigated, geological, geophysical, physical–mechanical and biological, gave important information of the possible causes of crack development and possible future risks. As longitudinal cracks are not recognised as the most typical crack pattern in arch bridge structures, all tests were vital to understanding the causes and processes fully. On the one hand, the possible formation of alternative structural systems that do not alter the structural stability of the whole, and possible failure mechanisms, on the other hand, stress the importance of expansion of knowledge in this area. Connecting past causes, current state and likely behaviour in the future, remedial measures should include the following:
-
Clean the structure from biological colonisation to stop potential further degradation.
-
Prevent moisture ingress by repointing the crack with a flexible grout that would not compromise the new-defined behaviour of the structure but close the path for moisture entrance.
-
Follow the propagation of cracks and their activity when the live load is applied.
-
Investigate possible failure mechanisms, evaluate them in order to predict future behaviour of the structure and set possible restrictions on its use.
Although arch barrels show significant bearing capacities due to their geometry and are rarely loaded in their ultimate capacity, their behaviour in the damaged condition is uncertain and calls for further investigation to investigate possible failure modes. However, before continuing the initiated research in a broader scope, the remedial measures mentioned above should be undertaken.
It is also necessary to consider recommendations for future use of the bridge. Heavy traffic restrictions across the bridge and its displacement to a new bridge can be recommended to prevent further degradation under the influence of the traffic load. For the planned purpose of the city centre, using a bridge as a pedestrian zone was considered by the authorities. That will help to preserve the bridge as part of the Spatial Cultural- Historical Units of Great Importance in the Republic of Serbia and, at the same time, contribute to the tourist potential and place identity.

Author Contributions

Conceptualisation, N.M.S. and N.Š.; methodology, N.M.S., S.K. and N.Š.; software, N.M.S.; validation, N.M.S., A.K. and N.Š.; formal analysis, A.K.; investigation, S.K. and N.Š.; resources, M.P.; data curation, M.P. and A.K.; writing—original draft preparation, N.M.S.; writing—review and editing, N.M.S., M.P. and A.K.; visualisation, N.M.S., N.Š.; supervision, N.Š.; project administration, M.P.; funding acquisition, N.Š. All authors have read and agreed to the published version of the manuscript.

Funding

This research received no external funding.

Acknowledgments

This research was supported by the University of Belgrade, Faculty of Architecture, LAB—Architectural Engineering Laboratory–Structural Problems of Architectural Buildings and Laboratory of architectural space—Form, function and materialization. Research and used data (geological, geophysical, laboratory physical-mechanical and biological testing) are part of the project Reconstruction and recovery of Old bridge in Ivanjica, organised by Municipality of Ivanjica. We are grateful to Dragoslav Nikolic for logistical support during site investigation.

Conflicts of Interest

The authors declare no conflict of interest.

References

  1. Milani, G.; Lourenço, P.B. 3D non-linear behavior of masonry structures. Comput. Struct. 2012, 110–111, 133–150. [Google Scholar] [CrossRef] [Green Version]
  2. Lacanna, G.; Lancellotta, R.; Ripepe, M. Integrating Modal Analysis and Seismic Interferometry for Structural Analysis and Seismic Interferometry for Structural Dy-namic Response: The Case Study of Giotto’s Bell Tower in Florence (Italy). In Proceedings of the COMPDYN 2019 7th ECCOMAS Thematic Conference on Computational methods in structural Dynamics and Earthquake Engineering, Crete, Greece, 24–26 June 2019; pp. 9–15. [Google Scholar]
  3. Zampieri, P.; Zanini, M.A.; Faleschini, F.; Hofer, L.; Pellegrino, C. Failure analysis of masonry arch bridges subject to local pier scour. Eng. Fail. Anal. 2017, 79, 371–384. [Google Scholar] [CrossRef]
  4. Bergamo, O.; Campione, G.; Cucchiara, C.; Russo, G. Structural behavior of the old masonry bridge in the Gulf of Castellammare. Eng. Fail. Anal. 2016, 62, 188–198. [Google Scholar] [CrossRef]
  5. Choo, B.S.; Coutie, M.G.; Gong, N.G. The Effect of Cracks on the Behaviour of Masonry Arches. In Proceedings of the 9th International Brick/Block Masonry Conference, Berlin, Germany, 13–16 October 1991; Volume 2, pp. 948–955. [Google Scholar]
  6. Garrity, S.W. The Complex Engineering Design Challenges of Masonry arch Bridge Rehabilitation. In Proceedings of the 2nd International Conference on Preservation, Maintenance and Rehabilitation of Historical Buildings and Structures., Porto, Portugal, 22–24 July 2015; Amoêda, R.L., Piheiro, C., Eds.; 2015; pp. 139–150. [Google Scholar]
  7. Gibbons, N.; Fanning, P. Progressive cracking in masonry arch bridges. Bridge Eng. 2016, 169, 93–112. [Google Scholar] [CrossRef]
  8. Municipality of Ivanjica. Results of the competition: “Old Bazaar” and the Immediate Surroundings—The Conceptual Design of the New Bridge in Ivanjica. Available online: https://ivanjica.gov.rs/rezultati-konkursa-stara-carsija-i-neposredno-okruzenje-idejno-resenje-novog-mosta-u-ivanjici/?_rstr_nocache=rstr841618b9beb99b78 (accessed on 11 November 2021).
  9. Miri, M.; Hughes, T.G. The Effect of Spandrel Wall Strengthening on the Load Capacity of Masonry Arch Bridges. In Proceedings of the 10th Canadian Masonry Symposium, Baniff, Alberta, 8–12 June 2005; University of Calgary, Department of Civil Engineering: Calgary, AB, Canada, 2005. [Google Scholar]
  10. Ashurst, D. An Assessment of Repair and Strengthening Techniques for Brick and Stone Masonry Arch Bridges; Contractor Report 284; Transport Research Laboratory: Crowthorne, UK, 1992. [Google Scholar]
  11. Page, J. State of the Art Review. Masonry Arch Bridges; Transport research Laboratory: London, UK, 1993. [Google Scholar]
  12. Page, J. A Guide to Repair and Strengthening of Masonry Arch Highway Bridges; TRL Report 204; Transport research Laboratory: Crowthorne, UK, 1996. [Google Scholar]
  13. McKibbins, L.D.; Melbourne, C.; Sawar, N.; Sicilia Gaillard, C. Masonry Arch Bridges: Condition Appraisal and Remedial Treatment; CIRIA C656; Construction Insudtry Research and Information Association: London, UK, 2006. [Google Scholar]
  14. Wilmers, W. Restoration of masonry arch bridges. Bridge Eng. 2012, 165, 135–146. [Google Scholar] [CrossRef]
  15. Page, J. Repair and Strengthening of Arch Bridges; IABSE Reports; IABSE—International Association for Bridge and Structural Engineering: Zürich, Switzerland, 1993; pp. 565–572. [Google Scholar]
  16. Heyman, J. The Stone Skeleton. Int. J. Solids Struct. 1966, 2, 249–279. [Google Scholar] [CrossRef]
  17. Lourenço, P.B.; Oliveira, D.V. Strengthening of Masonry Arch Bridges: Research and Applications. In Proceedings of the First International Conference on Advances in Bridge Engineering: Bridges-Past, Present and Future, 26–28 June 2006, Brunel; Brunel University: London, UK, 2006; pp. 107–116. [Google Scholar]
  18. Giuriani, E.; Gubana, A.; Arenghi, A. Backfill and spandrels to limit the vault bending. WIT Trans. Built Environ. 1999, 42, 739–748. [Google Scholar]
  19. Giuriani, E.; Gubana, A.; Arenghi, A. Structural Rehabilitation of Masonry Vaults. In Proceedings of the UNESCO-ICOMOS Millennium Congress, Paris, France, 10–12 December 2001. [Google Scholar]
  20. Tomor, A.K.; Melbourne, C. Monitoring Masonry Arch Bridge Response to Traffic Loading Using Acoustic Emission Techniques. In Proceedings of the Arch’07—5th International Conference on Arch Bridges, Madeira, Portugal, 12–14 September 2007; pp. 281–288. [Google Scholar]
  21. Apreutesei, V. Strengthening of Stone Masonry Arch Bridges; Oliveira, D.V., Ed.; Technical University “Gh. Asachi” Romania and Universidade do Minho, Escola de engenharia: Gumaraes, Portugal, 2005. [Google Scholar]
  22. Boothby, T.E.; Hulet, M.K.; Stanton, T.R. Inspection, assessment and monitoring of Railroad arch bridges in Southwest Ern Pennsylvania. In Arch Bridges IV—Advances in Assessment, Structural Design and Construction; Roca, P., Oñate, E., Eds.; CIMNE: Barcelona, Spain, 2004; pp. 144–151. [Google Scholar]
  23. Proske, D.; Gelder, V.P. Safety of Historical Stone Arch Bridges; Springer: Berlin/Heidelberg, Germany, 2009. [Google Scholar]
  24. Fanning, P.J.; Boothby, T.E.; Roberts, B.J. Longitudinal and transverse effects in masonry arch assessment. Constr. Build. Mater. 2001, 15, 51–60. [Google Scholar] [CrossRef]
  25. Page, J.; Ives, D.A.; Ashurst, D. Deterioration and Repair of Masonry Arch Bridges. In Proceedings of the 9th International Brick/Block Masonry Conference, Berlin, Germany, 13–16 October 1991; pp. 1591–1598. [Google Scholar]
  26. De Arteaga, I.; Morer, P. The effect of geometry on the structural capacity of masonry arch bridges. Constr. Build. Mater. 2012, 34, 97–106. [Google Scholar] [CrossRef]
  27. Conde, B.; Díaz-Vilariño, L.; Lagüela, S.; Arias, P. Structural analysis of Monforte de Lemos masonry arch bridge con-sidering the influence of the geometry of the arches and fill material on the collapse load estimation. Constr. Build. Mater. 2016, 120, 630–642. [Google Scholar] [CrossRef]
  28. Frunzio, G.; Monaco, M.; Gesualdo, A. 3D F.E.M. analysis of a Roman arch bridge. In Historical Constructions: Possibilities of Numerical and Experimental Techniques; Lourenço, P.B., Roca, P., Eds.; University of Minho: Guimarães, Portugal, 2001; pp. 591–598. [Google Scholar]
  29. Oliveira, D.V.; Lourenço, P.B.; Lemos, C. Geometric issues and ultimate load capacity of masonry arch bridges from the northwest Iberian Peninsula. Eng. Struct. 2010, 32, 3955–3965. [Google Scholar] [CrossRef] [Green Version]
  30. IMS Institute for testing of materials-IMS Institute. Study on the Examination of the Condition of the Stone on the Stone Bridge in IVANJICA—Stone Testing Report; Central Materials Testing Laboratory, Stone and Aggregate Laboratory of Institute for testing of materials-IMS Institute: Belgrade, Serbia, 2015. [Google Scholar]
  31. Ivanović, N. (Unpublished work); Geological Characteristics of the Terrain, Location Stone Bridge—Ivanjica; Geological Survey Report: Belgrade, Serbia, 2014. [Google Scholar]
  32. Vukadinović, M. (Unpublished work); Report of Geophysical Tests by the Method of Electric Scanning on the Stone Bridge in Ivanjica; Belgrade, Serbia, 2014. [Google Scholar]
  33. Bilbija, N.; Matović, V. Primenjena Petrografija: Svojstva i Primene Kamena; Građevinska knjiga: Beograd, Serbia, 2009. [Google Scholar]
  34. Službeni List SFRJ. Pravilnik o Tehničkim Normativima za Određivanje Veličina Opterećenja Mostova; Službeni list SFRJ: Beograd, Serbia, 1991; p. br. 1/91. [Google Scholar]
  35. Šekularac, N.; Čikić-Tovarović, J.; Ivanović-Šekularac, J. Investigating structural stability of historic buildings: A case study of a rampart wall of Hilandar Monastery. Struct. Eng. Int. 2017, 27, 353–361. [Google Scholar] [CrossRef]
Figure 1. Three-dimensional scheme of possible position of transverse and longitudinal cracks in masonry arch bridges due to most common causes of cracks.
Sustainability 13 13363 g001
Figure 2. Masonry stone arch bridge in Ivanjica in its natural surroundings (a) and the traffic road of the bridge (b).
Sustainability 13 13363 g002
Figure 3. Three-dimensional model of masonry stone arch bridge in Ivanjica.
Sustainability 13 13363 g003
Figure 4. Geometric characteristics of the bridge: span, depth and arch rise, with highlighted position of developed longitudinal cracks.
Sustainability 13 13363 g004
Figure 5. Elevation of the spandrel and wing wall with arch ring showing the dimensions and relation between stone blocks from which it was built and their current state.
Sustainability 13 13363 g005
Figure 6. Elevation of the arch barrel where deterioration of alternately built-in stone blocks and the visible difference between the central-dry and side-wet sides of the arch barrel.
Sustainability 13 13363 g006
Figure 7. Photos of arch barrel cracks (a) between and through stone blocks, (b) on the wet side of the arch barrel, (c) through binder and (d) on the lower third of the arch barrel.
Sustainability 13 13363 g007
Figure 8. Cracks and rift in the rocky mass under the bridge foundation observed at site.
Sustainability 13 13363 g008
Figure 9. Geo-electric scanning with results of the distribution of electrical resistivity in Ω⋅m showing the change in dryness of the material from left to the right coast of the bridge (from top to bottom: plan with profile positions, profile 3-3, profile 2-2, profile 1-1).
Sustainability 13 13363 g009
Figure 10. Geo-electric scanning with results of the distribution of electrical resistivity in Ω⋅m showing the change in dryness of the material from traffic road to the arch barrel (from left to right: profile C-C’, profile D-D’).
Sustainability 13 13363 g010
Figure 11. Taking a drilling sample for laboratory analysis: (a) positions of samples, (b) process of sampling the wing wall and (c) process of sampling the stone fence.
Sustainability 13 13363 g011
Figure 12. Close-up of bridge structure: (a) decolorisation of the parapet and spandrel wall, (b) forming of white stains and edges, (c) sampling for biological analysis, (d) efflorescence of arch barrel and (e) change of colour on the wing wall.
Sustainability 13 13363 g012
Figure 13. Scheme of a typical vehicle type V600/300, with loading scheme on the traffic road and sidewalk used for numerical analysis.
Sustainability 13 13363 g013
Figure 14. Names and positions of loads applied to the bridge in the finite element model.
Sustainability 13 13363 g014
Figure 15. Diagrams of arch deflections in f(mm) due to different load conditions (from top to bottom: dead load, dead load + live load from V600/V300 positioned on the first third of the arch, dead load + live load from V600/V300 positioned on the last third of the arch).
Sustainability 13 13363 g015
Figure 16. Envelope of minimum and maximum deflections on the construction under every load case in f(mm), with highlighted position of the largest amplitudes resulting in longitudinal cracks on the arch barrel.
Sustainability 13 13363 g016
Table 1. Results of testing of stone samples.
Sample NumberLocationLaboratory Mark of the SamplesMineralogical–Petrological CompositionPhysical–Mechanical Properties
Type of RockStructureTextureBulk Density with Pores and Cavities (g/cm3)Bulk Density without Pores and Cavities (g/cm3)Porosity (%)Coefficient of Bulk DensityWater Absorption (%)Overburden Pressure in Dry Condition (MPa)
1Arch barrel, right coastKIA 0068/14 AGKSandstoneArenaceousmassive2.2312.594140.860max. 4.07min. 3.974.01max. 80min. 4064
2Wing wall, right coastKIA 0069/14AGKSandstoneArenaceousmassive2.2222.58414.10.859max. 4.50min. 4.004.18max. 62min. 4451
3Belt course, right coastKIA 0070/14 AGKSandstoneArenaceousmassive2.2242.60914.80.852max. 4.38min. 4.184.28max. 64min. 4252
Table 2. Dead loads.
Dead Loadsd1 (m)d2 (m)γ (kN/m3)g1 (kN/m)g2 (kN/m)
Self-load of the arch barrel0.971.7223.0022.3139.56
Weight of the filling (from the top of the arch barrel to the right support)0.255.5320.005.00110.60
Weight of the filling (from the top of the arch barrel to the left support)0.256.0120.005.00120.2
Weight of the roadway and roadway structure with all its layers (d = const)0.90 23.0020.70
d1—height above crown of arch, d2—height above right/left support, γ—specific gravity of material, g1—dead load on/above crown of arch, g2—dead load on/above right/left support.
Table 3. Calculating scheme for bridge loads based on bridge category.
Classification of BridgeCalculation Schemes
I—motorway bridgesV600 + V300
II—trunk road, regional road and arterial road bridgesV600
III—bridges on all other roadsLane widths ≥ 6.0 mV300 + V300
Lane widths < 6.0 mV300
Table 4. Arch deformation under different load cases.
Calculation schemesDistance from the Reference Axis 0.00 (m)
6.997.228.3919.3619.6020.0020.4020.8821.6922.55
0Dead loadDeflections of arch-ƒ(mm)−3.88−3.87−3.68−1.94−1.99−2.08−2.14−2.21−2.27−2.26
1Dead load + Uniform Distributed Load 3 kN/m2−3.93−3.92−3.74−2.06−2.11−2.18−2.24−2.31−2.35−2.32
2Dead load + Uniform Distributed Load 5 kN/m2−3.96−3.95−3.80−2.14−2.19−2.26−2.32−2.37−2.41−2.36
3Dead load + V600position 3 (p31 = 40 kN/m2)−7.78−7.80−7.560.900.910.890.850.790.670.54
position 12 (p31 = 40 kN/m2)−0.78−0.76−0.67−6.03−6.13−6.26−6.34−6.37−6.26−5.96
4Dead load + V300position 3 (p41 = 20 kN/m2)−5.57−5.57−5.37−0.91−0.94−0.98−1.03−1.09−1.16−1.19
position 13 (p41 = 20 kN/m2)−2.73−2.71−2.57−3.62−3.71−3.83−3.91−3.99−4.01−3.89
∆ƒmax= ƒ(V600/position3)-ƒ (dead load)I∆ƒmaxI3.913.933.88
∆ƒmax= ƒ(V600/position12)-ƒ (dead load) 4.084.144.184.204.163.993.70
∆ƒ—difference of deflection under the sidewalk (without uniform load) and roadway (with maximum load intensity).
Publisher’s Note: MDPI stays neutral with regard to jurisdictional claims in published maps and institutional affiliations.

