Article

Assessment of Petroleum-Based Plastic and Bioplastics Degradation Using Anaerobic Digestion

Department of Environmental Science and Technology, University of Maryland, College Park, MD 20742, USA
*
Author to whom correspondence should be addressed.
Sustainability 2021, 13(23), 13295; https://doi.org/10.3390/su132313295
Submission received: 29 October 2021 / Revised: 23 November 2021 / Accepted: 25 November 2021 / Published: 1 December 2021
(This article belongs to the Special Issue Innovation in Waste-to-Energy Technology)

Abstract

:
Bioplastics have emerged as a viable alternative to traditional petroleum-based plastic (PET). Three of the most common bioplastic polymers are polyhydroxybutyrate-valerate (PHBV), polylactide (PLA), and cellulose-based bioplastic (CBB). This study assessed biodegradation through anaerobic digestion (AD) of these three bioplastics and PET digested with food waste (FW) at mesophilic (35 °C) and thermophilic (55 °C) temperatures. The four plastic types were digested with FW in triplicate batch reactors. Additionally, two blank treatments (inoculum-only) and two PHBV treatments (with FW + inoculum and inoculum-only) were digested at 35 and 55 °C. The PHBV treatment without FW at 35 °C (PHBV-35) produced the most methane (CH4) normalized by the volatile solids (VS) of the bioplastics over the 104-day experimental period (271 mL CH4/g VS). Most bioplastics had more CH4 production than PET when normalized by digester volume or gram substrate added, with the PLA-FW-55 (5.80 m3 CH4/m3), PHBV-FW-55 (2.29 m3 CH4/m3), and PHBV-55 (4.05 m3 CH4/m3) having 848,275 and 561%, respectively, more CH4 production than the PET treatment. The scanning electron microscopy (SEM) showed full degradation of PHBV pellets after AD. The results show that when PHBV is used as bioplastic, it can be degraded with energy production through AD.

1. Introduction

Plastic waste is increasing across the world. Additionally, traditional petroleum-based polymers have high carbon emissions due to the extraction and refinement processes associated with their production [1]. In addition to the emissions associated with their manufacture, petroleum plastics cannot be easily degraded naturally by microorganisms [2]. This makes it difficult to efficiently process petroleum-based plastic (PET) without using harsh chemicals and creating harmful waste products. If the current trend in plastic use continues, by 2040 the rate of plastic waste leakage into the ocean will triple [3]. It is necessary to increase the use of alternatives to petroleum-based plastics that have less emissions associated with their manufacture, with the ability to be degraded or processed without the use of hazardous wastes products. This study investigated degradation and biogas production potential through anaerobic digestion (AD) of several bioplastic polymers compared to a petroleum-based plastic.
The potential applications of bioplastic polymers/plastics have been researched and developed extensively in the past several years, with global bioplastic production set to increase to 2.44 million tons in 2022 from 2.05 million tons in 2017 [4]. Some industries, such as the food packaging industry, can increase their sustainability and reduce their environmental impact through the use of bioplastic materials [5,6]. Research on the best methods to efficiently process and degrade these bio-based polymers is necessary, with this study investigating the potential of AD as a waste treatment and energy production process for degrading bioplastics. The AD process can aid in degradation of various feedstocks while producing renewable energy in the form of methane (CH4)-rich biogas. AD systems are increasingly being used in industry to treat wastewater, manure, and food waste (FW).
Three of the most common bioplastic polymers are polyhydroxybutyrate-valerate (PHBV), polylactide (PLA), and cellulose-based bioplastic (CBB). PHB and PHV polymers are members of the polyhydroxyalkanoate (PHA) family of polyesters. PHB is synthesized from organic material, such as glucose, through microbial synthesis. PHB polymers have a large potential for industrial use due to their biodegradability and structural integrity. PHB is commonly copolymerized with PHV to form PHBV. The addition of PHV to PHB polymers reduces the stiffness, melting point, and crystallinity of the polymers, presenting a polymer that is more useful in manufacturing applications. PHA polymers, such as PHB, PHV, and PHBV, form thermoplastics that can be competitive with standard petroleum plastics in their physical properties (tensile strength, flexibility, melting point, etc.) [7]. The tensile strength of PHBV, PLA, and CBB is around half that of PET, and these bioplastics melt at temperatures around 100 °C cooler, on average, then PET. These physical properties allow for the use of these bioplastics in industries such as food packaging or manufacturing of common goods. The main drawback of using PHBV plastics is their high production cost, but with the continued optimization and scaling of PHBV and other PHA polymer production processes, the cost is expected to decrease over time [8].
PLA polymers are biodegradable and can be synthesized from renewable organic sources, such as starch and corn. PLA can be efficiently synthesized through ring opening polymerization of the lactide monomer. Yet, this process is energy intensive and can produce carcinogenic byproducts, requiring pre-treatment before use [9]. An additional drawback of PLA use is its low resistance to heat and lack of structural integrity under stress [10].
Cellulose polymers are hydrophilic, highly water-absorbent, and the most common biodegradable polymers used in industry, with an estimated biomass production of 1011 to 1012 tons per year [11]. Cellulose esterification is used to modify the cellulose to produce a bioplastic ready for industrial use.
Bioplastics need to be cost competitive and have structural integrity during use but fully degrade upon disposal [12]. Since most bioplastics are biodegradable over a reasonable time in the environment, there are limited studies on the degradation periods and energy potential associated with multiple types of bioplastic products. A previous study assessed the degradation of PLA and CBB bioplastics over a 35-day period (typical residence time for AD), concluding that the bioplastics were not fully degraded and unsuitable for standard biogas digesters [13]. However, the study did not digest the bioplastics alongside common substrates they would be disposed with, such as food waste, and the study did not compare the degradability of the bioplastics to petroleum-based plastics.
The overall aim of this study was to assess the biodegradability and biogas production rate of three bioplastics (PHBV, PLA, CBB) and compare the results to a fossil-fuel-based plastic (PET) when co-digested with food waste. Two experiments were conducted using the PHBV bioplastic polymer to assess the effect of temperature on biodegradability and biogas production. Food waste was used in the mixture to simulate a common application of bioplastic polymers as a material for food packaging. This study assessed the four plastics and food waste until biogas production largely ceased (daily CH4 production was <1% of cumulative CH4 production), addressing the need for research on bioplastic digestion over a longer period. The specific objectives of this study were to: (1) analyze the total biogas production of each bioplastic in comparison to petroleum-based plastic in the presence of food waste; (2) assess the efficiency of the conversion of volatile solids (VS) within the plastics into biogas by normalizing the gas production based on the VS of both the food waste and plastic substrates; and (3) determine the extent of degradation of the bioplastics in comparison to the petroleum-based plastic using scanning electron microscopy (SEM).

2. Materials and Methods

2.1. Substrate Characteristics

Batch biochemical methane potential (BMP) tests were conducted in triplicate. The thermophilic digester inoculum was collected from a lab-based thermophilic digester operating in Ashburn, VA (USA), and the mesophilic inoculum was collected from our semi-continuous lab inoculum digester in College Park, MD (USA), which operated with food waste substrate at a loading rate of 2.1 g VS/L/week to achieve a stable, low biogas production rate. The mesophilic and thermophilic inocula were mixed 1:1 on a volumetric basis to build the inoculum used in this experiment, which allowed for the same inoculum to be used for both treatments.
The PHBV, CBB, and PLA bioplastic pellets added to the digestion reactors were ordered from the commercial bioplastic material companies TianAn Biologic Materials Co. (Beilun Port, Ningbo, China), FKuR Plastics Corp. (Lexington, TX, USA), and BIOTEC GmbH & Co. (Emmerich am Rhein, Germany), respectively. The PET plastic pellets were ordered from VViViD (Montreal, QC, Canada). The diameter of the pellets ranged from 2 to 3 mm in diameter. The tensile strengths of the PHBV, PLA, and CBB bioplastics were 39, 31, and 41 mPA, respectively, the melting points were 135, 190, and 180 °C, respectively, and the Charpy impact strengths were 1, 5, and 2 kJ/m2, respectively. More information regarding the properties of each plastic can be obtained from the manufacturer’s provided datasheets [14,15].
Table 1 shows the food waste (FW) mixture based on FW percentages provided by the U.S. Department of Agriculture (USDA), which estimated the relevant ratios of the top 10 postharvest food losses at both the retail and consumer level [16]. The FW mixture was homogenized using a stainless-steel blender, with 200 mL of DI water (ELGA LabWater, AVR, USA) added to the mixture based on the USDA FW recipe.

2.2. Anaerobic Digestion (AD) Methods

Two experiments were conducted. The first experiment consisted of AD reactors operated under mesophilic conditions (35 °C) (AD-35), and a separate experiment was conducted using thermophilic conditions (55 °C) (AD-55). Each treatment was digested in triplicate 200 mL glass digestion reactors using standard BMP procedures, with all biogas and CH4 production values reported in normal temperature and pressure conditions (1 atm and 20 °C) [17]. The FW and inoculum were loaded at a 2:1 inoculum to substrate ratio (ISR) based on VS, as suggested by recent research [18,19]. The mesophilic experiment tested only one type of plastic, PHBV, while the thermophilic experiment tested all four types of plastic (PHBV, PLA, CBB, and PET). Overall, there were eleven treatments tested in triplicate, with two blank, inoculum-only treatments (inoculum-only at 35 °C and inoculum only at 55 °C), for a total of 33 AD reactors with 12 AD reactors tested at 35 °C and 21 AD reactors tested at 55 °C (Table 2). For the thermophilic experiment, the four plastics were digested with FW, with PHBV tested with and without FW. As shown in Table 2, there was 2.17 g of FW and 10 g of the respective bioplastic added to 147.83 g of inoculum into each triplicate bottle at a 2:1 inoculum to FW substrate ratio, based on VS, equating to a plastics to FW ratio of 1 to 4.6, based on weight. Treatments without FW contained 10 g of bioplastic and 147.83 g of inoculum. The source inoculum (mixture of the mesophilic and thermophilic inoculums sources) had an average total solids (TS) concentration of 9.70 g/kg and an average VS concentration of 6.53 g/kg, with the TS and VS concentrations and initial pH in each reactor prior to digestion shown in Table 3.
The pH of all treatments ranged from 7.52 to 7.60 pre-digestion (Table 3), which is within the ideal range for CH4 production [20]. The TS and VS of the FW–inoculum treatment (12.9 g/kg and 74.7%, respectively) was 32.9 and 10.8% greater than the inoculum (9.70 g/kg and 67.3%), respectively. The TS of the PHBV-FW, CBB-FW, PLA-FW, and PET-FW treatments were 74.4, 72.1, 74.4, and 74.6 g/kg, respectively (Table 3), while the VS were 95.3, 61.1, 79.0, and 95.7% of the TS value, respectively.
Total biogas production was measured by injecting a 50 mL wet-tipped glass syringe into the rubber septum of the digestion reactors. In the first two weeks of the experiment, biogas production and biogas quality were measured daily. After the first two weeks, biogas production and biogas quality were measured 2–3 times a week for the remainder of the experiment (13 weeks). The average CH4 production the triplicate inoculum control reactors was subtracted from the other treatments to present the total CH4 production from the waste substrates only and subtract the CH4 production attributed to the inoculum source. The BMP test was concluded when the daily CH4 production was less than 1% of the cumulative CH4 production.

2.3. Analytical Methods

The pH values of all treatments pre- and post-digestion were measured using an Accumet AB 15 pH meter (Fisher Scientific, Hampton, NH, USA). The TS and VS concentrations of each treatment before and after digestion were determined using Standard Methods [21]. TS (Method 2540B) and VS (Method 2540E) concentrations were determined in triplicate using ‘Standard Methods for the Examination of Water and Wastewater’ within 24–48 h of collection [21]. For TS analysis, triplicate 10.0 mL samples were pipetted into pre-weighed porcelain crucibles and dried at 105 °C until a constant mass was obtained. For VS analysis, the dried crucibles were placed in a furnace at 550 °C until a constant weight was obtained [21].
To determine CH4 and CO2 content concentrations, 0.50 mL of biogas was injected into an Agilent HP 7890 A gas chromatograph (Agilent Technologies, Santa Clara, CA, USA) equipped with a thermal conductivity detector (TCD) and a single HP porous layer open tubular (PLOT) Q column at injection temperature 250 °C, detector temperature 250 °C, and oven temperature 250 °C. The volatile fatty acids (VFA) analyses were conducted using a GC Agilent HP 7890 A gas chromatograph with a flame ionization detector (FID) as described in our previous research [22]. The VFA concentrations were converted to chemical oxygen demand (COD) concentrations using the following conversion factors: 1.07 for acetic acid, 1.51 for propionic acid, 1.82 for butyric acid, and 2.04 for valeric acid [23].
Energy Dispersive Spectroscopy (EDS) and scanning electron microscope (SEM) digital imaging of the samples were conducted pre- and post-digestion using a Quanta SEM to evaluate the extent of degradation that occurred during AD over the 13-week period. The resulting digital images were magnified 3200x. Only one sample was taken from each treatment for SEM, as multiple layers are taken from each sample and loaded on the SEM sample plate. An air drying technique was used to dry each layer before implementing the second and the third layers. Any plastic pieces found in the reactor were collected and fixed on the SEM plate.

2.4. Statistical Analysis

Analysis of variance (ANOVA) was used to assess significant differences in cumulative CH4 production, with p-values < 0.05 considered significant. Tukey’s honestly significant difference (HSD) post-hoc tests were used to compare numerous variables, such as the CH4/g VS, and m3 CH4/m3 reactor. All values in the figures and tables are presented as averages with the standard error (SE).

3. Results and Discussion

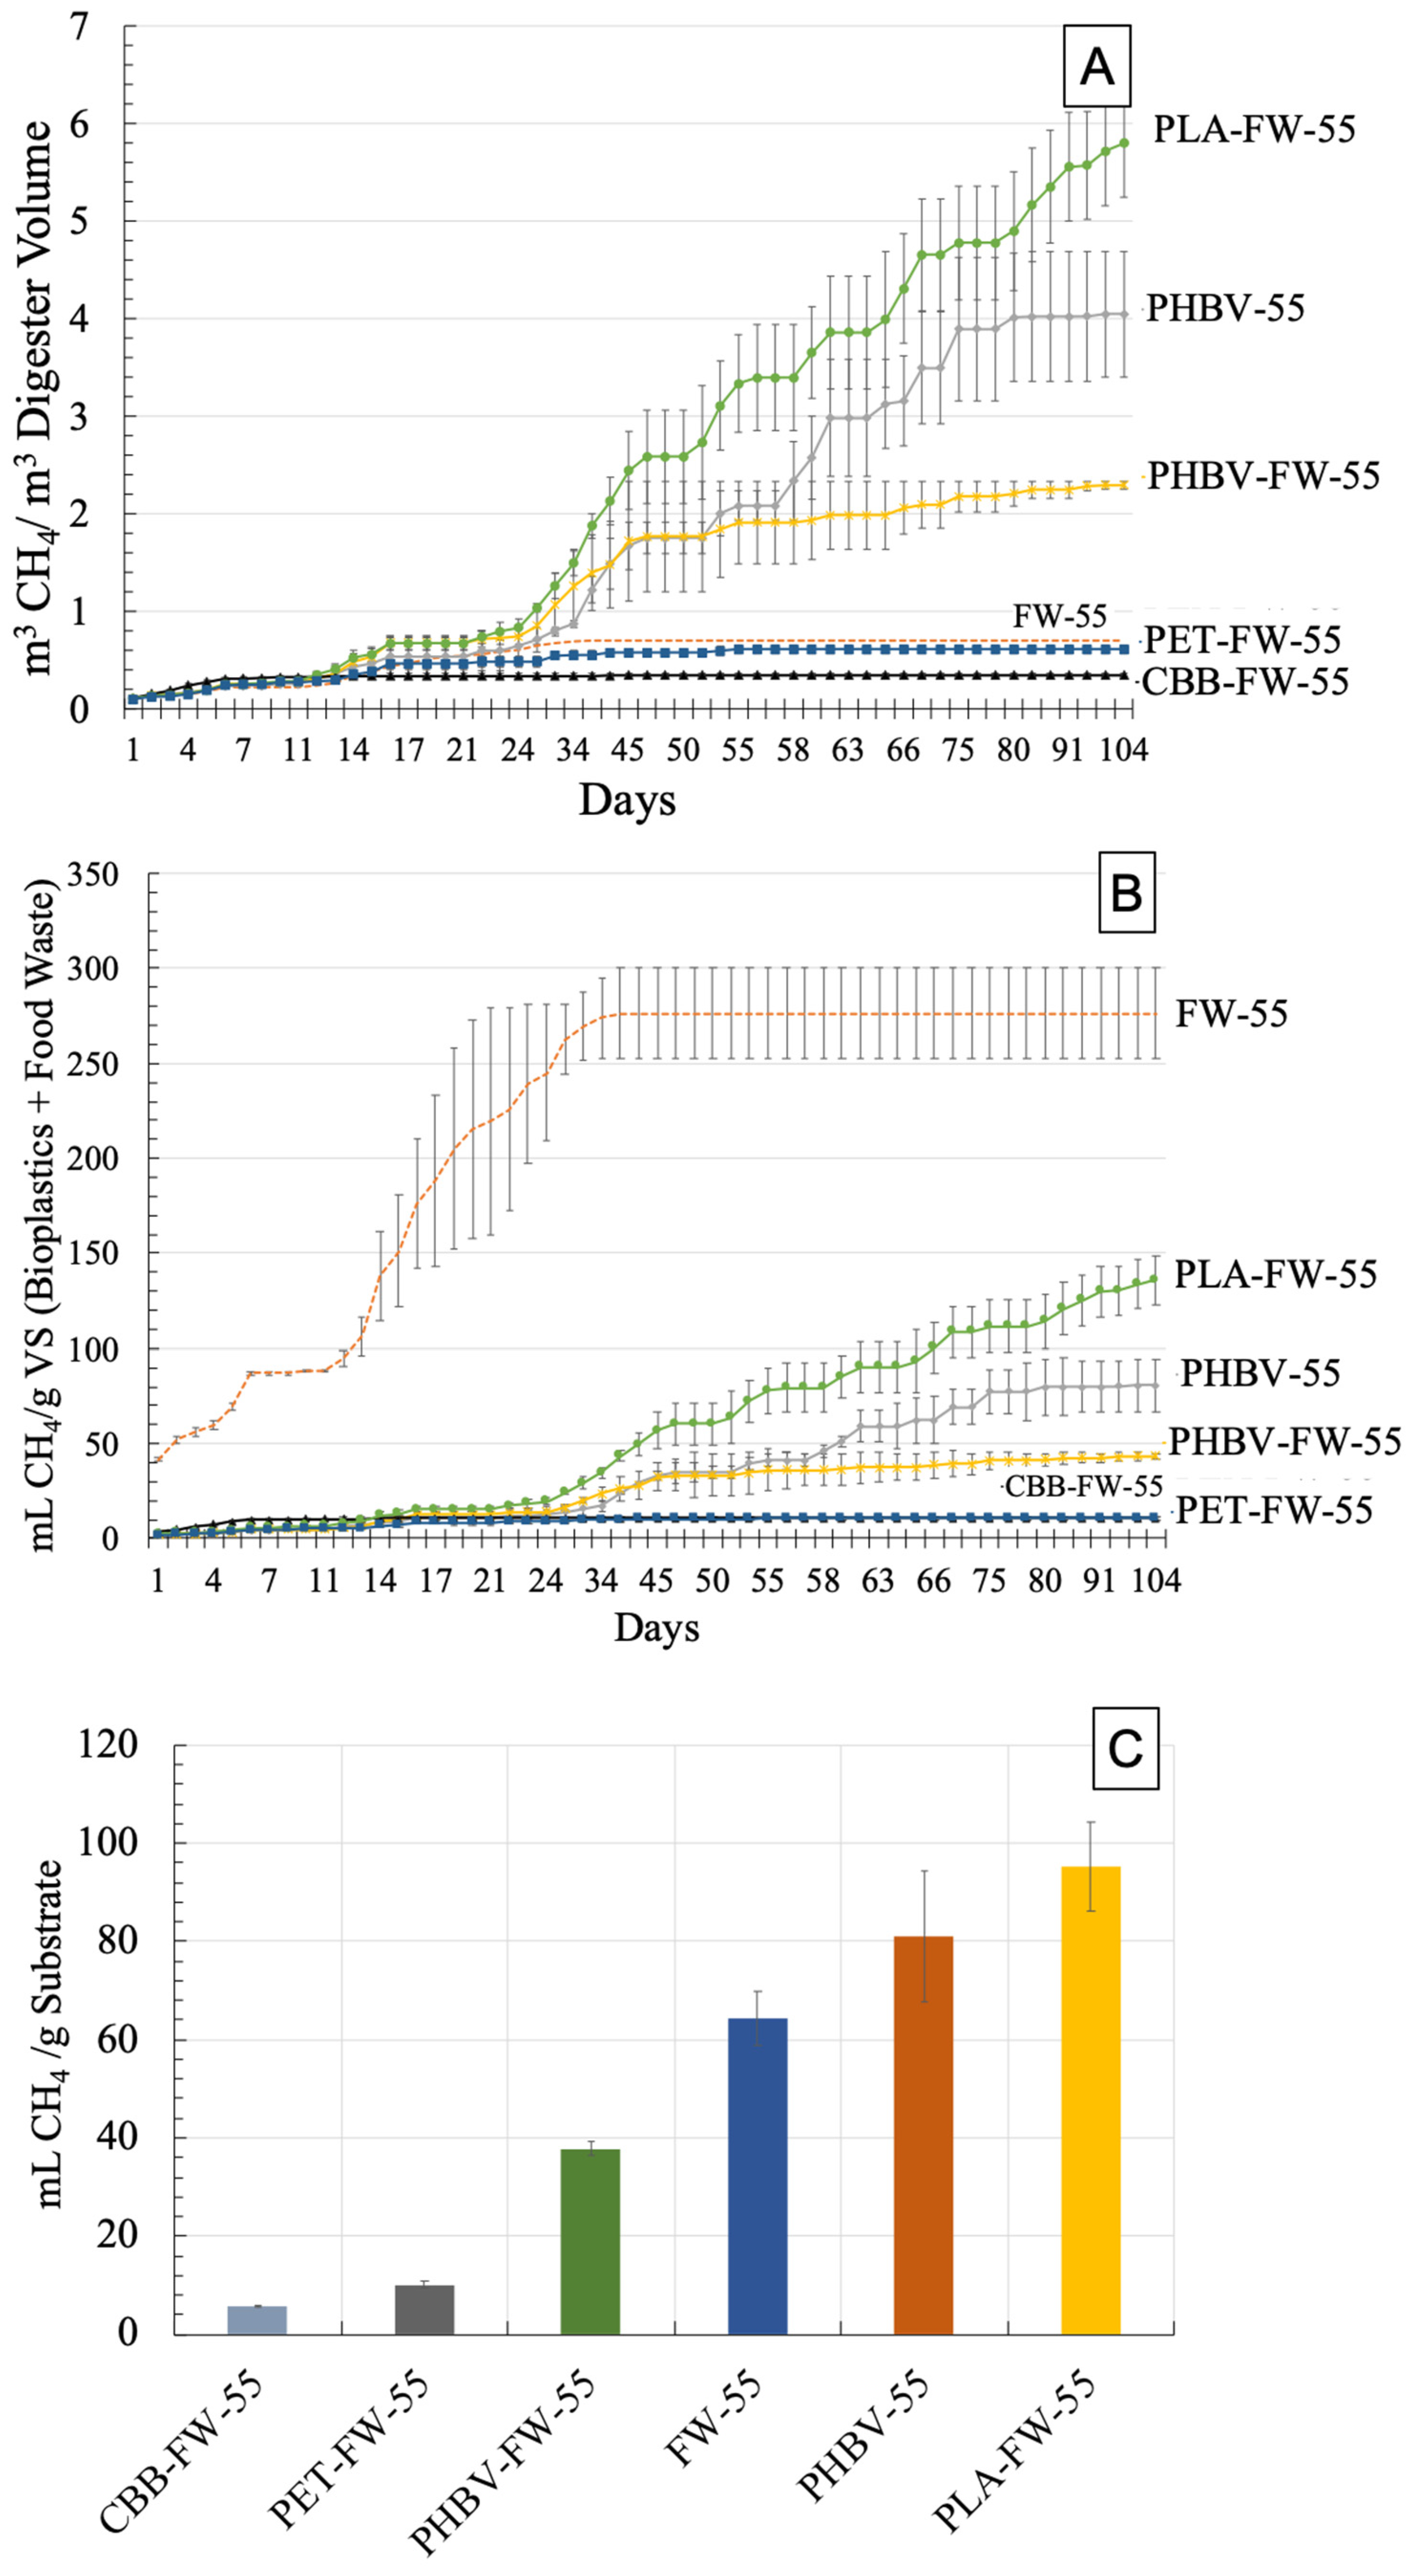
3.1. Cumulative Methane (CH4) Production—Thermophilic Digestion (55 °C)

The cumulative CH4 values normalized by the AD volume indicate how much energy could be produced given a certain reactor size. The results show that after 104 days of digestion, the thermophilic CH4 productions from the FW-55 and PET treatments were 0.700 and 0.61 m3 CH4/m3 digester, respectively (Figure 1). Most bioplastics had more CH4 production than FW-only and PET when normalized by digester volume, with PLA-FW-55 (5.80 m3 CH4/m3), PHBV-FW-55 (2.29 m3 CH4/m3), and PHBV-55 (4.05 m3 CH4/m3) having 848%, 275%, and 562% higher CH4 production, respectively, than the PET treatment (p-value < 0.001, 0.044, and <0.0001, respectively). The CBB-FW-55 treatment produced 0.351 m3 CH4/m3 digester volume, which was 43% less than the PET treatment, but with no significant differences with PET (p-value = 0.98). The results are in agreement with recent research that noted that a cellulosic film bioplastic had lower biogas production compared with PLA [13].
The PHBV-55 treatment produced 479% more CH4 (2.30 m3 CH4/m3 digester) than the FW-55 treatment. The cumulative CH4 production for the PHBV-FW-55 and PLA-FW-55 treatments was significantly higher (p-values of <0.001) than the FW-55 treatment by 229% and 730%, respectively (Figure 1). Anaerobic biodegradability increased through the additional biogas production from bioplastic inclusion [13,24]. Based on the results of the bioplastics tested in this experiment, PLA and PHBV showed more biogas production and more degradation compared with CBB. The lower biogas production from CBB indicates low biodegradability, which might be caused by the capsule being too thick to degrade or due to accumulation of VFAS during the AD process [13,25].
When the CH4 production is normalized by the VS added to each reactor, the results indicate how efficiently the digestion process degrades the organic matter (VS) to energy (CH4). Normalization of CH4 production by the VS of the FW and bioplastic content assumes that all the VS of the bioplastic can be converted to biogas. When normalized by VS in the FW and bioplastic substrates, the FW-only treatment (276 mL CH4/g VS) had more CH4 production than the other six treatments (Figure 1, Table 4). The cumulative CH4 produced by the PLA-FW-55, PHBV-FW-55, and PHBV-55 treatments was 1165%, 303%, and 651% greater than the PET-FW-55 treatment, respectively (p-value < 0.001, 0.596, and 0.04, respectively) (Figure 1, Table 4). The bioplastic treatment that produced the least cumulative CH4 was CBB-FW-55 at 10.6 mL CH4/g VS, which was 1.1% less than the PET-FW-55 treatment (p-value = 1.0).
While cumulative CH4 production was calculated over 104 days, after only 34 days of digestion, the cumulative CH4 production for the FW treatment (274 mL CH4/g VS) was 104–2659% higher than the bioplastic and PET treatments (Table 4). The treatment that had produced the least cumulative CH4 at 34 days was PET-FW-55 at 9.9 mL CH4/g VS. The cumulative CH4 produced at 34 days by the CBB-FW-55, PLA-FW-55, PHBV-FW-55, and PHBV-55 treatments was 8.1%, 84.8%, 138%, and 72% greater than the PET-FW-55 treatment, respectively (Table 4).
The co-digestion of the bioplastics with food waste resulted in lower production of CH4 on a per VS basis (43.2, 10.6, 136, and 10.7 mL CH4/g VS for the PHBV-FW-55, CBB-FW-55, PLA-FW-55, and PET-FW-55 treatments, respectively). However, this is expected as the FW treatment is purely organic material that is efficiently digested [26], while the bioplastic substrates are not as biologically available for degradation as the FW substrate. When the VS content of the bioplastics is included in the total VS normalization, the relative CH4 production decreases due to the limited biodegradation compared with FW. The bioplastic treatments that produced the most cumulative mL CH4/g substrate (PHBV 35/55, PHBV-FW 35/55, and PLA-FW-55) generally had a steady rate of production in comparison with the lower-performing treatments (CBB-FW-55 and PET-FW-55). The CH4 production per g VS was within the expected range for bioplastic digestion (60–282 mL CH4/g VS) in the literature [13,27].
The cumulative CH4 values normalized by gram of substrate included indicate how much energy could be produced from the raw substrate added to the digester. After 104 days of digestion, the CH4 production from the FW-55 treatment and PET were 64.4 and 10.1 mL CH4/g substrate added, respectively (Figure 1). The PHBV-55, PHBV-FW, and PLA-FW treatments had more CH4 production than PET when normalized by gram of substrate included by 541%, 705%, and 847%, respectively (Figure 1). The CBB and PET treatments had the lowest cumulative CH4 values per gram of substrate (5.7 and 10.0 mL CH4/g substrate, respectively), indicating that the substrates were not as effectively converted to CH4 on a weight basis compared with the PLA, PHBV, and FW substrates.
After the first 21 days, the FW-35, FW-55, CBB-FW-55, and PET-FW-55 treatments had all produced more than 80% of their total cumulative CH4. The other bioplastics, PHBV-55, PHBV-FW-55, and PLA-FW-55, had produced 13.2%, 29.5%, and 11.5% of their cumulative CH4, respectively after 21 days of digestion (Table 4). The treatments that had produced > 80% of their cumulative CH4 production were also the two plastic substrates with the lowest cumulative CH4 production (CBB-FW-55 and PET-FW-55). It can be inferred that these two treatments rapidly utilized the FW content in the first 21 days, producing similar cumulative CH4 to the other treatments (15.6 and 8.6 mL CH4/g VS, respectively, compared with 9.7, 11.0, and 10.7 mL CH4/g VS), but the CH4 production largely ceased by Day 21, likely due to the buildup of volatile fatty acids (VFAs). There were no significant differences in the cumulative CH4 production values of the five bioplastic treatments at 55 °C in the first 21 days.

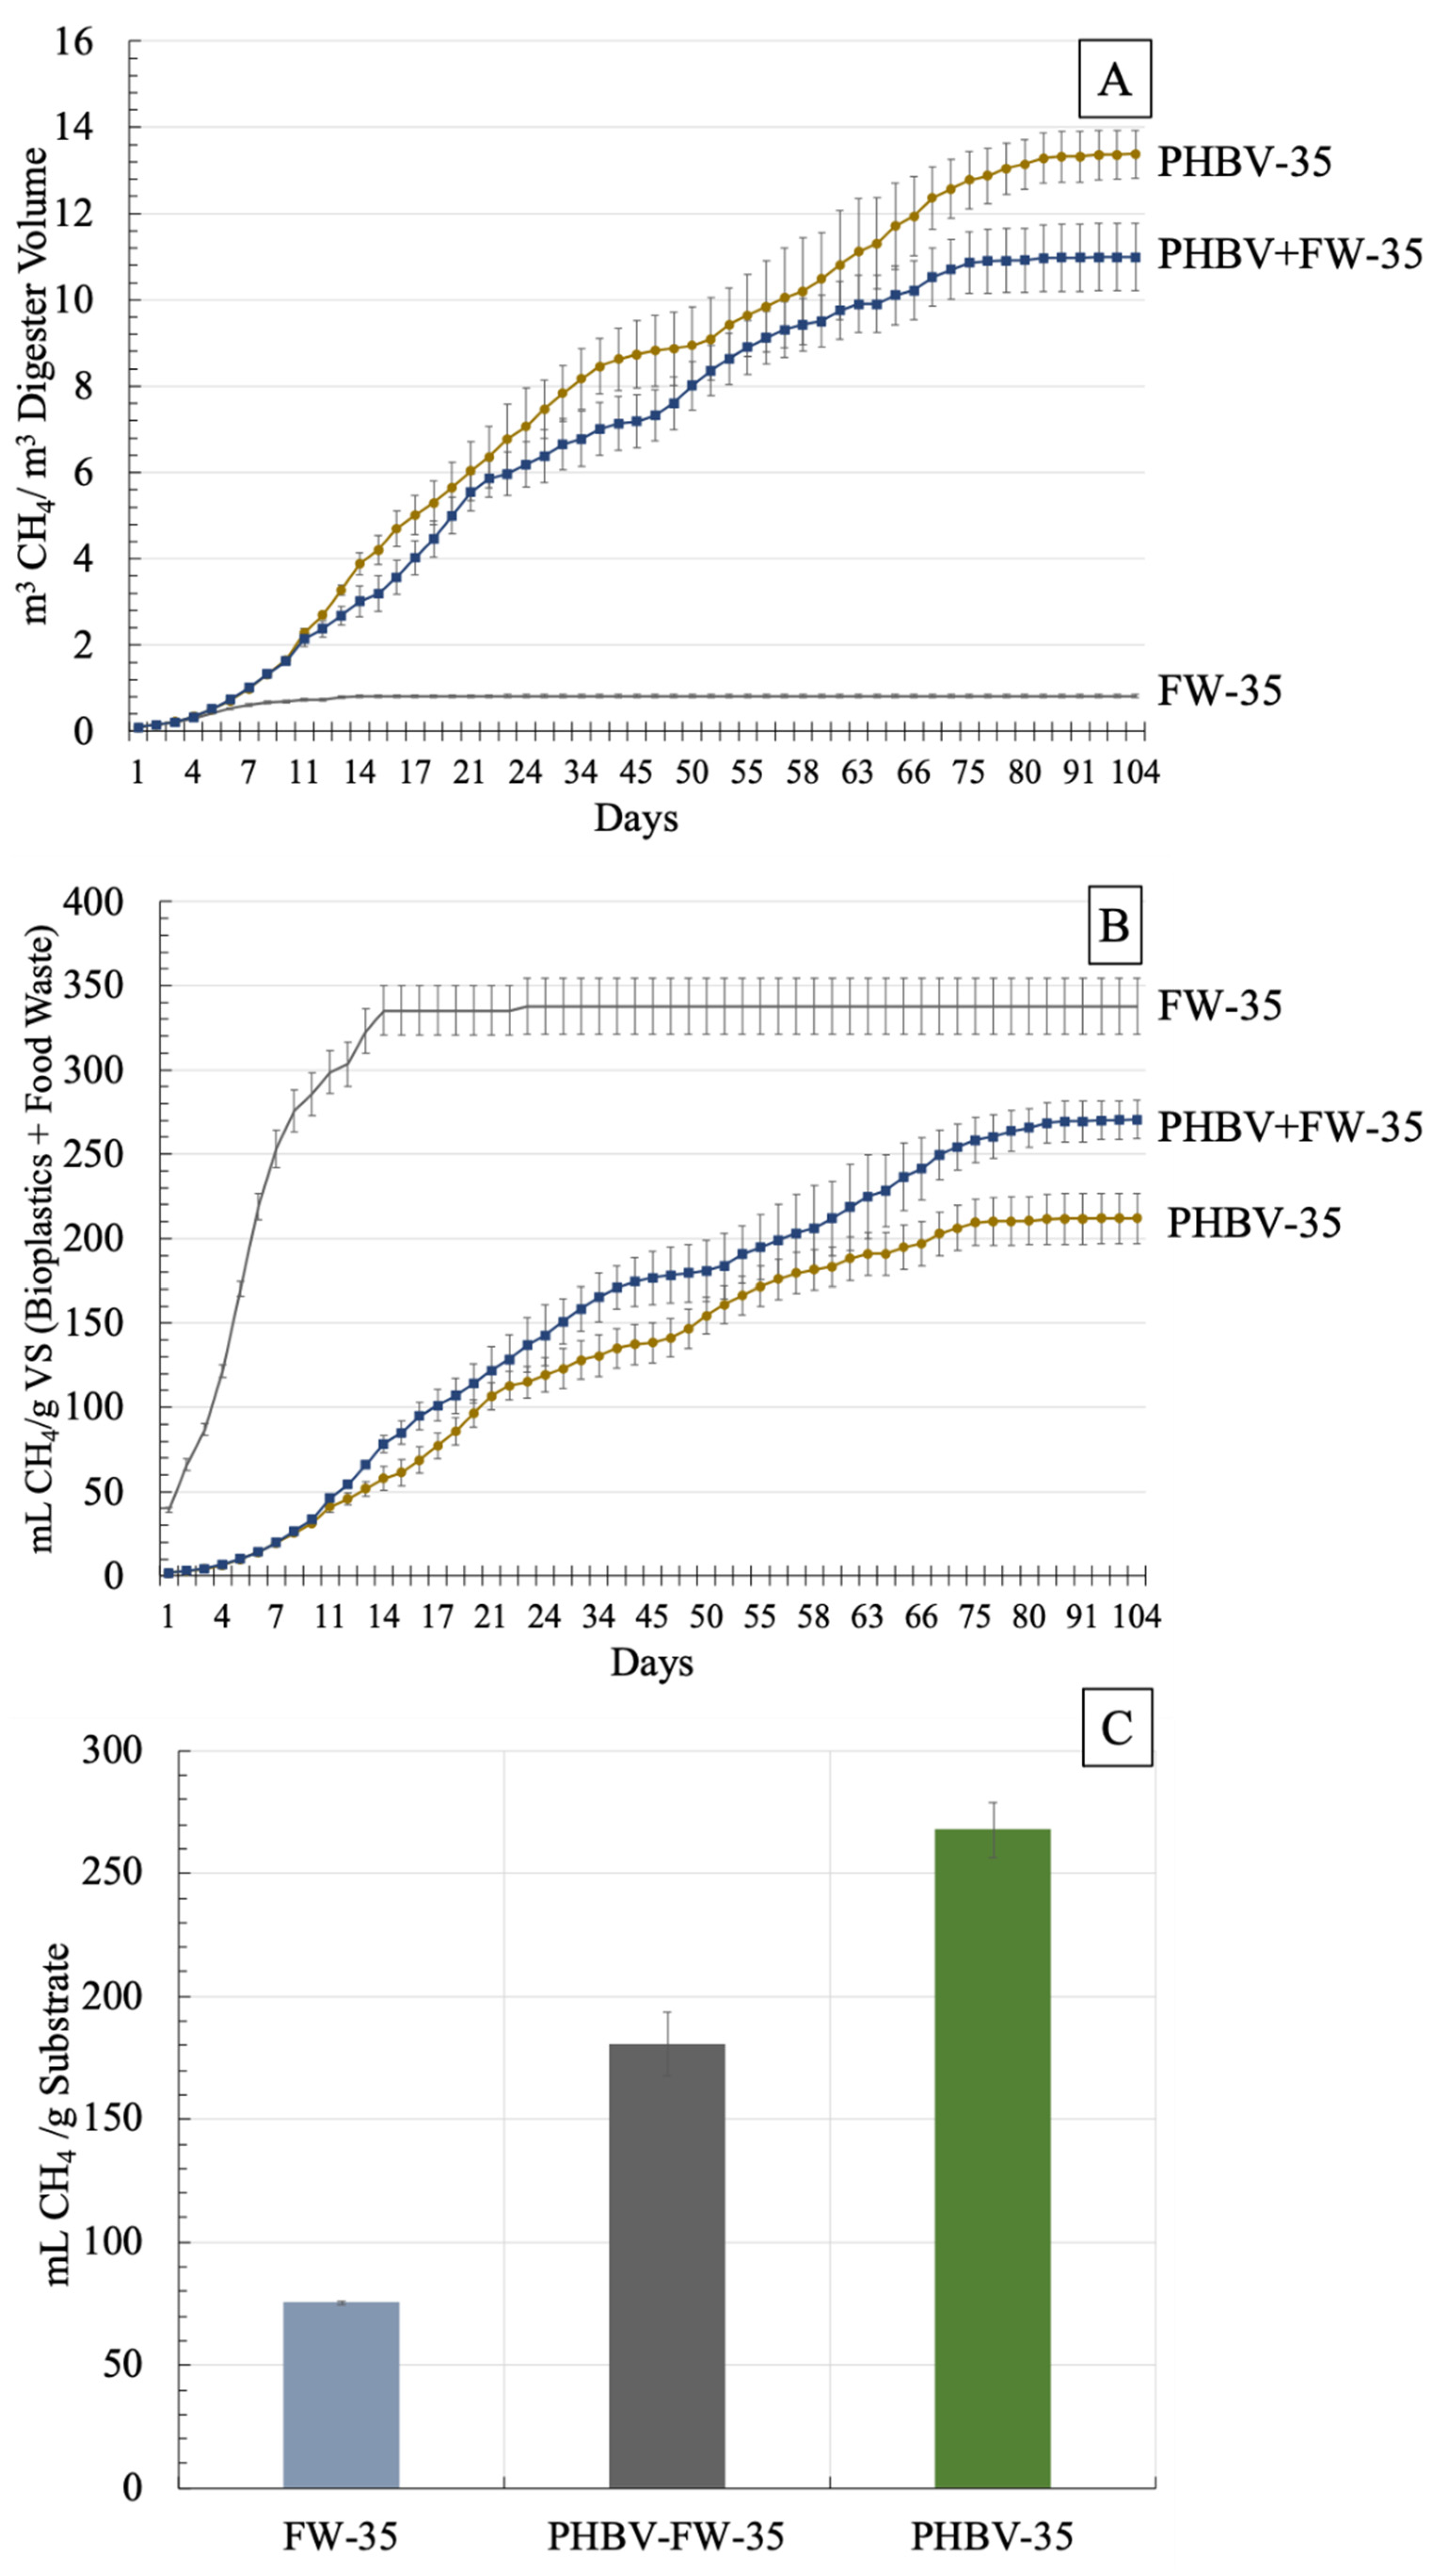
3.2. Cumulative Methane (CH4) Production—Mesophilic Digestion (35 °C)

The CH4 production normalized by AD reactor volume for the FW treatment was 0.82 m3 CH4/m3 digester volume (Figure 2). The PHBV (13.4 m3 CH4/m3) and PHBV-FW-35 (10.9 m3 CH4/m3) treatments produced 1531%, and 1240% more CH4 per digester volume than the FW treatment, respectively (p-values of <0.001) (Figure 2). The PHBV-35 treatment produced 22% more CH4 per digester volume than the PHBV-FW-35 treatment (p-value = 0.036) (Figure 2).
In the AD-35 treatment after 104 days of digestion, the cumulative CH4 production normalized by VS for the FW treatment (338 mL CH4/g VS) was greater than the two PHBV treatments (Figure 2, Table 4). The PHBV treatment without FW produced more cumulative CH4 (271 mL CH4/g VS) than the PHBV treatment FW (212 mL CH4/g VS). While cumulative CH4 production was calculated over 104 days, after only 34 days of digestion, the cumulative CH4 production for the FW treatment (338 mL CH4/g VS) was greater than the two PHBV treatments (Table 5). At Day 34 of digestion, the PHBV-35 treatment produced more cumulative CH4 (165 mL CH4/g VS) than the PHBV-FW-35 treatment (131 mL CH4/g VS) (Figure 1). For the 35 °C experiment, there was no significant difference in the percentage CH4 production or the cumulative CH4 production between the PHBV-35 and PHBV-FW-35 treatments in the first 21 days (p-value = 0.670). When normalized by gram substrate addition, the two 35 °C PHBV treatments, PHBV with and without FW (181 and 267 mL/g substrate added, respectively), were higher than the FW-35 treatment by 139%, and 254%, respectively (Figure 2). A recent study found the theoretical maximum CH4 production at mesophilic conditions (35 °C, 1 atm) to be 660 mL CH4/g PHBV, which was 60% of the theoretical production [28].
The data show more CH4 production under mesophilic conditions from PHBV compared with thermophilic conditions. A recent study found that the type of microorganism affects biodegradation [29]. The availability of microorganisms responsible for PHBV degradation using the mixed inoculum operated at 35 °C could favor bioplastic degradation compared with only thermophilic bacteria operated at higher temperatures (55 °C), which can be a less stable digestion process. Similar results were found during glucose digestion, with mesophilic conditions producing more CH4 than thermophilic conditions [30].

3.3. VFA Concentration during Digestion

Reducing VFA concentrations generally correlate with increasing cumulative CH4 production. In the 55 °C experiment, the only bioplastic treatments with reductions in total VFA concentration were the PLA-FW-55 treatment (46.7% reduction) and the PHBV-FW-55 treatment (53.4% reduction). This correlates with PLA-FW-55 having the highest cumulative CH4 production (95.3 mL CH4/g substrate added) followed by PHBV-FW-55 (37.7 mL CH4/g substrate added) (Figure 1). The CBB-FW-55 treatment had the largest increase in total VFA concentration (from 5405 mg/L to 11,797 mg/L), correlating with CBB-FW-55 producing the smallest amount of cumulative CH4 (5.7 mL CH4/g substrate added) (Figure 1; Table 4 and Table 5). It is worth noting that the CBB-FW-55 substrate had a relatively high initial VFA concentration (5405 mg/L), yet, had low cumulative CH4 production (Figure 1; Table 5). This trend can likely be attributed to the lack of VFA reduction in the CBB-FW-55 treatment during digestion, indicating that the treatment was limited to the acetogenesis stage of digestion, as the methanogens were unable to convert the VFAs into measurable CH4. The CBB-FW had a lower pH (5.2), which is considered inhibiting to methanogens [31]. A recent study found that VFA cumulation in an AD system leads to decreasing pH and results in unstable AD performance and low biogas production [32].
The PET-FW-55 treatment also had a reduction in VFA concentration (77.9%) but did not have a large cumulative CH4 value. This is likely due to the nature of the PET-FW-55 substrate, a petroleum-based plastic that is not suited for abundant biogas production. The VFA reduction in the FW treatment was 78%, which was the highest among all the thermophilic treatments.
On the other hand, the mesophilic treatment showed higher VFAs removal rates at 79.6% reduction for the PHBV-FW-35 treatment and 99% VFA reductions in the PHVBV-35 treatment (Table 5). This implies that the process was more in balance, with the VFAs that were produced being used immediately by the methanogens for CH4 production, without signs of VFA accumulation.

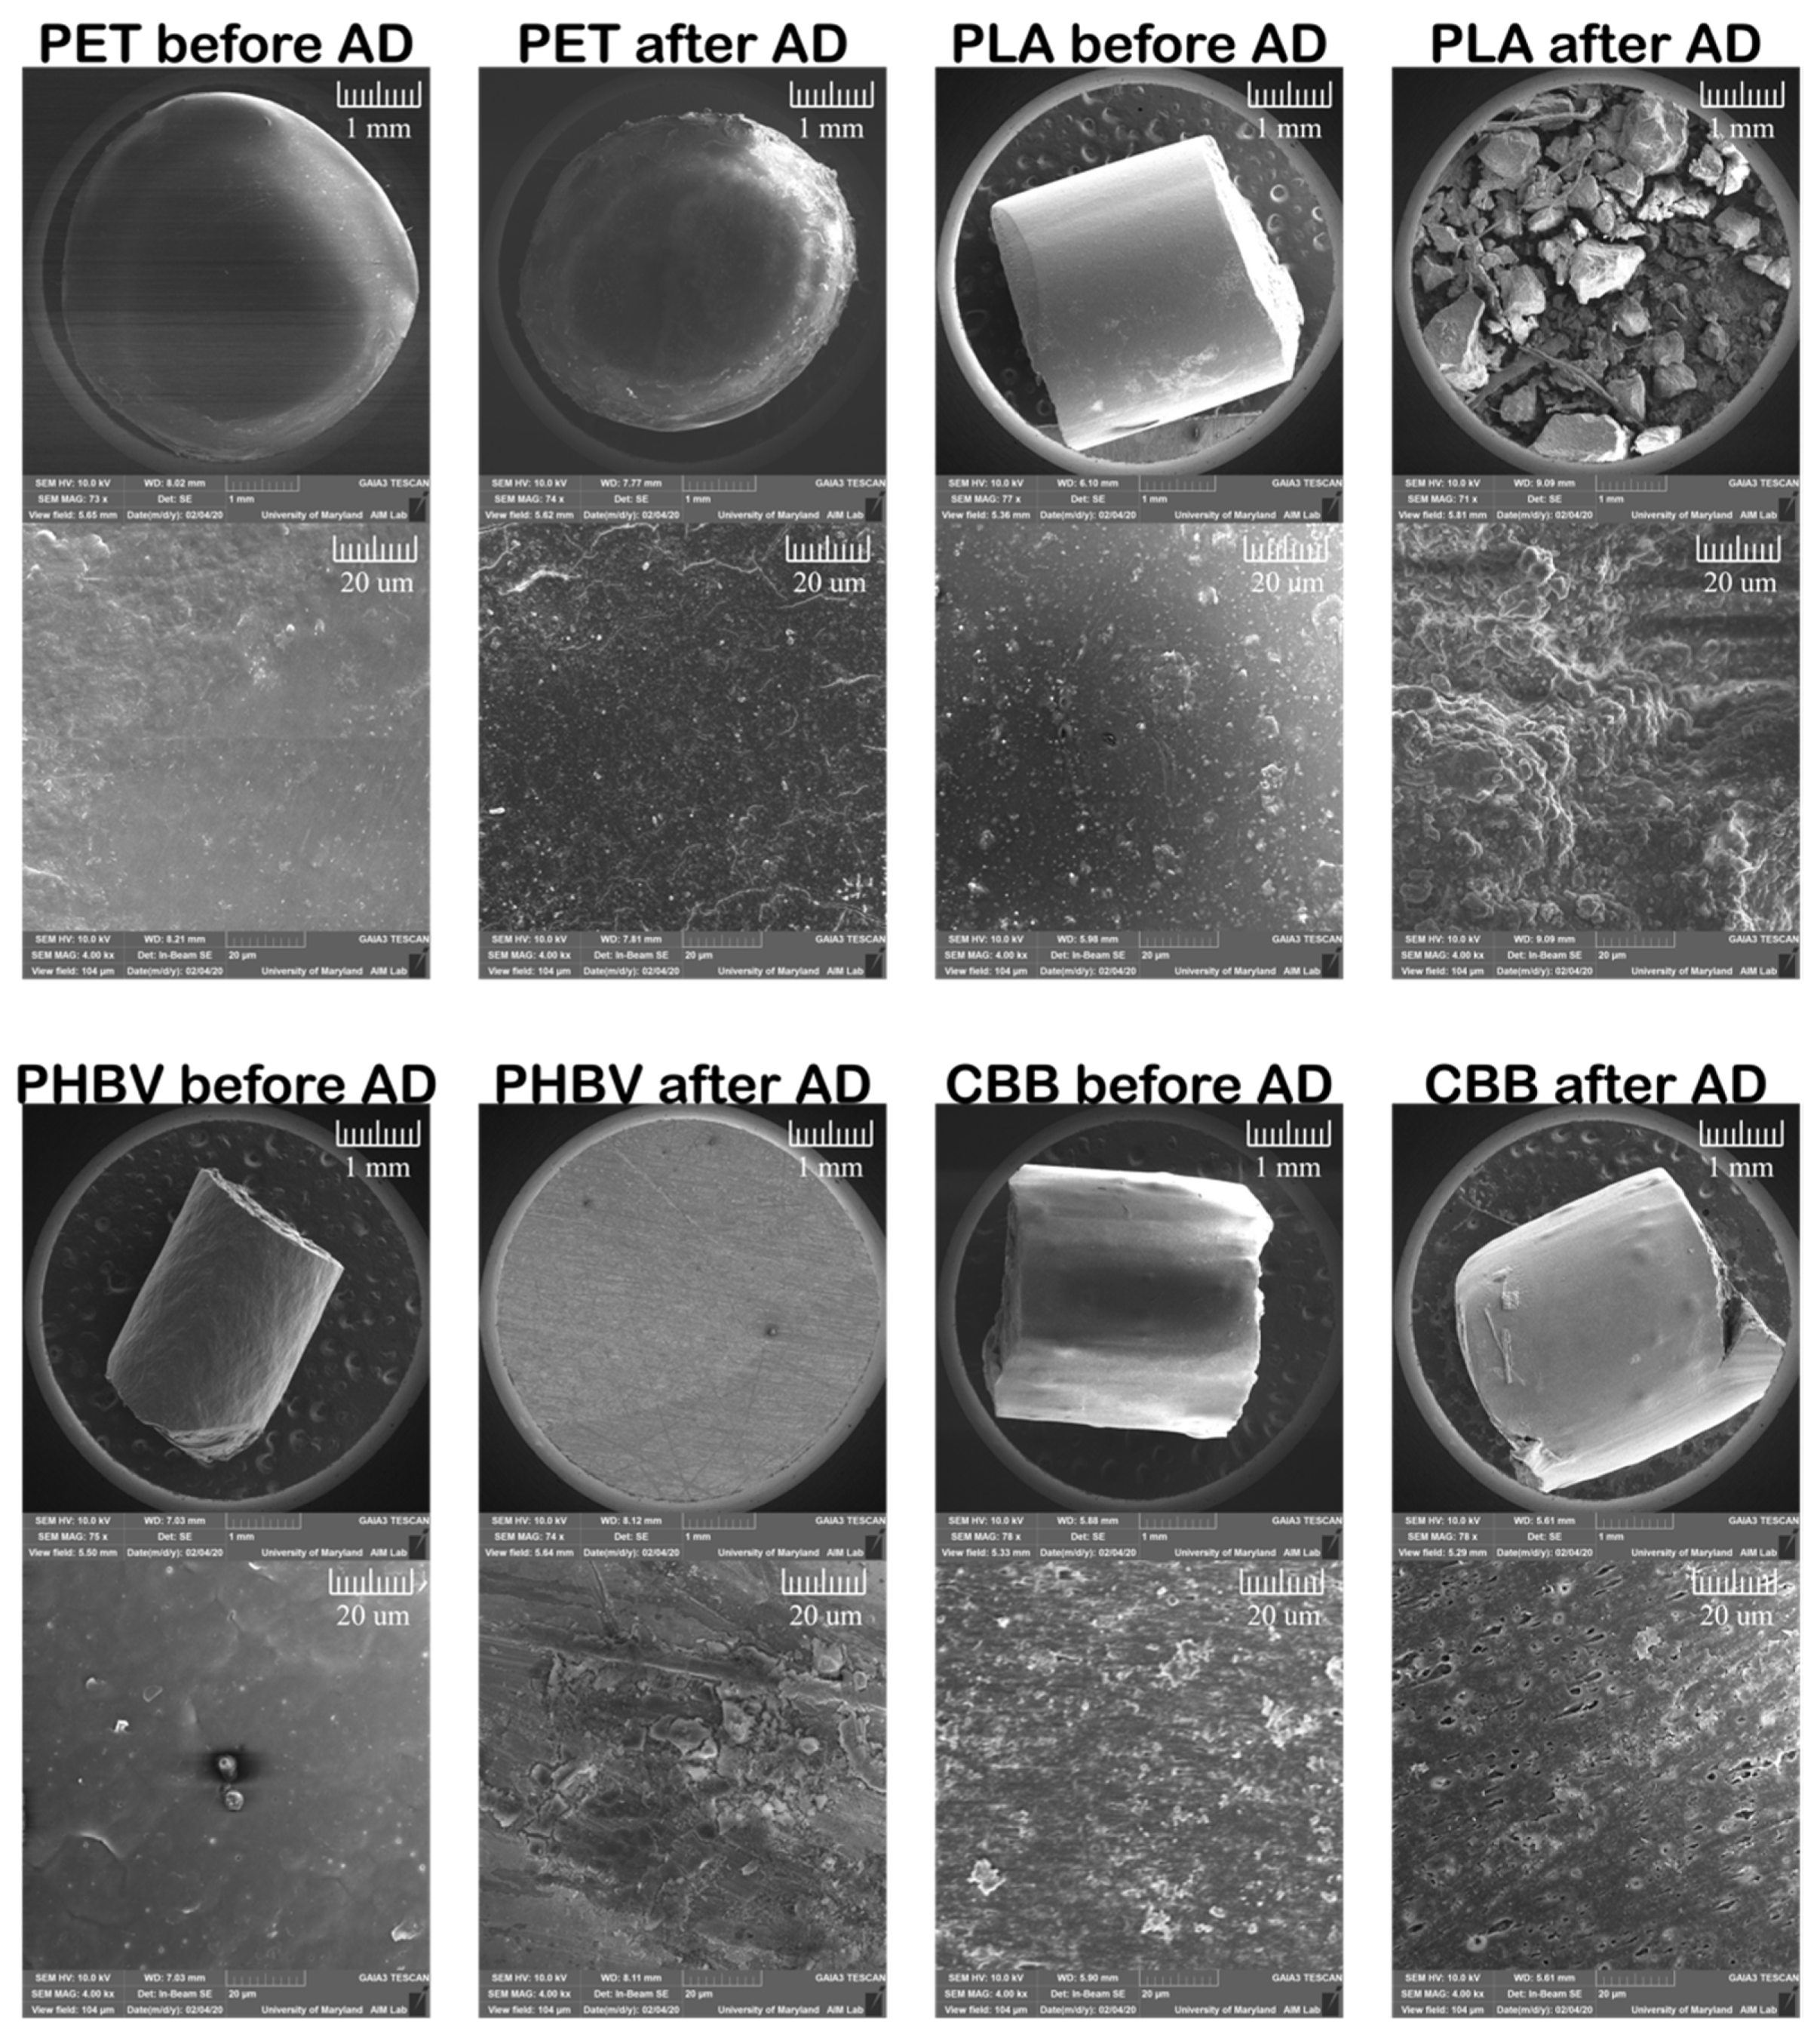
3.4. Scanning Electron Microscopy

Based on the CH4 production data, two types of bioplastics (PLA and BHBV) could produce large amounts of renewable energy during AD degradation. SEM was used to understand the degree of degradation that occurred visually (Figure 3). Before the AD process began, all of the plastic pellets were intact with no noticeable cleavages in the pellets. After 104 days of AD processing, the PET plastic pellet did not have any noticeable degradation. The CBB plastic pellet had a small amount of degradation occurring on one of the sides of the pellet, creating a furrow. There were also noticeable strains and marks on the CBB pellet from digestion. The PLA pellet showed a degradation rate of approximately 80%. The pellet was broken up into many smaller pieces, and the surface of the pellet was significantly altered by AD, leaving many striations and breaks in the surface of the pellet. These results are in agreement with research that studied PLA’s biodegradability under thermophilic conditions, which found similar degradation within 90 days of AD [27].
The PHBV pellet was digested to the point where pieces of the pellet were not recoverable. The SEM image of the PHBV pellet after thermophilic digestion showed no visual pieces and complete digestion of the bioplastic pellet. Bátori et al. (2018), similarly, found higher degradation with PHBV compared with PLA and CBB under thermophilic conditions [29].
However, a previous study found that 60% mineralization was achieved within 100 days under mesophilic conditions, with only 40 days needed to achieve 60% mineralization under thermophilic conditions, with the conclusion that biodegradation occurs more quickly at higher temperatures [33,34]. However, the research in the current study found full degradation of PHBV under both mesophilic and thermophilic conditions after 104 days of digestion. Recent studies found that the bioplastic degradation rate can vary based on the hydraulic retention time (HRT), with PHBV degraded within the HRT range of most digesters (20–30 days), while PLA takes longer to be fully degraded [29]. The microbial community responsible for the degradation of bioplastics can be found in both thermophilic and mesophilic conditions, but the availability of some bacteria, such as Amycolatopsis sp. and Bacillus brevis, has been shown to increase the degradation of PLA [13,29,35,36]. One study found a low rate (10%) of PLA degradation using an AD system [37], while another study achieved 60% degradation of PLA powder in 30 days and approximately 90% degradation in 60 days using adapted thermophilic sludge [34].
Our results show more biodegradation compared with a previous study, which found less than 50% biodegradation during 35 days of AD [13]. Previous research has shown that composting of PLA could take up to six months to show 80% degradation [24], with Hobbs et al. (2019) showing 54% degradation of PLA with food waste without pretreatment during a BMP treatment and 97–99% degradation with an alkaline pre-treatment [35]. However, the SEM results of the current study show better degradation (70–100%) using thermophilic AD after 104 days of digestion (less than 3.5 months).

4. Conclusions

Anaerobic digestion and degradation of PHBV and PLA bioplastics were shown to be viable under thermophilic conditions, with more effective digestion of PHBV under mesophilic conditions. It can be hypothesized that the PHBV treatments at 55 °C were not able to fully digest the substrate plastic due to the rapid increase in VFAs in thermophilic conditions. The CH4 production was most efficient with the PLA bioplastic as the substrate (highest mL CH4/g VS), with the highest energy production. The PHBV polymer also had high CH4 production, with 271 mL CH4/g VS, which shows the viability of this substrate for AD production. The PLA and PHBV treatments all produced more CH4 than the petroleum-based plastic, PET.
Both mesophilic and thermophilic digestion were found to be viable energy production and degradation options for the PHBV and PLA bioplastics in the presence of AD inoculum, with or without FW inclusion. The PLA and PHBV substrates were noticeably degraded after digestion, as shown in the EDS-SEM images, while the CBB and PET substrates showed only minimal signs of degradation after 104 days of digestion. The potential application of AD processes for processing of bioplastic substrates could be seen as a value-added product to assist in the transition from petroleum-based plastics to bioplastics, such as PHBV or PLA.

Author Contributions

Conceptualization, B.N., E.K., A.H. and S.L.; methodology, B.N., E.K., A.H. and S.L.; validation, B.N. and E.K.; formal analysis, B.N., E.K. and A.H.; investigation, B.N. and E.K.; resources, S.L.; data curation, B.N. and E.K.; writing—original draft preparation: B.N., A.H. and S.L.; writing—review and editing, B.N., E.K., A.H. and S.L.; visualization: B.N., A.H. and S.L.; supervision: A.H. and S.L.; project administration, A.H. and S.L. All authors have read and agreed to the published version of the manuscript.

Funding

This research was funded by the U.S. Department of Agriculture (USDA) NIFA Hatch#1014496.

Institutional Review Board Statement

Not applicable.

Informed Consent Statement

Not applicable.

Data Availability Statement

Not applicable.

Acknowledgments

A special thank you to the University of Maryland Bioenergy and Bioprocessing Technology Laboratory members for support during the experiment, and thanks to Poolesville High School in Maryland, (USA) for their support.

Conflicts of Interest

The authors declare no conflict of interest.

References

  1. Masnadi, M.S.; El-Houjeiri, H.M.; Schunack, D.; Li, Y.; Englander, J.G.; Badahdah, A.; Monfort, J.-C.; Anderson, J.E.; Wallington, T.J.; Bergerson, J.A.; et al. Global carbon intensity of crude oil production. Science 2018, 361, 851–853. [Google Scholar] [CrossRef]
  2. Tokiwa, Y.; Calabia, B.P.; Ugwu, C.U.; Aiba, S. Biodegradability of Plastics. Int. J. Mol. Sci. 2009, 10, 3722–3742. [Google Scholar] [CrossRef]
  3. Lau, W.W.Y.; Shiran, Y.; Bailey, R.M.; Cook, E.; Stuchtey, M.R.; Koskella, J.; Velis, C.A.; Godfrey, L.; Boucher, J.; Murphy, M.B.; et al. Evaluating scenarios toward zero plastic pollution. Science 2020, 369, 1455–1461. [Google Scholar] [CrossRef] [PubMed]
  4. Global Market for Bioplastics to Grow by 20 Percent—European Bioplastics e.V. Available online: https://www.european-bioplastics.org/global-market-for-bioplastics-to-grow-by-20-percent/ (accessed on 17 August 2021).
  5. Zhao, X.; Ji, K.; Kurt, K.; Cornish, K.; Vodovotz, Y. Optimal mechanical properties of biodegradable natural rubber-toughened PHBV bioplastics intended for food packaging applications. Food Packag. Shelf Life 2019, 21, 100348. [Google Scholar] [CrossRef]
  6. Calabro’, P.S.; Folino, A.; Fazzino, F.; Komilis, D. Preliminary evaluation of the anaerobic biodegradability of three biobased materials used for the production of disposable plastics. J. Hazard. Mater. 2020, 390, 121653. [Google Scholar] [CrossRef] [PubMed]
  7. Yeo, J.C.C.; Muiruri, J.K.; Thitsartarn, W.; Li, Z.; He, C. Recent advances in the development of biodegradable PHB-based toughening materials: Approaches, advantages and applications. Mater. Sci. Eng. C 2018, 92, 1092–1116. [Google Scholar] [CrossRef]
  8. Basnett, P.; Ravi, S.; Roy, I. Natural bacterial biodegradable medical polymers: Polyhydroxyalkanoates. Sci. Princ. Biodegrad. Bioresorbable Med. Polym. Mater. Prop. 2017, 257–277. Available online: https://www.sciencedirect.com/science/article/pii/B9780081003725000088?via%3Dihub (accessed on 17 August 2021).
  9. Dubey, S.P.; Thakur, V.K.; Krishnaswamy, S.; Abhyankar, H.A.; Marchante, V.; Brighton, J.L. Progress in environmental-friendly polymer nanocomposite material from PLA: Synthesis, processing and applications. Vacuum 2017, 146, 655–663. [Google Scholar] [CrossRef] [Green Version]
  10. Simmons, H.; Tiwary, P.; Colwell, J.E.; Kontopoulou, M. Improvements in the crystallinity and mechanical properties of PLA by nucleation and annealing. Polym. Degrad. Stab. 2019, 166, 248–257. [Google Scholar] [CrossRef]
  11. Klemm, D.; Philipp, B.; Heinze, T.; Heinze, U.; Wagenknect, W. Comprehensive cellulose chemistry. Fundam. Anal. Methods 1999, 3. [Google Scholar] [CrossRef]
  12. Karan, H.; Funk, C.; Grabert, M.; Oey, M.; Hankamer, B. Green Bioplastics as Part of a Circular Bioeconomy. Trends Plant Sci. 2019, 24, 237–249. [Google Scholar] [CrossRef]
  13. Shrestha, A.; van-Eerten Jansen, M.C.A.A.; Acharya, B. Biodegradation of Bioplastic Using Anaerobic Digestion at Retention Time as per Industrial Biogas Plant and International Norms. Sustainability 2020, 12, 4231. [Google Scholar] [CrossRef]
  14. ENMAT. Technical Data Sheet & Processing Guide. ENMAT PHBV Resin (Y1000P). 2011. Available online: http://www.tianan-enmat.com/pdf/TDS_Y1000P_Dec2011.pdf (accessed on 1 March 2019).
  15. Biograde C 9550 WH › FKuR. Available online: https://fkur.com/en/brands/biograde-3/biograde-c-9550/ (accessed on 17 August 2021).
  16. Buzby, J.C.; Farah-Wells, H.; Hyman, J. The Estimated Amount, Value, and Calories of Postharvest Food Losses at the Retail and Consumer Levels in the United States. Food Loss U. S. Sel. Anal. 2014, 1–42. Available online: https://www.ers.usda.gov/publications/pub-details/?pubid=43836 (accessed on 17 August 2021). [CrossRef] [Green Version]
  17. Moody, L.; Burns, R.; Wu-Haan, W.; Spajic, R. Use of biochemical methane potential (BMP) assays for predicting and enhancing anaerobic digester performance. In Proceedings of the 44th Croatian and the 4th International Symposium on Agriculture, Opatija, Croatia, 16–20 February 2009. [Google Scholar]
  18. Koch, K.; Hafner, S.D.; Weinrich, S.; Astals, S.; Holliger, C. Power and Limitations of Biochemical Methane Potential (BMP) Tests. Front. Energy Res. 2020, 8, 63. [Google Scholar] [CrossRef]
  19. Holliger, C.; Alves, M.; Andrade, D.; Angelidaki, I.; Astals, S.; Baier, U.; Bougrier, C.; Buffière, P.; Carballa, M.; De Wilde, V.; et al. Towards a standardization of biomethane potential tests. Water Sci. Technol. 2016, 74, 2515–2522. [Google Scholar] [CrossRef]
  20. Reungsang, A.; Pattra, S.; Sittijunda, S. Optimization of Key Factors Affecting Methane Production from Acidic Effluent Coming from the Sugarcane Juice Hydrogen Fermentation Process. Energies 2012, 5, 4746–4757. [Google Scholar] [CrossRef] [Green Version]
  21. APHA Standard Methods for the Examination of Water and Wastewater, 21st ed.; American Public Health Association: Washington, DC, USA, 2005.
  22. Lansing, S.; Hülsemann, B.; Choudhury, A.; Schueler, J.; Lisboa, M.S.; Oechsner, H. Food waste co-digestion in Germany and the United States: From lab to full-scale systems. Resour. Conserv. Recycl. 2019, 148, 104–113. [Google Scholar] [CrossRef]
  23. Yuan, Q.; Sparling, R.; Oleszkiewicz, J.A. VFA generation from waste activated sludge: Effect of temperature and mixing. Chemosphere 2011, 82, 603–607. [Google Scholar] [CrossRef]
  24. Luo, Y.; Lin, Z.; Guo, G. Biodegradation assessment of poly (lactic acid) filled with functionalized titania nanoparticles (PLA/TiO 2) under compost conditions. Nanoscale Res. Lett. 2019, 14, 56. [Google Scholar] [CrossRef] [Green Version]
  25. Kale, G.; Auras, R.; Singh, S.P.; Narayan, R. Biodegradability of polylactide bottles in real and simulated composting conditions. Polym. Test. 2007, 26, 1049–1061. [Google Scholar] [CrossRef]
  26. Paritosh, K.; Kushwaha, S.K.; Yadav, M.; Pareek, N.; Chawade, A.; Vivekanand, V. Food Waste to Energy: An Overview of Sustainable Approaches for Food Waste Management and Nutrient Recycling. Biomed Res. Int. 2017, 2017, 2370927. [Google Scholar] [CrossRef]
  27. Massardier-Nageotte, V.; Pestre, C.; Cruard-Pradet, T.; Bayard, R. Aerobic and anaerobic biodegradability of polymer films and physico-chemical characterization. Polym. Degrad. Stab. 2006, 91, 620–627. [Google Scholar] [CrossRef]
  28. Benn, N.; Zitomer, D. Pretreatment and anaerobic co-digestion of selected PHB and PLA bioplastics. Front. Environ. Sci. 2018, 5, 93. [Google Scholar] [CrossRef] [Green Version]
  29. Bátori, V.; Åkesson, D.; Zamani, A.; Taherzadeh, M.J.; Horváth, I.S. Anaerobic degradation of bioplastics: A review. Waste Manag. 2018, 80, 406–413. [Google Scholar] [CrossRef]
  30. Gallert, C.; Winter, J. Mesophilic and thermophilic anaerobic digestion of source-sorted organic wastes: Effect of ammonia on glucose degradation and methane production. Appl. Microbiol. Biotechnol. 1997, 48, 405–410. [Google Scholar] [CrossRef]
  31. Eryildiz, B.; Lukitawesa; Taherzadeh, M.J. Effect of pH, substrate loading, oxygen, and methanogens inhibitors on volatile fatty acid (VFA) production from citrus waste by anaerobic digestion. Bioresour. Technol. 2020, 302, 122800. [Google Scholar] [CrossRef] [PubMed]
  32. Park, J.-G.; Lee, B.; Jo, S.-Y.; Lee, J.-S.; Jun, H.-B. Control of accumulated volatile fatty acids by recycling nitrified effluent. J. Environ. Health Sci. Eng. 2018, 16, 19–25. [Google Scholar] [CrossRef] [PubMed]
  33. Shin, P.K.; Kim, M.H.; Kim, J.M. Biodegradability of degradable plastics exposed to anaerobic digested sludge and simulated landfill conditions. J. Environ. Polym. Degrad. 1997, 5, 33–39. [Google Scholar]
  34. Yagi, H.; Ninomiya, F.; Funabashi, M.; Kunioka, M. Anaerobic biodegradation tests of poly (lactic acid) under mesophilic and thermophilic conditions using a new evaluation system for methane fermentation in anaerobic sludge. Int. J. Mol. Sci. 2009, 10, 3824–3835. [Google Scholar] [CrossRef] [Green Version]
  35. Tomita, K.; Kuroki, Y.; Nagai, K. Isolation of thermophiles degrading poly (L-lactic acid). J. Biosci. Bioeng. 1999, 87, 752–755. [Google Scholar] [CrossRef]
  36. Pranamuda, H.; Tokiwa, Y.; Tanaka, H. Polylactide degradation by an Amycolatopsis sp. Appl. Environ. Microbiol. 1997, 63, 1637–1640. [Google Scholar] [CrossRef] [Green Version]
  37. Kale, G.; Kijchavengkul, T.; Auras, R.; Rubino, M.; Selke, S.E.; Singh, S.P. Compostability of bioplastic packaging materials: An overview. Macromol. Biosci. 2007, 7, 255–277. [Google Scholar] [CrossRef] [PubMed]
Figure 1. Cumulative methane (CH4) production values from 104 days of thermophilic digestion (55 °C) of food waste (FW), bioplastics (polyhydroxybutyrate-valerate (PHBV), polylactide (PLA), cellulose-based bioplastic (CBB)), and polyethylene terephthalate (PET) normalized by the volume of the digester reactor shown in (A), normalized by the volatile solids (VS) of food waste and plastic inclusion shown in (B), and normalized by the quantity of substrate addition shown in (C).
Sustainability 13 13295 g001
Figure 2. The cumulative methane (CH4) production values from 104 days of mesophilic digestion (35 °C) of food waste (FW) and (polyhydroxybutyrate-valerate (PHBV) bioplastic normalized by the volume of the digester reactor shown in (A), normalized by volatile solids (VS) of FW and plastic inclusion shown in (B), and normalized by the quantity of substrate addition shown in (C).
Sustainability 13 13295 g002
Figure 3. Energy Dispersive Spectroscopy imaging using a scanning electron microscope showing the four plastics before and after 104 days of thermophilic anaerobic digestion.
Sustainability 13 13295 g003
Table 1. Food waste (FW) mixture and percent inclusion of each food waste.
Food TypeFood Waste (FW) Added
(g)
Inclusion in Mixture
(%)
Potato24619.8
White Bread13210.7
Apple94.57.62
Banana56.74.57
Chicken75.66.10
Pork75.66.10
Mixed Vegetables24619.8
Cheese56.74.57
Cooked Rice37.83.05
Water21917.7
Table 2. Experimental design detailing the quantity of inoculum, food waste, and plastics ((polyhydroxybutyrate-valerate (PHBV), polylactide (PLA), cellulose-based bioplastic (CBB), and polyethylene terephthalate (PET)) added to each triplicate anaerobic digestion reactor.
TreatmentInoculum (g)Food Waste (g)PHBV (g)CBB (g)PLA (g)PET (g)
Inoculum-35147.8300000
FW-35147.832.170000
PHBV-35147.83010000
PHBV-FW-35147.832.1710000
Inoculum-55147.8300000
FW-55147.832.170000
PHBV-55147.83010000
PHBV-FW-55147.832.1710000
CBB-FW-55147.832.1701000
PLA-FW-55147.832.1700100
PET-FW-55147.832.1700010
Table 3. Initial concentrations of total solids (TS), volatile solids (VS), and pH of the food waste (FW) substrate, inoculum, and plastics (polyhydroxybutyrate-valerate (PHBV), polylactide (PLA), cellulose-based bioplastic (CBB), and polyethylene terephthalate (PET)) for each triplicate treatment prior to anaerobic digestion. Average values are given with the standard error.
Pre-Digestion Characteristics for in Each Treatment Reactor
TreatmentTS
(g/kg)
VS
(% TS)
pH
Inoculum9.70 ± 0.3567.3 ± 0.57.52 ± 0.00
FW12.9 ± 0.074.6 ± 0.07.53 ± 0.00
PHBV72.2 ± 0.095.3 ± 0.07.55 ± 0.01
PHBV + FW74.4 ± 0.095.3 ± 0.07.60 ± 0.02
CBB + FW72.1 ± 0.061.1 ± 0.07.57 ± 0.00
PLA + FW74.4 ± 0.079.0 ± 0.27.55 ± 0.02
PET + FW74.6 ± 0.095.7 ± 0.07.58 ± 0.01
Table 4. Cumulative CH4 production in mL CH4/g VS of food waste (FW), bioplastics (polyhydroxybutyrate-valerate (PHBV), polylactide (PLA), cellulose-based bioplastic (CBB)), and polyethylene terephthalate (PET) during the 104-day digestion period by discrete time periods, with the percent of the cumulative CH4 production shown in parentheses for each of the five time points in the 104-day digestion period. Average values are given with the standard error.
TreatmentCumulative CH4 (mL CH4/g VS of FW + BP) and (% of Total CH4 Production)
11 Days21 Days34 Days51 Days104 Days
FW-5588.7 ± 40 (32.1%)220 ± 60 (80.0%)274 ± 21 (99.1%)276 ± 24
(100%)
276 ± 24 (100%)
PHBV-554.9 ± 0.1
(6.1%)
10.6 ± 3.9 (13.2%)17.1 ± 2.6 (21.2%)34.7 ± 3.3
(43.1%)
80.5 ± 13 (100%)
PHBV-FW-555.0 ± 0.1
(11.6%)
12.8 ± 1.3 (29.5%)23.6 ± 3.6 (54.5%)33.4 ± 11
(77.2%)
43.3 ± 1.2 (100%)
CBB-FW-5510.2 ± 0.5 (95.5%)10.7 ± 0.7 (99.8%)10.7 ± 0.7 (100%)10.7 ± 0.8
(100%)
10.7 ± 0.8 (100%)
PLA-FW-556.5 ± 0.3
(4.8%)
15.6 ± 1.8 (11.5%)34.5 ± 2.9 (25.4%)63.8 ± 14
(47.0%)
136 ± 13 (100%)
PET-FW-555.0 ± 0.2
(46.9%)
8.6 ± 1.2 (80.5%)9.9 ± 0.9 (92.7%)10.3 ± 0.8
(96.1%)
10.7 ± 0.9 (100%)
FW-35299 ± 13
(88.4%)
335 ± 15 (99.2%)338 ± 17 (100%)338 ± 17
(100%)
338 ± 17 (100%)
PHBV-3546.0 ± 1.9 (17.0%)122 ± 14 (45.1%)165 ± 14 (61.1%)184 ± 19
(67.9%)
271 ± 11 (100%)
PHBV-FW-3541.2 ± 3.4 (19.4%)107 ± 8.3 (50.3%)131 ± 13 (61.6%)161 ± 11
(76.0%)
212 ± 15 (100%)
Table 5. Pre- and post-BMP concentrations of VFAs, and the pH of the of the food waste (FW) substrate and plastics (polyhydroxybutyrate-valerate (PHBV), polylactide (PLA), cellulose-based bioplastic (CBB), and polyethylene terephthalate (PET)). Average values are given with the standard error.
Pre-BMP
TreatmentpHAcetic Acid (mg/L)Propionic Acid (mg/L)Butyric Acid (mg/L)Valeric Acid (mg/L)Total VFA (mg/L)
PHBV7.55811 ± 7.3309 ± 2.5176 ± 4.320.2 ± 0.751316 ± 11
PHBV-FW7.60754 ± 6.8267 ± 12164 ± 6.365.6 ± 561250 ± 69
CBB-FW7.574316 ± 16153 ± 4.7932 ± 272.65 ± 2.655405 ± 34
PLA-FW7.55813 ± 5.9264 ± 1.9153 ± 1.75.04 ± 2.51234 ± 11
PET-FW7.58815 ± 19310 ± 4.1210 ± 2011.7 ± 0.281350 ± 35
FW7.53826 ± 5.1173 ± 5.4226 ± 8.418.5 ± 2.71244 ± 3
Post-BMP Thermophilic (55 °C) Digestion
TreatmentpHAcetic Acid (mg/L)Propionic Acid (mg/L)Butyric Acid (mg/L)Valeric Acid (mg/L)Total VFA
(mg/L)
PHBV4.562153 ± 458111 ± 262229 ± 242119 ± 0.854613 ± 592
PHBV-FW8.79236 ± 1269.8 ± 18.5161 ± 2114 ± 80582 ± 85
CBB-FW5.209154 ± 248403 ± 542141 ± 17298.9 ± 22.911,797 ± 175
PLA-FW8.49431 ± 132115 ± 2381.7 ± 53.927.6 ± 3.7657 ± 99
FW8.48196 ± 945.5 ± 0.40 ± 0.055.9 ± 11.2298 ± 5
PET-FW8.42201 ± 949.2 ± 5.40 ± 0.013.7 ± 1.2264 ± 14
Post-BMP Mesophilic (35 °C) Digestion
TreatmentpHAcetic Acid (mg/L)Propionic Acid (mg/L)Butyric Acid (mg/L)Valeric Acid (mg/L)Total VFA
(mg/L)
PHBV8.730 ± 0.00 ± 0.00 ± 0.09.4 ± 1.09.4 ± 1.0
PHBV-FW8.720 ± 0.061.7 ± 16.682.1 ± 41.5111 ± 31255 ± 73
FW8.580 ± 0.00 ± 0.00 ± 0.018.5 ± 2.218.5 ± 2.2
Publisher’s Note: MDPI stays neutral with regard to jurisdictional claims in published maps and institutional affiliations.

