1. Introduction
The process of economic globalization in recent decades has had an enormous impact on our societies and organizations. Higher Education Institutions (HEIs) have not been unaffected by this evolution and are now subject to increased international competition and social scrutiny. In this context, information is needed to enable stakeholders to assess and compare the performance of HEIs globally. One of the most popular instruments are university rankings, which allow for a simple and quick comparison of HEIs on the basis of selected variables [
1,
2]. The development of these multi-criteria rankings has experienced strong growth in recent years, which has made them an object of analysis by academia. The functions performed by university rankings are multiple and are aimed at meeting the information demands of different stakeholders. They serve to guide prospective students, assess the overall situation of universities, improve competition in the areas assessed in the rankings, project a good image of universities and improve the satisfaction of the university community [
3,
4]. They can also be used to aid decision makers and facilitate university policies and the allocation of financial resources [
5,
6].
The development of university rankings can be approached from different perspectives. In order to unify the procedures, the Berlin Principles on Ranking of Higher Education Institutions were published [
7]. These principles are rather generic, but they address important issues that need to be considered in the development of the rankings. Any ranking should clearly define the purpose and goals of the ranking, the design and weighting of the indicators used, the process to collect and process the data, and the way ranking results are presented.
Currently, most global university rankings assess the performance of HEIs in relation to two fundamental aspects: teaching and research [
8]. The fact that the rankings value these two aspects of university activity is logical, as these have traditionally been the two main functions of HEIs. On the other hand, the main international rankings value the research aspect much more highly than the teaching aspect and, frequently, what is really being measured is the prestige of the universities [
9,
10].
Global university rankings have been criticized for a number of reasons [
11,
12,
13]. One of the main reasons for criticism is to analyze only aspects related to research and teaching [
14]. This point is especially relevant if we recognize the importance of rankings in providing information to stakeholders and as a force for promoting specific university policies [
1]. In this sense, in a context in which concern about climate change is growing, universities must lead the process of change required by society [
15,
16,
17]. Therefore, it seems reasonable to incorporate the measurement of environmental performance as a criterion in the elaboration of the rankings. The relationship between universities and the environment is manifold. Universities are like small cities, whose management has repercussions on aspects such as the transport of thousands of students and employees, energy consumption and waste management [
18]. They can be an example of environmental management for other public administrations and companies. Moreover, they can promote sustainability culture through numerous actions such as the inclusion of sustainability in curricula, or the promotion of research and transfer of environmental issues [
17,
19,
20]
In addition to analyzing only research and teaching, the global university rankings are criticized for the methodology used, especially the weighting of the criteria [
21,
22]. Generally, this process is very subjective and the methodology does not make explicit who has decided the weighting of each of the criteria in the final weighting or how it has been calculated [
23], so the results obtained are not reproducible [
24]. As a result, the rankings differ substantially in their orderings, although the top places are often occupied by the same universities [
25]. This lack of transparency undermines the credibility of the rankings and limits their effectiveness in achieving the purposes they are intended to serve.
In the light of the above criticism, the aim of this paper is to present a methodology to develop university rankings by applying goal-based programming that includes both traditional criteria related to research and teaching, as well as sustainability criteria. This multi-criteria methodology allows for a transparent and objective weighting of the different criteria [
26] and at the same time is easily reproducible [
27]. In this way, this paper contributes to the growing literature on sustainable university management and the development of HEI rankings.
The remainder of the paper is structured as follows.
Section 2 presents the literature review related to the assessment of the environmental performance of universities.
Section 3 describes the criteria used for the elaboration of HEI rankings under the criteria of research, teaching and sustainability.
Section 4 is devoted to the presentation of the methodology to elaborate the multi-criteria ranking based on goal programming (GP).
Section 5 describes the database used in the elaboration of the rankings.
Section 6 analyses the rankings obtained and finally,
Section 7 presents the main conclusions of the work.
2. Assessment of the Environmental Performance of Universities
The inclusion of sustainability performance criteria in the HEI rankings can be a determining factor as a catalyst for action. It allows for measuring progress in promoting sustainability in different aspects, increases transparency and is a means for universities to communicate their commitment to environmental goals. The importance of HEIs as promoters of sustainable development was already highlighted in the Declaration on the Human Environment in 1972. Since then, numerous policy statements, charters and declarations have been issued dealing with HEIs sustainability. Among the latest examples we can mention the United Nations Higher Education Sustainability Initiative (HESI), People’s Sustainability Treaty on Higher Education, Copernicus Charta 2.0, and the G8 University Summit: Statement of Action [
28]. The aim of these documents is to promote the commitment of universities to the goals of sustainable development and to facilitate the process of integrating sustainable development into the different activities carried out by HEIs [
2,
29]. The aim is not only to reduce the environmental impact of universities as operating institutions, but also to turn them into promoters of social change. In this context, universities must introduce sustainable management in aspects such as infrastructure management, energy consumption, waste treatment and water consumption. They must also consider indirect aspects, such as the transport used by students and staff. Furthermore, universities should encourage research and teaching in the area of sustainability, raise awareness among students and staff of the importance of sustainable practices and lead the change towards a more sustainable society [
30,
31]
Despite the fact that these declarations contain important guidelines to guide the action of universities in achieving sustainable development and fostering a more sustainable society, none of them is useful at an operational level, i.e., there are no precise instructions on exactly how universities should act in each of the different areas involved in sustainable development. In response to this need, numerous assessment tools have emerged, especially in the last two decades. Some authors identified three categories of assessment tools based on their approaches: accounts assessment, narrative assessment and indicator-based assessment [
32]. After the analysis of the strengths and weaknesses of the different approaches, the author concluded that indicator-based assessments offer higher levels of transparency, consistency and usefulness for decision-making. Moreover, indicator-based assessments have an overall higher performance and are more easily measurable and comparable then the other two approaches. It is therefore not surprising that in recent years numerous proposals for sustainability assessment tools for HEIs using the indicator-based approach have emerged. The main proposals have been compared and analyzed by different studies [
15,
18,
19,
28]. It is worth noting that there are notable differences between them in terms of purpose, scope and function. Moreover, assessment tools vary also regarding the weighting methods for indicators, flexibility and access to information [
28,
33]. Some of the sustainability assessment tools in HEIs have been proposed by researchers, for example the Adaptable Model for Assessing Sustainability in Higher Education [
34], the Graphical Assessment of Sustainability in Universities GASU [
35], the Graz Model for Integrative Development GMID [
6,
36], the Modifiable Campus-Wide Appraisal Model MOCAM [
23], the Sustainable University Model SUM [
37], the University Environmental Management System UEMS [
30] or the Uncertainty-based quantitative assessment of sustainability for HEIs [
17]. Other proposals have been made by universities, organizations and companies, among them the Assessment System for Sustainable Campus ASSC [
38], the Sustainability Assessment Questionnaire SAQ [
39], the Unit-Based Sustainability Assessment Tool USAT [
40], or the Sustainability Leadership Scorecard [
41].
Some of the methodological proposals allow for the elaboration of ranking tables, such as the Times Higher Education Impact University Ranking [
42], People and Planet University League (P&P) [
43], the Sustainability Tracking, Assessment and Rating System (STARS) [
44] and the GreenMetric World University Ranking [
45]. In this paper, we will use the data collected and used for the elaboration of the UI GreenMetric World University Ranking (GreenMetric). This international ranking assesses HEIs sustainability performance around the globe and is an initiative of Universitas Indonesia. According to Ragazzi and Ghidini [
46], this ranking lays a good foundation for the incorporation of the principle of sustainability within the HEIs and reflects the need to quantify the efforts towards sustainability. Several authors have used this ranking in their research. Some authors evaluate the implementation and results of the ranking [
47], others focus on conceptual issues surrounding the meaning of sustainability [
48], others used this ranking to quantify the contribution of universities to sustainability [
49], others assess the sustainability related performance of Indian HEIs [
18], and others analyze the individual indicators employed to obtain the ranking [
50]. Other authors also use the GreenMetric ranking as the benchmark and conclude that there is low relation between universities’ academic and sustainability performance [
8].
3. Criteria Employed in the Ranking of Universities
In recent years, social pressure for a firm commitment to sustainability has grown. Universities have not been oblivious to this development. The work carried out by universities places them in a privileged position to disseminate and promote sustainable behavior on and off campus. In this context, it is important to have a tool that allows to track the progress of universities in their sustainable management and their promotion of sustainability in their teaching and research activity. It is also of interest to be able to compare the situation of HEIs at a global level and to give visibility to those universities with the best performance. To achieve these objectives, university rankings are a very useful tool. The aim of the present work is to draw up a ranking that combines the traditional criteria in the field of research and teaching with sustainability criteria. The aim is to develop a ranking that can influence the policies of HEIs and that is necessary to promote sustainable development and contribute to the fight against climate change. Although some researchers have already pointed out the importance of combining research, teaching and sustainability criteria in the development of university rankings [
8], few have made methodological proposals [
6]. As expressed by most of the literature on sustainability in higher education, the concept of sustainability includes not just management/campus operations and community engagement but teaching and research activities [
51,
52]. That means, assessing sustainability implies including teaching and research criteria. On the contrary, assessing the teaching and research performance of universities does not necessarily require the inclusion of sustainability criteria. This is the fact for most traditional rankings based on teaching and research performance.
In order to draw up the ranking, this work uses criteria related to teaching, research and sustainability that are already used in university rankings of recognized prestige. Specifically, to capture the teaching and research areas according to traditional criteria, we include the criteria of the Times Higher Education World University Ranking (THE), one of the global benchmark rankings [
53] which has been employed in many research studies [
2,
12,
27]. Criteria to assess sustainability performance are obtained from the GreenMetric ranking [
46]. The criteria used are listed in
Table 1.
Table 1 shows the 11 criteria that will be used in the elaboration of the multi-criteria ranking that considers the performance of universities in the areas of sustainability, teaching and research. The GreenMetric ranking provides six criteria: Setting and Infrastructure, Energy and Climate Change, Waste, Water, Transportation and Education and research. The weighting of each criterion in the GreenMetric ranking is as shown in
Table 1. The sum of the weightings is 100% in the GreenMetric ranking. THE uses five criteria: Teaching, Research, Citations, International Outlook and Industry income. The weights associated with each criterion are shown in
Table 1. All of them will be used in the elaboration of our ranking and they also add 100.
It can be stated that in the GreenMetric ranking, sustainability also covers the areas of teaching and research. However, the THE ranking uses traditional criteria unrelated to sustainability to measure the performance of universities in these areas.
4. Methodology
To compile a ranking, it is necessary to select the criteria to be considered and to assign a weighting to each of them. Both steps are critical and have a great influence on the ranking table. While it is true that the most popular university rankings do adequately describe the criteria they use, there is very little transparency regarding the calculation of the weightings. Prestigious rankings such as Academic Ranking of World Universities (ARWU); Times Higher Education World University Ranking (THE); Quacquarelli Symonds (QS); THE Impact; Sustainability Tracking, Assessment and Rating System (STARS) or IU GreenMetric World University Ranking do not provide enough information about their methodology to obtain the weightings of the different indicators and criteria [
5,
23]. In cases where the methodology employed to obtain the weights is explained, expert opinion and AHP methodology are generally used, as in the proposals of some researchers [
6,
20,
23,
35,
54]. When experts are asked, the weights depend on the selection of the experts and is subject to their subjectivity, which introduces a bias in the ranking tables. Finally, the methodologies commonly used in the elaboration of rankings first define dimensions or areas. Then, each criterion or indicator is assigned to a single dimension. First, the importance of the different dimensions is weighted. Second, each criterion is assigned a weight within that dimension, which indirectly implies a weighting in the overall weighting. This way of proceeding assumes that each indicator is associated with only one dimension. However, it is possible that an indicator is actually related to two or more dimensions. This situation makes it impossible to assume that the different dimensions are independent and makes the correct calculation of indicator weights more complex.
In the following, a multi-criteria goal programming model is proposed that allows solving all these problems simultaneously. The advantageous characteristics of the GP model have led it to be used in different studies. For example, some authors use it to develop a ranking of Spanish saving Banks based on economic and financial variables [
55]; others use rank microfinance institutions [
56]; others compare sustainable development in the EU-28 countries [
57]; and others use rank European companies on their social responsibility [
26].
The proposed GP methodology allows for objective rankings without the need for expert decision-makers except for the selection of criteria or indicators. It is a transparent and easily reproducible methodology. In addition, it eliminates the need to create dimensions that encompass the different criteria, so that this prior step is eliminated and it is not necessary to assume the independence of the dimensions. This overcomes the criticisms of other methodologies discussed in the literature.
The proposed GP models allow two different perspectives to be adopted in the elaboration of university rankings. On the one hand, greater weight can be given to criteria that show a greater relationship with the rest of the criteria. On the other hand, greater relevance can be given to criteria that show a singular or independent behavior from the rest of the criteria. Being able to adopt these two perspectives is particularly important in a ranking such as the one we are about to draw up, which involves criteria that quantify HEI activities that may or may not be related, such as education, research or environmental commitment.
GP is a multicriteria technique originally proposed by Charnes and Cooper [
58] in which all functions, which may be linear and/or nonlinear and may use continuous and discrete variables, are transformed into goals [
59]. Decision-makers are then concerned minimizing the non-achievement of goals [
60] and the aim of GP is to minimize the deviations between the achievement goals and their aspiration levels. GP is a realistic approach to many real-world situations where it is not possible to maximize a previously defined utility function and decision-makers try to achieve a set of targets as closely as possible [
61]. In this context, GP is in line with the “satisfactory” philosophy [
62], as it makes it possible to find optimum solutions in a simplified context or find good enough solutions in a more complex and realistic environment.
The basic formulation of GP is expressed as in Model (1)
where x is a vector of decision variables,
(X) is usually a linear function of the i-th goal, and
is the aspiration level.
The purpose of this paper is to obtain a ranking of Universities which considers the different criteria which have been introduced in the previous section. Therefore, a single measure for universities’ performance must be obtained out of those criteria which will be used to rank the universities. In order to obtain the multicriteria performance of the HEIs, none of the traditional dimensions employed in other rankings are required (i.e., research, education, sustainability). The multicriteria performance of the Universities is obtained as a linear function of the different criteria considered as inputs as expressed in (2):
where
is the multicriteria performance of the i-th university,
stands for the normalized value of the j-th performance criterion of the i-th university and
is the weight of the j-th performance criterion. Our goal is to transparently and objectively determine the
weights that are assigned to the different performance criteria. Only then is it possible to construct a ranking table which is easily reproducible and avoids the criticisms received by other ranking methodologies.
To achieve our goal, we propose different GP models. The first model is known as the weighted goal programming model (WGP). This model assigns the weights to the different criteria by maximizing the similarity between the resulting multicriteria performance and the individual performance criteria. The general WGP model can be expressed as:
The variables in the WGP model must all be positive. The negative () and positive deviations from goals quantify the differences between the observed performance of the i-th university in the j-th criterion and the multicriteria performance estimated by the WGP model for the j-th criterion. In order to capture these situations, coefficients and are employed. takes the value 1 if is unwanted and the value 0 otherwise. if is unwanted, otherwise .
The weight calculated for the j-th criterion is . The weights are computed by minimizing the difference between the estimated multicriteria performance and the performance value of each criterion. In the WGP model the weights of the criteria are obtained without the participation of experts. Experts are only needed to select the criteria that serve as inputs in the model. There is also no need to allocate the different criteria into several areas or dimensions, which weight must also be obtained. The second constraint is that the sum of the weights assigned to each criterion must be one. That is why the deviation variables and are minimized in the objective function. The third constraint shows how the multicriteria performance of the i-th university is obtained. It is the addition of the weighted performance of the i-th-university in all the assessed criteria. The fourth constraint shows that quantifies the difference between the j-th criterion and the estimated multicriteria university performance. Finally, Z is the addition of the estimated overall disagreement. Low Z values mean that the multicriteria performance is in line with the performance of most individual criteria. This will be the case when most criteria are similar to each other. On the contrary, high Z values mean that there are big differences between the multicriteria performance and the performance of the individual criteria. This situation occurs when some criteria are less correlated or independent to the other. When this is the case, the results obtained by the WGP model may be poor, as the objective function seeks for a single multicriteria performance which is aligned with all the criteria employed. Therefore, conflicting criteria for which the improvement of one criterion leads to the worsening of another criterion represent a problem in the WGP model.
The MINMAX GP model or Chebyshev GP model is able to cope with the problem of discordant and even opposite indicators [
60]. This model minimizes the maximum difference between the multicriteria performance and the unicriterion performances.
All variables in the model have been introduced already in the WGP model, except D, which represents the maximum deviation between the multicriteria performance and the unicriterion performance, that is, the performance of each criterion. There are two differences between the WGP model and the MINMAX model. The first difference is the objective function. The second difference is a new constraint in the MINMAX model, which calculates the value of D as the supremum of the sum of deviations for each criterion j. As mentioned by [
26], the solutions of both models represent extreme cases of contrasting strategies. The WGP model fosters the general consensus between single criterion performances, whereas the MINMAX GP model overweights conflicting criteria performances.
The extended GP model [
60] offers a compromise between both models. An additional parameter λ is introduced to balance the solutions between the WGP and MINMAX GP models. The λ parameter ranges between 0 and 1. When λ equals 1, the extended GP model obtains the same solutions as the WGP model. If λ is set 0, the model obtains the same solutions as the MINMAX GP model. In fact, both the WGP model and the MINMAX GP model can be considered as special cases of the extended GP model. The EGP model is defined as follows:
5. Database
To illustrate the development of a multi-criteria ranking of universities that encompasses both the traditional criteria of teaching and research together with sustainability performance by applying the proposed methodology, a database from 2020 of 718 universities from all over the world has been compiled. The selected universities belong simultaneously to THE and GreenMetric rankings. This is because the information regarding the criteria used is obtained from these rankings and the method proposed for the ranking can only work with complete information. In the case of missing information from a university regarding a criterion, that university could not be included in the ranking. The criteria used are those described in
Table 1. The descriptive statistical analysis of these indicators is shown in
Table 2, which includes the minimum, maximum, range, median, mean and standard deviation.
In addition to the analysis in
Table 2, it is also interesting to perform a correlation analysis (see
Table 3). In general terms, the criteria used are not highly correlated. The only exception is the high correlation between the criterion Research and the criterion Teaching (0.87), both included in THE. On the other hand, the correlation between the criteria from the GreenMetric ranking is generally higher than the correlation between these criteria and those used in the THE ranking, and vice versa. Although both rankings include criteria to account for the performance in teaching and research, (Education and Research in the case of GreenMetric and the two criteria Teaching and Research in the case of THE) the criteria of the different rankings do not overlap. That means, they are measuring different realities and therefore their correlation is very low. This conclusion is obvious, especially when comparing how the criteria are defined (see
Table 1). This fact suggests that universities can be grouped into two blocks: those that focus their policy on improving their sustainability performance and those that focus mainly on teaching and research aspects. This does not imply that they abandon the other dimensions, but rather that one of these dimensions stands out from the others. Furthermore,
Table 3 shows that some criteria have a correlation of less than 0.1 with other criteria, indicating that they are independent in relation to these criteria. This is the case for Industry Income, which is independent of Citations and International Outlook, with a correlation coefficient of 0.02 and 0.05, respectively, and Citations and Setting and Infrastructure (0.02).
In order to operate with the collected data and implement the target programming model, a 0–1 normalization must be applied to all values. The purpose of this normalization is to avoid that the weights assigned to the criteria are biased due to the fact that some criteria have much higher absolute values than the rest. The normalized value of the criteria is calculated as follows:
where
is the normalized value of the j-th criterion in the i-th university;
is the maximum value of the j-th criterion; and
is the minimum value of the j-th criterion.
6. Results and Discussion
With the database described in the previous section, 500 multi-criteria university rankings have been produced by applying the EGP model. The other models described, the WGP model and the MINMAX GP model, are nothing but special cases of the EGP model, when λ takes the value 1 and 0, respectively. Obviously, changing the value of λ affects the weighting of the criteria used and, therefore, the performance of the universities and their position in the ranking table. The model has been run for 500 equally spaced λ values, between 0 and 1. In this way we have obtained 500 rankings, each with its particular criteria weights.
First the weights assigned to the different criteria are analyzed.
Figure 1 shows the boxplot representation of the weights assigned to the selected criteria. Analyzing the median value, there is no criterion with a weighting higher than 20%, i.e., there is no criterion that clearly dominates the rest. We can group the criteria into four groups, according to their median weighting: median weight between 20% and 15% (Research and Water), between 15% and 10% (Transportation), between 10% and 5% (Citations, Educations and Research; Energy and Climate Change; Industry Income; International Outlook; Waste) and weight below 5% (Setting and Infrastructure; Teaching). It is necessary to underline that the fact that a criterion is assigned a low weighting does not necessarily imply that it is not important when assessing the performance of the universities. This is because criteria may be correlated with each other, so that a lower weighting of one criterion may imply a higher weighting of a correlated criterion. A low weight may also be obtained if there is little dispersion in the values of one indicator. In this case, the criterion is not valid to discriminate among universities and therefore it will receive a low weight.
It is important to underline that the weights have been obtained objectively, without the involvement of experts, who may have subjective and potentially discordant opinions. Moreover, the weights of the criteria have been calculated directly, without the need to create dimensions grouping the different criteria in order to facilitate the assignment of weights.
Besides the analysis of the median value of the weights, it is also interesting to study how the weights of the different criteria change as the λ-value increases from 0 to 1.
Figure 2 shows that for low λ-values the weight of sustainability criteria dominate, while increasing λ-values result in higher weights for the traditional criteria (teaching and research, as traditionally measured). In fact, there is a tradeoff between traditional and sustainability criteria when allocating weights.
The different values of λ, by influencing the weighting of the criteria, modify the position of the universities within the multi-criteria ranking.
Figure 3 shows the top 50 universities if the universities are ordered according to their median position in the 500 rankings. Wageningen University and Research has the best median performance, followed by the University of Groningen. The median performance value is the one used to rank the universities: a higher multi-criteria performance value implies a better position in the ranking. What can be seen in
Figure 3 is that there is a clear leader in the ranking, Wageningen University and Research, followed by 4 solid universities heading the ranking: University of Groningen, University of California Davis, Delft University of Technology and Georgia Institute of Technology, which all have a very similar performance. Looking at the median value of the performance, it can also be concluded that the differences are minimal between universities close to each other in the ranking.
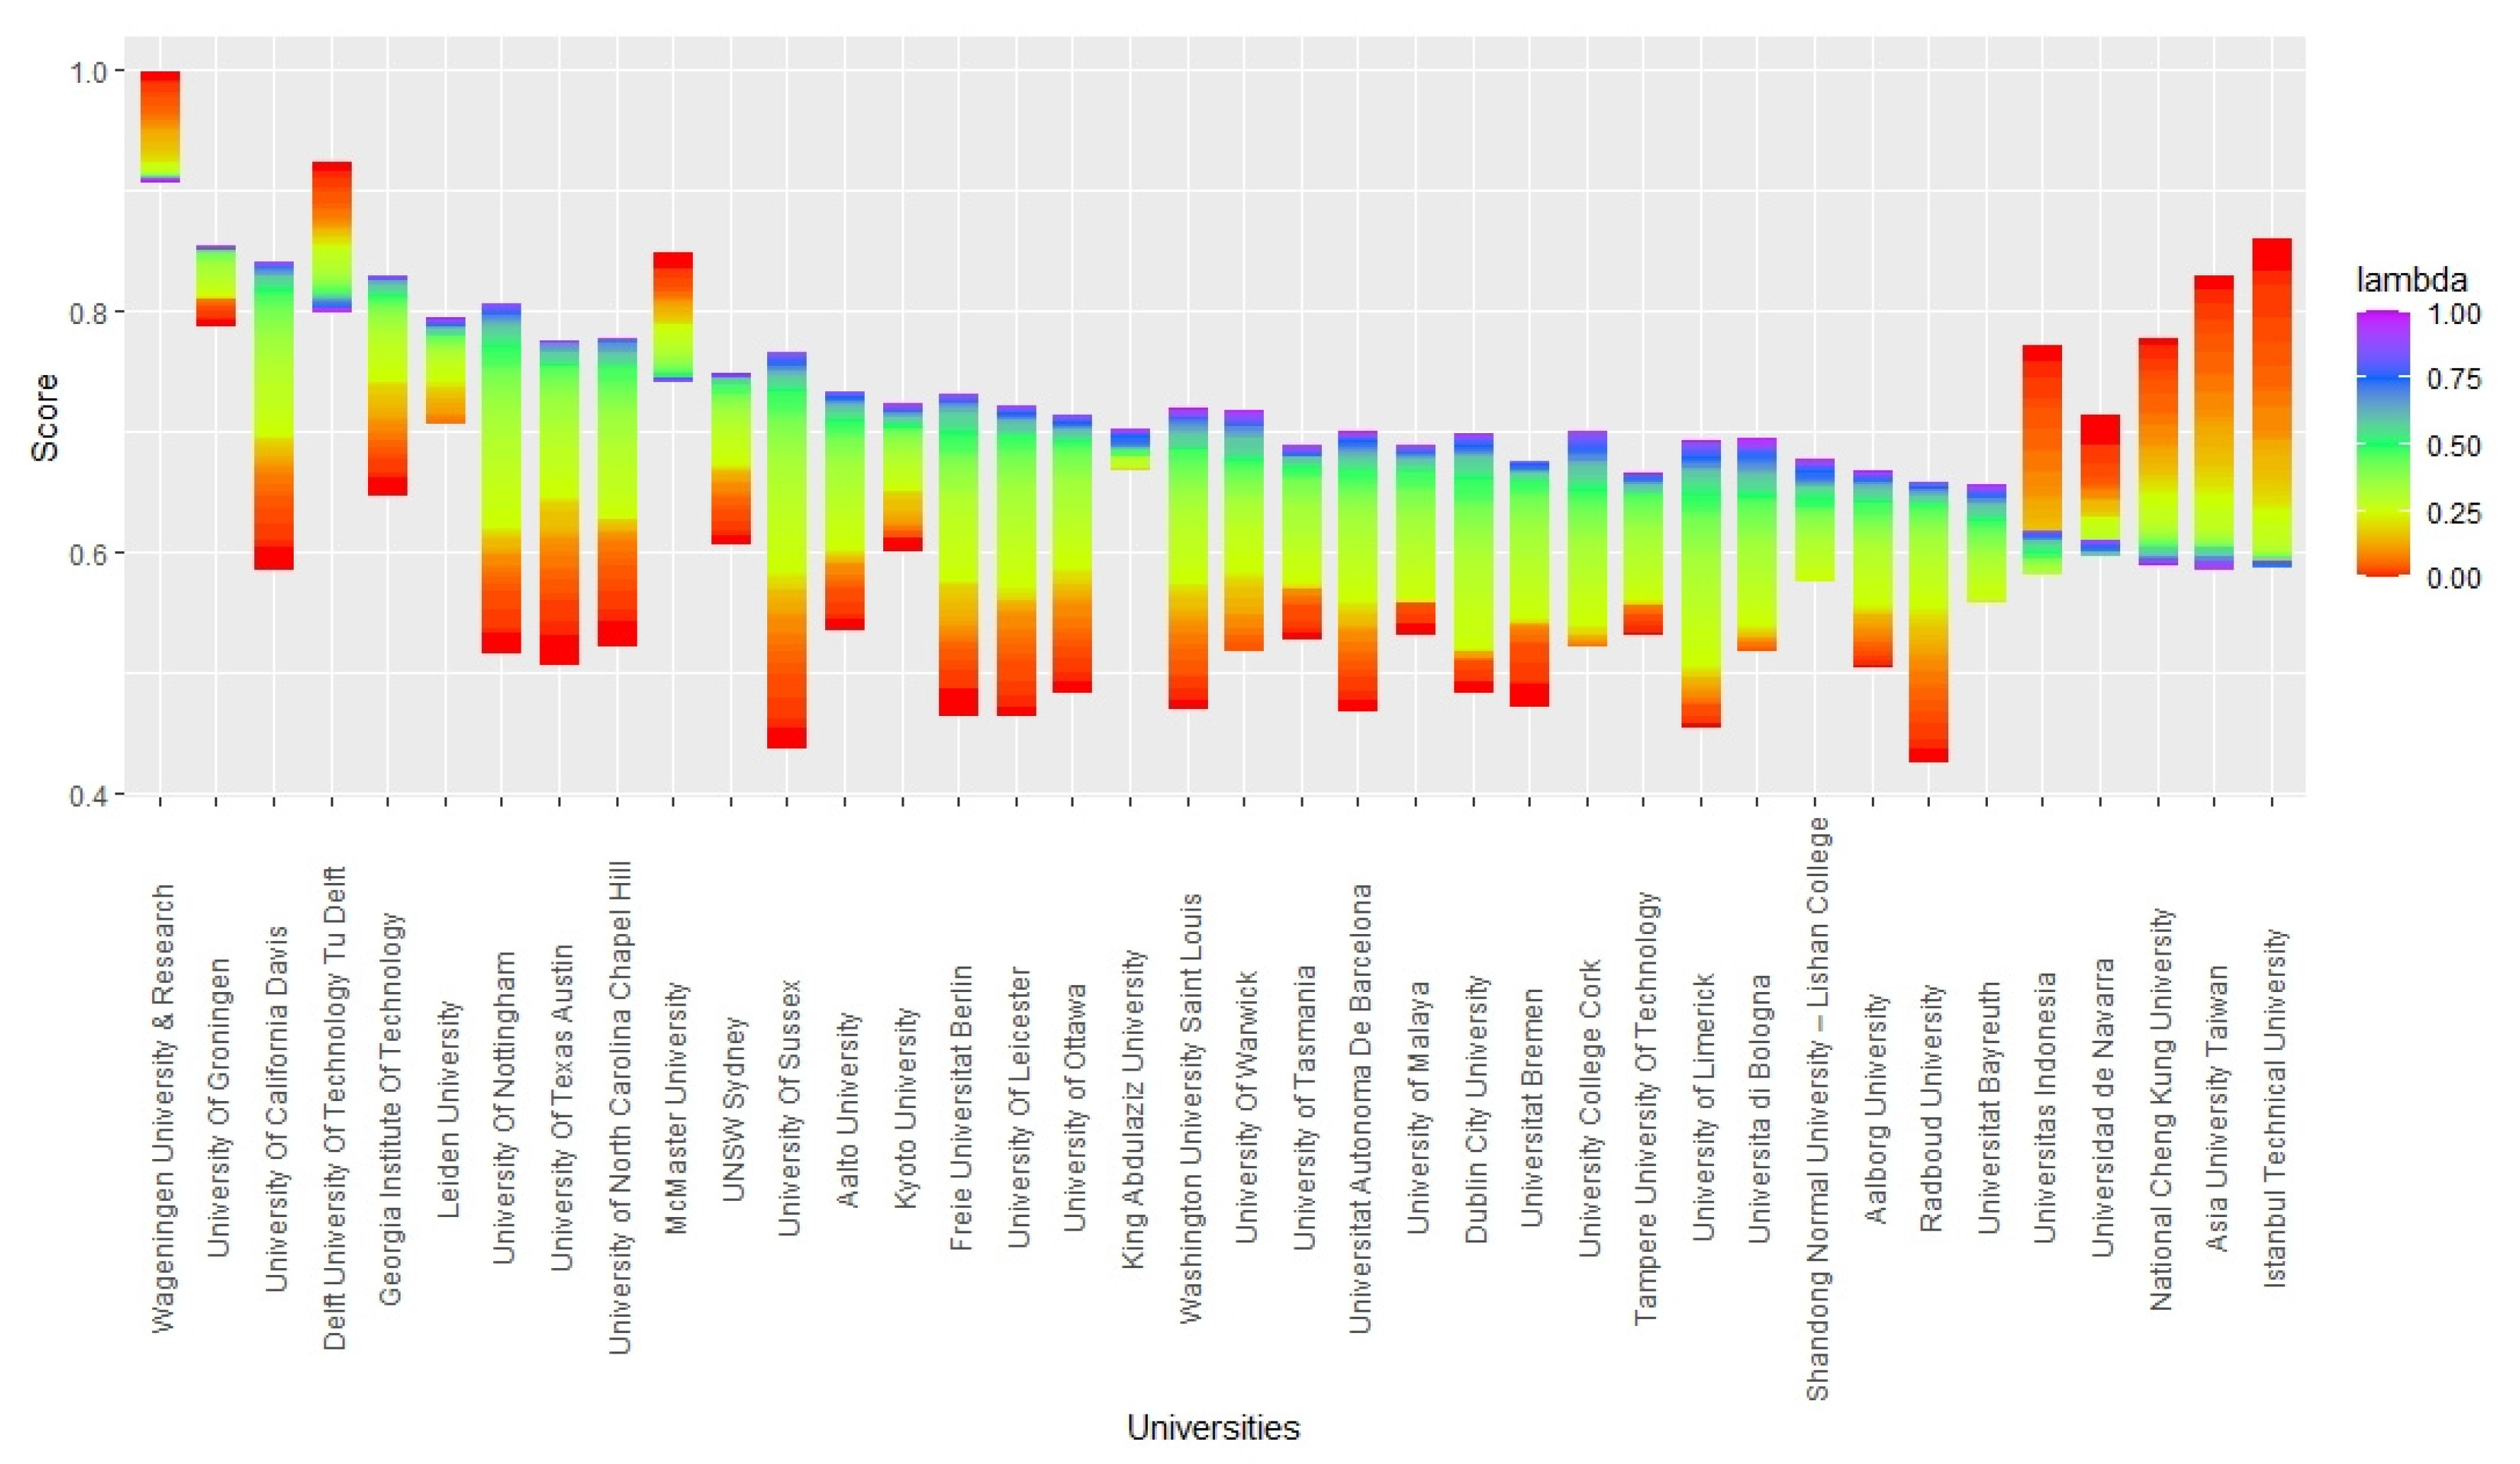
Finally, it is interesting to analyze how different λ values impact the performance obtained by the universities, which, in turn, affect their position in the ranking.
Figure 4 shows the performance of the top 50 universities according to their median position in the 500 rankings and how this performance changes for different λ values. Again, Wageningen University and Research outstands with very high scores regardless the λ value, so it always leads the ranking. For most universities, the position in the ranking can greatly vary depending on the λ values assigned. It becomes evident that some universities get a much better score when λ is near zero, that is, when sustainability criteria have the most weight (see
Figure 2), and low scores for higher λ values. For example, this is the case for Asia University Taiwan and Istanbul Technical University. Other universities receive a better scoring when the λ values are near 1, i.e., when the traditional teaching and research criteria have more weight. This shows how important it is in any ranking methodology to disclose which criteria are employed but also how the weight is assigned to the selected criteria.
Looking at
Figure 4, we can identify some universities which are particularly strong regarding sustainability criteria, such as Universitas Indonesia or National Cheng Kung University, among others. This is probably related with some strategic decisions by the universities to promote sustainability policies. Other universities are especially strong in teaching and research, such as the University of California Davis or the University of Nottingham, but get poor scores in sustainability criteria. This is probably also due to political decisions and those universities are now starting to focus on sustainability increasing actions. Finally, some universities, such as Wageningen University and Research, University of Groeningen and Delft University of Technology Tu Delft, are both outstanding regarding teaching and research and sustainability. Interestingly, all three universities are located in the Netherlands, which is a country with a long tradition in teaching and research and where population is very aware of sustainability problems.
7. Conclusions
University rankings are an instrument that allows stakeholders to evaluate and compare the performance of universities in various fields. They are also a powerful instrument for guiding university performance and promoting policies. In fact, many national governments and many universities globally aim to improve their position in international university rankings in order to enhance their prestige. Currently, most university rankings measure university performance from a multi-criteria perspective, which encompasses two aspects of university activity: teaching and research. However, this vision of university’s mission, limited to these two areas, may be incomplete. Indeed, there are many stakeholders who believe that universities should promote sustainable development and lead the fight against climate change in the evolution towards a sustainable society. The relationship between universities and sustainable development is multiple and encompasses aspects such as the environmental management of universities, research and technology transfer or the design of curricula that awaken a commitment to sustainability in students. For all these reasons, it seems reasonable to develop university rankings that include the sustainable performance of universities, together with the traditional performance in teaching and research.
The development of rankings has been the subject of much criticism. From a methodological point of view, the process of selecting criteria, the allocation of weights and the lack of transparency are particularly criticized. In this regard, criteria are generally grouped into dimensions and their importance is weighted against the other criteria within that dimension. A weighting is then assigned to each dimension, and in this indirect way the final weighting of each criterion in the ranking is established. With this procedure, a criterion can only belong to one dimension, which is not always the case. Then, it is not reasonable to assume independence between dimensions, which makes it even more difficult to calculate the weights of the criteria.
This paper presents a methodology for the elaboration of multi-criteria rankings based on GP that addresses the above-mentioned criticisms. With this methodology, rankings can be obtained objectively, without the need for experts with subjective opinions and views that may not coincide. In addition, experts may have problems assigning weights to unrelated dimensions. There is also no need to group criteria into dimensions and the weights of the criteria are calculated directly. When applying the proposed methodology, the decision maker only has to set the value of the λ parameter, then the weights of the different criteria are calculated automatically. The methodology is transparent and easily reproducible. To weight the criteria, the proposed GP method, the EGP model, allows the decision-maker to favor more or less criteria that show similar behavior to the other criteria, through the λ parameter. Different values of λ imply different weightings of the criteria of the model and, therefore, different values of the performance of the universities and different positions in the ranking table. In this sense, it should be noted that the proposed methodology limits the subjectivity of the decision-maker in the selection of the λ value.
Once the methodology has been presented, it is applied to the elaboration of a multi-criteria ranking of universities that includes sustainability, teaching and research criteria. The sample of universities consists of 718 universities included in the Times Higher Education World University Ranking and UI GreenMetric World University Ranking. The 11 criteria employed are those used in both rankings. The paper performs a sensitivity analysis to check how different values of λ affect the weight of the criteria and the position of the universities in the ranking. For this purpose, 500 λ values are used. The result shows that, for the selected sample, the weights of the criteria significantly vary depending on the λ-values. There is a tradeoff between traditional criteria (teaching and research) and sustainability criteria. The changes in the weight of the criteria have a major impact on the ranking of universities. This fact underlines the importance of the determination of weightings in the ranking tables and the importance of transparent methods. Otherwise, the prestige and usefulness of the rankings may be questioned.


