Article

Using POI Data to Identify the Demand for Pedestrian Crossing Facilities at Mid-Block

1
Key Laboratory of Road and Traffic Engineering of the Ministry of Education, Tongji University, 4800 Cao’an Road, Shanghai 201804, China
2
Center for Spatial Information Science, The University of Tokyo, 5-1-5 Kashiwanoha, Kashiwa 277-8568, Japan
3
College of Transportation Engineering, Chang’an University, Middle-Section of Nan’er Huan Road, Xi’an 710064, China
*
Author to whom correspondence should be addressed.
Sustainability 2021, 13(23), 13256; https://doi.org/10.3390/su132313256
Submission received: 20 October 2021 / Revised: 19 November 2021 / Accepted: 22 November 2021 / Published: 30 November 2021
(This article belongs to the Section Sustainable Transportation)

Abstract

:
In Chinese cities, the widespread problem of the low density of the road network has seriously damaged the convenience of pedestrian crossing, resulting in an unfriendly pedestrian experience and restricted development of non-motorized traffic within the city. Only by accurately capturing the crossing needs of pedestrians can we adopt a targeted approach to improve the pedestrian crossing experience. In this paper, the demand and supply are considered synthetically, and a method of using point of interest (POI) data to analyze the demand for pedestrian crossing facilities at the mid-block is proposed. First, we developed the method of calculating the pedestrian crossing demand intensity based on POI data. Secondly, based on the appropriate length threshold and pedestrian crossing demand intensity threshold, a series of road sections with strong demand for pedestrian crossing facilities are identified in the study area. Finally, we use mobile phone data to obtain the intensity of residents’ activity in different areas, and find that the distribution of the areas with more activity is basically the same as that of the target road sections. The result shows that the method proposed in this paper can effectively identify the road sections with strong demand for crossing facilities at mid-block, and can provide support for the improvement of urban non-motorized traffic.

1. Introduction

In the past century, the development of motorization has changed the lifestyle of the residents, and an increasing number of cars has caused the city to be overwhelmed [1]. Planners and city administrators have realized the importance of non-motorized transportation for sustainable urban development, and begun to pay more attention to infrastructure for non-motorized modes of transportation, to meet the demands and improve equity [2]. Taking London as an example, in order to reduce car dependency and guide the shift of residents’ travel mode from private cars to walking and cycling, the mayor’s transport strategy [3] proposes that improving the walking space and building healthy streets is one of the core strategies for the future development of London’s transportation.
Realizing the significance of pedestrian in the urban road traffic system, the existing research has gradually focused on the pedestrians’ crossing behavior and the safety of crossing facilities. Velasco et al. [4] use virtual reality experiment and mixed-model binomial logistic regression to explore how automated vehicles affect the pedestrian crossing behavior. Shaaban et al. [5] investigate the impact of hindrances, vehicles, and other pedestrians on the illegal pedestrian crossing behavior during the different stages of crossing. Aghabayk et al. [6] compared the pedestrian crossing behavior at signalized and unsignalized crosswalks and analyzed influencing factors based on linear mixed models and generalized linear mixed models. Ma et al. [7] developed models based on Bayesian networks to assess two types of illegal pedestrian behavior, including “crossing at a red light” and “crossing outside of a crosswalk.” Zhang et al. [8] focus on the pedestrians’ red-light crossing intentions, and used long short-term memory neural network to predict behaviours.
However, availability is the pre-condition of safety. Hankey et al. [9] indicate that lack of demand data and analysis tools are the key factors for officials to make scientific decisions on the planning, construction and management of pedestrian crossing facilities. Although researchers have provided valuable insights into pedestrian crossing demand, including the spatiotemporal distribution of pedestrian crossing volumes and the influence of built environment, this previous research mainly focuses on the mechanism of the built environment impacting pedestrian crossing volumes by using real pedestrian data [10,11], rather than identifying the demand for pedestrian crossing. In some ways, the latter can more directly provide references and help for urban transportation planning.
Additionally, the problems in the development of the road network of China can explain why pedestrian crossing demand is critical to study. China’s urbanization and motorization have been developing synchronously in the past few decades, making Chinese cities face a huge pressure of automobile traffic. Therefore, the transportation planning is often focused on vehicle traffic. In order to meet the patency and continuity of vehicle traffic, the roads in Chinese cities are often designed to be very wide, and the spacing of intersections are often designed rather large, causing the widespread phenomenon of a sparse road network in cities. The sparse road network is lacking humanization for pedestrians. A common occurrence in life is that when pedestrians need to cross the street at a mid-block point, if the intersection spacing is too large, it will force pedestrians to walk a long distance. Fundamentally, the sparse road network in cities obstructs the activities and communication of pedestrians on both sides of the road, and cuts off the space on both sides. The inconvenience of pedestrians crossing is only one manifestation of this problem.
In order to illustrate the sparsity of the road network in Chinese cities, we compared the road network of Shanghai (central city), New York, and Seoul. We converted the road network to a series of road sections between intersections, and displayed different lengths in different colors (Figure 1). In New York, there are very few road sections over 400 m in length; they are either the connecting roads between the islands or the roads that are located in parks. In the city of Seoul, road sections exceeding 400 m in length are also very limited, and they are mainly high-grade roads or mountain roads. In the central city of Shanghai, there are many road sections over 400 m in length, and most of these road sections are located in the area between the Inner Ring Road and the Outer Ring Road. The low density of road networks in Chinese cities, represented by Shanghai, has hampered the development of non-motorized traffic. Most importantly, the road network construction in many Chinese cities has basically been completed. Therefore, large-scale facility construction may not be the optimal solution, but research on pedestrian crossing demand will help us to discover and solve these problems.
Generally, the longer road sections need pedestrian crossing facilities at mid-block, but only the length cannot identify the target section accurately; the actual pedestrian crossing demands also need to be considered. Due to the development of information technology and data sharing, the point of interest (POI) data is useful in understanding the urban functional areas. The POI data in a digital map are used to describe a series of service facilities in a city (such as a hospital, a supermarket, a bank, etc.). Each POI contains basic information such as the name, address, latitude and longitude, and extended information required by the map user. A large quantity of POI lays the key foundation of a digital map. Compared with the data obtained from the field survey, POI data has the advantages of easy access, high volume, and wide coverage. It has been used in the related fields of urban planning and traffic planning [12,13,14,15,16]. Researchers often use POI data to identify land use characteristics in a certain area [17,18,19,20,21].
Based on POI data, we introduce pedestrian crossing demand intensity to indicate the level of pedestrian crossing demand at mid-block. The service facilities in cities have a clustering effect on pedestrians, and service facilities are often the origin or destination of travel. Accordingly, there are often walking or lingering pedestrians near POIs, who may be arriving at POIs to get service, may be leaving from POIs, and, of course, may just be passing by. Generally speaking, there are also dense pedestrians in the areas where POIs are densely distributed. Correspondingly, pedestrian crossing demand is also more intense here. The clustering effect of POIs on pedestrians make it possible to analyze the pedestrian crossing demand by means of POIs distributed on both sides of the road. Synthetically considering the supply and demand, this study proposes a method of identifying the demand for pedestrian crossing facilities based on POI data. First, a method for calculating pedestrian crossing demand intensity based on POI data is proposed. Then, we use pedestrian crossing demand intensity threshold and road section length threshold to identify the target section. We take the area between the Inner Ring Road and the Outer Ring Road of Shanghai as the research area, and use this method to identify a series of target road sections with strong demand for pedestrian crossing facilities. With the help of POI data, we have also identified the function of each target road section, which helps us to develop different design plans for different road sections in the traffic improvement project. Finally, the mobile phone data is applied to this study to test the reasonableness of the identification results.
The remainder of this paper is organized as follows. First, we introduce the data used in our research. Next, we explain our research method. Then, the results are presented. Finally, we draw conclusions.

2. Data

2.1. POI Data

2.1.1. Data Introduction

Baidu Map open platform provides a set of application interfaces based on the Baidu Map service for developers, in which Place API provides the developer with the function of retrieving POI data. We obtained 723,649 POIs from the Baidu map open platform from 23 February to 26 February in 2018 in the central city of Shanghai. After deleting the meaningless POIs (such as stairs, rivers, bridges, etc.) and duplicated data, there were 455,939 POIs remaining. Finally, according to the coordinate information of the data, the data in the study area are screened out and 236,322 useful POIs are obtained.

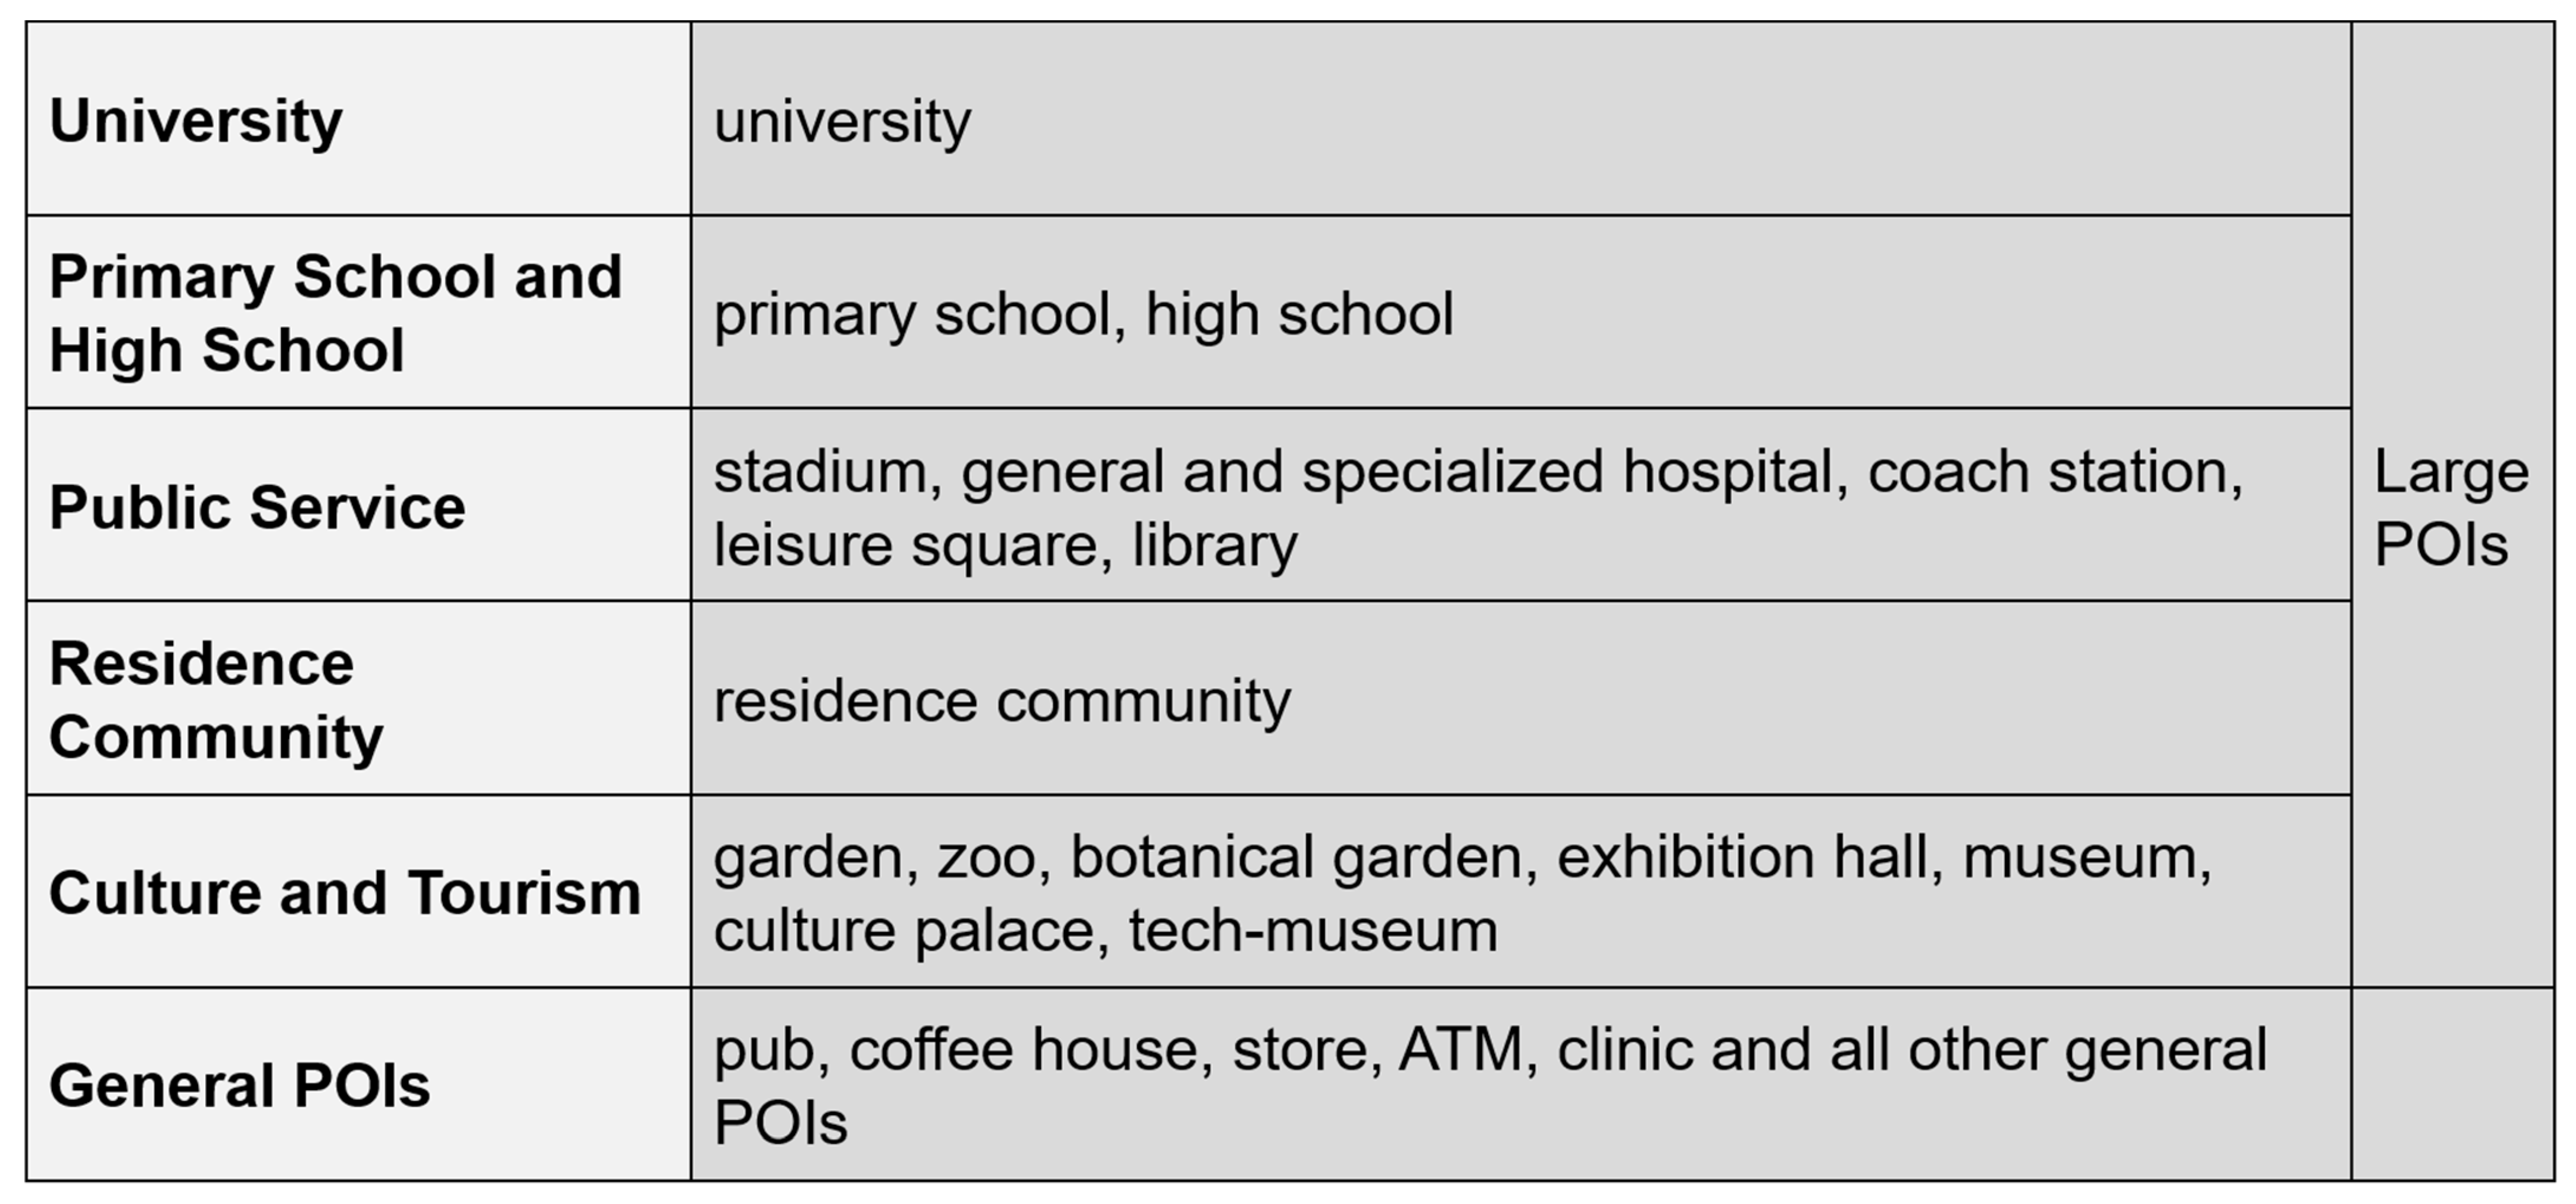
2.1.2. Data Pre-Processing

In Baidu Map open platform, POIs are divided into 17 first level categories. However, there are two main shortcomings in this classification. On the one hand, the spatial scale and the ability to attract people of different POIs can be very different, for example, a park’s size and the ability to attract people are far greater than a convenience store. Unfortunately, the classification of original POI data is unable to distinguish these differences. On the other, because the function identification of target road sections is based on POI data, the category structure of POIs (associated with the certain road section) determines the function of a certain road section. However, the original POI data categories are too complex, and the existing classification results do not apply to the function identification of road sections.
Therefore, the POIs are reclassified in pedestrian crossing demand measurements and function identification of road sections respectively. For the former, the POIs cover a large area and are very attractive to pedestrians are selected as “Large POIs” in this paper, such as universities, hospitals, and parks. All other POIs are “General POIs”. All of the General POIs are combined into one category, and the Large POIs are divided into five categories according to the similarity of their functions (Figure 2).
Furthermore, the latitude and longitude of these Large POIs often indicates the central location of the covered area, which is far away from the urban road. In the next work we need to associate POIs to the adjacent road section, but, because of their location (described by latitude and longitude) away from urban roads, these Large POIs make it impossible for us to associate them to road sections. To solve this problem, we used the geocoding API of Baidu Map open platform, which can transform a specific address information into latitude and longitude information. We take out the address information of each Large POI (the address information contained in the Large POI is generally the main entrance location of the POI), and transform the address into geographic coordinates by geocoding API, and finally save the new latitude and longitude. The attraction of Large POI to pedestrians is concentrated at the main entrance, so it is reasonable to replace the original position with the main entrance position.
Unlike the classification in pedestrian crossing demand measurements, in order to obtain a clear function identification result of road section, POI data was reclassified again to improve the usability of POI data. Based on the function features of POI, we merge POIs with similar services, and finally POIs were reclassified into six categories, which correspond to six categories of service facilities (Figure 3).
Moreover, POIs on both sides of the urban road may be located near intersections or at mid-block points away from intersections; however, this study only focuses on pedestrian crossing demand at mid-block points. Therefore, we excluded the POIs near intersections (not more than 100 m away from intersections), and retained POIs with a distance greater than 100 m from intersections (Figure 4).

2.2. Mobile Phone Data

In this study, residents’ activity information extracted from mobile phone data will help to test the effectiveness of our proposed method. The mobile phone data contains continuous cell phone usage and location information, so the user’s movement trajectory is completely recorded, which can help understand the spatiotemporal characteristics of human mobility [22,23,24,25,26]. The mobile phone data used in this paper is provided by a mobile communication operator in Shanghai. The time range for the data is from 8 September 2011 to 11 September 2011, of which 8 September and 9 September are working days, and the other two days are weekends.
The original mobile phone data cannot be directly used in this study. In order to improve the usability of data, we have to reorganize the original data [27]. First, we used the binning method [28] to process original data, and transform the data into raster data structure (a raster with 245 rows and 348 columns was constructed to cover the city territory of Shanghai, and the size of each cell in the raster is 500 m by 500 m). Then, we identified the activity points [28]. Finally, we counted the number of activities in each cell. After the data were reorganized, we obtained the intensity of residents’ activity (the number of activities in a certain period of time) in different areas of Shanghai.

3. Methodology

3.1. Associating POIs to Road Sections

Establishing the association between POIs and road sections is a prerequisite for calculating pedestrian crossing demand intensity based on POI data. This is owing to the fact that only by establishing such an association can we determine which road section the pedestrians attracted by POIs is located. We use ArcGIS to generate 50-m-wide buffers on both sides of all the road sections (Figure 5). The experiment result indicates that 50 m is the most appropriate size of buffer because increasing the size of buffer has little effect on the number of POIs matched to the road section.

3.2. Calculating Pedestrian Crossing Demand Intensity Based on POI Data

3.2.1. Method Principle

The fundamental assumptions of the method are as follows. (1) Service facilities in cities have a clustering effect on pedestrians, so there are often walking or lingering pedestrians near POIs if a service facility is abstracted as a specific point location. The more POIs a road section associates with, the more pedestrians on both sides of the road section (same as population density [29]). (2) The number of pedestrians has a positive correlation to crossing demand in a road section of certain length. Although the crossing demand identified by this method is not exactly the real demand, properly adding pedestrian facilities in these road sections with potential demand can improve safety and convenience of walking, which can encourage more walkability. Taking into account the above considerations, we propose a pedestrian demand intensity calculation method based on POI data. This index describes the needing extent of pedestrians to cross the road section, which can be compared between different road sections. For the road section i , the number of POIs (associated with the i -th road section) for the j -th category is denoded as x i j , and the pedestrian crossing intensity is calculated as:
y i = j = 1 n w j × x i j
where w j refers to the weight corresponding to the j -th POI category, and n is the number of POI categories.
In order to determine the weight of different indexes, standard variance is used. The principle is that the index with larger standard variance (the degree of variability of the index value is greater) contains more explanatory information, and the greater the role it plays in the comprehensive evaluation, and vice versa.
σ j is the standard variance of the number of POIs for the j -th category, which can be calculated as:
σ j = i = 1 m ( x i j 1 m i = 1 m x i j ) 2 m 1
where m is the number of road sections, and x i j refers to the number of POIs (associated with the road section i ) for the j -th category. Then, the weight corresponding to the   j -th POI category can be calculated as:
w j = σ j j = 1 n σ j
where n is the number of POI categories.

3.2.2. Establishing Formula

Based on the POI data (which have been reclassified) and the road network data in the study area, we have established a formula for calculating pedestrian crossing demand intensity:
y i = 0.034 × x i 1 + 0.151 × x i 2 + 0.251 × x i 3 + 0.221 × x i 4 + 0.058 × x i 5 + 0.285 × x i 6
where x i 1 is the number of General POIs (associated with the road section i ), x i 2 refers to the number of high schools and primary schools (associated with the road section i ), x i 3 is the number of cultural facilities and tourist facilities (associated with the road section i ), x i 4 represents the number of public service facilities (associated with the road section i ), x i 5 is the number of residence communities (associated with the road section i ), and x i 6 is the number of universities (associated with the road section i ).

3.3. Calculating Pedestrian Crossing Demand Intensity Based on POI Data

To determine whether there is a demand for pedestrian crossing facilities on a certain road section, we need to consider two main issues. The first is whether the length of the road section is long enough. If the length of the road is very short, the pedestrian crossing demands can be met at intersections. The second is whether the pedestrian crossing demand intensity at mid-block is large enough. Therefore, only the long road sections with large pedestrian crossing demand intensity become our targets.

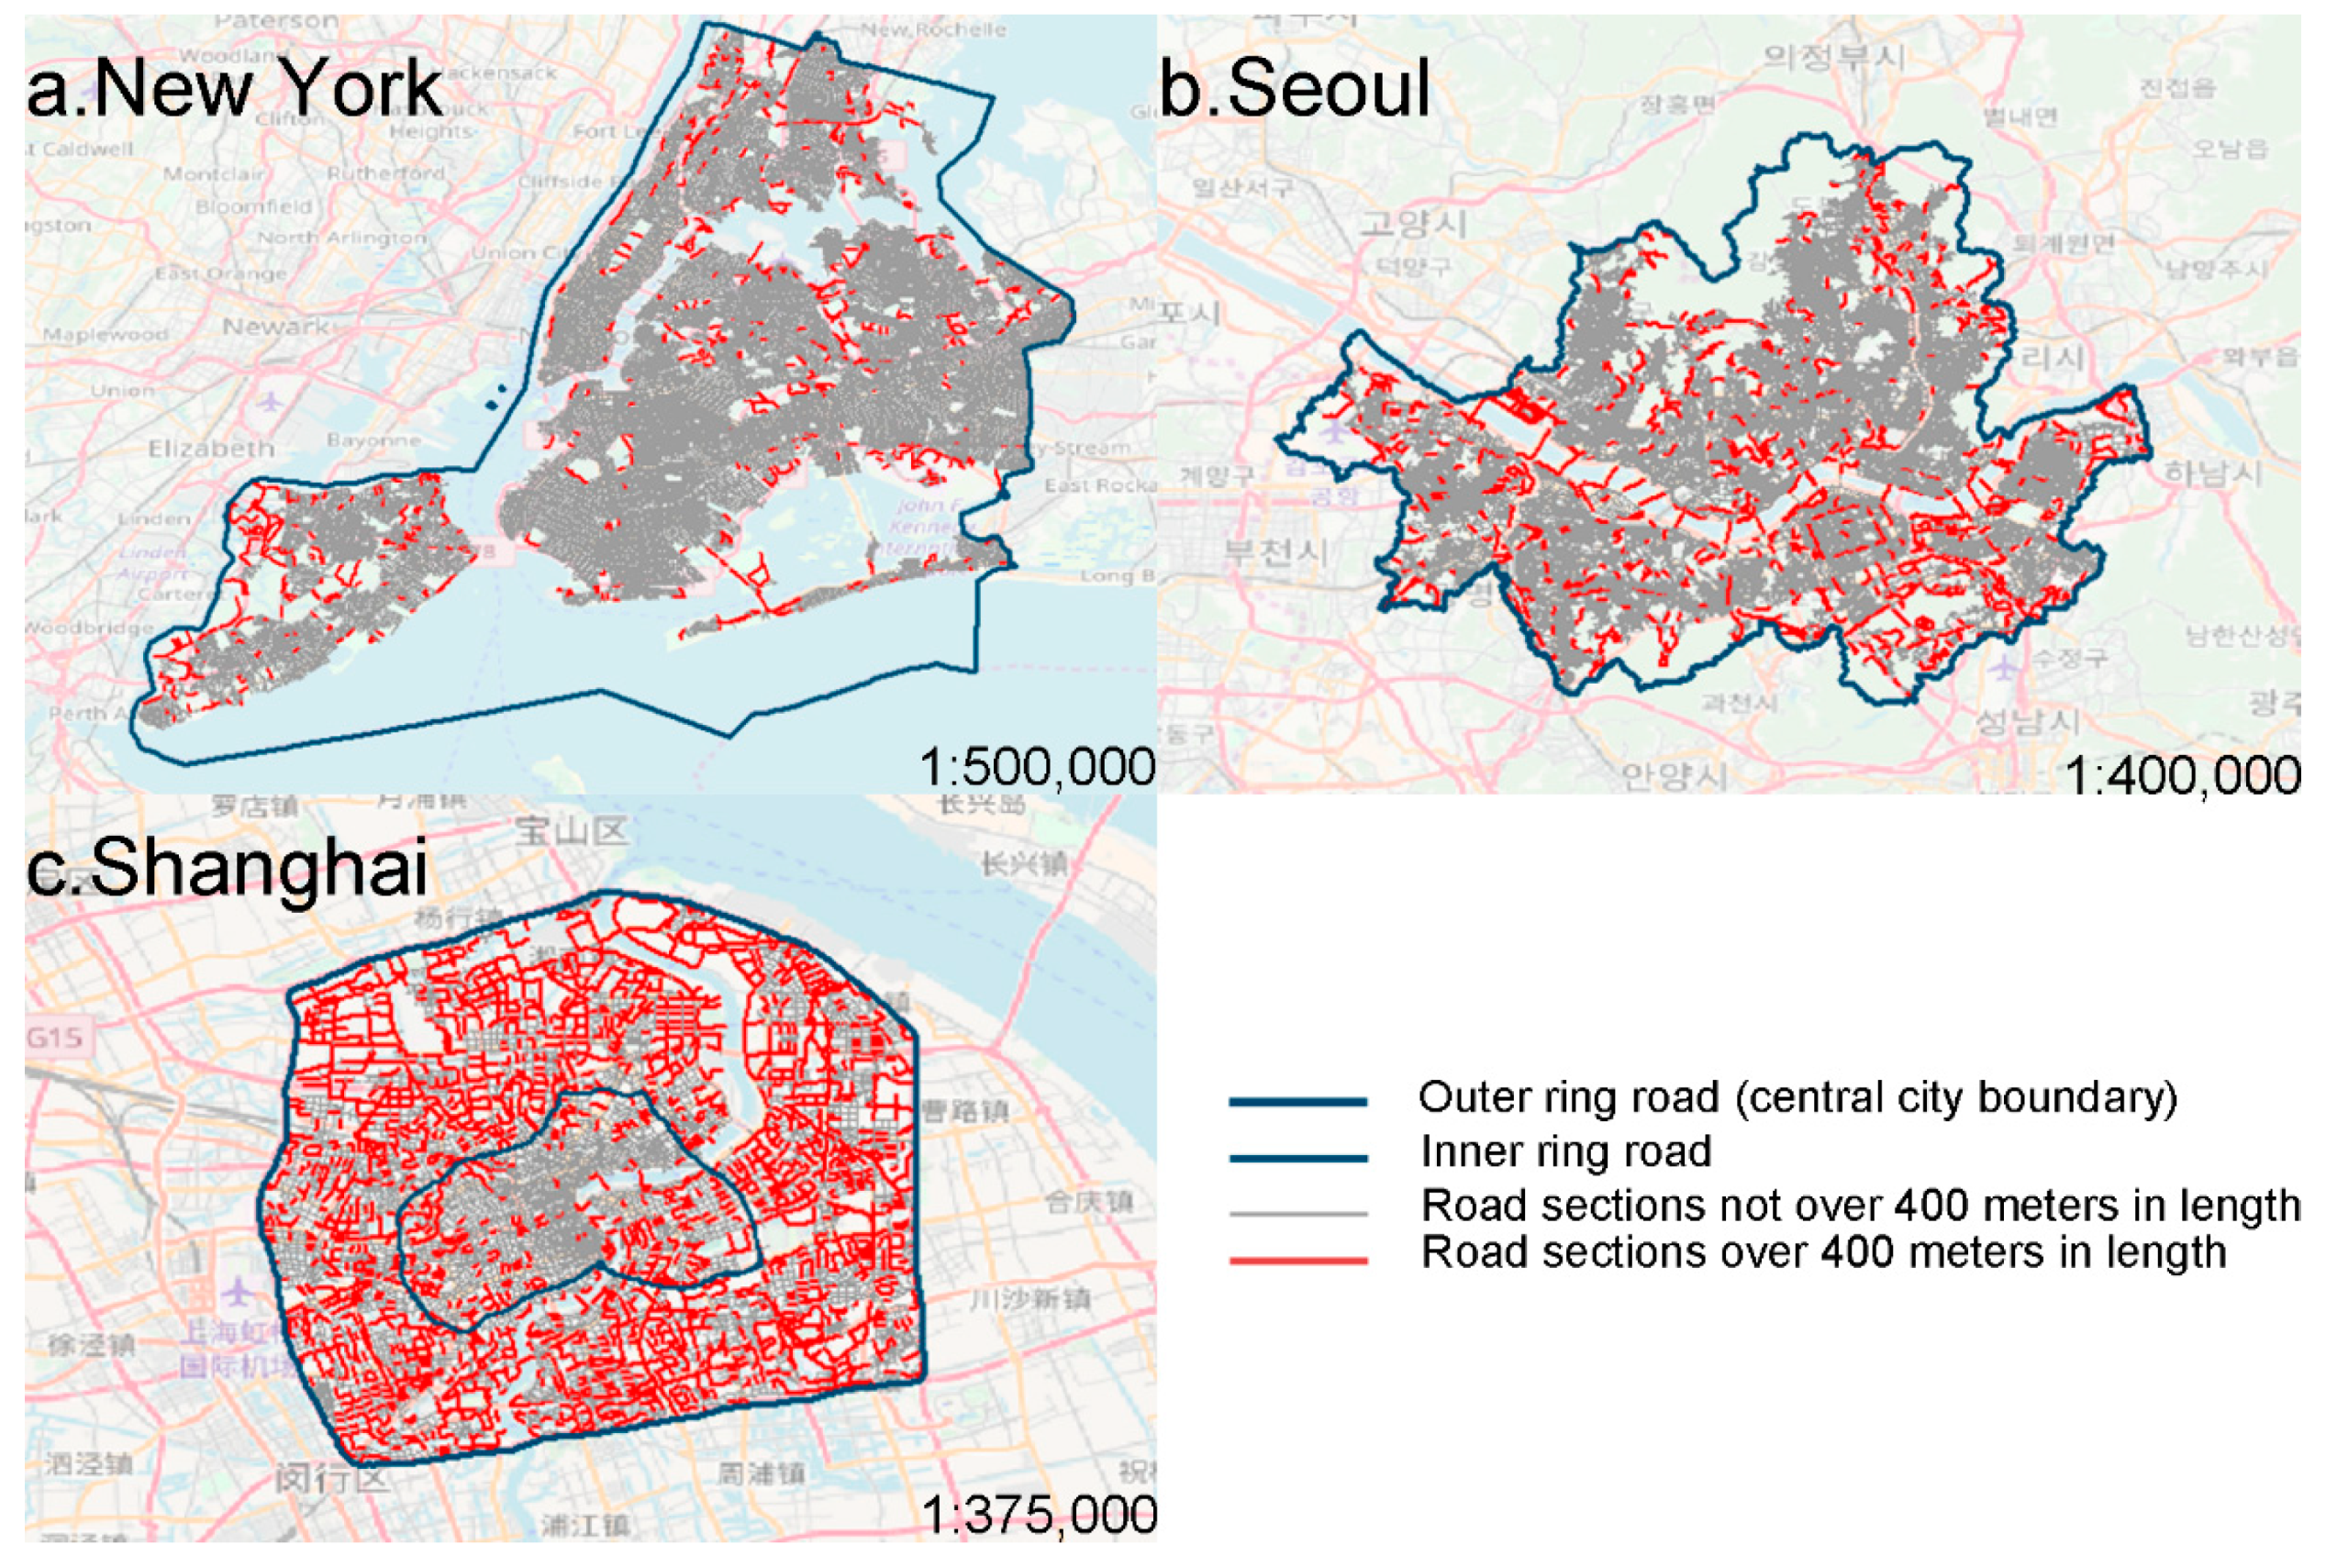
3.3.1. Threshold of Length

Some design code for urban road traffic facilities in China [30,31] point out that the spacing of the crossing facilities should not be greater than 400 m. For example, the local code in Zhejiang province [32] points out that a flat crossing facility should be set up at mid-block when the intersection space on the artery is not less than 400 m, or the intersection space on the branch is not less than 300 m. Therefore, combined with China’s specific national conditions, we set the length threshold to 400 m.

3.3.2. Threshold of Pedestrian Crossing Demand Intensity

In order to find the appropriate threshold for pedestrian crossing demand intensity, we selected several road sections as reference from several commercial centers in Shanghai. Five road sections of more than 400 m in length are selected from the Middle Huaihai Road commercial center, the Zhongshan Park commercial center, and the Changshou commercial center, where the five road sections are part of Changle Road, Huashan Road, Middle Huaihai Road, Changning Road, and Changshou Road, respectively. All of these road sections are typically busy [33]. According to Equation (4), the pedestrian crossing demand intensity of these five road sections is calculated (Table 1). After the observation of the pedestrian crossing demand intensity of these five typical road sections, we finally set the threshold of pedestrian crossing demand intensity to 2, which is the minimum value in the result been rounded down to the nearest integer.

3.4. Identifying Function of Road Sections

As mentioned above, there have been studies that have proposed methods of using POI data to identify the function of an area in a city, and we find that some methods are referable for the function identification of road sections [34,35]. Based on the number of different categories of POIs (associated with the road section), the function of a road section can be identified by the following methods:
C i j = n i j N j i = 1 6 n i j N j
where C i j is the category ratio of POIs for the j -th category which indicates the relative importance of different categories of POIs associated with the road section i , n i j refers to the number of POIs (associated with the road section i ) for the j -th category, and N i represents the total number of POIs for the j -th category.
Then, we can identify the function of road sections based on the value of C i j . For each road section, if the category ratio of a type of POI reaches 0.5 or more, it is considered that the road section is a single function road section, and its function category is determined by the category of the POIs with the highest category ratio. If all the category ratios are less than 0.5, it is considered that the road section is a mixed function road section.

4. Results and Discussion

This section is divided by subheadings. It provides a concise and precise description of the experimental results, their interpretation, as well as the experimental conclusions that can be drawn.

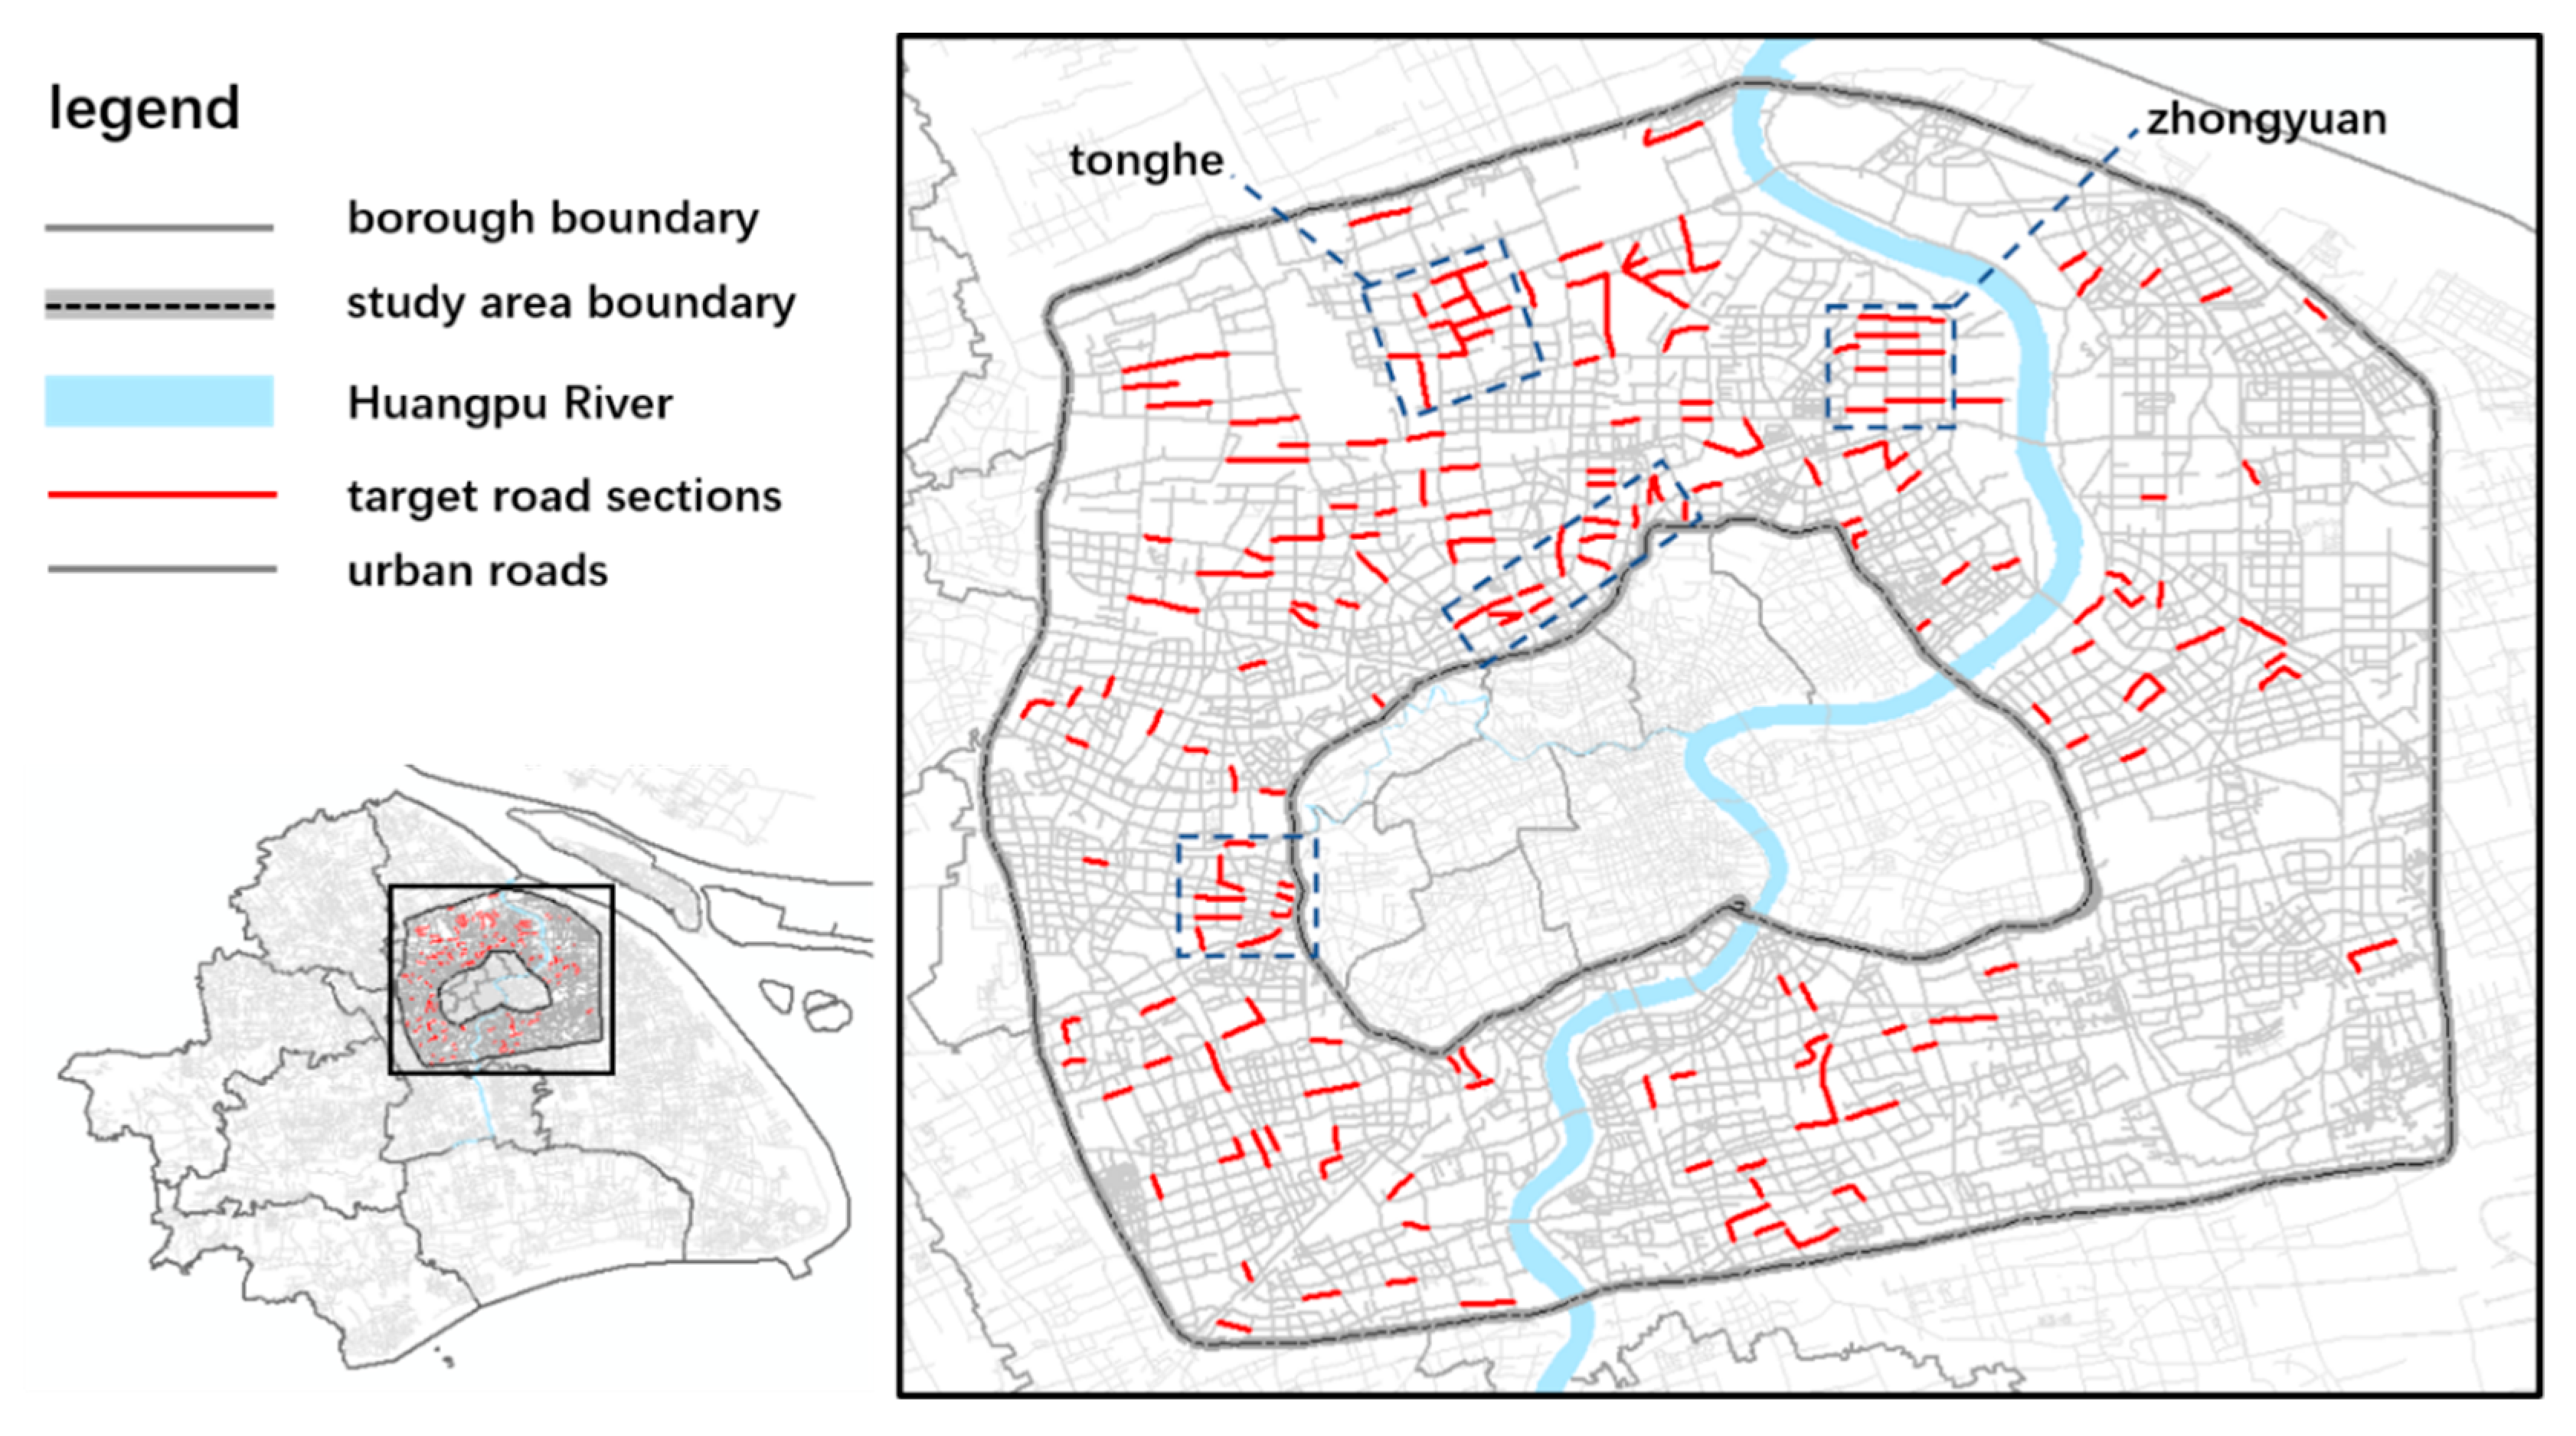
4.1. Target Road Sections

In the study area, 215 target road sections were identified (Figure 6); most of them are distributed in Puxi (the region west of Huangpu River). This is because, compared to Pudong (the region east of Huangpu River), Puxi has a longer development time and more residents. Meanwhile, we can see that there are more potential contradictions between supply and demand in Puxi. Additionally, we find that the target road sections are clustered in some areas, of which the Zhongyuan area and the Tonghe area are dwelling districts. In Chinese cities, the residence communities are generally located in large blocks, and there are a large number of service facilities and frequent resident activities on the road around the residence communities. Therefore, dwelling districts should be key areas to enhance street quality and pedestrian experience. For all 215 target road sections, pedestrian crossing facilities are strongly needed. Based on the results of this research, we can conduct field survey on each target road-section and make an appropriate design plan for the practical traffic improvement projects.

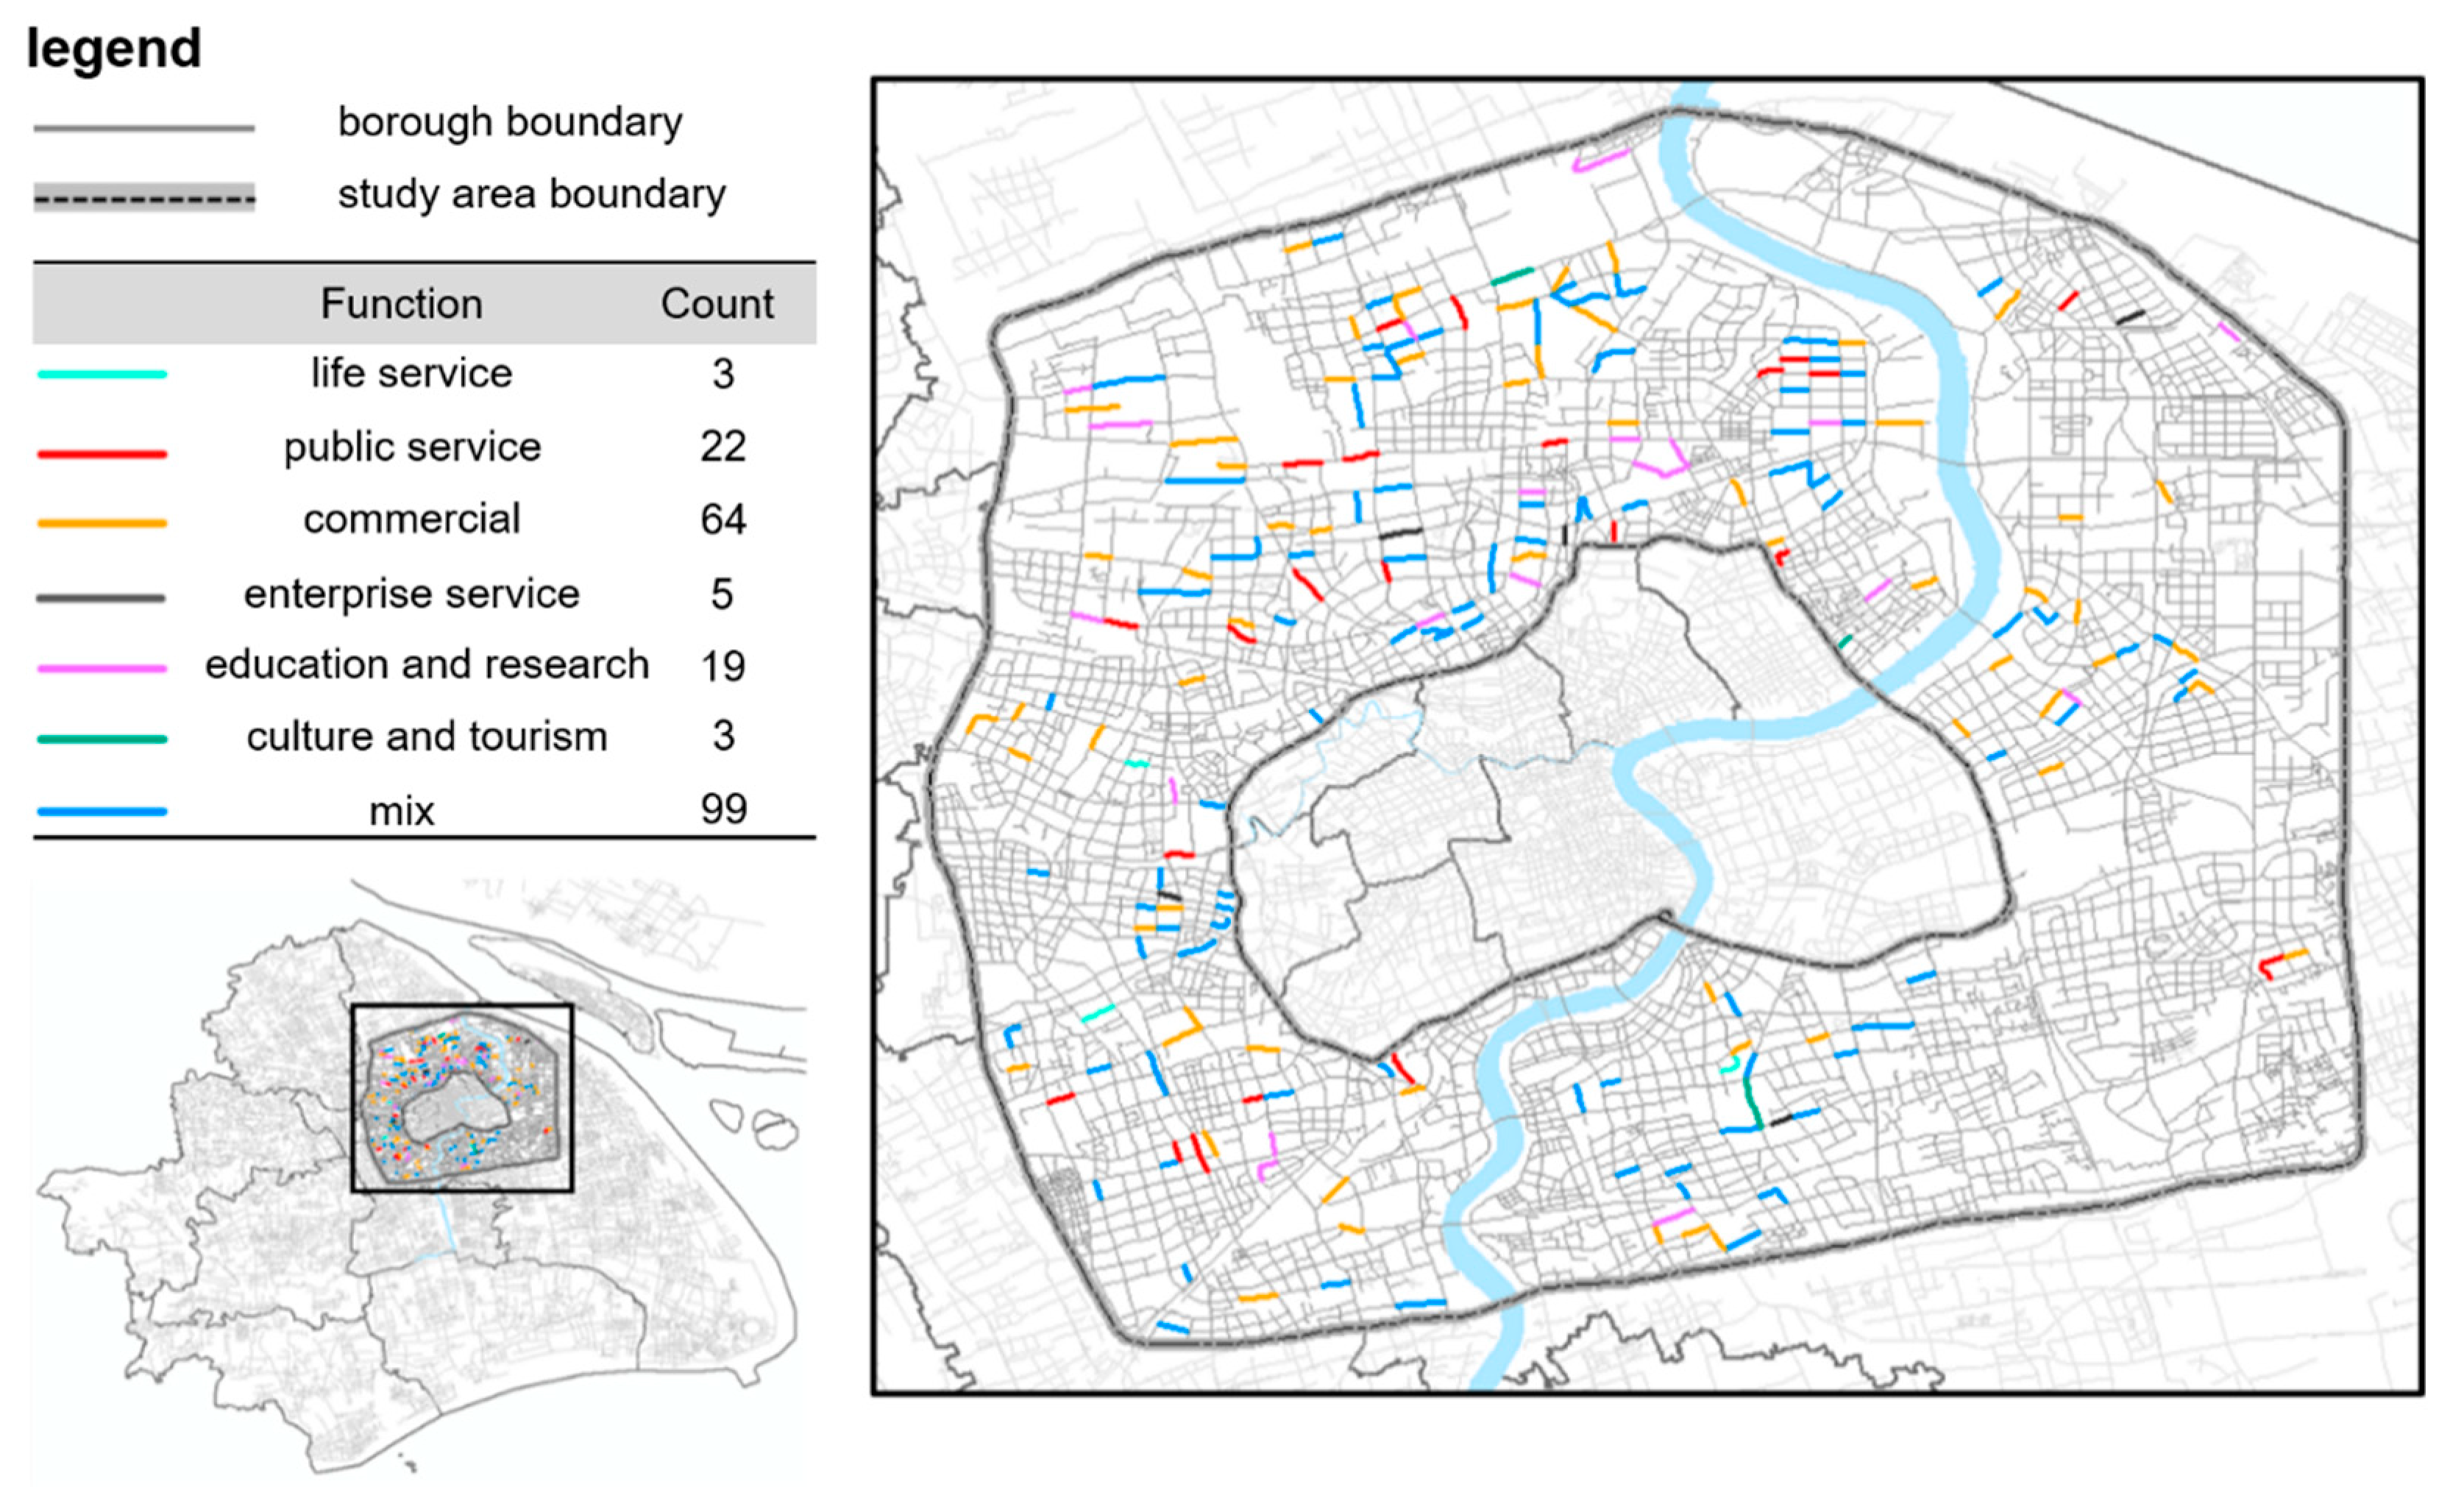
4.2. Function Identification of Target Road Sections

The identification results show that the number of the road sections with mixed function is the greatest, followed by the road sections with commercial function (Figure 7). However, the number of the road sections with life service function is the least. The significance of identifying the function of the target road sections mainly lies in two aspects. The first is to lay the foundation for our subsequent research (further in-depth study on different types of target road sections). The second is to guide the practical traffic improvement project design. For example, on the target road sections with enterprise service function, an overpass (or underpass) can be considered to serve a large number of commuters during rush hours. Commuters do not have to wait long before crossing the street, which can relieve their time pressure and reduce the occurrence of illegal crossing.

4.3. Testing Effectiveness of Method

Previous study [36,37,38] points out that the number of residents’ activities obtained by mobile data is significantly correlated with the number of residents’ trips obtained by the actual traffic investigation, indicating that the activity information extracted from mobile phone data can reflect the actual situation. Therefore, we used mobile phone data to obtain the number of residents’ activities in different areas. According to our assumption, the more residents’ activities, the more demand for pedestrian crossing can be generated. On this basis, the accuracy of the identification results was verified. First, we calculated the number of activities in each cell (in two weekdays). Then, based on the number of activities of each cell, we divided all cells into three types and differentiated them by different colours (Figure 8). The green cell has a small number (less than the second quartile) of activities and is therefore a region with low activity intensity. There are more activities in the yellow cell, so it is a region with high activity intensity. The red cell has the largest number (greater than the third quartile) of activities and is therefore the region with the highest activity intensity. The data in the other two days (weekends) were also processed in the same way (Figure 9).
It can be found that most of the identified target road-sections are located in the yellow cells or the red cells. The areas where the target road-sections are clustered are also the areas with the highest activity intensity. Based on the distribution of residents’ activities during the working days, we found that 189 target road-sections passed through the frequent area of residents’ activities (yellow cells and red cells), which accounted for 87.91% of all the target road-sections, of which 139 target road-sections passed the red cells with the highest intensity of activity, accounting for 64.65% of all the target road-sections. Based on the distribution of residents’ activities during the weekends, the two ratios reached 89.30% and 67.44%, respectively. It can be seen that most of the target road-sections are distributed in the concentrated areas of residents’ activities, which indicates that the identification results are reasonable and reliable.

5. Conclusions

The huge blocks and sparse road networks in Chinese cities not only fail to solve the problems of motorized traffic, but also restrict the development of non-motorized traffic. Facing the already-fixed road network structure, we can only repair problems on the existing road network. Therefore, identifying the demand for pedestrian crossing facilities is the first step to improve the pedestrian experience and the key to improving non-motorized traffic for smart, low-carbon and sustainable transportation development [39].
The length of road-section is one of the determinants of pedestrian crossing convenience, but only considering this factor cannot accurately identify road-sections with strong demand for pedestrian crossing facilities. Various service facilities have a clustering effect on pedestrians, so dense service facilities can always attract many pedestrians. Considering the clustering effect, this paper first proposes a method for calculating the pedestrian crossing demand intensity based on POI data. The pedestrian crossing demand intensity reflects the level of demand, and the length of road-section reflects the level of supply. We consider the demand and supply, and propose a method of identifying the demand for pedestrian crossing facilities based on POI data. Using this method, we have effectively identified 215 target road-sections in the study area. Finally, we use mobile phone data to test the rationality of the identification result and obtain a satisfactory test result.
This study mainly has two aspects of significance: (1) A method for analyzing pedestrian crossing demand based on POI data has been proposed; (2) The research result of this paper can provide support for the improvement of urban non-motorized traffic and contribute to help city administrators reach better decisions. It is noted that improving the walkability benefits not only the non-motorized mode of transportation but also public transportation, for the high accessibility of the bus stops can increase the public transportation mode share [40]. The improvements in both these two aspects can effectively reduce the private car use and is helpful for sustainable urban development.
In this study, Shanghai, China, is taken as a case to demonstrate the method is effective. Actually, this method can be also applied in most cities which are in the stage of development, for the local government should give priority to the pedestrian while they construct road infrastructure. Furthermore, there may be some possible limitations in this study which require further study and improvements in the future work. On the one hand, more factors that have influence on the pedestrian crossing demand should be considered in the demand identification method, such as the quality of walking space and the design of intersections. On the other, the spatial scale or area of different POIs is not sufficiently taken into account, because the proposed method measures the pedestrian crossing demand based on the diversity of POIs. This solution is a trade-off due to the lack of area of interest (AOI) data. In the future study, we will use questionnaire investigation or a pedestrian traffic detector to acquire the real demand for pedestrian crossing facilities and improve the demand identification method.

Author Contributions

Supervision, W.L.; writing—original draft, P.L.; data processing and modeling, Q.Y. and J.H.; writing—review and editing, Y.C. All authors have read and agreed to the published version of the manuscript.

Funding

This work is supported by the National Natural Science Foundation of China (Grant No. 71734004) and the Fundamental Research Funds for the Central Universities (Grant No. 300102210126).

Institutional Review Board Statement

Not applicable.

Informed Consent Statement

Not applicable.

Data Availability Statement

Publicly available datasets were analyzed in this study. POI data can be found here: https://lbsyun.baidu.com/ (accessed on 21 November 2021).

Conflicts of Interest

The authors declare no conflict of interest.

References

  1. Risimati, B.; Gumbo, T.; Chakwizira, J. Spatial Integration of Non-Motorized Transport and Urban Public Transport Infrastructure: A Case of Johannesburg. Sustainability 2021, 13, 11461. [Google Scholar] [CrossRef]
  2. Rahul, T.; Verma, A. Sustainability analysis of pedestrian and cycling infrastructure—A case study for Bangalore. Case Stud. Transp. Policy 2018, 6, 483–493. [Google Scholar] [CrossRef]
  3. Greater London Authority. Mayor’s Transportation Strategy. Available online: https://www.london.gov.uk/sites/default/files/mayors-transport-strategy-2018.pdf (accessed on 9 May 2018).
  4. Velasco, J.P.N.; Farah, H.; van Arem, B.; Hagenzieker, M.P. Studying pedestrians’ crossing behavior when interacting with automated vehicles using virtual reality. Transp. Res. Part F Traffic Psychol. Behav. 2019, 66, 1–14. [Google Scholar] [CrossRef] [Green Version]
  5. Shaaban, K.; Muley, D.; Mohammed, A. Analysis of illegal pedestrian crossing behavior on a major divided arterial road. Transp. Res. Part F Traffic Psychol. Behav. 2018, 54, 124–137. [Google Scholar] [CrossRef]
  6. Aghabayk, K.; Esmailpour, J.; Jafari, A.; Shiwakoti, N. Observational-based study to explore pedestrian crossing behaviors at signalized and unsignalized crosswalks. Accid. Anal. Prev. 2021, 151, 105990. [Google Scholar] [CrossRef] [PubMed]
  7. Ma, Y.; Lu, S.; Zhang, Y. Analysis on illegal crossing behavior of pedestrians at signalized intersections based on Bayesian network. J. Adv. Transp. 2020, 2020, 2675197. [Google Scholar] [CrossRef] [Green Version]
  8. Zhang, S.; Abdel-Aty, M.; Yuan, J.; Li, P. Prediction of pedestrian crossing intentions at intersections based on long short-term memory recurrent neural network. Transp. Res. Rec. 2020, 2674, 57–65. [Google Scholar] [CrossRef]
  9. Hankey, S.; Lindsey, G.; Wang, X.; Borah, J.; Hoff, K.; Utecht, B.; Xu, Z. Estimating use of non-motorized infrastructure: Models of bicycle and pedestrian traffic in Minneapolis, MN. Landsc. Urban Plan. 2012, 107, 307–316. [Google Scholar] [CrossRef]
  10. Singleton, P.A.; Park, K.; Lee, D.H. Varying influences of the built environment on daily and hourly pedestrian crossing volumes at signalized intersections estimated from traffic signal controller event data. J. Transp. Geogr. 2021, 93, 103067. [Google Scholar] [CrossRef]
  11. Pfiester, L.M.; Thompson, R.G.; Zhang, L. Spatiotemporal exploration of Melbourne pedestrian demand. J. Transp. Geogr. 2021, 95, 103151. [Google Scholar] [CrossRef]
  12. Chen, W.; Fang, Y.; Zhai, Q.; Wang, W.; Zhang, Y. Assessing emergency shelter demand using POI data and evacuation simulation. ISPRS Int. J. Geo-Inf. 2020, 9, 41. [Google Scholar] [CrossRef] [Green Version]
  13. Liu, J.; Deng, Y.; Wang, Y.; Huang, H.; Du, Q.; Fu, R. Urban nighttime leisure space mapping with nighttime light images and POI data. Remote Sens. 2020, 12, 541. [Google Scholar] [CrossRef] [Green Version]
  14. Lou, G.; Chen, Q.; He, K.; Zhou, Y.; Shi, Z. Using nighttime light data and poi big data to detect the urban centers of Hangzhou. Remote Sens. 2019, 11, 1821. [Google Scholar] [CrossRef] [Green Version]
  15. Wu, M.; Pei, T.; Wang, W.; Guo, S.; Song, C.; Chen, J.; Zhou, C. Roles of locational factors in the rise and fall of restaurants: A case study of Beijing with POI data. Cities 2021, 113, 103185. [Google Scholar] [CrossRef]
  16. Lu, C.; Pang, M.; Zhang, Y.; Li, H.; Lu, C.; Tang, X.; Cheng, W. Mapping Urban Spatial Structure Based on POI (Point of Interest) Data: A Case Study of the Central City of Lanzhou, China. ISPRS Int. J. Geo-Inf. 2020, 9, 92. [Google Scholar] [CrossRef] [Green Version]
  17. Liu, K.; Yin, L.; Lu, F.; Mou, N. Visualizing and exploring POI configurations of urban regions on POI-type semantic space. Cities 2020, 99, 102610. [Google Scholar] [CrossRef]
  18. Yao, Y.; Li, X.; Liu, X.; Liu, P.; Liang, Z.; Zhang, J.; Mai, K. Sensing spatial distribution of urban land use by integrating points-of-interest and Google Word2Vec model. Int. J. Geogr. Inf. Sci. 2017, 31, 825–848. [Google Scholar] [CrossRef]
  19. Zong, L.; He, S.; Lian, J.; Bie, Q.; Wang, X.; Dong, J.; Xie, Y. Detailed Mapping of Urban Land Use Based on Multi-Source Data: A Case Study of Lanzhou. Remote Sens. 2020, 12, 1987. [Google Scholar] [CrossRef]
  20. Wang, Y.; de Almeida Correia, G.H.; van Arem, B.; Timmermans, H.H. Understanding travellers’ preferences for different types of trip destination based on mobile internet usage data. Transp. Res. Part C Emerg. Technol. 2018, 90, 247–259. [Google Scholar] [CrossRef] [Green Version]
  21. Zhang, T.; Sun, L.; Yao, L.; Rong, J. Impact analysis of land use on traffic congestion using real-time traffic and POI. J. Adv. Transp. 2017, 2017, 7164790. [Google Scholar] [CrossRef] [Green Version]
  22. Yu, Q.; Li, W.; Zhang, H.; Yang, D. Mobile phone data in urban customized bus: A network-based hierarchical location selection method with an application to system layout design in the urban agglomeration. Sustainability 2020, 12, 6203. [Google Scholar] [CrossRef]
  23. Yu, Q.; Li, W.; Yang, D.; Zhang, H. Mobile Phone Data in Urban Commuting: A Network Community Detection-Based Framework to Unveil the Spatial Structure of Commuting Demand. J. Adv. Transp. 2020, 2020, 8835981. [Google Scholar] [CrossRef]
  24. Gan, T.; Li, W.; He, L.; Li, J. Intracity Pandemic Risk Evaluation Using Mobile Phone Data: The Case of Shanghai during COVID-19. ISPRS Int. J. Geo-Inf. 2020, 9, 715. [Google Scholar] [CrossRef]
  25. Huang, Z.; Ling, X.; Wang, P.; Zhang, F.; Mao, Y.; Lin, T.; Wang, F.Y. Modeling real-time human mobility based on mobile phone and transportation data fusion. Transp. Res. Part C Emerg. Technol. 2018, 96, 251–269. [Google Scholar] [CrossRef]
  26. Kraemer, M.U.; Sadilek, A.; Zhang, Q.; Marchal, N.A.; Tuli, G.; Cohn, E.L.; Hswen, Y.; Perkins, A.; Smith, D.L.; Reiner, R.C., Jr.; et al. Mapping global variation in human mobility. Nat. Hum. Behav. 2020, 4, 800–810. [Google Scholar] [CrossRef]
  27. Yu, Q.; Zhang, H.; Li, W.; Song, X.; Yang, D.; Shibasaki, R. Mobile phone GPS data in urban customized bus: Dynamic line design and emission reduction potentials analysis. J. Clean. Prod. 2020, 272, 122471. [Google Scholar] [CrossRef]
  28. Li, W.; Cheng, X.; Duan, Z.; Yang, D.; Guo, G. A framework for spatial interaction analysis based on large-scale mobile phone data. Comput. Intell. Neurosci. 2014, 2014, 363502. [Google Scholar] [CrossRef] [PubMed]
  29. Li, J.; Li, J.; Yuan, Y.; Li, G. Spatiotemporal distribution characteristics and mechanism analysis of urban population density: A case of Xi’an, Shaanxi, China. Cities 2019, 86, 62–70. [Google Scholar] [CrossRef]
  30. MOHURD. Code for Design of Urban Road Traffic Facility (GB50688-2011); China Planning Press: Beijing, China, 2011.
  31. MOHURD. Guideline for Planning and Design of Urban Pedestrian and Bicycle Traffic Systems; China’s Ministry of Housing and Urban-Rural Development: Beijing, China, 2013.
  32. Department of Housing and Urban-Rural Development of Zhejiang Province. Code for Planning and Design of Pedestrian Crossing Facilities on Urban Streets (DB33/1058-2008); Department of Housing and Urban-Rural Development of Zhejiang Province: Hangzhou, China, 2008.
  33. Yue, W.; Chen, Y.; Zhang, Q.; Liu, Y. Spatial explicit assessment of urban vitality using multi-source data: A case of Shanghai, China. Sustainability 2019, 11, 638. [Google Scholar] [CrossRef] [Green Version]
  34. Yi, D.; Yang, J.; Liu, J.; Liu, Y.; Zhang, J. Quantitative identification of urban functions with fishers’ exact test and POI data applied in classifying urban districts: A case study within the sixth ring road in Beijing. ISPRS Int. J. Geo-Inf. 2019, 8, 555. [Google Scholar] [CrossRef] [Green Version]
  35. Hu, Y.; Han, Y. Identification of urban functional areas based on POI data: A case study of the Guangzhou economic and technological development zone. Sustainability 2019, 11, 1385. [Google Scholar] [CrossRef] [Green Version]
  36. Li, W. Analysis on Individuals’ Activity Space Based on Mobile Phone Data. Ph.D. Thesis, Tongji University, Shanghai, China, 2018. [Google Scholar]
  37. Yin, L.; Lin, N.; Zhao, Z. Mining daily activity chains from large-scale mobile phone location data. Cities 2021, 109, 103013. [Google Scholar] [CrossRef] [PubMed]
  38. Yoo, E.H. How short is long enough? Modeling temporal aspects of human mobility behavior using mobile phone data. Ann. Am. Assoc. Geogr. 2019, 109, 1415–1432. [Google Scholar] [CrossRef]
  39. Yang, W.; Chen, H.; Wang, W. The path and time efficiency of residents’ trips of different purposes with different travel modes: An empirical study in Guangzhou, China. J. Transp. Geogr. 2020, 88, 102829. [Google Scholar] [CrossRef]
  40. Cui, B.; Boisjoly, G.; Miranda-Moreno, L.; El-Geneidy, A. Accessibility matters: Exploring the determinants of public transport mode share across income groups in Canadian cities. Transp. Res. Part D Transp. Environ. 2020, 80, 102276. [Google Scholar] [CrossRef]
Figure 1. Urban road network of (a) New York, (b) Seoul, and (c)Shanghai.
Sustainability 13 13256 g001
Figure 2. Reclassification of points of interest (POIs) in pedestrian crossing demand measurement.
Sustainability 13 13256 g002
Figure 3. Reclassification of POIs in function identification of road sections.
Sustainability 13 13256 g003
Figure 4. Illustration of excluding POIs near intersections.
Sustainability 13 13256 g004
Figure 5. Illustration of associating POIs to road section.
Sustainability 13 13256 g005
Figure 6. Target road sections.
Sustainability 13 13256 g006
Figure 7. Target road sections with different functions.
Sustainability 13 13256 g007
Figure 8. Activity intensity of different regions in weekdays and positions of target road-sections.
Sustainability 13 13256 g008
Figure 9. Activity intensity of different regions in weekends and positions of target road-sections.
Sustainability 13 13256 g009
Table 1. Pedestrian crossing demand intensity of five road sections.
Road SectionPedestrian Crossing Demand Intensity
Section of Changle Road2.894
Section of Huashan Road2.081
Section of Middle Huaihai Road2.696
Section of Changning Road2.394
Section of Changshou Road4.808
Publisher’s Note: MDPI stays neutral with regard to jurisdictional claims in published maps and institutional affiliations.

