Abstract
The coordinated development of the territorial spatial pattern and its function is an important prerequisite for the realization of regional high-quality development. This paper aims to reveal the evolutionary characteristics of the spatial–temporal pattern and the coupling coordination level of the “production-living-ecological” spaces (PLES) in Jilin Province from 1998 to 2018 by using the entropy method, a coupling coordination model and spatial analysis methods, and proposes the optimization paths for the four regions of the province. The results indicate that the scale of the ecological space was the largest, mainly concentrated in the eastern region. The production space was mainly concentrated in the central and western regions, and the scale of the living space was the smallest, but increased slightly, mainly concentrated in the central regions. The PLE functions in every county and city are at the coupling coordination levels of mild and moderate imbalance. Eastern Jilin should take the ecological function as the lead, and should improve the production and living functions; Central Jilin should maintain the production and living functions and improve the ecological function; Western Jilin should strengthen ecological restoration and accelerate the transformation and development of the green production function. This study can provide references for the optimization of the provincial territorial space layout in order to improve the regional territorial space coordination and sustainable development.
1. Introduction
The process of the spatial pattern and function evolution of land is also the process of interaction between humanity and the land [1]. With economic and social development, the imbalance between urban and rural development has become increasingly prominent, especially in developing countries, such as the continuous outflow of the rural population [2], the low efficiency of land use [3], increasingly serious urban disease [4], and the hollowing out of rural areas [5], etc. In 2015, the United Nations created a set of sustainable development goals (SDGs) to respond to the above problems [6]. As the national old industrial base, Northeast China is currently facing many challenges, with an unbalanced spatial structure and inefficient use. However, Jilin Province has experienced relatively slow economic and social development in recent years, and is facing a serious phenomenon of population outflow. According to the seventh national census, the total population of Jilin Province decreased by 0.34 percent in 2020 compared with 2010. As a “Big granary”, Jilin Province shoulders the heavy responsibility of ensuring national food security. Therefore, more attention should be paid to the “Work on agriculture, rural areas and farmers” in order to vigorously promote the development of agriculture, rural areas and farmers, and to strive to achieve the development goals of “intensive and efficient production space, livable and moderate living space, and beautiful ecological space” [7]. The National Strategy for rural revitalization put forward at the 19th National Congress of the Communist Party of China emphasizes “Persisting in resource conservation and environmental protection, and firmly following the path of civilized development with production development, a better life and a good ecological environment” [8]. In 2018, the general requirements of “Industry prosperity, ecological livability, rural civilization, effective governance and well-off life” were put forward, and this was the concrete embodiment of the “Five-in-one” overall layout of economic, political, cultural, social and ecological civilization construction in the construction of socialism with Chinese characteristics in rural development [9].
The research of PLES is an important part of territorial space planning, and it is an interdisciplinary study of ecology, geography, planning and so on [10]. The concept of PLES originated from the multifunctional classification system of agriculture in the European Union [11,12], with the in-depth research of biologists and geographers; the classification system of ecosystem functions and the classification system of landscape functions were first developed in foreign countries, and the multifunction study on land use has also gradually been favored by scholars at home and abroad [6,10]. For example, Groot and other scholars hold that natural and semi-natural ecosystems have many functions and values, such as a regulating function, habitat function, production function, information function and carrier function [13]; Willemen et al. quantified seven landscape functions, such as residential, cultural heritage and tourism, and believed that there were three interactions: conflict, synergy and compatibility [14]; Paracchini et al. constructed an index system-combined multifunction of land use to evaluate economic, social and environmental issues in order to study sustainable development policies in the European region [15]; Ricketts et al., found that small areas with the productive ecological function rely on local ecological values to provide production services [16].
From the concept of PLES, production space refers to the area that can provide industrial products, agricultural products and service products for human beings, with the functions of food supply, industrial production, raw material production, etc. Living space is a kind of land with the function of carrying people’s daily life, recreation and some special purposes, which provides a social security function and leisure function for people. Ecological space is the area that can directly or indirectly provide an ecological regulation function and ecological service value, and has its own capacity of self-regulation, repair, maintenance and development, and ES has the main functions of adjustment, support, purification, carrying, perch and so on [17,18].
The PLES do not exist in isolation. They are closely connected and affect each other, and the coordinated development of the PLES plays an important role in balancing the regional spatial structure and ensuring the regional stability and development. Coupling originated from physical science, referring to the phenomenon that multiple systems influenced each other through their own or external interactions. Coordination refers to the close degree of coordination among multiple systems, which reflects the whole “efficacy” or “synergy” [19]. The coupling coordination model quantifies the coordination effect, and it can reflect the coordination effect of every element in the system accurately [6]. At present, the coupling coordination degree model has been gradually improved and widely used in the fields of geography, environmental science, ecology and other disciplines. The research topics include urbanization and the ecological environment [20], population and land urbanization [21], tourism and the environment [22], and other aspects. However, research on the coupling coordination of the PLES is still rare, which has gradually attracted the attention of scholars in recent years. It is essential to better understanding the coupling coordination relation among PLE functions in the achievement of the goal of regional sustainable development, which is the key research topic and hot research frontier of the international man–land system science and sustainable development sciences [23].
At present, many domestic scholars have carried out research on PLES from many aspects of connotation discrimination [18], land-use classification systems [24], evolution characteristics [25], function coordination [26], driving force analysis [27] and evaluation optimization [28]. For example, Liu Jilai and other scholars established the PLES classification system and studied the evolution characteristics of the PLES pattern in China [29]. Li Guangdong et al. constructed the urban PLE function classification system from the perspective of the integration of land functions, ecosystem services and landscape functions, and integrated the calculation function group of the spatial function value based on the evaluation of the ecosystem service value [7]. Wang Cheng et al., analyzed the spatial-temporal characteristics and the pattern evolution of the coupling coordination of rural PLE function in Chongqing using the coupling coordination degree model [26]. Existing studies were carried out at multiple scales, including the national [29], provincial [30], municipal [31], county [32], village [33] and urban agglomeration scales [34]. However, most of them were concentrated in economically developed areas or areas with historical and cultural characteristics. Therefore, there is little research on the PLES in Jilin Province, and most of the existing research focuses solely on the evolution of the PLES pattern or the level of the PLES functional coupling coordinated development in a specific region. There is a lack of comprehensive research both to comprehensively measure the current situation and the sustainable development direction of the coordinated development of regional PLES.
The study of spatial development in Jilin Province can be a reference for the optimization of the territorial space in Northeast China, and can provide a case for land use planning at the provincial scale with a view to applying the relevant methods to other provinces at home and abroad. In China, it is of great theoretical and practical significance for the coordinated development of urban and rural areas, the Northeast Area Revitalization Plan, and the implementation of the strategy of rural revitalization. Based on the data of the land use status in 1998, 2008 and 2018 in Jilin Province, this paper studied the spatial–temporal pattern evolution characteristics in the PLES and the coupling coordination level of the production–ecological function in Jilin Province by using the entropy method, dynamic attitude of land use, spatial autocorrelation, cold hot spot analysis and a coupling coordination degree model to identify the basic development characteristics and coordination state of PLES, and took the result as the basis of the division of the optimized region. Then, the zoning optimization was carried out and targeted, and feasible optimization recommendations were proposed give full play to advantages of the different functions to maximize benefits of land resources, in order to provide reference strategies for Jilin Province to realize the rational utilization, coordinated development and regional sustainable development of land resources.
2. Materials and Methods
2.1. Study Area
Jilin Province is located in the central part of Northeast China (Figure 1), and covers a total area of 187,400 square kilometers, spanning 121° 38′~131° 19′, 40° 50′~46° 19′; it currently has jurisdiction over 1 sub-province-level division, 7 prefecture-level cities, Yanbian Korean Autonomous Prefecture, and the Changbai Mountain Protection and Development Zone Management Committee. Jilin Province, as an old national industrial base, has automobile, petrochemical and agricultural product processing as its three major pillar industries; as an important national black soil conservation area and commercial grain base, Jilin Province plays an important role in ensuring national food security. Yushu, Nong’an, Gongzhuling and 13 other top-100 grain counties are all located in Jilin Province. In 2020, the grain planting area of Jilin province was 5.6818 million hectares, and the total grain output reached 3.803 million tons, accounting for 5.68 percent of the national total. The topography of Jilin Province is characterized by a high elevation in the southeast and a low elevation in the northwest. The Songliao Plain in the middle is fertile and rich in grain. The eastern part is the Changbai Mountain area, which is an important ecological barrier. The western part is an ecotone between agriculture and animal husbandry, and its ecological environment is relatively fragile [35]. Considering the adjustment and changes of the administrative territorial entity during the study period, in order to maintain the integrity of the research unit, this study unified the municipal districts of each city into a single research unit, and reorganized a total of 47 research units including 8 urban areas, 20 county-level cities and 19 counties.
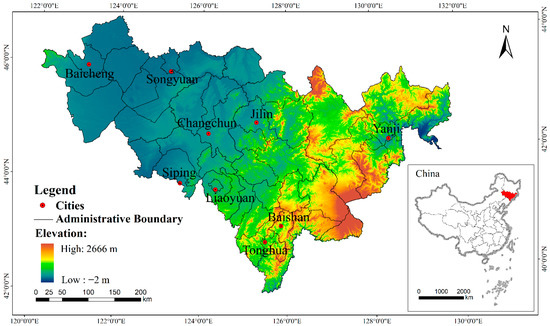
Figure 1.
Schematic diagram of the study area location.
2.2. Data Sources
In this paper, the land use status data in Jilin Province in 1998, 2008 and 2018 were provided by Jilin Institute of Land and Resources Survey. The elevation data comes from Geographic Science and Resources, Resources and Environment Science, and the Data Center in the Chinese Academy of Sciences Institute (https://www.resdc.cn/data.aspx?DATAID=284, accessed on 11 August 2021) [36]. The social and economic data comes from the “Statistical Yearbook of Jilin Province”, the “Statistical Yearbook of China’s Counties”, the “Statistical Bulletin of National Economy and Social Development of Jilin Province” and the statistical yearbooks of the other cities and states [37].
2.3. Research Method
In this paper, the PLES land-use classification system was constructed, the land use statuses in Jilin Province were reclassified, and the number of PLES were analyzed; then, the change trend was studied according to the land use dynamic degree, and the spatial distribution was carried out by using spatial autocorrelation. Moreover, the paper constructed the evaluation index system of PLE functions, calculated the score of each function by using the comprehensive evaluation model, analyzed the coupling coordination level among three functions and between two functions by using the coupling coordination degree model, and studied the spatial distribution of the coordination level by using hot spot analysis. Finally, the optimization strategies were proposed as references based on the research results.
2.3.1. Classification System of the Land Use in PLES
The study of the land-use classification of “production-living-ecological spaces” is the basis of territorial space planning and management [24]. The production space is related to the industrial structure, and is an area with the leading function of providing industrial products, agricultural products and service products [18], including cultivated land, garden land, commercial service land, and industrial, mining and storage land. The living space refers to the land which has the functions of carrying people’s daily life, rest, entertainment, and some special purposes [24], including residential land, public management and public service land, and special land, etc. The ecological space is a land type which can directly or indirectly provide ecological regulation, biological support, and other ecological services. It has types of land with self-adjustment, self-restoration, self-maintenance and self-development capabilities [29], including woodland, grassland, water areas, and other land. The three are interrelated and closely linked. The ecological space is the basis of human existence, which forms the “Base of the Map” between the productive space and the living space, from which human beings constantly demand products and services for production and living [38]. The living space is the main field of human activities, providing living, travelling, shopping and entertainment spaces to meet people’s basic living needs [1]. On the basis of the existing research results of PLES [24,25,29], the types of land use status are reclassified into three categories: production space, living space and ecological space (Table 1). The codes of the land use status are based on the Current Land Use Classification (National Standards of the People’s Republic of China GB/T 21010-2007) [39]. This land use classification standard passed the National Standard Review, and was officially issued and implemented in 2007.

Table 1.
PLES land-use classification system of Jilin Province.
2.3.2. Dynamic Degree of Land Use
The Dynamic Degree of Land Use is calculated by calculating the annual average change rate of the number of land use types between the end of the study period and the beginning of the study period [40], which can be used to measure the speed of land use change in different time scales [27]. The formula is shown as follows:
where K is the dynamic degree of a land use type; Ua and Ub are the quantity of a land use type at the beginning and the end of the study period, respectively; and T is the study period.
2.3.3. Evaluation Index System of PLE Functions
The land space is a multifunctional space which is divided into a productive function, a living function and an ecological function; it is the refinement and extension of the connotation of land space [32]. The PLE functions originate from PLES but are higher than the limitation of the PLES [41], and the function of land space also has the characteristics of functional superposition and multiple functions because of the priority of strength and weakness [42]. Based on the principles of scientificity, comparability, authenticity, typicality and the availability of data, this study selected the index according to the existing research results [7,26,43,44,45], and 17 indexes were selected to represent the three functions of land space. The production space has the functions of grain supply, industrial production, and raw material production, etc., such that the production function is represented by 6 indexes: per capita GDP; per capita cultivated land area; per capita output value of agriculture, forestry, animal husbandry and fishery; gross output value of the second industry; gross output value of the third industry; and the proportion of production space. The living space has the functions of carrying human daily life and social security, etc., such that the living function is represented by 6 indexes: the density of population, per capita construction land area, the density of traffic land, the number of students in primary and secondary schools, the number of hospital beds per 10,000 persons, and the proportion of living space. The ecological space has the functions of adjustment, support, purification, carrying, perch and so on, such that the ecological function is represented by 5 indexes: the forest coverage rate, the water coverage rate, the proportion of the bare surface area, the fertilizer application quantity, and the proportion of ecological space. The initial values of each index were standardized by non-zero transformation [46], and the weights of each index were assigned by the entropy method [34] (Table 2).
Table 2.
Evaluation index system of the PLE functions.
- (1)
- Data standardization
This study used the standardized method of non-zero transformation to process the original data in order to facilitate the later evaluation, and adopted Equations (2) and (3) in order to process the positive and negative index data, respectively [47]. Where Xij is the evaluation index data of the j item in the i evaluation unit, Xmax and Xmin, respectively, represent the maximum and minimum value of the original data of the j item, and the formula is shown as follows:
- (2)
- Weight determination by the entropy method
As one of the objective evaluation methods, the entropy method can reflect the comprehensiveness of the indicators and express the implicit information of the index elements [47]. Therefore, the entropy method of the objective weight method is used to assign weight to each index in order to eliminate the influence of subjective judgment. According to the standardized value Yij, the information entropy Eij of item j of evaluation unit i is calculated by using Equation (4), and then the weight Wij is calculated according to Equation (5). The formulae for Eij and Wij are shown below:
- (3)
- Construction of a comprehensive evaluation model
In order to facilitate the later research comparison, the comprehensive evaluation value of the PLE functions of each county in Jilin Province was calculated according to Equation (6). The formula is shown as follows [47]:
where Yij is the standardized value, Wij is the corresponding index weight, and Zi is the comprehensive evaluation value.
2.3.4. Coupling Coordination Model
The territorial space system is a dynamic composite giant system which is formed under the interaction of multi-factors [45]. There is a mutual promotion and mutual coercion between the territorial space functions [26]. Based on the improvement of the coupling coordination model and the application in the PLES field [26], the coupling coordination model of production-living-ecological functions and the coupling coordination models of production–living, production–ecological and living–ecological functions were constructed to measure the coordination relationship of the PLE functions in each county. The formula is as follows:
where C is the coupling degree of the PLE functions, and the value range is [0, 1]; Pi, Li and Ei are the comprehensive evaluation value (Equation (6)) of the production function, living function and ecological function, respectively, i ∈{1, 2, …, 47}; D is the coupling coordination degree of PLE functions, the range is [0, 1], and the larger the value is, the better the coordination level is; α, β and are undetermined coefficients of the production function, living function and ecological function, respectively. In this paper, it is considered that the three functions are of equal importance, such that the coefficients are determined as α = β = = 1/3. If only the coupling coordination degree of the two functions was calculated, the following formula was used:
In order to better reflect the coupling coordination degree among the subsystems, the coupling degree and coupling coordination degree were divided into the following types according to the previous research [6,23,38,40] (Table 3).
Table 3.
Classification of the coupling coordination degree of the PLE functions.
2.3.5. Spatial Autocorrelation Analysis
- (1)
- Global Moran’s I Index and Local Moran’s I Index
The global spatial autocorrelation and the local spatial autocorrelation were used to study the spatial clustering characteristics of PLES in Jilin Province in this paper. This study used ArcGIS 10.6 to calculate the Global Moran’s I Index, and used GeoDa to calculate the Local Moran’s I index.
Global Moran’s I can show whether different spatial units are aggregate, discrete or random in global space. The Global Moran’s I Index Ranges From −1 to 1. At a given level of significance, if the Global Moran’s I index is positive, the spatial correlation is positive; if it is negative, it is spatially negative correlation; if it is close to zero, it is a random distribution [46].
Local Moran’s I can effectively analyze the spatial difference and its significance level between different spatial units and their adjacent regions. As with Global Moran’s I, when I > 0, there is a strong positive spatial autocorrelation between the observed attributes of the regional spatial unit and its adjacent spatial units, showing local spatial clustering; when I < 0, there is a strong negative spatial autocorrelation, showing local spatial dispersion. The Moran scatter plot—a type diagram of Local Indicators of Spatial Association (LISA)—can represent the spatial autocorrelation level of the Local Moran’s I. In the diagram, the observed values of quadrant 1 and quadrant 3 indicate that the attributes of a region and its adjacent regions have a high (low) degree of aggregation effect, such that the attributes of the adjacent regions tend to be consistent, and the observed values of quadrant 2 and quadrant 4 indicate that the attributes of a region differ greatly from those of the adjacent regions [48,49]. LISA’s statistical test results usually include four types: high–high (HH), high–low (HL), low–high (LH) and low–low (LL) [50]. The formula is as follows [47]:
where n is the number of units; xi and xj represent the property values of the units i and j; and Wij is a spatial weight coefficient matrix, which represents the neighborhood relationship of the spatial elements; .
- (2)
- Hot Spot Analysis
By using the Hot Spot Analysis Tool in ArcGIS 10.6, the hot spot and cold spot regions of the coordination degree of the PLE functions in each county of Jilin Province are visualized [19], and the clustering of the high value (hot spot) and low value (cold spot) is revealed.
3. Results
3.1. Evolution Characteristics of the PLES Spatial–Temporal Pattern in Jilin Province
3.1.1. Characteristics of the PLES Land Use Dynamic Degree Change
This paper reclassified the land types of the current land use status from 1998 to 2018 based on the PLES land-use classification system of Jilin Province (Table 1), and calculated the area of the production space, living space and ecological space. On the whole, the scale of the ecological space in Jilin Province was the largest, followed by the production space and then the living space. In the past two decades, the ecological space area gradually decreased from 69.57% in 1998 to 56.29% in 2018, and the living space area increased slightly, from 3.95% in 1998 to 4.36% in 2018. The area of the production space did not change much in the first decade, but increased significantly in the last decade, from 31.95% in 2008 to 39.39% in 2018 (Figure 2).
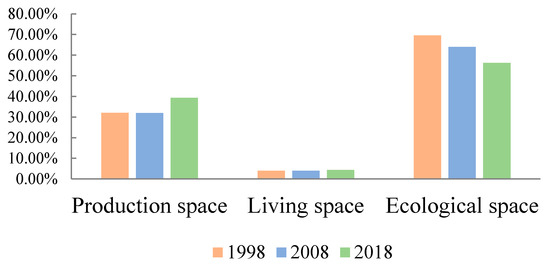
Figure 2.
The change of the proportion of PLES in Jilin Province during 1998–2018.
In this paper, the area data of the production space, living space and ecological space were substituted into the land use dynamic attitude model (Equation (1)) to reflect the growth rate or decrease rate of the PLES in this period (Table 4). The results showed that, from 1998 to 2018, 87% of the counties in Jilin Province showed an increase in production space, and 13% showed a decrease; the largest growth rate was 5.59% in Zhenlai County, and the largest reduction rate was −1.29% in Baishan urban area. In total, 79% of the counties in Jilin Province showed an increasing trend, and 21% showed a decreasing trend in living space. Among them, the largest rate of increase was 3.37% in Changchun urban area, and the largest rate of reduction was −2.77% in Zhenlai County. In total, 15% of the counties in Jilin Province showed an increasing trend, and 85% of the counties showed a decreasing trend in ecological space. Among them, the largest rate of increase in Longjing City was 0.31%, and the largest rate of decrease in Taonan City was −2.95%.
Table 4.
The land use dynamics degree of PLES in Jilin Province during 1998–2018.
3.1.2. Characteristics of the Spatial Distribution Pattern of PLES
This paper used ArcGIS 10.6 to visualize the proportion of the PLES in 1998, 2008 and 2018, and divided them into five classes by the natural break point method. From the distribution map of the PLES area proportion in Jilin Province (Figure 3), it can be seen that the spatial distributions of production, living and ecological spaces have the following characteristics: (1) As can be seen from the distribution maps of the proportion of production space in 1998, 2008 and 2018, the production space in Jilin Province was mainly concentrated in the central region, and the proportion of production space in the western region was also increasing in recent years. In 1998 and 2008, the production space was concentrated in the areas with faster economic and social development, and more developed secondary and tertiary sectors of the economy, including the urban areas of Changchun urban area, Songyuan urban area and Baicheng urban area, as well as the primary industry−led food production in the major counties, namely Nong’an County, Yushu City, Dehui City, Lishu County, Yitong County, Gongzhuling City and Fuyu City. From 2008 to 2018, the area of paddy fields, dry land, grassland and saline–alkali land increased rapidly due to the degradation of a large number of swamps and wetlands in the western region of Jilin Province [51], which led to the increase of the proportion of production space in the Western Region of Jilin Province, such as Qianguo County, Zhenlai County, Qian’an County and Taonan City, etc. (2) As can be seen from the distribution maps of the proportion of production space in 1998, 2008 and 2018, it is obvious that the living space was mainly concentrated in Changchun City, Jilin City, Siping City and Liaoyuan City of central Jilin Province. As the central region was located in the Northeast China Plain, flat terrain and the Songhua River basin, as well as the livable and high degree of population concentration, the urbanization was increasing rapidly. Changchun City and Jilin City, as the two big cities of Jilin Province, were the economic uplift belt of Jilin Province, and carried out the important responsibility of economic development, with complete public facilities and convenient transportation. As the third largest city in Jilin Province, Siping Ciry was the pivot city of the innovation and transformation core area in the central part of Jilin Province, attracting a large proportion of the labor force. The proportion of the living space of the counties and districts in Liaoyuan City was increasing. (3) As can be seen from the distribution maps of the proportion of production space in 1998, 2008 and 2018, it was obvious that the ecological space distribution of Jilin Province is mainly concentrated in the eastern and western regions, but the proportion was decreasing in the past 20 years. Changbai County, Linjiang City, Fusong County, Helong City, Wangqing County and Antu County in the eastern part of Jilin Province were national nature reserves because they were located in the Changbai Mountain region. They attached importance to ecological environment protection, had superior ecological conditions, and occupied a relatively high proportion of ecological space. Due to the influence of natural factors and human activities, land salinization, desertification and other land degradation phenomena were obvious in the west of Jilin Province. Large areas of wetland loss were mainly distributed along the coast of the Nen River, Songhua River, Chagan Lake, Moon Lake and other lakes. Part of the land was converted from ecological land to productive land; as a result, the proportion of ecological space in Zhenlai County, Taonan City, Tongyu County, Qian’an County, Qianguo County, Changling County and Shuangliao City declined.
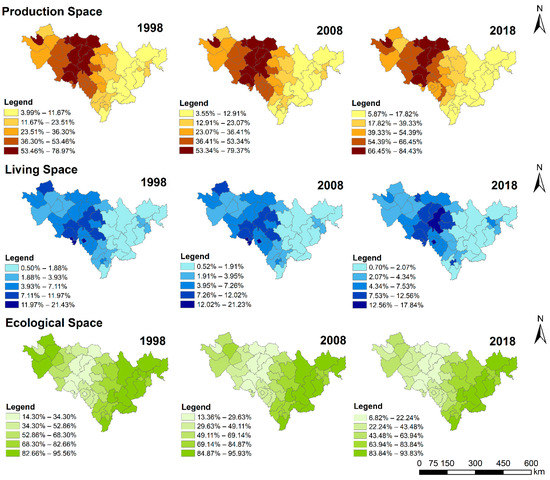
Figure 3.
Distribution map of the proportion of the PLES area in Jilin Province from 1998 to 2018.
3.1.3. Aggregation Characteristics of the PLES
By applying ArcGIS 10.6 and GeoDa 1.18 software, the Global Moran’s I index (Table 5) and Local Moran’s I index of the PLES’s proportion in Jilin Province in 1998, 2008 and 2018 were calculated, and their spatial correlation was tested.
Table 5.
Results of the Global Moran’s I Index of the PLES proportion from 1998 to 2018.
As can be seen from the table above, with a confidence level of 99%, the Global Moran’s I index of the proportion of the PLES in Jilin Province in 1998, 2008 and 2018 was positive, indicating the existence of spatial agglomeration in the PLES in Jilin Province, i.e., both the high-value region and the low-value region had the characteristics of spatial concentration distribution. Judging by the exponential trend, the Global Moran’s I Index of production space, living space and ecological space was positively correlated with the time change, and all of the indices showed an upward trend, which indicated that the Global spatial correlation was gradually strengthened. From the value of the index, the production space and ecological space were much larger than the living space, which indicated that there were more significant spatial agglomeration phenomena in the production space and ecological space. From the range of changes in different periods, both the production space and the living space changed slightly from 1998 to 2008, and the index value changed greatly from 2008 to 2018. However, the index values of ecological space changed greatly from 1998 to 2008, and slightly from 2008 to 2018.
In order to further clarify the spatial aggregation and spatial heterogeneity of the PLES’s proportion in each county of Jilin Province and its adjacent counties, a scatter plot and Lisa cluster plot were used to show the results of the local spatial correlation. Figure 4 and Figure 5 visually reflected the high-value and low-value clustering of the PLES proportion in each county of Jilin Province in study period. The scatter plot shows that there were many high–high and low–low types in the first and third quadrants, and fewer low–high and high–low types in the second and fourth quadrants. The distribution of four clustering cases can be clearly shown by using the Lisa Clustering Diagram: (1) The high–high type area means that the area had a high proportion of certain types of space, and the surrounding area also had a high proportion. In the study period, there were 11 counties of this type, and the high-value areas were concentrated in the flat and well-developed central plain area and the neighboring cities of Fuyu City, Qianguo County and Changling County. In 1998 and 2008, there were two counties with this type of living space, and the proportion increased to five counties in 2018. The high-value areas were first concentrated in Dongliao County and Lishu County, and gradually expanded northward over time, adding Changchun urban area, Nong’an County, Gongzhuling City and Yitong County. Dongliao County was still in this category while Lishu County was out. During the study period, the proportion of ecological space in this type of county and district was 10, 16 and 15, respectively, and the high-value region was concentrated in the eastern Changbai Mountain area with excellent ecological environment and rich ecological resources. (2) The low–low type area means that the specific gravity of a certain type of space in this area was low, and the surrounding area was also low. In 1998 and 2008, the proportion of production space in this type of district was 11; in 2018 it increased to 15, and all concentrated in the east, indicating that the production space in the east was small. In 1998 and 2008, the number of counties with living space of this type was 12, which decreased to 6 in 2018. In 2009, the construction of the pilot district for the development and opening of Changjitu became a national strategy, and the Yanbian Korean Autonomous Prefecture grew rapidly, attracting a large number of industries and people, such that living space increased. There were 11 low-value areas in the ecological space, and they were concentrated in the central area, which was suitable for production and living. (3) The low–high type area means that the area had a low proportion of certain types of space, and the area around it had a high proportion. This type of region was relatively rare. The proportion of production space in 1998 and 2008 and the proportion of living space in 2018 in Shulan City belonged to this category. (4) The high–low type area means that the area had a high proportion of certain types of space, and the area around it had a low proportion. There were also fewer such areas. Only the proportion of ecological space in Shulan City in 2008 and 2018 belonged to this category, which indicates that the scale of ecological space in Shulan was relatively large.
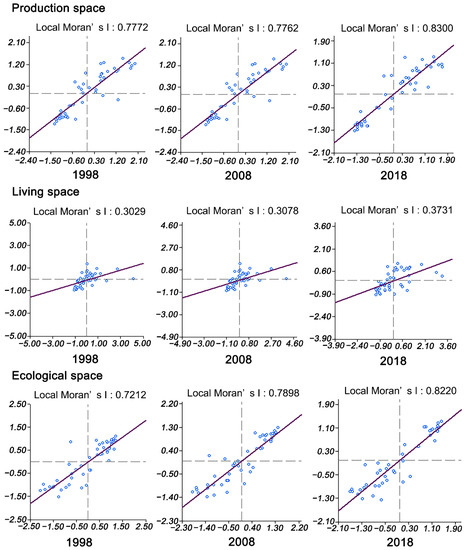
Figure 4.
Scatter plot of the proportion of the PLES in Jilin Province from 1998 to 2018.
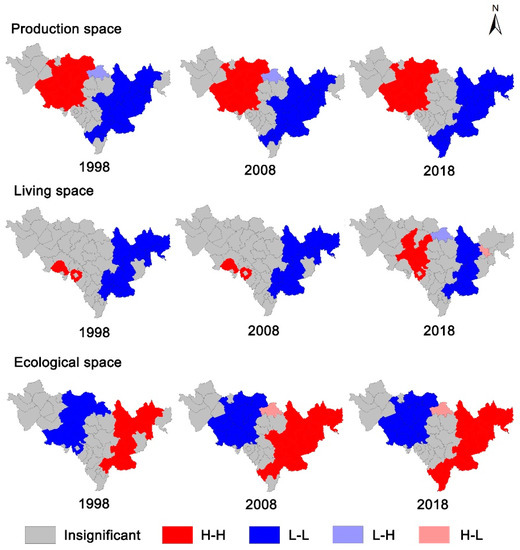
Figure 5.
Lisa cluster maps of the PLES in Jilin Province from 1998 to 2018.
3.2. Coupling Coordination of the PLE Functions in Jilin Province
3.2.1. Coupling Coordination Result
The coupling coordination reveals that the factors influence each other in the time scale and space scope, such that each system evolves from disorder to order, promotes synergistically, and controls the characteristics and rules of system development [51]. Firstly, according to the evaluation index system of PLE functions (Table 2) and the weight of each index, the evaluation values of the PLE functions of each research unit were calculated by using Equation (6) (Table 6).
Table 6.
The evaluation values of the PLE functions of each county in Jilin Province.
The coupling coordination degrees of the PLE functions in each county in Jilin province were calculated by substituting the results into the coupling coordination degree model (Equations (7) and (8)). This paper used ArcGIS 10.6 to visualize the coupling coordination degrees of 47 study areas, and divided them into five classes by the natural break point method. The results showed that the mean value of the coupling coordination degree of the PLE functions in Jilin Province decreased from 0.3109 (slightly uncoordinated) in 1998 to 0.2981 (moderately uncoordinated) in 2008, and then increased to 0.3163 (slightly uncoordinated) in 2018 (Table 7). This indicated that the coordination of PLE functions in Jilin Province decreased around 2008 due to the rapid economic and social development, rapid urban sprawl, imbalance in land resource distribution and other factors. From the spatial distribution (Figure 6), the coupling coordination level of the PLE functions in each county of Jilin Province presented distinct regional differentiation. From 1998 to 2018, the level of coupling coordination of the PLE functions showed a spatial distribution pattern of “high in the east and west, low in the east; high in the plain and low in the mountain”.
Table 7.
The results of the coupling coordination degree of the PLE functions in 1998–2018.
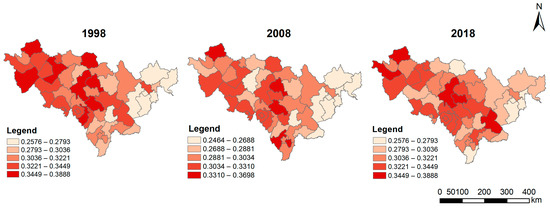
Figure 6.
Distribution map of the coupling coordination degree of the PLE functions in Jilin Province from 1998 to 2018.
According to the calculation results of the coupling coordination degree model between the two functions constructed in Equations (9)–(12), the results show that the coupling coordination degrees in the counties and districts in 1998, 2008 and 2018 were between 0.24 and 0.39, and there were two types of moderate incoordination and slight incoordination (Table 8). The coupling coordination degrees between the two functions showed that, in 1998, 2008 and 2018, the production–living function coupling coordination degrees were between 0.19 and 0.48. There were four types, i.e., severely uncoordinated, moderately uncoordinated, slightly uncoordinated and on-the-verge-of-uncoordinated. The coupling coordination degrees of the production–ecological function were between 0.22 and 0.41, and there were three types: moderately uncoordinated, slightly uncoordinated and on-the-verge-of-uncoordinated. The coordination degrees of the living–ecological function coupling were between 0.21 and 0.40, and there were two types: moderately uncoordinated and slightly uncoordinated. The evolution of the coupling coordination degrees of some districts and counties showed fluctuation, such as Nong’an County, Shulan City, Tonghua urban area, Yitong County and Tonghua County, from slight to moderate to slight incoordination. However, Yushu City and Changling County experienced a “regression” from slightly to moderately uncoordinated; the coupling coordination degree of the urban areas of Dehui City, Jiaohe City and Baishan urban area improved, from moderately to slightly. The stability of the coupling coordination degrees of some counties and districts over time were slightly uncoordinated or moderately uncoordinated types: areas such as Changchun urban area, Jilin urban area, Yongji County, Huadian, and other 17 counties and districts all belonged to the slightly uncoordinated type; Liuhe County, Ji’an City, Jingyu County, Tumen City, Hunchun City and other 10 counties and districts all belonged to the moderately uncoordinated type.
Table 8.
The proportion of the coupling coordination degree types from 1998 to 2018.
3.2.2. Hot Spot Analysis Results of the Coupling Coordination Degree
Through the use of the ArcGIS 10.6 Hot Spot Analysis Tool, this paper visualized the clustering of hot spots and cold spots by the natural breakpoint method, which was used to analyze the coupling coordination degree of each county and district in Jilin Province in 1998, 2008 and 2018. As shown in Figure 7, the hotspots in 1998 were scattered in the central parts of Yongji County, Panshi City, Yitong County, Dongfeng County, Shulan City, and the western parts of Da’an City, Qian’an City and Changling County. In 2008, single-core reunions were observed in hot spots in Yongji County, Panshi City, Yitong County, Dongliao County, Meihekou City and Huadian City. The results showed that the PLE functions of these areas were relatively well coordinated in recent years, and it could balance the coordinating development of production, living and ecological functions. The hot spots of 2018 were scattered in western Jilin, in Da’an City, Zhenlai County, and Baicheng urban area, and Jilin urban area, Yongji County and Panshi City in the central part of Jilin Province. During the study period, the cold spots were all concentrated in the eastern part of China, with Yanji as the single core in 1998; the cold spots in 2008 showed a layered structure, and the cold spots were concentrated in Yanji City, Longjing City and Tumen City, from which they would spread out to the periphery. The cold spots showed a decreasing trend in 2018, but remained concentrated in the eastern regions of Yanji City, Tumen City, Longjing City, Helong City, Wangqing County and Hunchun City. Due to the limitations of natural conditions such as topography and geomorphology, the eastern region had a large number of mountainous forests, a beautiful environment and pleasant scenery, outstanding ecological function and a low level of production and living functions. Therefore, the coordination of the PLES functions of the counties and districts in the eastern region need to be improved.
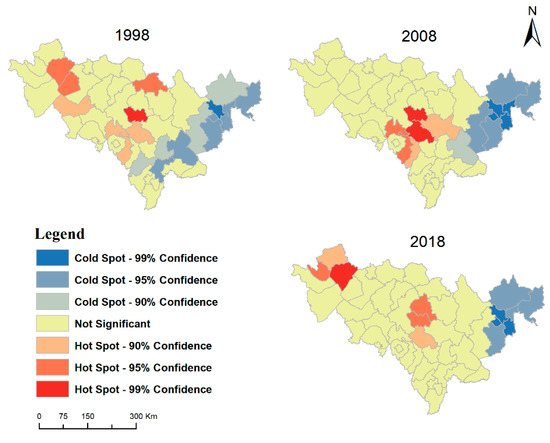
Figure 7.
Distribution of the cold and hot spots of the coupling coordination degree in Jilin Province from 1998 to 2018.
3.3. Division of the PLES Functions and Their Optimization Path in Jilin Province
The function of territorial space has the characteristics of function superimposition and multiple functions because of the priority of strength and weakness, but the forms and advantages of the different functions are different. Some functions reflect regional characteristics and play a decisive role in regional development, which are called the dominant function [42]. The dominant function is supplemented by other secondary functions to form a complete space. The core content of territorial planning is to analyze the cooperation and competition between ecological space and production space, to plan the pattern of territorial space development and protection while balancing efficiency and the living function [41]. According to the natural conditions and the development of the economy and society in various areas of Jilin province, this paper combined the results of the comprehensive evaluation of the PLES functions in 2018, the spatial–temporal evolution pattern of the PLES and the distribution characteristics of the coupling coordination degree, and divided Jilin Province into four functional zones in the way of “orientation + geomorphologic type + functional type”: the central plains and hills region of the productive and living complex functions area, the central-eastern hills region of the ecological and productive complex functions area, the eastern mountain region of the ecological-dominant and production-limited area, and the western plains region of the production-dominant and ecological-conservation area (Figure 8). Based on the advantages and characteristics of each functional area, the development, utilization, management and adjustment of PLES were planned as a whole to promote the coordinated development of the regional territorial space.
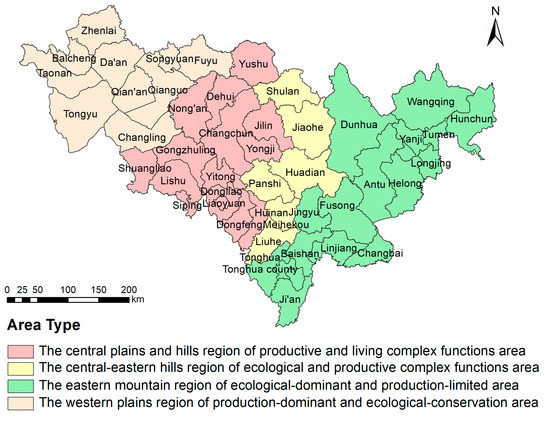
Figure 8.
Sketch map of the PLE functions area division in Jilin Province.
(1) Regarding the central plains and hills region of the productive and living complex functions area (relative average score 0.1369–0.1548–0.0688), the main features were that the production and living functions were dominant, and the ecological function needs to be improved, including 15 counties and cities, such as Changchun urban area and Jilin urban area. In these areas, the counties and cities had a rapid economic and social development, population gathering, complete public supporting facilities and well-connected transportation. There was large-scale industrial or agricultural land around, which was an important guarantee for economic and social development. However, there were some problems such as a low greening rate and environmental pollution, and the ecological quality needs to be improved. With Changchun City and Jilin City as the core to drive the rapid economic development of the surrounding areas, urban development should be rationally planned, the land in built-up areas should be used economically and intensively, and the large amount of cultivated land in suburban areas should be prevented from being occupied due to urban sprawl. The construction of urban green belts and parks should be enhanced, and the rate of urban greening should be increased to improve air quality; water quality should be improved, water pollution should be prevented and controlled, and the waters of Yitong River, Songhua Lake, etc., should be protected. Meanwhile, the central region was a black soil area rich in grain. The nine major grain producing counties in Yushu City, Nong’an County, Lishu County and Gongzhuling were all concentrated in the central part of Jilin Province. Therefore, full play should be given to the production function, and we should actively carry out the work of protecting the black land, take green agriculture as the leading factor, ensure the development of grain farming, and extend the relevant industrial chains, such as agricultural product processing, logistics and transportation, and the integration of agriculture and tourism. A high-quality corn and peanut industrial belt should be created, and agricultural product brands should be built to open up domestic and foreign markets.
(2) Regarding the central–eastern hills region of the ecological and productive complex functions area (relative average score 0.1053–0.0771–0.1260), the main feature was that the ecological and production function was dominant, and the living function needs to be improved, including five counties and cities such as Jiaohe City and Huadian City, etc. The forest coverage rate was high, the water systems of the Songhua River and Mudanjiang run through it, and the cultivated land area also had a large proportion. The important ecological resources—such as forest resources, water resources and biological resource—should be strictly protected, a stable ecological environment should be maintained, and the regional ecological protection and restoration in the process of resource development and utilization should be strengthened, as should the efforts of ecological environmental monitoring, to avoid the degradation of the ecological environment. Large-scale agriculture should be appropriately developed, solid steps to control agricultural non-point source pollution should be taken, the planting industry with distinctive features should be actively developed, and planting demonstration bases should be established with full impetus to the development of emerging industries. The development of aquaculture should be actively promoted, with aquatic products being vigorously developed, relying on the waters; special towns and eco-tourism resorts can be created according to local conditions in order to enhance the added value of the regional tertiary sector of the economy, improve the township style and enhance the quality of life.
(3) Regarding the eastern mountain region of ecological-dominant and production-limited area (relative average score 0.0621–0.0785–0.1574), the main features showed that the ecological function was prominent, and the production and living functions need to be improved, including 16 counties and cities, such as Yanji City and Dunhua City. There was a lot of ecological land such as forest land or marsh land in this area, which was of great significance for the maintenance of the ecological environment, protecting biodiversity and maintaining the ecosystem balance. Priority should be given to the protection of the ecological environment, and the development of methods which are damaging to ecological resources should be strictly restricted. In the permitted construction areas, the supporting facilities for urban and rural life should be improved, the efficiency of intensive land-use conservation should be raised, the quality of the living environment should be improved, and the tourism industry should be moderately developed; green transformation and development should be comprehensively sped up, actively building green industries. We should make use of the geographical advantages of the border ports to attract foreign capital to set up enterprises in the development zones, and thus increase employment and expand income; modern green agriculture should be actively constructed, creating industrial bases and introducing pollution-free agricultural products or green organic food.
(4) Regarding the western plains region of production-dominant and ecological-conservation area (relative average score 0.1536–0.1211–0.0803), the main features were that the production function dominates, with the subordination of the living function, and the ecological function needs to be improved, including 10 counties and cities, such as Songyuan urban area and Baicheng urban area. The habitats in these areas were fragile. In recent years, the ecological function declined. A large amount of ecological land was transferred to productive land, and the scale of the cultivated land increased, but land degradation—such as land salinization and desertification—was serious. We should focus on land degradation, actively carry out ecological restoration work, deepen the implementation of the five-year action plan thoroughly for ecological protection and construction, return farmland to forests and grassland for conversion to wetlands, and strengthen the construction of ecological projects such as grassland, forestry and wetlands. We should adjust the agricultural structure, develop ecological agriculture and special agriculture, and vigorously support farmers to grow special cash crops. We should increase the added value of our products, establish large-scale demonstration production bases of agricultural products with distinctive features, and develop the intensive processing of agricultural products with distinctive features; Fuyu City, Changling County, Qian’an County and Qianguo County, as the national advanced counties in grain production, should strengthen the prevention and control of agricultural pollution, rationally apply organic fertilizer, prevent soil from sloughing, improve soil fertility, and increase the crop yield. In Songyuan region, we should exploit oil and other mineral resources properly, prevent and control the deterioration of the ecological environment, and pay attention to land rehabilitation after mining.
4. Conclusions and Discussion
The PLES classification system and the PLE functions’ comprehensive evaluation index system were established in this paper, and the land use status data were used for classification evaluation, combined with spatial analysis methods and the coupling coordination degree model. This paper analyzed the evolution characteristics of the PLES in Jilin Province and the changes of the coordination level, and provided a strategy for the coordinated development and spatial layout optimization of territorial space in Jilin Province, as well as a valuable reference for the territorial space planning. The main conclusions of this paper are as follows:
- (1)
- The ecological space scale was the largest, followed by the production space, and the living space scale was the smallest in Jilin Province. In the past two decades, the ecological space area gradually decreased from 69.57% in 1998 to 56.29% in 2018, and the living space area increased slightly from 3.95% in 1998 to 4.36% in 2018. The production space area showed little change in the first decade of the study period, increasing from 31.95% in 2008 to 39.39% in 2018.
- (2)
- The spatial distribution pattern of the PLES in Jilin Province showed a remarkable clustering feature, and there were many “high–high” and “low–low” types. The production space was mainly concentrated in the central region, and the proportion of the production space in the western region had been increasing in recent years. The living space was mainly concentrated in the central region of Jilin Province; the ecological space was mainly concentrated in the eastern region and the western region. There was a decreasing trend in the study period.
- (3)
- The PLES functions in each county of Jilin Province were in the coupling coordination level of being slightly and moderately uncoordinated, and the coordination needs to be improved. The coupling coordination degree showed the spatial differentiation characteristics of “high in the east and west, low in the east; high in the plain and low in the mountain”. Through the hot spot analysis, it was found that the hot spots were scattered in 1998, with a single-core reunion in 2008, and scattered in the western and central regions in 2018. The cold spots were all concentrated in the eastern part. Yanji City was taken as the single core in 1998, showing zonal distribution; the cold spots showed a layer structure in 2008, and a decreasing trend in 2018.
- (4)
- Jilin Province was divided into four areas in this paper: the central plains and hills region of productive and living complex functions area, the central–eastern hills region of ecological and productive complex functions area, the eastern mountain region of ecological-dominant and production-limited area, and the western plains region of production-dominant and ecological-conservation area. According to the characteristics and main problems of the different types of areas, this paper put forward the optimization methods to promote the coordinated development of the PLES.
The clarification of the law of the spatiotemporal evolution of the PLES; the exploration of the synergy effect of the production, living and ecological functions of the land space; and the coordination of the contradiction between the development needs of multi-interest subjects and the allocation of PLES resources is an important theoretical guide to promote the coordinated development of regional space, and also an important basis to promote the realization of the overall goal of the rural revitalization strategy in Jilin Province. The comprehensive evaluation of the PLES functions provided a decision-making reference for the division of the PLES, the compilation of territorial space planning, and the coordinated development of the territorial space. This paper had reference significance for the study of the optimized layout of territorial space in Jilin Province from the macro-scale, but the landscape pattern, structure and driving forces had not been studied at the micro-scale; the classification of the PLES land use did not fully consider its multifunctionality. The agricultural production function and the production function of the secondary and tertiary industries were not clearly distinguished. The optimized areas need to be refined in order to include more comprehensive features and solutions. In the future, the functional orientation and development direction of each county and township in Jilin Province will be studied in depth from the micro-scale, and the different development potentials of each region should be excavated. We should rely on the superior resources of Jilin Province to rejuvenate the industries and thus drive the region to realize the revitalization of industries, talents, culture, ecology and organizations; it will provide an effective program for the formulation of territorial space planning, and will promote regional sustainable development and the rational utilization of land resources.
Author Contributions
Conceptualization, L.W. (Lanyi Wei) and Y.Z.; methodology, L.W. (Lanyi Wei) and Z.C.; software, Z.C.; validation, Y.Z. and X.W.; formal analysis, L.W. (Lanyi Wei); resources, Y.Z.; data curation, L.W. (Lanyi Wei) and X.W.; writing—original draft preparation, L.W. (Lanyi Wei); writing—review and editing, Y.Z., L.W. (Lingzhi Wang) and X.M.; project administration, Y.Z.; funding acquisition, L.W. (Lingzhi Wang) and Y.Z. All authors have read and agreed to the published version of the manuscript.
Funding
This study was supported by National Natural Science Foundation of China (42101252) and Science and Technology Research Project of the Education Department of Jilin Province (JJKH20211131KJ).
Institutional Review Board Statement
Not applicable.
Informed Consent Statement
Not applicable.
Data Availability Statement
Not applicable.
Acknowledgments
Thank you to everyone who contributed to this study.
Conflicts of Interest
The authors declare no conflict of interest.
References
- Jiao, G.; Yang, X.; Huang, Z.; Zhang, X.; Lu, L. Evolution characteristics and possible impact factors for the changing pattern and function of “Production-Living-Ecological” space in Wuyuan county. J. Nat. Resour. 2021, 36, 1252–1267. [Google Scholar] [CrossRef]
- Guo, Y.; Zhou, Y.; Liu, Y. Spatial-temporal evolution of rural population outflow and its mechanism in China. Sci. Geogr. Sin. 2020, 40, 50–59. [Google Scholar] [CrossRef]
- Yu, S.; Zhao, M. Research status summary of domestic“three-life space”research based on bibliometrics. J. Guangzhou Univ. (Nat. Sci. Ed.) 2018, 17, 76–82. [Google Scholar]
- Zhang, Y. Urbanization in China and its eco-environmental effects: A review on the discussion of “2018 Chinese Humanities and Social Science Environment Forum”. J. Nanjing Tech Univ. (Soc. Sci. Ed.) 2019, 18, 1–10. [Google Scholar]
- Liu, Y.; Liu, Y. Progress and prospect on the study of rural hollowing in China. Geogr. Res. 2010, 29, 35–42. [Google Scholar]
- Wang, D.; Jiang, D.; Fu, J.; Lin, G.; Zhang, J. Comprehensive assessment of Production–Living–Ecological Space based on the coupling coordination degree model. Sustainability 2020, 12, 2009. [Google Scholar] [CrossRef] [Green Version]
- Li, G.; Fang, C. Quantitative function identification and analysis of urban ecological-production-living spaces. Acta Geogr. Sin. 2016, 71, 49–65. [Google Scholar]
- Zhu, M.; Zhuang, D.; Zhang, H.; Wen, J. Research on spatial differentiation and influencing factors of rural land use functions in the counties of Guangdong Province. China Land Sci. 2021, 35, 79–87. [Google Scholar]
- Li, X.; Hu, X.; Shi, Y.; Yang, H. The role of rural settlements in rural revitalization: Perspective of economic geography. Prog. Geogr. 2021, 40, 3–14. [Google Scholar] [CrossRef]
- Sun, Y.; Huang, R.; Chen, P.; Zhang, L. Classification and function evaluation of “production-life-ecology space” —— taking Jilin Province as an example. Jiangsu Agric. Sci. 2020, 48, 298–304+309. [Google Scholar] [CrossRef]
- European Commission. Safeguarding the Multifunctional Role of Agriculture: Which Instruments? DG Agriculture—European Commission: Brussels, Belgium, 1999. [Google Scholar]
- Yue, B. An Analysis on the EU’ s Multifunctional Agriculture. J. Huazhong Agric. Univ. (Soc. Sci. Ed.) 2006, 2, 31–34+50. [Google Scholar]
- De Groot, R. Function-analysis and valuation as a tool to assess land use conflicts in planning for sustainable, multi-functional landscapes. Landsc. Urban Plan. 2006, 75, 175–186. [Google Scholar] [CrossRef]
- Willemen, L.; Hein, L.; van Mensvoort, M.E.F.; Verburg, P.H. Space for people, plants, and livestock? Quantifying interactions among multiple landscape functions in a Dutch rural region. Ecol. Indic. 2010, 10, 62–73. [Google Scholar] [CrossRef]
- Paracchini, M.L.; Pacini, C.; Jones, M.L.M.; Pérez-Soba, M. An aggregation framework to link indicators associated with multifunctional land use to the stakeholder evaluation of policy options. Ecol. Indic. 2011, 11, 71–80. [Google Scholar] [CrossRef]
- Ricketts, T.H.; Daily, G.C.; Ehrlich, P.R.; Michener, C.D. Economic value of tropical forest to coffee production. Proc. Natl. Acad. Sci. USA 2004, 101, 12579–12582. [Google Scholar] [CrossRef] [PubMed] [Green Version]
- Duan, Y.; Xu, Y.; Huang, A.; Lu, L.; Ji, Z. Progress and prospects of “production-living-ecological” functions evaluation. J. China Agric. Univ. 2021, 26, 113–124. [Google Scholar]
- Huang, J.; Lin, H.; Qi, X. A literature review on optimization of spatial development pattern based on ecological-production-living space. Prog. Geogr. 2017, 36, 378–391. [Google Scholar] [CrossRef] [Green Version]
- Hua, X.; Jin, X.; Lv, H.; Ye, Y.; Shao, Y. Spatial-temporal pattern evolution and influencing factors of high quality development coupling coordination: Case on counties of Zhejiang Province. Sci. Geogr. Sin. 2021, 41, 223–231. [Google Scholar] [CrossRef]
- Jiang, Y.; Ci, F.; Shi, J.; Tang, Y. Study on the coupling development of new urbanization and ecological environment in Shandong Province. Ecol. Econ. 2021, 37, 106–112. [Google Scholar]
- Wang, F. Study on the quality measurement and coordinated development of population-land urbanization in Shandong Peninsula Urban Agglomeration. Sci. Geogr. Sin. 2020, 40, 1345–1354. [Google Scholar] [CrossRef]
- Tian, L.; Sun, F.; Zhang, Z.; Liu, Y. An empirical study on the coordinated development of tourism and resources environment in the Yellow River basin. J. Arid. Land Resour. Environ. 2021, 35, 196–202. [Google Scholar] [CrossRef]
- Yang, Y.; Bao, W.; Liu, Y. Coupling coordination analysis of rural production-living-ecological space in the Beijing-Tianjin-Hebei region. Ecol. Indic. 2020, 117, 106512. [Google Scholar] [CrossRef]
- Zou, L.; Wang, J.; Hu, X. An classification systems of Production-Living-Ecological Land on the county level: Theory building and empirical research. China Land Sci. 2018, 32, 59–66. [Google Scholar] [CrossRef]
- Kong, D.; Chen, H.; Wu, K. The evolution of “Production-Living-Ecological” space, eco-environmental effects and its influencing factors in China. J. Nat. Resour. 2021, 36, 1116–1135. [Google Scholar] [CrossRef]
- Wang, C.; Tang, N. Spatio-temporal characteristics and evolution of rural production living-ecological space function coupling coordination in Chongqing Municipality. Geogr. Res. 2018, 37, 1100–1114. [Google Scholar]
- Zhao, R.; Liu, X. Analysis on spatial-temporal changes and driving force of “Production-living-ecological” spaces in Beijing-Tianjin-Hebei Metropolitan Area. Ecol. Econ. 2021, 37, 201–208. [Google Scholar]
- Chen, Z.; Feng, X.; Hong, Z.; Ma, B.; Li, Y. Research on spatial conflict calculation and zoning optimization of land use in Nanchang City from the perspective of “three living spaces”. World Reg. Stud. 2021, 30, 533–545. [Google Scholar]
- Liu, J.; Liu, Y.; Li, Y. Classification evaluation and spatial-temporal analysis of “production-living-ecological” spaces in China. Acta Geogr. Sin. 2017, 72, 1290–1304. [Google Scholar]
- Kang, Q.; Guo, Q.; Ding, Y.; Zhang, Y. Tradeoffs/synergies analysis of “Production-Living-Ecological” functions in Shanxi province. J. Nat. Resour. 2021, 36, 1195–1207. [Google Scholar] [CrossRef]
- Zou, Y.; Zhang, S.; Xie, Y.; Du, Y. Spatial distribution and evolution characters of production-living-ecological spaces in Xuzhou city. Sci. Surv. Mapp. 2020, 45, 154–162. [Google Scholar] [CrossRef]
- Li, X.; Fang, B.; Yin, R.; Rong, H. Spatial-temporal change and collaboration/trade-off relationship of “production-living-ecological” functions in county area of Jiangsu province. J. Nat. Resour. 2019, 34, 2363–2377. [Google Scholar] [CrossRef]
- Lei, C.; Zhou, G.; Huang, Q.; Liu, C.; Zhou, Y. Spatial and temporal pattern of level Production-living-ecological Space in village of Duyun city. Res. Soil Water Conserv. 2021, 28, 380–386. [Google Scholar] [CrossRef]
- Li, H. Research on new urbanization coordinated development of Beijing-Tianjin-Hebei City Cluster based on the concept of “Production-living-ecology” space. Ecol. Econ. 2021, 37, 92–98. [Google Scholar]
- Li, J.; Zhang, P.; Guo, M. Spatial distribution and optimized reconstructing mode of rural settlement at the village scale of Jilin Province. Sci. Geogr. Sin. 2021, 41, 842–850. [Google Scholar] [CrossRef]
- Resources and Environment Science and Data Center, Institute of Geographic Science and Natural Resources Research. Available online: https://www.resdc.cn/Default.aspx (accessed on 11 August 2021).
- China Economic and Social Big Data Research Platform. Available online: https://data.cnki.net/NewHome/index (accessed on 13 May 2021).
- Huang, A.; Xu, Y.; Lu, L.; Liu, C.; Zhang, Y.; Hao, J.; Wang, H. Research progress of the identification and optimization of production-living-ecological spaces. Prog. Geogr. 2020, 39, 503–518. [Google Scholar] [CrossRef]
- National Standard of the People’s Republic of China. Classification of Current Land Using Situation. GB/T 21010-2007. 2007. Available online: http://std.samr.gov.cn/gb/search/gbDetailed?id=71F772D789F1D3A7E05397BE0A0AB82A (accessed on 25 May 2021).
- Liu, S.; He, S. A spatial analysis model for measuring the rate of land use change. J. Nat. Resour. 2002, 17, 533–540. [Google Scholar]
- Ma, S.; Huang, H.; Cai, Y.; Nian, P. Theoretical framework with regard to comprehensive sub-areas of China’s land spaces based on the functional optimization of production, life and ecology. Nat. Resour. Econ. China 2014, 27, 31–34. [Google Scholar]
- Li, X.; Yin, R.; Fang, B.; Li, Z.; Wang, D. Research on the functional zoning and regulation of Jiangsu Province’s territorial space based on the “Production-living-ecological” function. Resour. Environ. Yangtze Basin 2019, 28, 1833–1846. [Google Scholar]
- Kang, Q.; Guo, Q.; Qin, M.; Xu, C.; Zhang, M.; Zhao, C.; Zhang, Y. Spatio-temporal difference of coupling coordination degree of “production-living-ecological” functions in Shanxi Province. Jiangsu Agric. Sci. 2021, 49, 209–216. [Google Scholar] [CrossRef]
- Cheng, T.; Zhao, R.; Liang, Y. Production-living-ecological space classification and its functional evaluation. Remote. Sens. Inf. 2018, 33, 114–121. [Google Scholar]
- Niu, Y.; Wu, S.; Guo, C.; Zhuang, Q.; Xie, C.; Zhang, Z.; Luo, G. Analysis on the spatio-temporal changes and coupling coordination of the function of “production-living-ecological” in Xinjiang. Arid. Land Geogr. 2021. Available online: https://kns.cnki.net/kcms/detail/65.1103.X.20210622.1109.002.html (accessed on 25 May 2021).
- Li, Z.; Li, Y.; Wang, L.; Pei, Y. Study on the functional characteristics and division optimization of “Production-living-ecological” of geographical space in Yunnan Province. Ecol. Econ. 2021, 37, 94–101. [Google Scholar]
- Wei, X.; Zhao, Y.; Li, X.; Xue, C.; Xia, S. Characteristics and Optimization of Geographical Space in Urban Agglomeration in the Upper Reaches of the Yangtze River Based on the Function of “Production-Living-Ecological”. Resour. Environ. Yangtze Basin 2019, 28, 1070–1079. [Google Scholar]
- Xia, L.; Liu, J.; Wei, F.; Xu, Z.; Long, X.; Zhang, Y. Spatiotemporal pattern change of cultivated land in Weibei Dryland of Shaanxi Province. Trans. Chin. Soc. Agric. Eng. 2021, 37, 256–264. [Google Scholar] [CrossRef]
- Huang, X.; Zhang, X.; Zhu, D.; Lai, L.; Zhong, T. Application of Spatial Autocorrelation Analysis to the COD, SO2 and TSP Emission in Jiangsu Province. Environ. Sci. 2009, 30, 1580–1587. [Google Scholar] [CrossRef]
- Zhan, D.; Yu, X.; Wu, Q.; Jin, H.; Zhang, W. Exploring regional disparity and influencing factors of rental house development in China. Sci. Geogr. Sin. 2020, 40, 1990–1999. [Google Scholar] [CrossRef]
- Li, J.; Ma, Q.; Yan, H.; Chen, L.; Bian, D.; Li, W.; Zhang, C. Dynamic study of wetland in western Jilin Province from 1950 to 2015. Ecol. Sci. 2020, 39, 60–68. [Google Scholar] [CrossRef]
Publisher’s Note: MDPI stays neutral with regard to jurisdictional claims in published maps and institutional affiliations. |
© 2021 by the authors. Licensee MDPI, Basel, Switzerland. This article is an open access article distributed under the terms and conditions of the Creative Commons Attribution (CC BY) license (https://creativecommons.org/licenses/by/4.0/).