1. Introduction
This study proposes to provide the field of cultural tourism with a new tool, by working with artificial indicators to strengthen the performance efficiency and competitiveness of heritage destinations, based on a case study carried out in Cairo (Egypt). Additionally, this study relates to one of the critical axes of tourism development, which has been ignored for many years, both on a theoretical level and in a practical dimension in most countries [
1]. Heritage tourism is a sort of special interest tourism. It is defined as visits by visitors from outside the host community who are drawn to the local architecture, historic landscapes, and artistic or lifestyle performances [
2]. Communities can look to their past, comprehend the present, and plan for the future by using heritage assets and cultural values related to them as reference points [
3].
Heritage tourism is one of the most significant tributaries of tourism development [
4]. This is due to the importance of the relationship between tourism and cultural heritage sites in showing the culture of different civilizations and eliciting information through tourists visiting these areas [
5]. In addition, tourism increases the national income, provides job opportunities, increases the state’s resources from foreign currency, and increases social integration and cultural diversity [
1].
Hence, the research is focused on the suffering of several heritage destinations and their historical buildings from low tourism competitiveness. Moreover, they represent a financial burden on the state because their tourism does not contribute significantly economically. This is due to a lack of integration of smart systems, information, communication technology, and innovation in leveraging their comparative advantages to turn into competitive advantages that attract various categories of non-cultural tourists and increase their stay duration and expenditure rate in a heritage destination.
Furthermore, criticism of several previous literature reviews stems from the lack of an evaluation tool that includes measurement items that assess heritage destinations’ competitiveness and smart performance attributes. Additionally, they neglect the buildings’ role in achieving tourism competitiveness, despite the fact that countries’ overall competitiveness stems from the micro level [
6]. Moreover, the heritage building represents a symbol of cultural identity and an important aspect of the cultural heritage that must be preserved [
7]. There is a complex relationship between the built environment and the community’s identity, which can serve as pillars of memory for current and future generations if preservation is comprehensive [
8].
This study attempts to cover this gap by developing a composite index for providing a new quantitative assessment of these heritage destinations and their buildings, including a combination of 139 KPIs within nine major dimensions (attributes) that measure intelligent performance and competitiveness into a single measurement tool. A conceptual model linked to the competitiveness of smart tourist destinations was developed in a previous study [
9]. Additionally, this index will aid in the transformation of these destinations into smart heritage destinations capable of competing in tourism and achieving sustainable competitive advantages via the use of technology infrastructure and innovation to preserve and save them from extinction [
10].
2. Literature Review
The concept of competitiveness is broad in scope, as it can be studied according to different levels of analysis, whether economic, commercial, or tourism. Each level contains various methods for measuring competitiveness [
11]. The diamond model provides a comprehensive understanding of competitiveness and its determinants and explains how to achieve the competitive advantage of countries as an essential element to achieve competitive success due to certain factors available to them [
6]. The competitiveness of a tourist destination means a destination that provides satisfactory experiences for visitors and affects an increase in its expenditures, improves residents’ lives, and preserves the environment for future generations [
12]. Smart tourism destinations use available technological tools and techniques to enhance demand and supply to create value and pleasure for a unique tourist experience, and generate profit and competitive advantages for the destination [
13]. Creating smart tourism destinations aims to improve competitiveness [
12,
14]. Additionally, in a previous study, a conceptual model linked to the competitiveness of smart tourist destinations showed the correlations between competitiveness and smartness [
9].
Tourism competitiveness for smart heritage destinations is the ability to compete in tourism by finding new sources of competitive advantages, focusing on the needs of tourists by combining ICT, culture, and innovation, in order to distinguish their tourism services and work on improving their attractiveness to residents (the local community) and non-residents (visitors) to gain shares in the tourism market [
15]. Additionally, tourism competitiveness is closely linked to the development of the heritage area while ensuring that the available resources supporting tourism are used sustainably [
16,
17]. The competitiveness of a heritage tourism destination depends not only on economic strength, and cultural, social, political, and environmental aspects, but is also related to other factors strongly linked to technological aspects [
18,
19]. Those factors have been studied and aggregated within dimensions from a literature review, and organizations specialized in promoting technological innovation to create smart tourism destinations able to compete. Moreover, competitiveness can only be reached at a reasonable level from all of these dimensions. These dimensions can be summarized as follows.
2.1. Heritage Destination Infrastructure
Many countries are proud of their long history in tourism thanks to their possession of many cultural assets, heritage sites, and historical buildings. However, their mere presence does not constitute an economic value and is not sufficient for tourism to be a factor in local development and to achieve competitiveness [
15]. In recent years, many countries have sought to enhance heritage destinations and their resources to create tourist attractions, upgrade heritage products through the development of high-quality infrastructure and entire regional networks (side-by-side hotels, restaurants, cultural events, and airlines) as key factors for attaining a sustainable competitive advantage [
20].
Accordingly, it is necessary to improve the technological level and bridge the digital divide so that the heritage district is truly prepared to meet the needs of all tourists within its borders. Some actions achieve an attractive image, improve the visitor experience, provide interactive communication between the visitor and the heritage area, and inform them of available tourism services [
15]:
- (1)
Developing experimental content for tourists through mobile applications and augmented reality.
- (2)
Setting up a free Wi-Fi system with many hotspots distributed throughout the destination for tourists to use to share their experiences on social media.
- (3)
Creating campaigns, the recipients of which have been previously analyzed to promote a heritage destination.
2.2. Heritage and Cultural Resources
Historical and cultural heritage plays a significant role in developing domestic tourism and local cultural values. It is one of the real opportunities for economic, social, and cultural recovery, so it is necessary to reconstruct historical life and protect and restore cultural and historical monuments [
21]. Heritage and cultural resources are subdivided into six main types [
22]:
- (1)
Historical resources include visiting historical monuments and unique architectural complexes, and thematic lectures on history.
- (2)
Cultural resources include festivals, works of monumental, graphic folklore, national crafts, and other art forms.
- (3)
Religious resources include visiting pilgrimage places and acquaintance with religious customs.
- (4)
Archaeological monuments carry information about humanity’s history, contain important evidence of human activity over different historical periods, and are a source for studying history. They include the ruins of ancient cities, burial sites, and historical remains, which all are under national heritage protection according to the cultural heritage protection act (CHPA) [
23].
- (5)
Ethnography includes a culture of people and ethnic culture, a life, language, a suit, and ethnic creativity.
- (6)
Heritage ecologies are gaining popularity in the humanities, social sciences, and environmental sciences. They include landscape architecture and historic structures, and also consider the connections between present social behavior and tangible forms of heritage [
24].
2.3. The Heritage Tourist Market
In order to promote and market local resources, a better and more effective online promotion strategy for heritage destinations must be created with the presence of a destination marketing organization (DMO) to promote it using technology and various marketing techniques [
25]. Moreover, increasingly innovative tourism services are offered at competitive prices with the promotion of small local industry, increasing visitor expenditure rate and studying the dimensions of visitor interactions to increase the demand for those destinations and make them more attractive than alternatives [
21].
2.4. Accessibility
Competitiveness within the heritage district cannot be achieved without ensuring maximum accessibility to all cultural and recreational elements, services, and activities in the area. The area should function as an integrated unit that allows visitors to move freely and choose the activity they desire [
26]. There is a series of actions to be taken into consideration, for example [
27]:
- (1)
Implement a comprehensive urban access plan (buildings, parks, and shops) and a comprehensive plan for tourist access (museums and places of residence).
- (2)
Establish evaluation and management protocols by providing technological tools such as QR codes.
- (3)
Encouraging vocational training to identify and properly serve the needs of tourists with disabilities, such as the availability of videos with sign language interpretation, models of the destination’s major landmarks so that people with visual impairments can interpret them, and the provision of wheelchairs.
2.5. Innovation
The concept of innovation is the ability of knowledge to generate value. Innovation is strongly associated with the integration of technologies and digital media, especially information and communication technology (ICT) and artificial intelligence (AI), which have become a major innovation resource to enable heritage tourism destinations to improve their competitiveness level [
28]. Numerous innovations in the tourism sector concern enhancements to service promotion, distribution, and marketing, as well as the design of new heritage products that are more suited to tourists and changing levels of demand [
29]. Ongoing competitiveness is closely related to the development of the heritage area itself. Therefore, it is necessary to focus on innovation to distinguish its tourism services [
30].
2.6. Information System
Improving the heritage area with an information system is critical to improving the quality of the visitor’s perception of the heritage area, allowing them to access information at any time and from any location, and improving accessibility [
12]. It is the basis for regional management to collect and analyze information that allows automating traditional statistical processes, measuring satisfaction, developing marketing actions, and analyzing visitor traffic, bringing benefits to tourists, the population, and the region [
28]. Installing sensors as sources to feed the destination information system makes it monitor demand and consumption and be able to plan to achieve competitiveness. For some destinations in Spain, the smart platform has been made to interpret the collected data for decision-making, such as Palma de Mallorca [
31].
2.7. Sustainability
The principle of sustainability must be achieved in order to preserve resources for future generations. It is derived from the effective integration of technology, as no destination can be considered smart unless it is also sustainable [
31]. Moreover, it is defined as a process to achieve environmental, economic, and social improvement or a state that can be maintained at a certain level indefinitely. Therefore, sustainable heritage contrasts with the deterioration of heritage. So, heritage development is one of the most important pillars and strategies for achieving sustainable heritage [
32].
Although tourism development in heritage destinations is a catalyst for restoring historical buildings and restructuring inward investment for the heritage destination, it faces social, economic, cultural, and environmental challenges [
33]. Therefore, it is necessary to start analyzing sustainability through different perspectives:
- (1)
An economic perspective, to create profitable, sustainable business models that positively impact residents’ quality of life.
- (2)
A cultural perspective, to develop new strategies that enable visitors to immerse themselves in the region’s traditions and history without having a negative impact.
- (3)
A social perspective, to conform to people’s values and enhance society identity [
31], social inclusion, and economic growth, which are essential for individual and societal well-being [
3].
- (4)
An environmental perspective, to achieve sufficiency and efficiency in energy and natural and tourism resources [
20]. Therefore, UNESCO issued the most significant proposed principles for sustainable tourism in world heritage sites [
34]. Additionally, the United Nations Department of Economic and Social Affairs (UNDESA) provides a guideline about Sustainable Development Goals (DSDG) to support the management of natural resources and ecosystems in an integrated and long-term manner [
35].
2.8. Management
The heritage destination can be exposed to threats and risks through the physical effects resulting from increased visits, congestion, and developments due to the marketing of the heritage area’s authentic historic character and cultural context [
36].
Therefore, a risk management approach is relied upon and applied by institutions and organizations involved in managing heritage sites as a systematic way to help make decisions about protecting and preserving those sites from degradation [
37]. Moreover, the necessary measures are taken to assess risks in order to mitigate and prevent specific dangers and prepare for sudden emergencies, such as installing warning systems to monitor any danger, developing training plans for risk management, and managing the heritage sites in the event of any sudden risk [
38].
Additionally, destination management organizations (DMOs) can help these destinations optimize their tourism development by using technologically driven innovations to address issues such as carrying capacity, stakeholder management, and community involvement, and by encouraging expansion in the use of smart tourism governance to achieve social inclusion, environmental performance, the provision of citizen-centric services, and encouraging cooperation between the government and the tourism sector to manage related issues of sustainable tourism development [
39].
2.9. Community
The local community plays a dual role as a major part of the tourism potential and resources, and also, at the same time, as a part of the host community [
40]. This role adds another dimension to the complexity of their participation. They are the main stakeholders in tourism development [
41]. The process of heritage development to achieve tourism development is a necessary tool in developing the local community. This is an influential factor in preserving heritage [
3,
42]. Therefore, the concept of community participation was introduced in the tourism development process to achieve a more equitable distribution of benefits, satisfy the local community in better ways, create job opportunities, and support local economies to improve the local population’s well-being [
3].
Recently, local communities have realized the importance of tourism in the development of the local community [
43]. Until now, a gap has been found in explaining the process of developing heritage to tourism development for a particular community with self-capabilities and heritage assets. This gap can be covered by understanding the benefits and gains that will accrue to the local community through community participation [
42]. Many tourism projects have faced many challenges to their implementation due to the loss of an essential element: the effective community participation of indigenous people, the lack of sufficient consultations, and planning at the local level with international and regional bodies [
43]. For achieving community participation, the following must be achieved [
2,
42,
43]:
- (1)
Contribute to enriching knowledge and raising awareness among citizens of the heritage and the importance of preserving and developing it.
- (2)
Clarify the type of community participation in all stages of tourism development.
- (3)
Identify stakeholders who have a common interest with the local community in developing tourism, and a future vision for its development and reviving the local handicraft industry from extinction.
- (4)
Restructuring the public administration system to enhance community participation in the decision-making process.
- (5)
Participation in tourism benefit sharing.
- (6)
Develop legal and financing legislation and policies capable of facing the challenges of preserving heritage and developing the local community.
2.10. Historical and Heritage Buildings
While using technological systems and techniques as part of the preservation process, heritage building maintenance and upgrading helps to ensure the continuity of the building, increase its lifespan, preserve its value, and achieve sustainability and interaction requirements [
44]. It also helps maintain the building’s fabric and all defective services. This means that the performance of heritage buildings must be significantly improved in terms of comfort, efficiency, and automation to better compete in the tourism industry [
7]. This can only be achieved after a proper investigation of all available options (based on an informed expert opinion) has been conducted before a suitable solution is chosen.
3. Materials and Methods
Numerous theoretical and applied models contain some of these attributes mentioned above (dimensions), but these are not enough. These models need to be revisited and integrated with others. As a result, it was necessary to rely on those studies to determine the criteria and indicators in this regard. This includes methods for evaluating intelligent buildings (IBs), models of smart tourism destinations (STDs), models of tourism destination competitiveness (TDC), previous tourism-related studies in heritage sites, and guidelines for some essential smart heritage projects, in order to serve as a source for formulating KPIs for the proposed composite index. There are further stages of methodological procedures to cover the gap caused by the research problem and reach the research objective (
Figure 1).
3.1. Content Validity
After compiling and formulating a set of KPIs for the proposed index, 21 professional experts were required to conduct content validation on the proposed index’s structure, generate potential dimensions, and ensure that the proposed index includes a sufficient set of KPIs for accurately measuring the targeted concepts [
45,
46,
47]. They were ten architect consultants, five antiquities restorers, and six tourism professionals, who had abundant experience of more than 15 years, through semi-structured and in-person interviews that lasted approximately two hours. Content validity usually depends on experts’ judgment to a large extent in this field to modify the questionnaire (survey instrument) and make vague questions more effective [
48].
3.2. Questionnaire (Survey Instrument)
Lastly, the questionnaire (proposed index) was finalized with 160 KPIs within nine main sections (dimensions). However, before using it as a tool for the pilot study and distributing it, an experiment was conducted on this questionnaire in advance on a group of testers to determine any ambiguity of the questions and to identify potential problems (pre-pilot).
3.3. Pilot Study
The objective of this stage was to test the survey instrument and improve its efficiency in a small-scale trial before the full-scale study [
49,
50]. Therefore, a questionnaire was used as a tool for the pilot study on heritage destinations of historic Cairo, which is considered one of the world’s most important and largest heritage cities. It is a lively tourism city characterized by the richness of its urban fabric, as an example of Islamic architecture. It was inscribed on the world heritage list in 1979 to recognize its history, heritage, and civilizational importance [
51]. It is divided into several destinations (in Arabic: shyakhas), covering the world heritage property’s perimeters and containing huge heritage buildings and sites. In this stage, the Khan Al-Khalili, Al-Hattaba, and Al-Dayura destinations were chosen as a rehearsal to achieve some objectives such as testing the validity and reliability of the study instrument and obtaining insight into the real conditions of the actual situation study [
52]. Thus, this enables the researchers to expect and adjust to potential problems [
53] (
Figure 2).
The criteria for selecting these destinations were the differences in the architectural and urban fabric, as well as the topography with its natural and human nature elements. These destinations contain numerous unique architectural examples from various eras and are considered the most important tourism heritage destinations in historic Cairo. Khan Al-Khalili (destination A) is located in the heart of Cairo’s historic district of Gamaliya, close to the great mosques of Al-Hussein and Al-Azhar. It is considered the main attraction for tourists as the oldest market in Cairo, marked by craft, economic, and tourism activities with stalls filled with diverse products for tourists. It is a symbolic place of the old city, which widely includes twenty Islamic monuments registered for five different eras. It takes the shape of a rectangle with a north-eastern direction towards Bab Al-Nasr. The area of Khan al-Khalili is approximately 0.086 km
2. Its administrative borders have not changed almost since its construction [
54].
Al-Hattaba (destination B) is one of the most famous territories in quism Al Khalifa. It possesses a high architectural value for its historic urban fabric, which has not changed since it was documented through a map describing Egypt in 1801. It has an area of 0.523 km
2. It has 15 recorded monuments, such as the complex of Mangak El-Yusufi, the Sabil of Prince Sheikho, and Salah El-Din Citadel, which is located within its borders [
54].
Al-Dayura (destination C), part of this territory, is located in the world heritage property; it covers an area of 1.973 km
2. From another perspective, it contains several monumental sites, such as the archaeological site of Fustat, which was established in 641 and was the first capital after the Islamic conquest of Egypt. Additionally, it contains Amr Ibn Al-Aas Mosque, which is known to be the first mosque in Africa. In addition, it contains a religious complex among the ancient churches, including the Hanging Church “al-Mu’allaqua”, which originated in the 4th century and was built over the southern gate of the Roman fortress Babylon (built by Trajan around 100 AD), the Church of Abu Sarjah where the Holy family is believed to have stayed during their trip through Egypt, and the Jewish Temple of Ibn Ezra. Among the other monumental attractions is the Coptic Museum, founded by Marcos Smeika Pasha in 1910 AD to fulfill the needs of displaying monuments referred to that period to easily trace the history of Christianity in Egypt [
54,
57].
3.4. Samples and Data Collection
A purposive sample was chosen that targeted individuals from a community [
58]. We deliberately chose it due to the lack of the general community’s familiarity with the study’s core, to produce results that can be generalized. Therefore, archaeologists, tourism practitioners, professionals, architects who study heritage sites, consultants, and project managers, who have experience with archaeological sites and the adaptive reuse of heritage and archaeological buildings, were targeted. The researchers distributed (100) questionnaires and conducted face-to-face interviews to ensure the quality of the data collected and raise response rates [
53]. Out of 100 questionnaires, we achieved a 90% response rate. All statistics were performed using the statistical package for the social sciences (SPSS) version 23.
3.5. Reliability
A measure’s reliability indicates the degree to which an instrument is error-free and thus stable and consistent over time, as well as across the various items on the scale [
59]. Hence, the Cronbach alpha coefficient, the most popular test to measure the instrument’s internal consistency, was extracted as an indicator of reliability with a value of 0.945 [
60]. Consequently, the more reliability is performed, the more accurate the results are, which increases the chance of making the correct decision in research. However, reliability is necessary but insufficient for the study’s validity [
48].
3.6. Construct Validity
The validity of the measuring instrument (the proposed index) is an empirical confirmation required for practical measures and theoretically derived hypotheses to be tested in order to measure the construct that it claims to measure [
61,
62]. It was decided to adopt EFA, which is utilized when the relationships between variables and latent factors are unknown or uncertain. Its essential purpose is to visualize clearly and simply the factors loading and their grouping [
52]. This is achieved by exploring the principal components and their relationship with related variables solidly correlated with each other [
63]. This procedure can create the internal structure to the proposed composite index, simplify it, and reduce the large number of indicators describing the phenomenon of the current study in a smaller number of packages or principal components [
64]. The direct oblimin rotation with delta 0.5 is applied, so this rotation allows a degree of correlation between the factors, to improve the intercorrelation between the items within the factors [
65].
4. Results
The EFA outcomes were adequate to reflect a satisfactory data fit. The following criteria were considered for accepting these results [
66,
67]:
- (1)
Inside the latent factors, any variable in pattern matrixes with factor loading less than 0.3 is removed.
- (2)
The percentage of total variance explained with a minimum level of 50%.
- (3)
Value of Kaiser–Meyer–Olkin was more than 0.6 to confirm the adequacy of the sample.
- (4)
Latent factors with eigenvalues greater than 1.
- (5)
The Bartlett’s test of sphericity at a significant level of 0.000.
Furthermore, the component score coefficient matrix (CS
i) was computed for each indicator within each category in the main dimension to be used in the application process. After that, 139 KPIs were retained from the 160 KPIs by the exploratory factor analysis process [
67]. Then, the Cronbach alpha coefficient was extracted as an indicator of reliability. Its value was more than 0.600 for each dimension, indicating that it was acceptable after removing the indicators (items) that demonstrated low factor loadings.
In the first dimension, 20 KPIs distributed over three components (Categories) were retained, and three indicators were removed. Moreover, the component score coefficient matrix (CS
i) was computed for each indicator within each category in this dimension. Then, the Cronbach alpha coefficient was extracted after removing indicators. (
Table 1)
From the second-dimension analysis, 14 indicators distributed over three components were retained, and two indicators were deleted (
Table 2). In the third dimension, four indicators distributed over one component were retained, and one was deleted (
Table 3). In the four-dimension analysis, seven indicators distributed over two components were retained and one indicator was deleted (
Table 4).
From the five-dimension analysis, 27 indicators distributed over four components were retained, and four were deleted (
Table 5). From the six-dimension analysis, 14 indicators distributed over four components were retained, and three were deleted (
Table 6). Furthermore, the component score coefficient matrix (CS
i) was calculated for each indicator within each category in these dimensions. Then, the Cronbach alpha coefficient was extracted after removing indicators.
Seven indicators distributed over two components were retained from the seven-dimension analysis, and one was deleted (
Table 7). In the eight-dimension analysis, 11 indicators distributed over two components were retained with no deleted indicators (
Table 8). In the nine-dimension analysis, 35 indicators distributed over four factors were retained with six deleted indicators (
Table 9).
In addition, the component score coefficient matrix (CSi) was calculated for each indicator within each category in these dimensions. Thereafter, the Cronbach alpha coefficient was extracted after removing indicators.
Furthermore, the component score coefficient matrix of categories (CSg) as a whole was extracted within each main dimension for use in the application process (
Figure 3). The third dimension (sustainability) did not enter this stage because it consists of only one category (component), so each indicator’s component score coefficient matrix was adopted in the application process.
Composite Index Testing: A Case Study
Lastly, a final questionnaire (the proposed composed index) was finalized with 139 KPIs. After modifying it by conducting the pilot study and factor analysis, it was used in the application phase over Cairo’s study zone (Salah El-Din Citadel) as a heritage destination, including its historic buildings (
Figure 4). The proposed index is a tool to detrmine strengths and weaknesses by performing exploratory analysis, determining the priorities of intervention, addressing the shortcomings, and providing general assessment for intelligence performance and competitiveness (main attributes) within the study zone, as well as recommendations for future improvements to become a smart heritage destination capable of competition in the tourism sector.
This heritage destination (study zone) was chosen because it is considered one of the most important tourist attractions, and one of the most luxurious military castles built in the Middle Ages. It was founded by Salah al-Din Al-Ayyubi in 1176 AD, an architectural complex with a long history of building and rebuilding. Because it stood for almost seven centuries (1206–1874), it was the seat of government for the Ayyubids, Mamluks, Ottomans, and the Muhammad’ Ali dynasty. This long period reflected the changing political and cultural conditions of Egypt’s history [
68]. Furthermore, it is distinguished by its architectural and urban fabric. It was called Qal’at Al-Jabal, because it is situated on a spur artificially cut out of the Muqqatam Hill. This castle contains several historic buildings, recorded as monuments and reused as museums [
57].
The assessment process was divided into seven steps, as follows:
- (1)
Step 1: The final form of the questionnaire (the proposed composite index) after modifying it, consisting of 139 KPIs within nine major dimensions, was used to collect data from a new purposive sample. Forty questionnaires were distributed and five were not retrieved. The questionnaires valid for data analysis reached 35 questionnaires out of the distributed questionnaires; then, the collected data were analyzed using SPSS.
- (2)
Step 2: The following equation was used to compute the score for each category within major dimensions:
= category within the main dimension.
= category number within the dimension.
CSi = component score coefficient matrix of each indicator within a category.
= the first indicator within the category.
= the second indicator within the category.
- (3)
Step 3: Then, the following equation was used to compute the total score for the nine dimensions within an index:
D = major dimension of the index.
= dimension number within the index.
= component score coefficient matrix of each category within a dimension (Figure 3). = score of the first category within the dimension (resulting from Equation (1)).
= score of the second category within the dimension (resulting from Equation (1)).
- (4)
Step 4: After that, the score of all categories within the first dimension (resulted from Equation (1)) and the total score of the first dimension (resulted from Equation (2)) were used as descriptive variables for performing descriptive analysis. This step was carried out on all dimensions to extract the minimum, maximum, mean, and standard deviation (
Table 10).
- (5)
Step 5: The minimum of each category was computed, depending on the code of positive answers for all questions to express the best outcome, using Equation (3). Similarly, the maximum was calculated, depending on the code of negative answers for all questions to express the worst outcome, using Equation (4) to reflect the general response of the actual sample for each category as a whole.
- (6)
Step 6: For each dimension, the minimum and maximum were computed using Equations (5) and (6), respectively.
= the minimum of each category within dimension from descriptive results (Table 10). = the maximum of each category within dimension from descriptive results (Table 10).
- (7)
Step 7: Finally, to determine the grade for each category and each major dimension, the quantitative score was transformed into a categorical scale, divided into three periods (tiers) by using the minimum and maximum (resulting from Equations (3) and (4) for each category, or Equations (5) and (6) for each dimension) in Equation (7). After that, the range for each period (tier) was determined, then any period defined according to the mean value from the corresponding descriptive results (
Table 10). If the value of the mean belongs to the first period, it expresses a good grade; if the value of the mean belongs to the second period, it expresses a medium grade; and if the value of mean belongs to the third period, it expresses a poor grade.
5. Discussion
The output of this research is a proposed composite index that combines KPIs of smart performance and competitiveness in the tourism sector into a single measurement tool for evaluating heritage tourist destinations and their historic buildings. This index is based upon a conceptual model, which showed the correlations between competitiveness and a smart tourism destination in a previous study [
9]. Although few previous studies have thoroughly searched this important topic to date, the composite index designed in the current research, from a theoretical perspective, has revealed the nine basic dimensions (attributes) of the competitiveness of a smart heritage destination. These dimensions play an important role in shaping the attractiveness of heritage destinations and achieving a high level of distinctiveness.
These dimensions consist of a set of critical vital KPIs that affect the sustainability of tourism development in heritage destinations, all of which is consistent with previous tourism-related studies in heritage sites and guidelines for some essential projects related to smart heritage and numerous models of STDs, TDC, and methods of evaluating the IBs. Regarding the practical implications, content validation was conducted on the proposed index’s structure to generate potential dimensions and ensure that the proposed index includes a sufficient set of KPIs for accurately measuring the targeted concepts.
Moreover, a questionnaire containing 160 KPIs was used for the pilot study to test it, improve its efficiency in a small-scale trial before the full-scale study, and adjust to potential problems. Furthermore, the data collected were analyzed by SPSS to extract the Cronbach alpha coefficient as an indicator of reliability, with a value of 0.945, before removing any indicator. After that, construct validity was implemented by adopting EFA and applying the direct oblimin rotation with delta 0.5. The EFA analysis results generated 139 KPIs after removing 21 KPIs by extracting factor loading for each indicator and grouping KPIs (variables) that were solidly correlated with each other in principal categories (components) within nine dimensions and extracting relative weight for each dimension (
Figure 3). Then, the Cronbach alpha coefficient was extracted as an indicator of reliability one more time on each dimension after removing indicators for which the factor loading was less than 0.3.
Furthermore, the current research provides a new quantitative evaluation method by applying the proposed composite index on a case study (Salah El-Din Citadel) to assess and validate its usefulness. In the evaluation process, the grades for each main dimension and their categories were computed by following seven steps and using the equations mentioned above. Moreover, the quantitative score resulting from the statistical analysis was transformed into a categorical scale; divided into three grades (good–medium–poor). Hence, it is easy for historic sites managers to understand the findings in a simplified version after being trained and working to determine the necessary intervention priorities according to categorical grades for each dimension and their categories.
The evaluation results reveal the dimensions that need to be restructured totally in Salah El-Din Citadel. These dimensions were smart access, sustainability, and innovation, because all of their categories received a poor grade, followed by an information system and operating efficiency equipment for reused heritage buildings (
Figure 5). Furthermore, it determines dimensions that need to be restructured partially by identifying their weakest categories, such as infrastructure, tourist market, and management, because all received a medium grade (
Figure 6). Additionally, it determines the heritage and cultural resources dimension, which does not need to be restructured because all of its categories received a good grade (
Figure 5). Wherefore, the quantitative evaluation highlighted the strengths and weaknesses. Furthermore, identifying these weakness dimensions helps to speed up the trend and intensify efforts to achieve future improvements in order to raise them to a good grade to convert Salah El-Din Citadel into a smart heritage destination capable of competitiveness.
6. Conclusions and Future Developments
This study generated a composite index that can be used as a tool for evaluating heritage destinations and their historic buildings. It also covers the gap in previous studies that caused the research problem, by developing a measurement tool of 139 KPIs for smart performance and competitiveness. This index can serve as the practical operation manual for determining the priorities for intervention to develop heritage destinations into smart heritage destinations. This helps make these heritage destinations capable of creating sustainable competitive advantages that enhance their competitive position in tourism, which contributes to investment, social, and economic resources optimization. Additionally, it helps meet tourists’ changing needs, achieve an outstanding experience, and increase the rate of visits.
Moreover, this index identifies which nine dimensions (attributes) are linked to a smart heritage destination’s comprehensive competitiveness and influence tourists’ decisions to visit any heritage destination. This index suggested, based on the idea of a conceptual model in the study [
9], the previous tourism-related studies in heritage sites, guidelines for some essential projects related to smart heritage, numerous models of STDs, TDC, and methods of evaluating the IBs to be a source of major dimensions, alongside KPIs formulated by experts. This study focused on a mixed methodology that was performed to improve the efficiency of the study instrument, scientifically developed, and adjusted to potential problems. The analysis results generated 139 KPIs within nine dimensions after removing 21 KPIs by extracting factor loading for each indicator and calculating the component score coefficient matrix (CS
i) for each indicator within each category in these dimensions. Additionally, the component score coefficient matrix of categories (CSg) as a whole was extracted within each main dimension.
Furthermore, the proposed index was tested practically on a case study (Salah El-Din Citadel). In the assessment process, the score for each main dimension and their categories were calculated by following seven steps and using the equations mentioned above.
Then, the score resulting from the statistical analysis was transformed into a categorical scale, divided into three grades (good–medium–poor), to understand the findings in a simplified version. In general, from a theoretical point of view, the index provides a much-needed basis to guide future research on smart heritage destinations.
Practically, researchers can refer to the suggested index to comprehend the construct of smart heritage destinations. Moreover, they can apply it to small, indefinite, medium, and large heritage districts in different countries, with guidelines provided for non-statistical evaluation methods, and then compare the results, considering that each heritage area has unique characteristics. Additionally, the authors plan to develop the proposal index in future research by using further case studies and more simple application methods. Moreover, deep analysis will be performed on the positive and negative impacts of using the index by expanding the sample to include individuals of the community.
Author Contributions
Conceptualization and preliminary idea, M.A.S., Y.S.H. and N.A.A.-F.; methodology, M.A.S., Y.S.H. and N.A.A.-F.; validation, M.A.S., Y.S.H. and N.A.A.-F.; formal statistical analysis, M.A.S. and N.A.A.-F.; investigation M.A.S., Y.S.H. and N.A.A.-F.; resources, M.A.S., Y.S.H. and N.A.A.-F.; data curation, M.A.S., Y.S.H. and N.A.A.-F.; writing—original draft preparation, M.A.S., Y.S.H. and N.A.A.-F.; writing—review and editing, academy of language editing services; visualization, M.A.S., Y.S.H. and N.A.A.-F.; supervision, Y.S.H. and N.A.A.-F.; project administration, all authors; funding acquisition, all authors. All authors have read and agreed to the published version of the manuscript.
Funding
This research received no external funding.
Institutional Review Board Statement
Not applicable.
Informed Consent Statement
Informed consent was obtained from all subjects involved in the study.
Data Availability Statement
Any data analysis files are available to be presented upon request, including SPSS analysis files, and so on.
Acknowledgments
Special thanks to all the professional experts who agreed to participate in this study, all the helpful staff of the historic Cairo project, and all the respondents for their valuable contributions during the fieldwork.
Conflicts of Interest
The authors declare no conflict of interest.
References
- Yankholmes, A.K.; Akyeampong, O.A. Tourists’ perceptions of heritage tourism development in Danish-Osu, Ghana. Int. J. Tour. Res. 2010, 12, 603–616. [Google Scholar] [CrossRef]
- Dragouni, M.; Fouseki, K. Drivers of community participation in heritage tourism planning: An empirical investigation. J. Herit. Tour. 2018, 13, 237–256. [Google Scholar] [CrossRef]
- Shipley, R.; Snyder, M. The role of heritage conservation districts in achieving community economic development goals. Int. J. Herit. Stud. 2013, 19, 304–321. [Google Scholar] [CrossRef]
- Asmelash, A.G.; Kumar, S. The structural relationship between tourist satisfaction and sustainable heritage tourism development in Tigrai, Ethiopia. Heliyon 2019, 5, e01335. [Google Scholar] [CrossRef] [PubMed]
- Chen, C.-F.; Chen, P.-C. Resident attitudes toward heritage tourism development. Tour. Geogr. 2010, 12, 525–545. [Google Scholar] [CrossRef]
- Porter, M.E. The competitive advantage of nations. Harv. Bus. Rev. 1990, 68, 73–93. [Google Scholar]
- Willson, G.B.; McIntosh, A.J. Heritage buildings and tourism: An experiential view. J. Herit. Tour. 2007, 2, 75–93. [Google Scholar] [CrossRef]
- AlSadaty, A. Historic Houses as Pillars of Memory: Cases from Cairo, Egypt. Open House Int. 2018, 43, 5–13. [Google Scholar] [CrossRef]
- Koo, C.; Shin, S.; Gretzel, U.; Hunter, W.C.; Chung, N. Conceptualization of smart tourism destination competitiveness. Asia Pac. J. Inf. Syst. 2016, 26, 561–576. [Google Scholar] [CrossRef]
- Sul, H.-K.; Chi, X.; Han, H. Measurement development for tourism destination business environment and competitive advantages. Sustainability 2020, 12, 8587. [Google Scholar] [CrossRef]
- Crouch, G.I.; Ritchie, J.B. Tourism, competitiveness, and societal prosperity. J. Bus. Res. 1999, 44, 137–152. [Google Scholar] [CrossRef]
- Koo, C.; Mendes-Filho, L.; Buhalis, D. Smart tourism and competitive advantage for stakeholders: Guest editorial. Tour. Rev. 2019, 74, 1–4. [Google Scholar] [CrossRef]
- Boes, K.; Buhalis, D.; Inversini, A. Smart tourism destinations: Ecosystems for tourism destination competitiveness. Int. J. Tour. Cities 2016, 2, 108–124. [Google Scholar] [CrossRef]
- Del Chiappa, G.; Baggio, R. Knowledge transfer in smart tourism destinations: Analyzing the effects of a network structure. J. Destin. Mark. Manag. 2015, 4, 145–150. [Google Scholar] [CrossRef]
- Chianese, A.; Piccialli, F. SmaCH: An infrastructure for smart cultural heritage environments. Int. J. Ad Hoc Ubiquitous Comput. 2017, 26, 185–204. [Google Scholar] [CrossRef]
- Khan, S.A.R.; Qianli, D.; SongBo, W.; Zaman, K.; Zhang, Y. Travel and tourism competitiveness index: The impact of air transportation, railways transportation, travel and transport services on international inbound and outbound tourism. J. Air Transp. Manag. 2017, 58, 125–134. [Google Scholar] [CrossRef]
- Hanafiah, M.H.; Zulkifly, M.I. Tourism destination competitiveness and tourism performance: A secondary data approach. Compet. Rev. Int. Bus. J. 2019, 29, 592–621. [Google Scholar] [CrossRef]
- Ritchie, J.B.; Crouch, G.I. The Competitive Destination: A Sustainable Tourism Perspective; CABI: Cambridge, MA, USA, 2003; p. 272. [Google Scholar]
- Santa-Cruz, F.G.; López-Guzmán, T. Culture, tourism and world heritage sites. Tour. Manag. Perspect. 2017, 24, 111–116. [Google Scholar] [CrossRef]
- Du Cros, H. A new model to assist in planning for sustainable cultural heritage tourism. Int. J. Tour. Res. 2001, 3, 165–170. [Google Scholar] [CrossRef]
- Huh, J.; Uysal, M.; McCleary, K. Cultural/heritage destinations: Tourist satisfaction and market segmentation. J. Hosp. Leis. Mark. 2006, 14, 81–99. [Google Scholar] [CrossRef]
- Ismagilova, G.; Safiullin, L.; Gafurov, I. Using historical heritage as a factor in tourism development. Procedia-Soc. Behav. Sci. 2015, 188, 157–162. [Google Scholar] [CrossRef]
- UNESCO. Cultural Heritage Protection Act (CHPA). Available online: https://en.unesco.org/sites/default/files/slov_cultural_heritage_protection_act_engtof.pdf (accessed on 16 April 2020).
- Baird, M.F. Natural Heritage: Heritage Ecologies and the Rhetoric of Nature. In Heritage Keywords: Rhetoric and Redescription in Cultural Heritage; University of Colorado Press: Boulder, CO, USA, 2015; pp. 207–220. [Google Scholar]
- Goh, E. Understanding the heritage tourist market segment. Int. J. Leis. Tour. Mark. 2010, 1, 257–270. [Google Scholar] [CrossRef]
- Ritchie, J.; Crouch, G.I. A model of destination competitiveness/sustainability: Brazilian perspectives. Rev. Adm. Pública 2010, 44, 1049–1066. [Google Scholar] [CrossRef]
- Hooper, J. A destination too far? Modelling destination accessibility and distance decay in tourism. GeoJournal 2015, 80, 33–46. [Google Scholar] [CrossRef]
- Caffo, R. Digital cultural heritage projects: Opportunities and future challenges. Procedia Comput. Sci. 2014, 38, 12–17. [Google Scholar] [CrossRef]
- Williams, A.M.; Rodriguez, I.; Makkonen, T. Innovation and smart destinations: Critical insights. Ann. Tour. Res. 2020, 83, 102930. [Google Scholar] [CrossRef]
- de Morais Lima, D.S.; Mendes Filho, L.; Correa, C.H.W.; Mayer, V.F. Analysis of the city of Natal/RN as Smart Tourism Destination using the INVAT. TUR model. Mark. Tour. Rev. 2021, 6, 1–35. [Google Scholar] [CrossRef]
- González-Reverté, F. Building sustainable smart destinations: An approach based on the development of Spanish smart tourism plans. Sustainability 2019, 11, 6874. [Google Scholar] [CrossRef]
- Nocca, F. The role of cultural heritage in sustainable development: Multidimensional indicators as decision-making tool. Sustainability 2017, 9, 1882. [Google Scholar] [CrossRef]
- Mendola, D.; Volo, S. Building composite indicators in tourism studies: Measurements and applications in tourism destination competitiveness. Tour. Manag. 2017, 59, 541–553. [Google Scholar] [CrossRef]
- UNESCO. 34 COM 5F.1—Decision. Available online: https://whc.unesco.org/en/decisions/4045/ (accessed on 10 May 2019).
- Nations, U. Sustainable Development Goals (SDGs). Available online: https://sdgs.un.org/goals (accessed on 19 November 2021).
- Van der Zee, E.; Bertocchi, D.; Vanneste, D. Distribution of tourists within urban heritage destinations: A hot spot/cold spot analysis of TripAdvisor data as support for destination management. Curr. Issues Tour. 2020, 23, 175–196. [Google Scholar] [CrossRef]
- Paolini, A.; Vafadari, A.; Cesaro, G.; Quintero, M.S.; Van Balen, K.; Vileikis, O. Risk Management at Heritage Sites: A Case Study of the Petra World Heritage Site; UNESCO: Paris, France, 2012. [Google Scholar]
- Cesaro, G.; Quintero, M.S.; Paolini, A.; De Vos, P.J.; Glekas, E.; Visconti, L. Preliminary risk assessment at the Petra Archaeological Park recording strategy. Int. J. Herit. Digit. Era 2012, 1, 295–312. [Google Scholar] [CrossRef]
- Mandić, A.; Kennell, J. Smart governance for heritage tourism destinations: Contextual factors and destination management organization perspectives. Tour. Manag. Perspect. 2021, 39, 100862. [Google Scholar] [CrossRef]
- Ritchie, B.W.; Inkari, M. Host community attitudes toward tourism and cultural tourism development: The case of the Lewes District, Southern England. Int. J. Tour. Res. 2006, 8, 27–44. [Google Scholar] [CrossRef]
- Li, Y.; Hunter, C. Community involvement for sustainable heritage tourism: A conceptual model. J. Cult. Herit. Manag. Sustain. Dev. 2015, 5, 248–262. [Google Scholar] [CrossRef]
- Dragouni, M.; Fouseki, K.; Georgantzis, N. Community participation in heritage tourism planning: Is it too much to ask? J. Sustain. Tour. 2018, 26, 759–781. [Google Scholar] [CrossRef]
- Rasoolimanesh, S.M.; Jaafar, M.; Ahmad, A.G.; Barghi, R. Community participation in World Heritage Site conservation and tourism development. Tour. Manag. 2017, 58, 142–153. [Google Scholar] [CrossRef]
- Wise, F.; Moncaster, A.; Jones, D. Rethinking retrofit of residential heritage buildings. Build. Cities 2021, 2, 495–517. [Google Scholar] [CrossRef]
- Sekaran, U.; Bougie, R. Research Methods for Business: A Skill Building Approach; John Wiley & Sons: Hoboken, NJ, USA, 2016. [Google Scholar]
- Hair, J.F.; Money, A.H.; Samouel, P.; Page, M. Research methods for business. Educ. Train. 2007, 49, 336–337. [Google Scholar] [CrossRef]
- DeVellis, R.F. Scale Development: Theory and Applications; Sage Publications: London, UK, 2016. [Google Scholar]
- Mohajan, H.K. Two criteria for good measurements in research: Validity and reliability. Ann. Spiru Haret Univ. Econ. Ser. 2017, 17, 59–82. [Google Scholar] [CrossRef]
- In, J. Introduction of a pilot study. Korean J. Anesthesiol. 2017, 70, 601. [Google Scholar] [CrossRef] [PubMed]
- Lancaster, G.A.; Dodd, S.; Williamson, P.R. Design and analysis of pilot studies: Recommendations for good practice. J. Eval. Clin. Pract. 2004, 10, 307–312. [Google Scholar] [CrossRef] [PubMed]
- UNESCO; WHC. Historic Cairo. Available online: http://whc.unesco.org/en/list/89/ (accessed on 21 June 2019).
- Maiyaki, A.A.; Mohd Mokhtar, S.S. Determinants of customer behavioural responses: A pilot study. Int. Bus. Res. 2011, 4, 193–197. [Google Scholar] [CrossRef][Green Version]
- Williams, A. How to… Write and analyse a questionnaire. J. Orthod. 2003, 30, 245–252. [Google Scholar] [CrossRef] [PubMed]
- UNESCO; WHC. Urban Regeneration Project for Historic Cairo. Available online: https://whc.unesco.org/en/historic-cairo-project/ (accessed on 22 June 2019).
- Warner, N. The Monuments of Historic Cairo: A Map and Descriptive Catalogue; American University in Cairo Press Cairo: Cairo, Egypt, 2005. [Google Scholar]
- Earth, G. Available online: http://earth.google.com (accessed on 21 June 2020).
- Ministry of Tourism and Antiquities. Discover Egypt’s Monuments. Available online: https://egymonuments.gov.eg/en/ (accessed on 16 May 2021).
- Tongco, M.D.C. Purposive sampling as a tool for informant selection. Ethnobot. Res. Appl. 2007, 5, 147–158. [Google Scholar] [CrossRef]
- Knapp, T.R.; Mueller, R.O. Reliability and validity of instruments. In The Reviewer’s Guide to Quantitative Methods in the Social Sciences; Routledge: Madison, WI, USA, 2010; pp. 337–342. [Google Scholar]
- Santos, J.R.A. Cronbach’s alpha: A tool for assessing the reliability of scales. J. Ext. 1999, 37, 1–5. [Google Scholar]
- Thatcher, R.W. Validity and reliability of quantitative electroencephalography. J. Neurother. 2010, 14, 122–152. [Google Scholar] [CrossRef]
- Westen, D.; Rosenthal, R. Quantifying construct validity: Two simple measures. J. Personal. Soc. Psychol. 2003, 84, 608. [Google Scholar] [CrossRef]
- Osborne, J.W. What is rotating in exploratory factor analysis? Pract. Assess. Res. Eval. 2015, 20, 2. [Google Scholar] [CrossRef]
- Amaya-Molinar, C.M.; Sosa-Ferreira, A.P.; Ochoa-Llamas, I.; Moncada-Jiménez, P. The Perception of Destination Competitiveness by Tourists. 2017, Volume 14, pp. 1–20. Available online: http://rua.ua.es/dspace/handle/10045/72115 (accessed on 2 November 2021). [CrossRef]
- Reise, S.P.; Waller, N.G.; Comrey, A.L. Factor analysis and scale revision. Psychol. Assess. 2000, 12, 287. [Google Scholar] [CrossRef]
- Fabrigar, L.R.; Wegener, D.T. Exploratory Factor Analysis; Oxford University Press: Oxford, UK, 2011. [Google Scholar]
- Yong, A.G.; Pearce, S. A beginner’s guide to factor analysis: Focusing on exploratory factor analysis. Tutor. Quant. Methods Psychol. 2013, 9, 79–94. [Google Scholar] [CrossRef]
- Rabbat, N.O. The Citadel of Cairo: A New Interpretation of Royal Mameluk Architecture; E.J. Brill: Leiden, The Netherlands, 1995. [Google Scholar]
Figure 1.
Methodological procedures to achieve the research objective.
Figure 1.
Methodological procedures to achieve the research objective.
Figure 2.
The boundaries of historic Cairo with the distinction of the three destinations selected for the pilot study. Source: Authors—based on [
54,
55,
56].
Figure 2.
The boundaries of historic Cairo with the distinction of the three destinations selected for the pilot study. Source: Authors—based on [
54,
55,
56].
Figure 3.
Component score coefficient matrix of all categories (CSg) within each dimension. Source: authors.
Figure 3.
Component score coefficient matrix of all categories (CSg) within each dimension. Source: authors.
Figure 4.
Map of Salah al-Din Castle (case study) with a color classification of historical buildings (monuments) by various periods. Source: authors—based on [
55].
Figure 4.
Map of Salah al-Din Castle (case study) with a color classification of historical buildings (monuments) by various periods. Source: authors—based on [
55].
Figure 5.
The grade for each category within the nine main dimensions on a categorical scale.
Figure 5.
The grade for each category within the nine main dimensions on a categorical scale.
Figure 6.
The total grade for nine dimensions within the index on a categorical scale.
Figure 6.
The total grade for nine dimensions within the index on a categorical scale.
Table 1.
The factor loading, component score coefficient, the Cronbach alpha coefficient, and categories for the first dimension within the proposed index (source: authors).
Table 1.
The factor loading, component score coefficient, the Cronbach alpha coefficient, and categories for the first dimension within the proposed index (source: authors).
| Infrastructure (Public and Tourism) and Facilities |
|---|
| Category | KPIs | Components | CSi |
|---|
| 1 | 2 | 3 |
|---|
General infrastructure and ICT
readiness | Quality of domestic transportation | 0.696 | | | 0.140 |
| Quality of electricity supply | 0.578 | | | 0.115 |
| Access to improved drinking water | 0.748 | | | 0.156 |
| Access to improved sanitation | 0.694 | | | 0.141 |
| Quality of roads between the places of visit | 0.501 | | | 0.094 |
| ADSL coverage ratio | 0.744 | | | 0.139 |
| 3G antenna coverage ratio | 0.639 | | | 0.123 |
| Financial institution and ATM | 0.897 | | | 0.180 |
| Periodic upgrading of tourism infrastructure | 0.791 | | | 0.157 |
| Tourist infrastructure | Free access Wi-Fi networks | | 0.603 | | 0.211 |
| Providing smart banking services | | 0.500 | | 0.186 |
| Number of tour operators at site | | 0.590 | | 0.214 |
| Quality of health care | | 0.594 | | 0.210 |
| Presence of major car rental companies | | 0.575 | | 0.192 |
| Diversity and quality of accommodation | | 0.747 | | 0.267 |
| Quality/variety of food services | | 0.618 | | 0.203 |
Supporting
services | Adequate public transport support for disabled | | | −0.523 | −0.211 |
| Quality of air transport infrastructure | | | 0.673 | 0.277 |
| Number of international exhibitions and cultural events | | | −0.634 | −0.276 |
| Diversity of tourism activities without negative effects | | | −0.609 | −0.268 |
| % Total variance explained | 50.493% | Bartlett’s test of
sphericity | Approx.Chi-square | 738.844 |
| Kaiser–Meyer–Olkin value | 0.742 | Df | 190 |
| Cronbach’s alpha value | 0.788 | Sig. | 0.000 |
Table 2.
The factor loading, component score coefficient, and categories for the heritage and cultural resources dimension within the proposed index (source: authors).
Table 2.
The factor loading, component score coefficient, and categories for the heritage and cultural resources dimension within the proposed index (source: authors).
| Heritage and Cultural Resources |
|---|
| Category | KPIs | Components | CSi |
|---|
| 1 | 2 | 3 |
|---|
Historic/heritage sites and Buildings
(heritage attractions) | Number of places/buildings available for visit | 0.500 | | | 0.159 |
| Number of heritage buildings demolished | 0.516 | | | 0.170 |
| Number of buildings considered in a degraded condition | 0.793 | | | 0.234 |
| Number of buildings/districts listed on endangered sites lists | 0.737 | | | 0.253 |
| Number of old buildings designated at national levels | 0.528 | | | 0.193 |
| Proportion of threats to the integrity of heritage property | 0.740 | | | 0.228 |
Clarity/strength of
heritage destination image | Proportion of historical buildings in the destination | | 0.745 | | 0.264 |
| Proportion of vernacular buildings in destination | | 0.833 | | 0.297 |
| Number of heritage buildings reused for commercial purposes | | 0.604 | | 0.211 |
| Number of heritage buildings reused for tourism purposes | | 0.730 | | 0.291 |
Attractions natural and
artificial | Number of natural heritage sites | | | 0.556 | 0.292 |
| Number of cultural activities and creative arts | | | 0.694 | 0.314 |
| Number of visiting hours per place/building | | | 0.729 | 0.346 |
| Number of places/buildings free to the entire public | | | −0.528 | −0.259 |
| % Total variance explained | 56.740% | Bartlett’s test of
sphericity | Approx. Chi-square | 432.77 |
| Kaiser–Meyer–Olkin value | 0.711 | Df | 91 |
| Cronbach’s alpha value | 0.601 | Sig. | 0.000 |
Table 3.
The factor loading, component score coefficient, and categories for the smart access dimension within the proposed index (source: authors).
Table 3.
The factor loading, component score coefficient, and categories for the smart access dimension within the proposed index (source: authors).
| Smart Access |
|---|
| Category | KPIs | Component | CSi |
|---|
| 1 |
|---|
Digital
mobility | Availability of interpretive panels and promotional materials such as (NFC/RFID/QR codes) | 0.798 | 0.375 |
| Availability of interactive map and trajectory systems based on augmented reality techniques | 0.617 | 0.290 |
| An official website that follows the accessibility guidelines | 0.707 | 0.332 |
| A tourism website to access information for tourists with disabilities | 0.781 | 0.367 |
| % Total variance explained | 53.152% | Bartlett’s test of sphericity | Approx. Chi-square | 62.510 |
| Kaiser–Meyer–Olkin value | 0.730 | Df | 6 |
| Cronbach’s alpha value | 0.686 | Sig. | 0.000 |
Table 4.
The factor loading, component score coefficient, and categories for the sustainability dimension within the proposed index (source: authors).
Table 4.
The factor loading, component score coefficient, and categories for the sustainability dimension within the proposed index (source: authors).
| Sustainability |
|---|
| Category | KPIs | Components | CSi |
|---|
| 1 | 2 |
|---|
Initiatives in favor of
sustainability | Waste recycling and processing | 0.637 | | 0.275 |
| Proportion of companies with social responsibility programs (CSR) | 0.876 | | 0.338 |
| Presence of voluntary contributions | 0.863 | | 0.336 |
| Involving local translators in heritage interpretation programs | 0.781 | | 0.305 |
Environmental
management measures | Energy efficiency measures and management | | 0.827 | 0.439 |
| Use of environmental management systems (EMS) | | 0.951 | 0.489 |
| Social awareness programs for the visitor and the host community | | 0.555 | 0.274 |
| % Total variance explained | 56.932% | Bartlett’s test of sphericity | Approx. Chi-square | 160.173 |
| Kaiser–Meyer–Olkin value | 0.675 | Df | 21 |
| Cronbach’s alpha values | 0.700 | Sig. | 0.000 |
Table 5.
The factor loading, component score coefficient, and categories for the tourist market dimension within the proposed index (source: authors).
Table 5.
The factor loading, component score coefficient, and categories for the tourist market dimension within the proposed index (source: authors).
| Tourist Market |
|---|
| Category | KPIs | Components | CSi |
|---|
| 1 | 2 | 3 | 4 |
|---|
Tourism marketing strategies and
economic effects | GDP per capita | 0.524 | | | | 0.148 |
| Provide online some promotional materials | 0.669 | | | | 0.191 |
| Effectiveness of marketing and branding | 0.565 | | | | 0.158 |
| Development of search engine optimization (SEO) to the marketing of the heritage destination | 0.681 | | | | 0.195 |
| Use of central reservation system (CRS) | 0.697 | | | | 0.196 |
Use the customer relationship management (CRM)
system | 0.678 | | | | 0.195 |
| Interpretation programs explain current variations in the destination | 0.500 | | | | 0.131 |
Supportive
indicators for development | An average number of visitors per day for each place/building | | 0.742 | | | 0.316 |
| Contribution of visitors’ activities to social and economic development | | 0.572 | | | 0.251 |
| Number of electronic and printed articles on the heritage destination | | 0.696 | | | 0.298 |
Factors
affecting the
development of the
tourism market | Visitor satisfaction and intention to repeat visits | | | −0.761 | | −0.198 |
| Availability of tax concessions | | | −0.549 | | −0.144 |
| Level of funding put towards the restoration | | | −0.784 | | −0.202 |
| The response rate of tourism developments to visitors’ needs and aspirations | | | −0.793 | | −0.205 |
| Contribution of tourism activities to the protection of heritage values | | | −0.780 | | −0.204 |
| Allocating tourism revenues to protect heritage values. | | | −0.589 | | −0.155 |
Market performance and tourism
contributions | Air ticket prices | | | | 0.592 | 0.129 |
| Prices for hotels and accommodations | | | | 0.734 | 0.172 |
| Cost of obtaining an entry visa | | | | 0.545 | 0.115 |
| Contribution of tourism revenues to total export value | | | | 0.665 | 0.145 |
| Direct gross domestic product (GDP) of tourism | | | | 0.602 | 0.133 |
| The growth rate of visitor expenses | | | | 0.779 | 0.183 |
| Contribution of tourism to employment and training | | | | 0.717 | 0.175 |
Rate of foreign direct investment (FDI) in the tourism
industry | | | | 0.400 | 0.077 |
| The average length of stay for tourists | | | | 0.560 | 0.117 |
Contribution of the sale of handicrafts as economic
dividend | | | | 0.610 | 0.148 |
| Availability of tourism promotion programs to stimulate the visit | | | | 0.500 | 0.199 |
| % Total variance explained | 51.407% | Bartlett’s test of sphericity | Approx. Chi-square | 1069.00 |
| Kaiser–Meyer–Olkin value | 0.732 | Df | 351 |
| Cronbach’s alpha values | 0.862 | Sig. | 0.000 |
Table 6.
The factor loading, component score coefficient, and categories for the management dimension within the proposed index (source: authors).
Table 6.
The factor loading, component score coefficient, and categories for the management dimension within the proposed index (source: authors).
| Management |
|---|
| Category | KPIs | Components | CSi |
|---|
| 1 | 2 | 3 | 4 |
|---|
Planning and
development
policies | Planning for improving tourism competitiveness | 0.698 | | | | 0.278 |
| Government prioritization of travel and tourism industry | 0.687 | | | | 0.302 |
| Tourism projects show the aesthetic dimensions of the heritage destination’s visual image | 0.753 | | | | 0.310 |
| Impact of commercial rules on FDI | 0.529 | | | | 0.257 |
Human resources and business
environment | Adoption of initiatives to enhance the efficiency of government tourism spending | | 0.500 | | | 0.287 |
| Use ongoing assessment programs to assess the progressive effects of tourism activities | | 0.505 | | | 0.274 |
| Train counselors to enhance their skills in interpreting cultural values. | | 0.823 | | | 0.388 |
| Quality employment productivity | | 0.619 | | | 0.282 |
| Availability of investment capital | | 0.647 | | | 0.298 |
Destination
management measures | Attention to tourism offer and destination issues | | | 0.574 | | 0.319 |
| Long-term Protection of living cultures and heritage places | | | 0.778 | | 0.461 |
| Stakeholder collaboration to maximize conservation outcomes and tourism offer | | | 0.502 | | 0.269 |
| Tourism Development initiatives | Sharing of tourism benefits a to improve social and economic development | | | | −0.527 | −0.372 |
| Use of ICT for commercial transactions | | | | −0.736 | −0.549 |
| % Total variance explained | 53.347% | Bartlett’s test
of sphericity | Approx. Chi-square | 212.40 |
| Kaiser–Meyer–Olkin value | 0.652 | Df | 91 |
| Cronbach’s alpha values | 0.637 | Sig. | 0.000 |
Table 7.
The factor loading, component score coefficient, and categories for the information systems dimension within the proposed index (source: authors).
Table 7.
The factor loading, component score coefficient, and categories for the information systems dimension within the proposed index (source: authors).
| Information Systems |
|---|
| Category | KPIs | Components | CSi |
|---|
| 1 | 2 |
|---|
Mechanisms for managing
digital information | Availability of information platform for tourists about reservations and dates of cultural events | 0.578 | | 0.211 |
| Availability of automated information in tourism offices | 0.556 | | 0.194 |
| Use of the internet of things (IoT) and sensors to gather information on visitors and crowd control | 0.840 | | 0.311 |
| Availability and management of open data | 0.714 | | 0.258 |
| Presentation of statistical data for heritage destination | 0.840 | | 0.313 |
Services
included | Announce current and projected weather for a week. | | 0.644 | 0.423 |
| The presence of a tourist information center, guided tours | | 0.920 | 0.622 |
| % Total variance explained | 61.582% | Bartlett’s test of sphericity | Approx. Chi-square | 193.85 |
| Kaiser–Meyer–Olkin value | 0.777 | Df | 21 |
| Cronbach’s alpha values | 0.775 | | Sig. | 0.000 |
Table 8.
The factor loading, component score coefficient, and categories for the innovation dimension within the proposed index.
Table 8.
The factor loading, component score coefficient, and categories for the innovation dimension within the proposed index.
| Innovation |
|---|
| Category | KPIs | Components | CSi |
|---|
| 1 | 2 |
|---|
Innovative
ancillary
application and
systems | Apply Destination Management Systems (DMS) to improve decision-making | 0.939 | | 0.217 |
| Implement smart tourism cards to facilitate visitor access to services in a unified manner | 0.853 | | 0.210 |
| Use technology to show the uniqueness of cultural heritage | 0.936 | | 0.219 |
| Smart multilingual applications for electronic health records | 1.065 | | 0.247 |
| Multilingual applications of the tourism packages | 0.727 | | 0.183 |
Initiatives to develop the capacity for tourism
innovation | Use of ICT in tourism companies | | 0.511 | 0.219 |
| Staff training to improve service quality | | 0.839 | 0.351 |
| Spending on innovation | | 0.631 | 0.266 |
| Public-private cooperation structures | | 0.676 | 0.302 |
| Provides a complaints department to record tourist complaints | | 0.527 | 0.242 |
Support postal services for tourists through tourist sites or mobile
applications | | 0.439 | 0.216 |
| % Total variance explained | 51.828% | Bartlett’s test of sphericity | Approx. Chi-square | 399.2 |
| Kaiser–Meyer–Olkin value | 0.769 | Df | 55 |
| Cronbach’s alpha values | 0.774 | Sig. | 0.000 |
Table 9.
The factor loading, component score coefficient (cs), and categories for operating efficiency equipment for the reused heritage buildings dimension within the proposed index (source: authors).
Table 9.
The factor loading, component score coefficient (cs), and categories for operating efficiency equipment for the reused heritage buildings dimension within the proposed index (source: authors).
| Operating Efficiency Equipment for Reused Heritage Buildings |
|---|
| Category | KPIs | Components | CSi |
|---|
| 1 | 2 | 3 | 4 |
|---|
Retrofitting heritage buildings with
smart technology | Quality of multimedia system service | 0.420 | | | | 0.053 |
| Conference and meeting facilities | 0.917 | | | | 0.087 |
| Integration of audio, video, and computer services | 0.697 | | | | 0.059 |
| Present the updated information on a display screen | 0.783 | | | | 0.080 |
| Building automation systems and services | 0.740 | | | | 0.073 |
| Usage of an electronic directory | 0.812 | | | | 0.083 |
| Availability of a computer workstation | 0.583 | | | | 0.069 |
| Internet network management system | 0.725 | | | | 0.072 |
| Interactive directory availability | 0.776 | | | | 0.087 |
| Remote control and access to building systems | 0.827 | | | | 0.075 |
| Activate Bluetooth service | 0.582 | | | | 0.058 |
| Actual use of renewable energy | 0.861 | | | | 0.080 |
| Wireless power sensors to monitor building consumption | 0.790 | | | | 0.085 |
| Reuse of waste from the building | 0.768 | | | | 0.085 |
| Energy reuse | 0.901 | | | | 0.086 |
| Earthquake monitoring devices | 0.725 | | | | 0.065 |
| Easy to control lighting via device or phone | 0.515 | | | | 0.037 |
| Adjust lighting level according to occupancy | 0.516 | | | | 0.035 |
Basic requirements
and systems | Voice service efficiency | | 0.500 | | | 0.154 |
| Provide a website for the building | | 0.582 | | | 0.184 |
| Availability of electrical services | | 0.624 | | | 0.201 |
| Flushing systems | | 0.500 | | | 0.156 |
| Automation of security controls at main entrances | | 0.551 | | | 0.173 |
| Firefighting system | | 0.530 | | | 0.156 |
| Security and crowd control management plan | | 0.712 | | | 0.203 |
| Non-coherent building materials control plan | | 0.664 | | | 0.192 |
| Measures to manage the building and its users | Digital employee ID card | | | −0.568 | | −0.195 |
| Examination of the general construction status of the building | | | −0.500 | | −0.168 |
| Building risk management plan | | | −0.536 | | −0.181 |
| Complete building operation and maintenance plan | | | −0.500 | | −0.175 |
| Thermal comfort and indoor air quality | | | −0.430 | | −0.133 |
| Monitor the condition of the building | Monitoring the volume of building occupancy through screens | | | | 0.621 | 0.176 |
| Monitoring the temperature of electrical units | | | | 0.896 | 0.237 |
| Monitoring of electrical load | | | | 0.945 | 0.256 |
| HVAC services | | | | 0.682 | 0.198 |
| % Total variance explained | 57.379% | Bartlett’s test of sphericity | Approx. Chi-square | 2904.023 |
| Kaiser–Meyer–Olkin value | 0.717 | Df | 595 |
| Cronbach’s alpha values | 0.913 | Sig. | 0.000 |
Table 10.
Descriptive results.
Table 10.
Descriptive results.
| N. | Dimension | Categories | Descriptive Results |
|---|
| Min | Max | Mean | Std.
Deviation |
|---|
| 1 | Infrastructure and facilities | General infrastructure and ICT readiness | 1.581 | 2.826 | 2.176 | 0.315 |
| Tourist infrastructure | 4.089 | 5.205 | 4.909 | 0.297 |
| supporting services | −1.988 | −0.689 | −1.285 | 0.338 |
| Dimension 1 | 3.458 | 4.609 | 4.061 | 0.285 |
| 2 | Natural and
cultural
resources | Historic/heritage sites and buildings (heritage attractions) | 1.641 | 2.540 | 2.022 | 0.245 |
| Clarity/strength of heritage destination image | 1.063 | 1.862 | 1.415 | 0.234 |
| Attractions natural and artificial | 0.434 | 1.699 | 1.005 | 0.312 |
| Dimension 2 | −0.592 | 0.471 | −0.119 | 0.248 |
| 3 | Smart access | Digital mobility | 3.103 | 4.092 | 3.847 | 0.267 |
| Dimension 3 |
| 4 | Sustainability | Initiatives in favor of sustainability | 2.722 | 4.312 | 4.014 | 0.344 |
| Environmental management measures | 4.808 | 6.010 | 5.856 | 0.236 |
| Dimension 4 | 4.744 | 5.790 | 5.537 | 0.231 |
| 5 | Tourist market | Tourism marketing strategies and economic effects | 4.933 | 5.793 | 5.595 | 0.214 |
| Supportive indicators for development | 0.865 | 2.279 | 1.333 | 0.284 |
| Factors affecting the development of the tourism market | −3.324 | −1.612 | −2.704 | 0.331 |
| Market performance and tourism contributions | 3.310 | 4.896 | 4.151 | 0.349 |
| Dimension 5 | 2.180 | 3.650 | 2.709 | 0.250 |
| 6 | Management | Planning and development policies | 4.707 | 6.111 | 5.043 | 0.317 |
| Human resources and business environment | 5.015 | 6.270 | 5.869 | 0.393 |
| Destination management measures | 3.969 | 5.337 | 4.604 | 0.340 |
| Tourism development initiatives | −5.526 | −4.605 | −5.294 | 0.331 |
| Dimension 6 | 1.032 | 2.167 | 1.788 | 0.245 |
| 7 | Information
systems | Mechanisms for managing digital information | 6.763 | 7.528 | 7.413 | 0.169 |
| Services included | 4.603 | 5.648 | 5.185 | 0.289 |
| Dimension 7 | 7.049 | 7.879 | 7.533 | 0.203 |
| 8 | Innovation | Innovative ancillary application and systems | 5.627 | 6.456 | 6.382 | 0.169 |
| Initiatives to develop the capacity for tourism innovation | 8.196 | 9.576 | 9.107 | 0.367 |
| Dimension 8 | 7.946 | 9.026 | 8.721 | 0.245 |
| 9 | Operating
efficiency equipment for reused heritage
buildings | Retrofitting heritage buildings with smart technology | 8.124 | 8.883 | 8.736 | 0.158 |
| Basic requirements and systems | 7.407 | 9.392 | 8.628 | 0.500 |
Measures to manage the building
and its users | −5.964 | −5.225 | −5.738 | 0.211 |
| Monitor the condition of the building | 5.141 | 6.069 | 5.780 | 0.239 |
| Dimension 9 | 9.919 | 10.88 | 10.423 | 0.214 |
| Publisher’s Note: MDPI stays neutral with regard to jurisdictional claims in published maps and institutional affiliations. |
© 2021 by the authors. Licensee MDPI, Basel, Switzerland. This article is an open access article distributed under the terms and conditions of the Creative Commons Attribution (CC BY) license (https://creativecommons.org/licenses/by/4.0/).


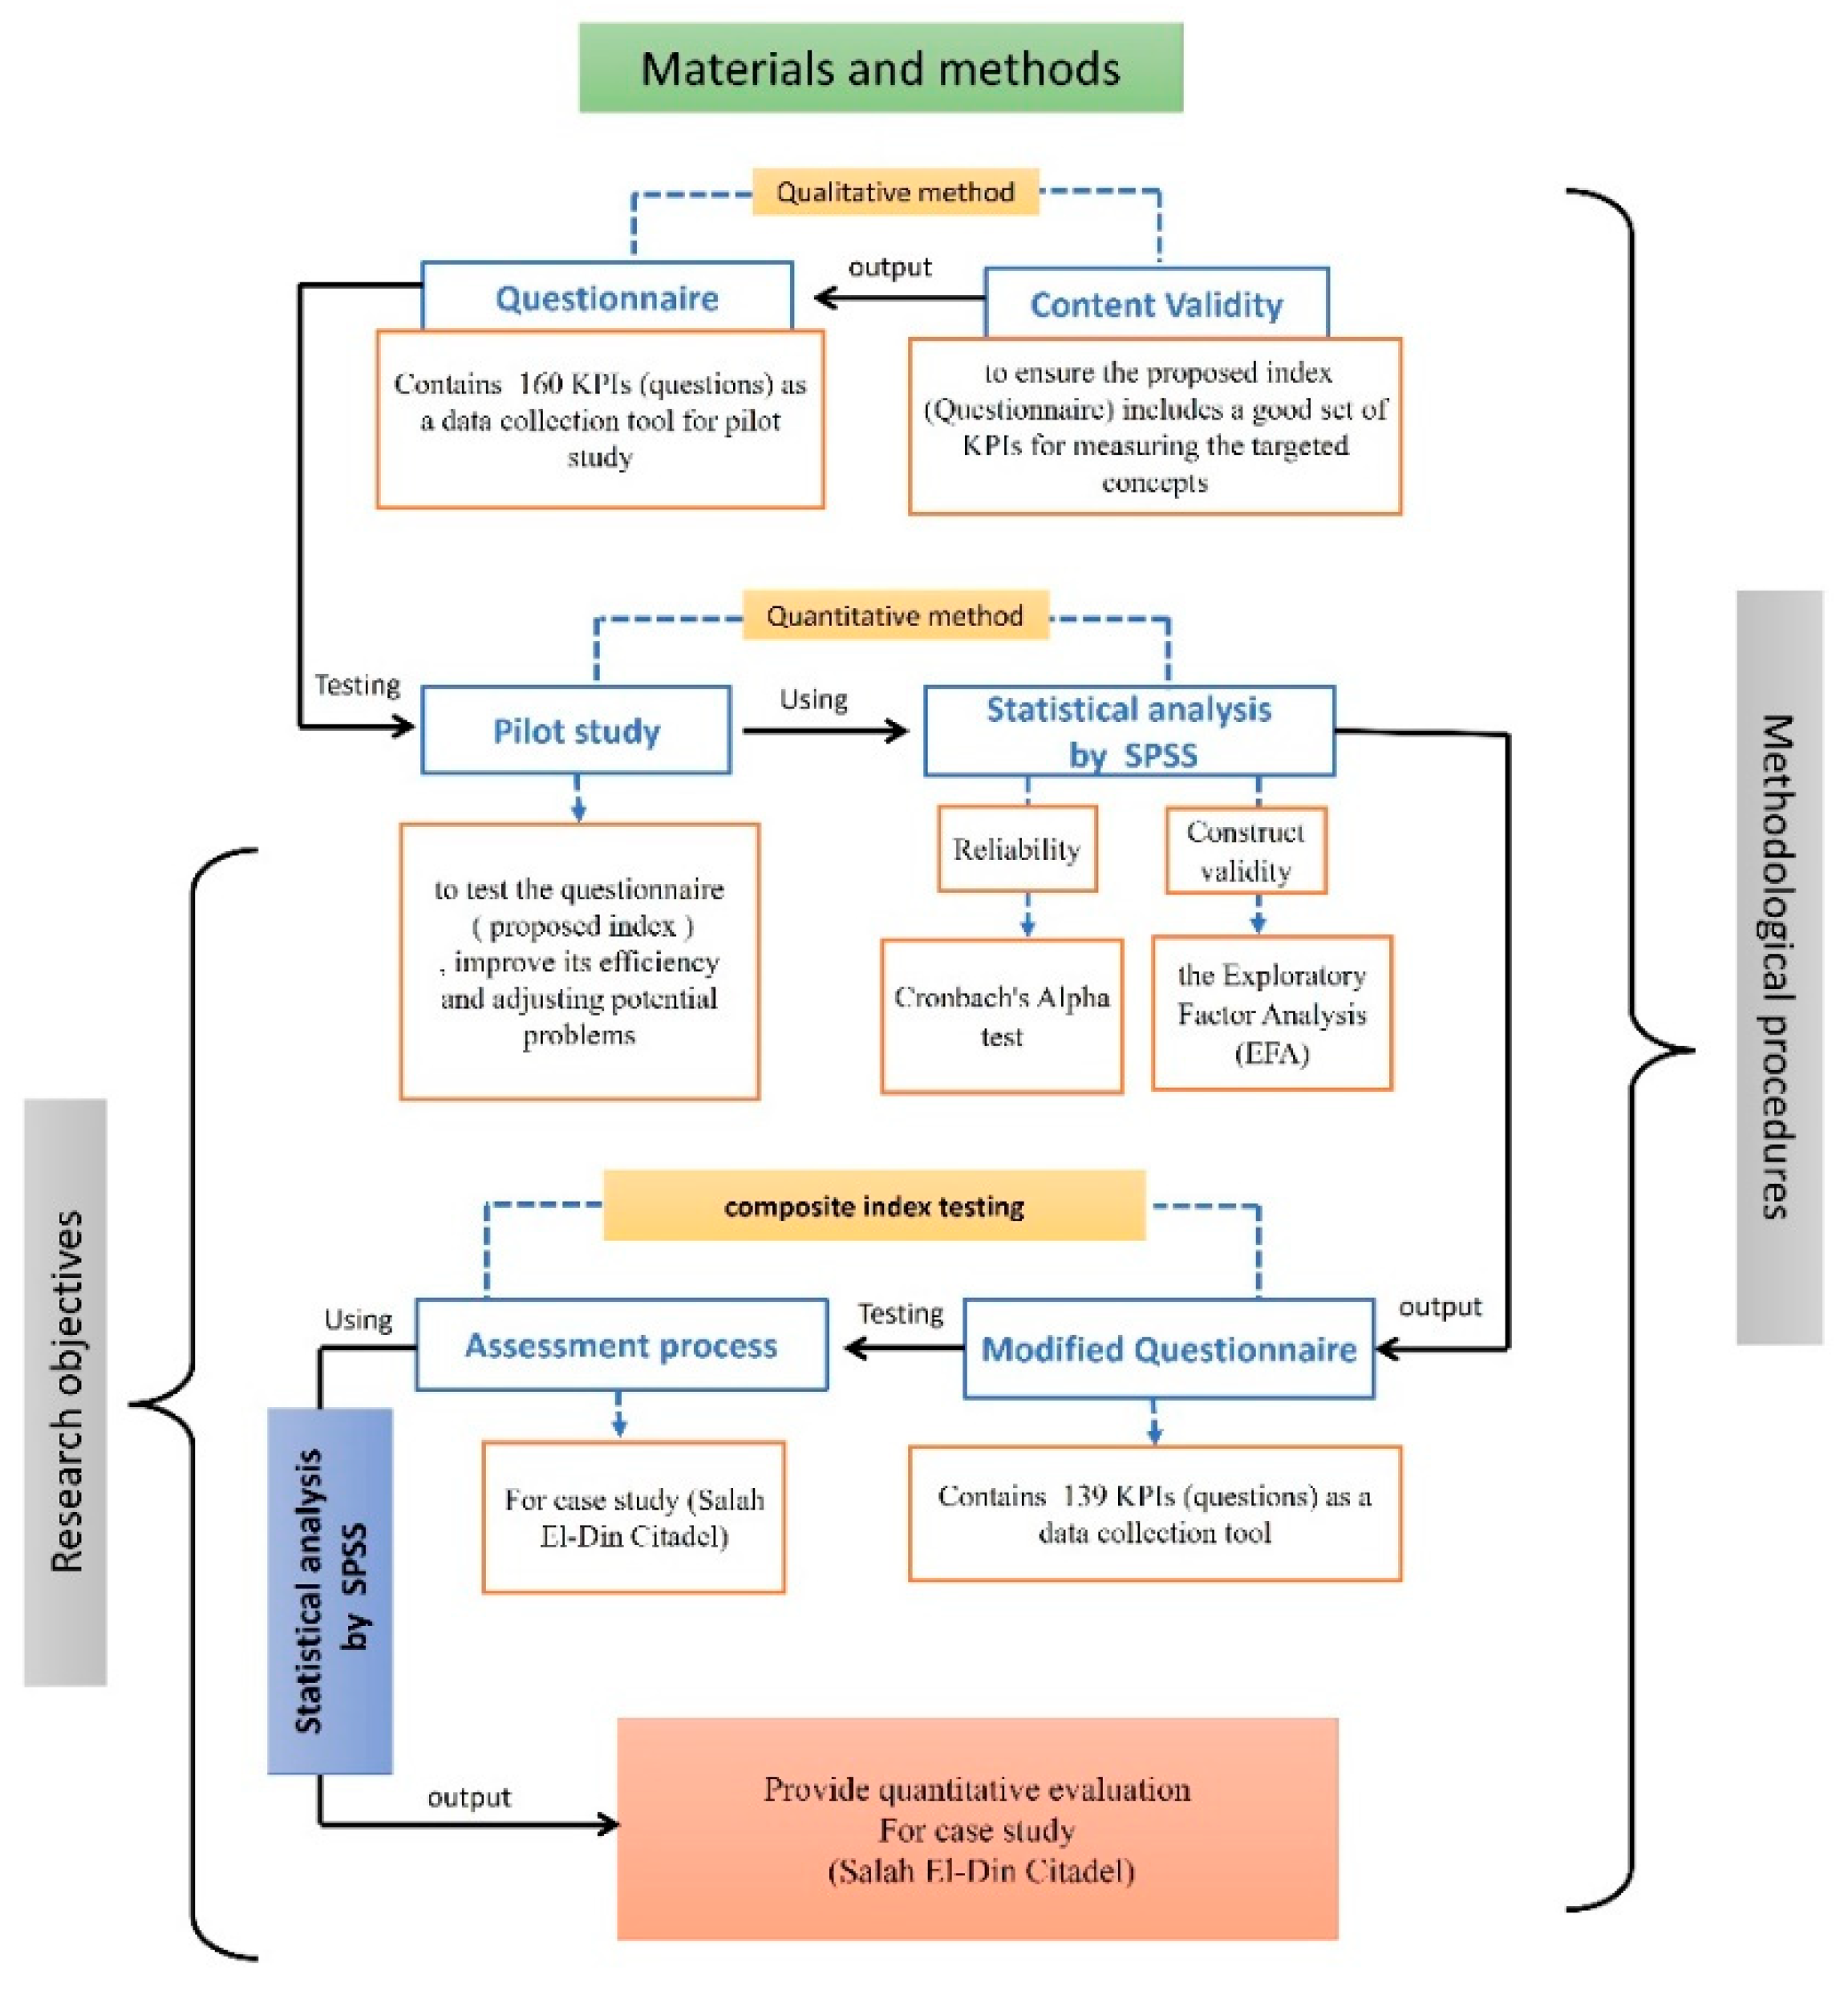