
Variability in Human Mobility during the Third Wave of COVID-19 in Japan

 , ,
, ,
Abstract
1. Introduction
2. Methods
2.1. Smart Mobility Challenge
2.2. Participants
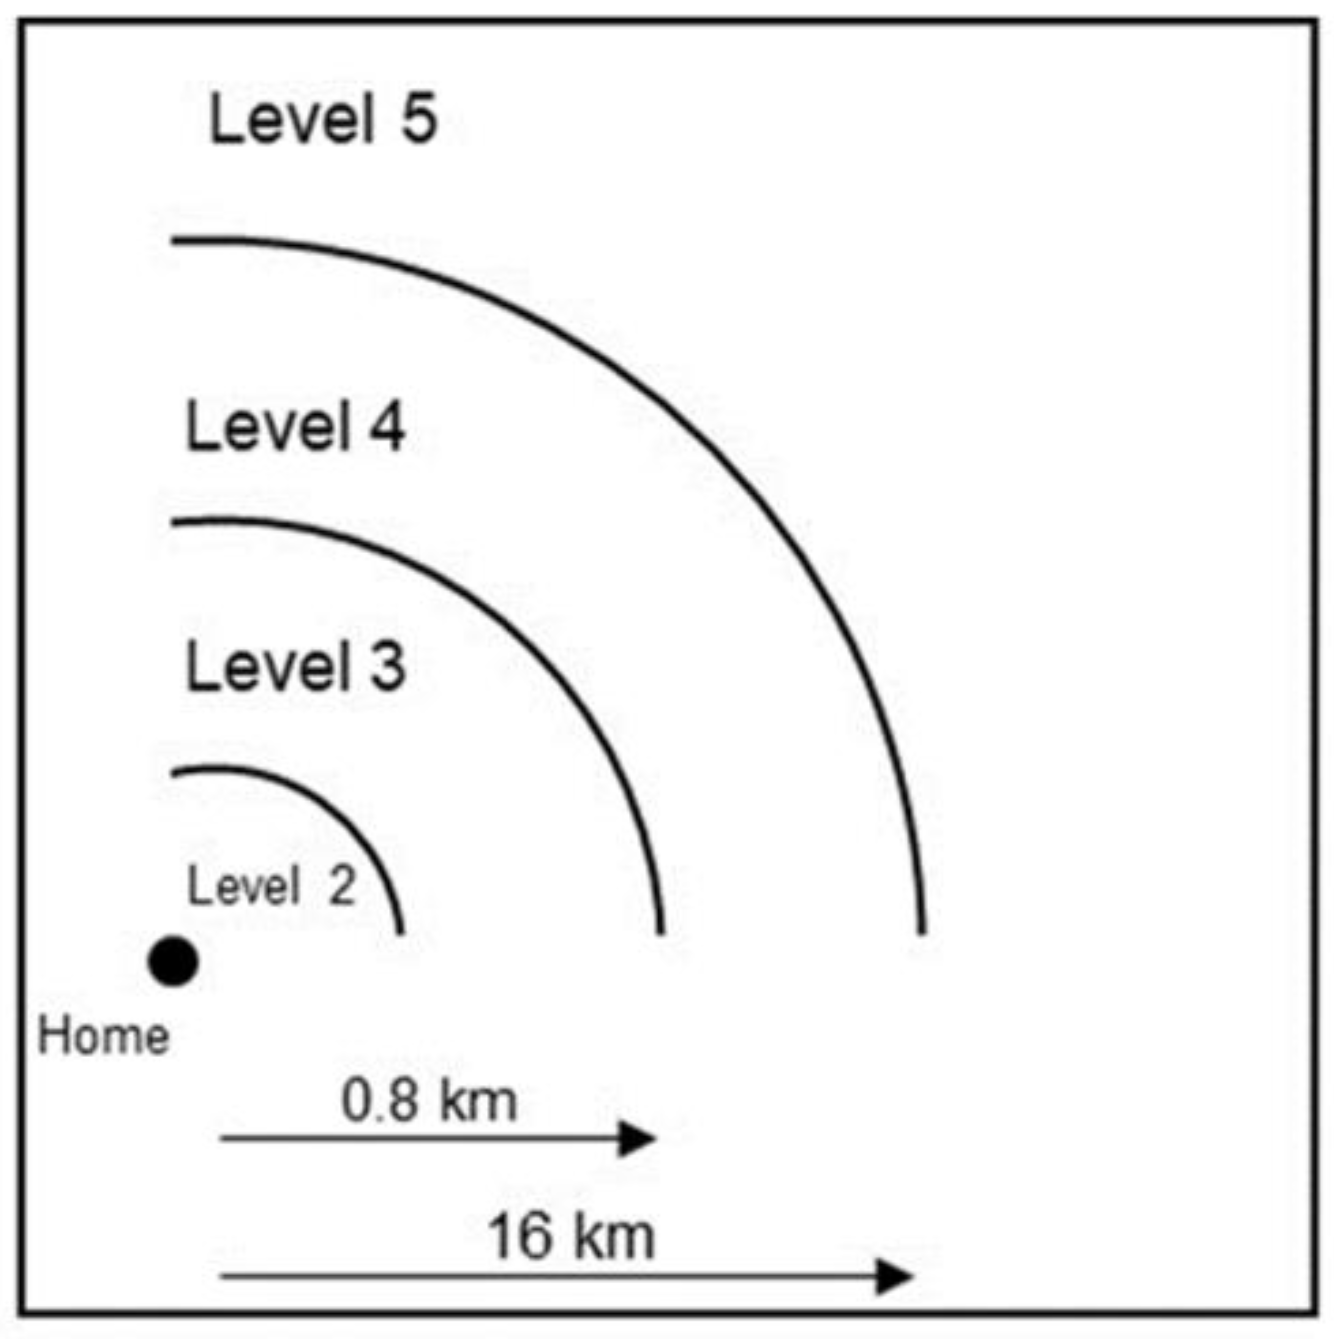
2.3. Online Survey
2.4. City Structure Survey
2.5. Other Variables
2.6. Statistical Analyses
3. Results
3.1. Participants’ Characteristics and Geographic Characteristics of Cities
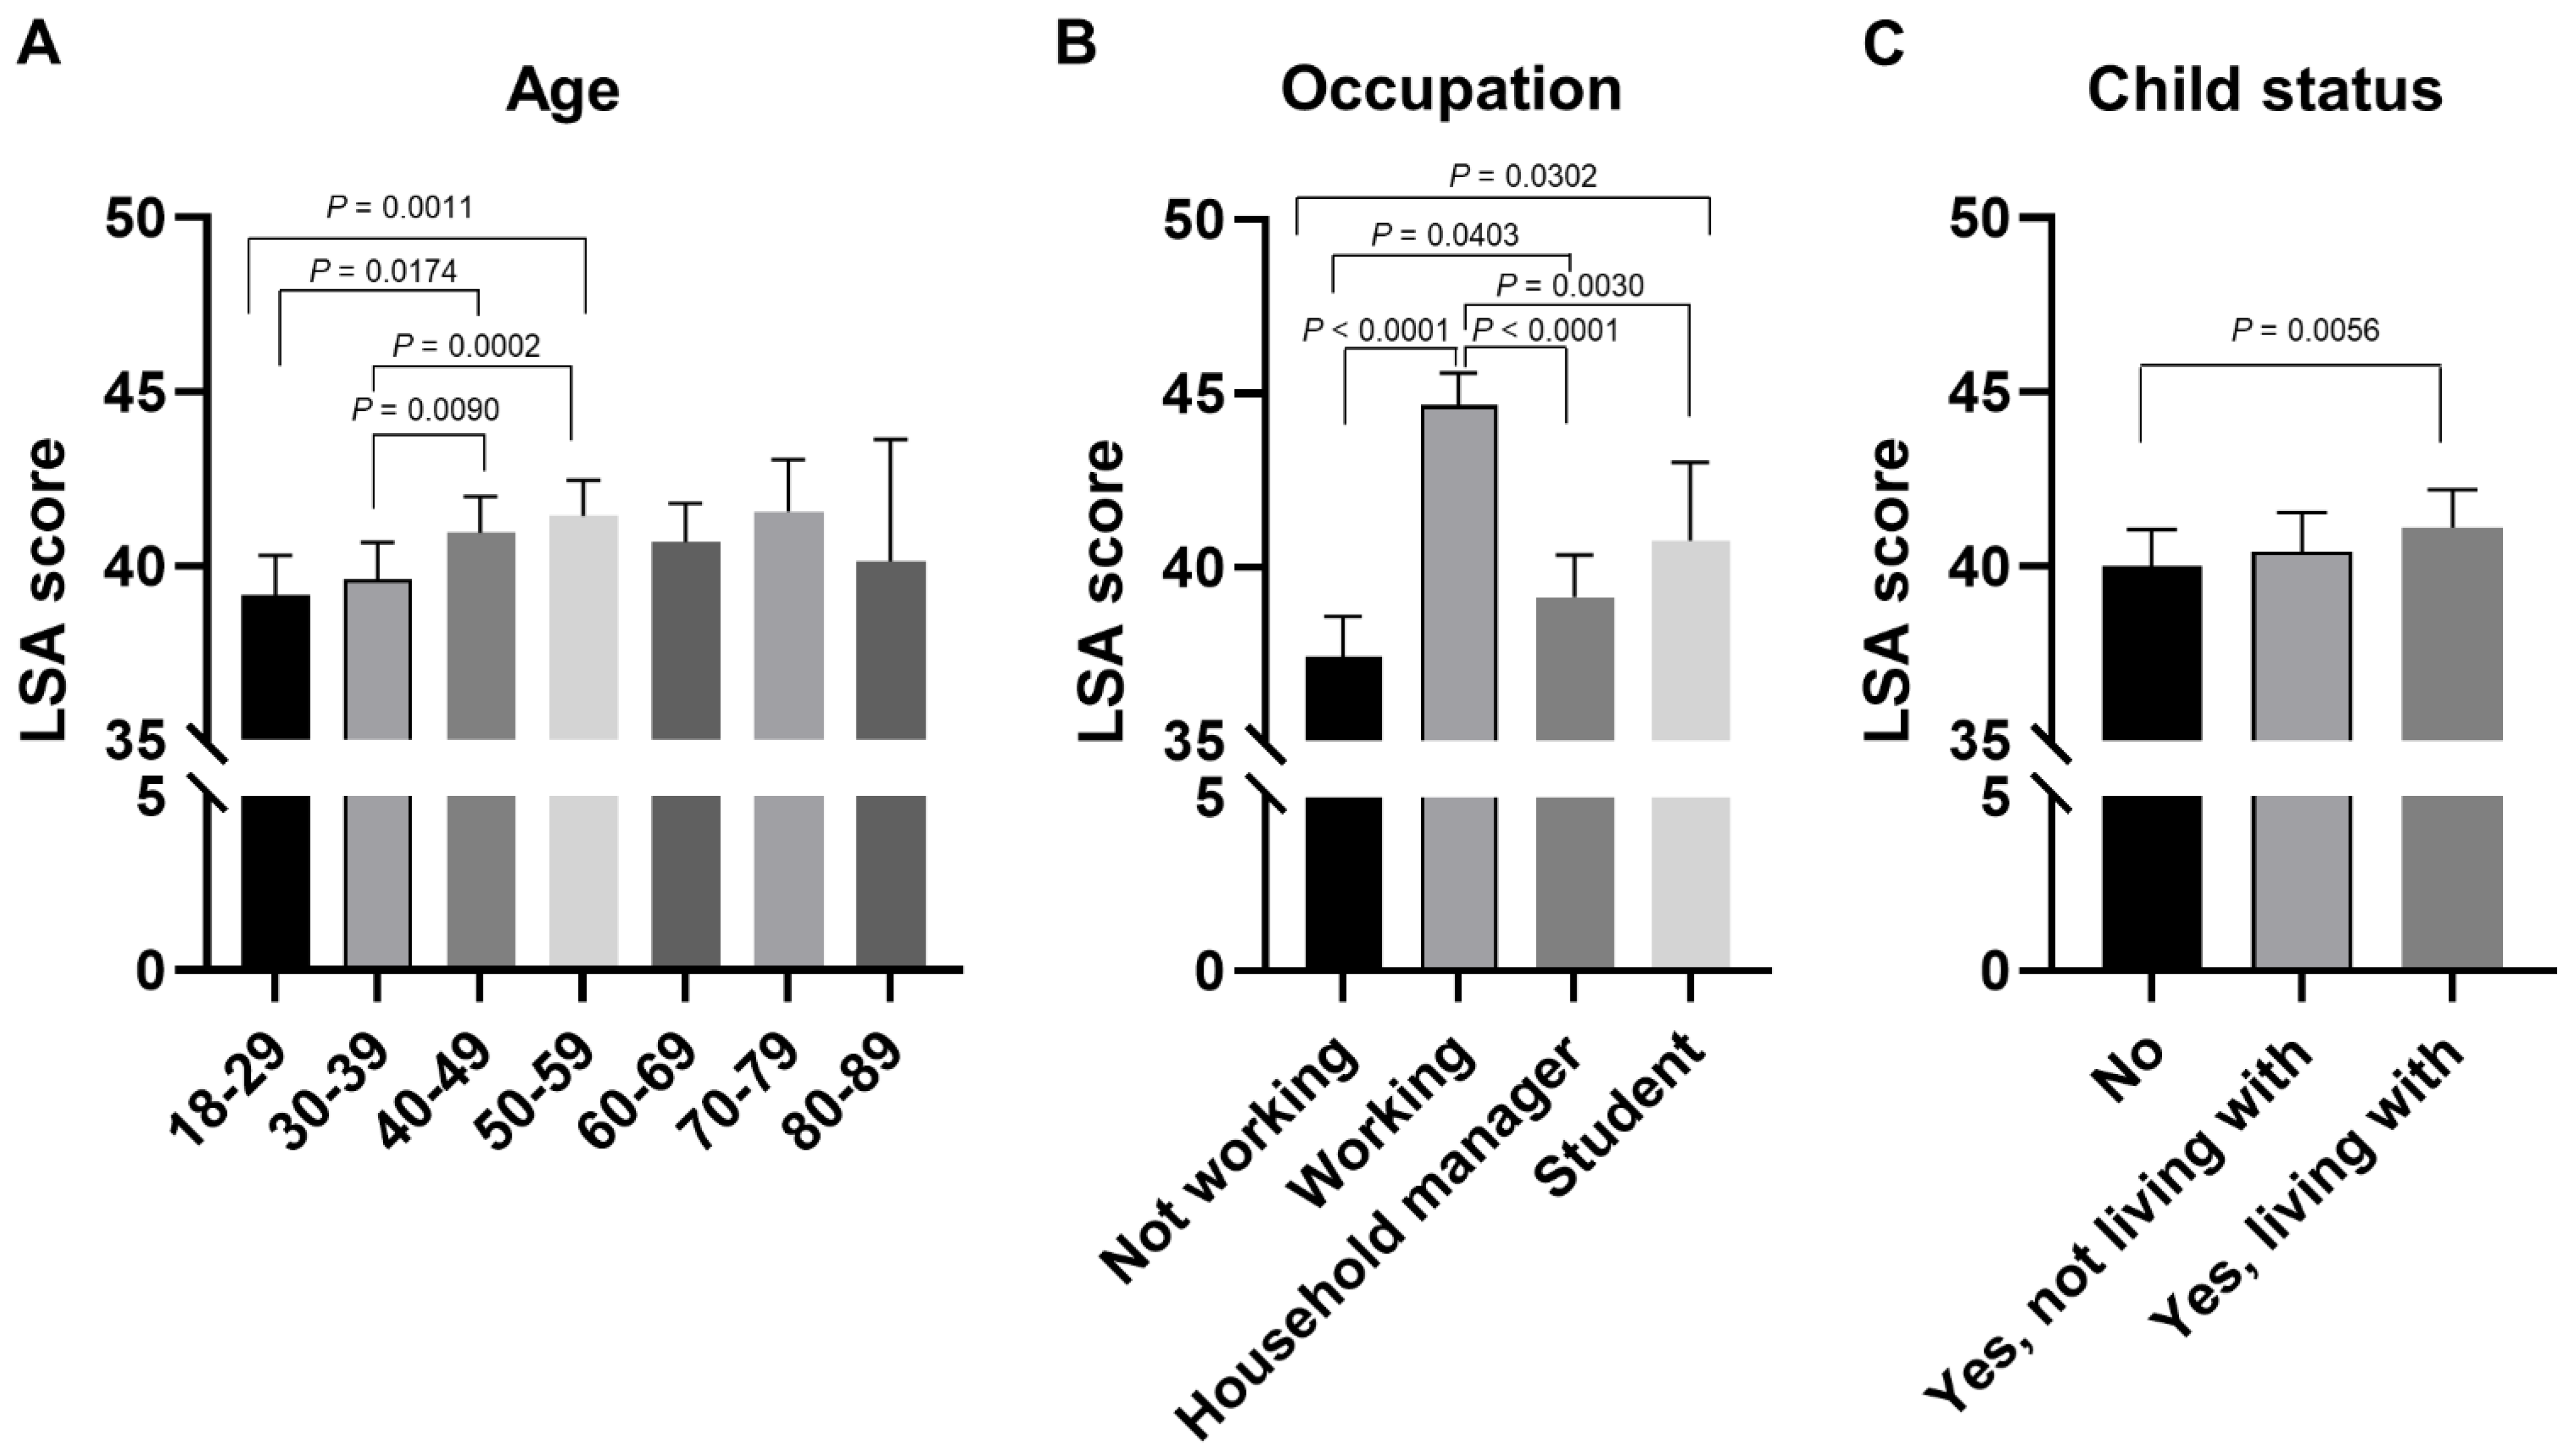
3.2. Individual Factors of Human Mobility during the Pandemic
3.3. Environmental Factors of Human Mobility during the Pandemic
3.4. COVID-19-Related Factors of Human Mobility during the Pandemic
3.5. Associations of Human Mobility with Subjective Happiness
4. Discussion
4.1. Effects of Individual Factors on Human Mobility
4.2. Effects of Environmental Factors on Human Mobility
4.3. Effects of COVID-19 on Human Mobility
4.4. Effects of Human Mobility on Subjective Happiness
4.5. Limitation
4.6. Summary of Factors That Increase/Decrease Human Mobility by Each Life Space
5. Conclusions
Supplementary Materials
Author Contributions
Funding
Institutional Review Board Statement
Informed Consent Statement
Data Availability Statement
Acknowledgments
Conflicts of Interest
References
- Gismero-Gonzalez, E.; Bermejo-Toro, L.; Cagigal, V.; Roldan, A.; Martinez-Beltran, M.J.; Halty, L. Emotional Impact of COVID-19 Lockdown Among the Spanish Population. Front. Psychol. 2020, 11, 616978. [Google Scholar] [CrossRef]
- Gan, Y.; Ma, J.; Wu, J.; Chen, Y.; Zhu, H.; Hall, B.J. Immediate and delayed psychological effects of province-wide lockdown and personal quarantine during the COVID-19 outbreak in China. Psychol. Med. 2020, 1–12. [Google Scholar] [CrossRef]
- Dragun, R.; Vecek, N.N.; Marendic, M.; Pribisalic, A.; Divic, G.; Cena, H.; Polasek, O.; Kolcic, I. Have Lifestyle Habits and Psychological Well-Being Changed among Adolescents and Medical Students Due to COVID-19 Lockdown in Croatia? Nutrients 2020, 13, 97. [Google Scholar] [CrossRef] [PubMed]
- Tanaka, T.; Okamoto, S. Increase in suicide following an initial decline during the COVID-19 pandemic in Japan. Nat. Hum. Behav. 2021, 5, 229–238. [Google Scholar] [CrossRef] [PubMed]
- Suzuki, Y.; Maeda, N.; Hirado, D.; Shirakawa, T.; Urabe, Y. Physical Activity Changes and Its Risk Factors among Community-Dwelling Japanese Older Adults during the COVID-19 Epidemic: Associations with Subjective Well-Being and Health-Related Quality of Life. Int. J. Environ. Res. Public Health 2020, 17, 6591. [Google Scholar] [CrossRef] [PubMed]
- Roos, J.M.; Sprei, F.; Holmberg, U. Sociodemography, Geography, and Personality as Determinants of Car Driving and Use of Public Transportation. Behav. Sci. 2020, 10, 93. [Google Scholar] [CrossRef] [PubMed]
- Hanibuchi, T.; Yabe, N.; Nakaya, T. Who is staying home and who is not? Demographic, socioeconomic, and geographic differences in time spent outside the home during the COVID-19 outbreak in Japan. Prev. Med. Rep. 2021, 21, 101306. [Google Scholar] [CrossRef] [PubMed]
- Harada, K.; Shimada, H.; Sawyer, P.; Asakawa, Y.; Nihei, K.; Kaneya, S.; Furuna, T.; Ishizaki, T.; Yasumura, S. Life-space of community-dwelling older adults using preventive health care services in Japan and the validity of composite scoring methods for assessment. Nihon Koshu Eisei Zasshi Jpn. J. Public Health 2010, 57, 526–537. (In Japanese) [Google Scholar]
- Oshio, A.; Abe, S.; Cutrone, P. Development, Reliability, and Validity of the Japanese Version of Ten Item Personality Inventory (TIPI-J). Jpn. J. Personal. 2012, 21, 40–52. [Google Scholar] [CrossRef]
- Gosling, S.D.; Rentfrow, P.J.; Swann, W.B. A very brief measure of the Big-Five personality domains. J. Res. Personal. 2003, 37, 504–528. [Google Scholar] [CrossRef]
- Hata, U.; Onodera, A. Development and Validation of a Japanese Version of the Ego-Resiliency Scale (ER89). Jpn. J. Personal. 2013, 22, 37–47. [Google Scholar] [CrossRef][Green Version]
- Block, J.; Kremen, A.M. IQ and ego-resiliency: Conceptual and empirical connections and separateness. J. Pers. Soc. Psychol. 1996, 70, 349–361. [Google Scholar] [CrossRef]
- Sogabe, K.; Motomura, M. Subjective-happiness-feeling of university student in adolescent stage: Toward an exploration of its influential factors. Bull. Fac. Educ. 2010, 60, 81–87. [Google Scholar]
- Lyubomirsky, S.; Lepper, H.S. A Measure of Subjective Happiness: Preliminary Reliability and Construct Validation. Soc. Indic. Res. 1999, 46, 137–155. [Google Scholar] [CrossRef]
- Tonan, K.; Sonoda, A.; Ono, Y. Production of The Subjective Well-being Inventory Japanese Edition: It’s Reliability and Validity. Jpn. J. Health Psychol. 1995, 8, 12–19. [Google Scholar] [CrossRef]
- Nagpal, D.R.; Sell, D.H. Subjcetive Well-Being; World Health Organization: New Delhi, India, 1985. [Google Scholar]
- National Land Numerical Information. In National Land Information Division, National Spatial Planning and Regional Policy Bureau, MLIT of Japan. Available online: https://nlftp.mlit.go.jp/ksj/ (accessed on 30 January 2021).
- Yabe, S.; Imanishi, K.; Nishida, K. Two-step seismic noise reduction caused by COVID-19 induced reduction in social activity in metropolitan Tokyo, Japan. Earth Planets Space 2020, 72, 167. [Google Scholar] [CrossRef]
- Yabe, T.; Tsubouchi, K.; Fujiwara, N.; Wada, T.; Sekimoto, Y.; Ukkusuri, S.V. Non-compulsory measures sufficiently reduced human mobility in Tokyo during the COVID-19 epidemic. Sci. Rep. 2020, 10, 18053. [Google Scholar] [CrossRef]
- Nagata, S.; Nakaya, T.; Adachi, Y.; Inamori, T.; Nakamura, K.; Arima, D.; Nishiura, H. Mobility Change and COVID-19 in Japan: Mobile Data Analysis of Locations of Infection. J. Epidemiol. 2021, 31, 387–391. [Google Scholar] [CrossRef]
- Yamada, M.; Kimura, Y.; Ishiyama, D.; Otobe, Y.; Suzuki, M.; Koyama, S.; Kikuchi, T.; Kusumi, H.; Arai, H. Effect of the COVID-19 Epidemic on Physical Activity in Community-Dwelling Older Adults in Japan: A Cross-Sectional Online Survey. J. Nutr. Health Aging 2020, 24, 948–950. [Google Scholar] [CrossRef]
- Artese, A.; Ehley, D.; Sutin, A.R.; Terracciano, A. Personality and actigraphy-measured physical activity in older adults. Psychol. Aging 2017, 32, 131–138. [Google Scholar] [CrossRef]
- Kekalainen, T.; Laakkonen, E.K.; Terracciano, A.; Savikangas, T.; Hyvarinen, M.; Tammelin, T.H.; Rantalainen, T.; Tormakangas, T.; Kujala, U.M.; Alen, M.; et al. Accelerometer-measured and self-reported physical activity in relation to extraversion and neuroticism: A cross-sectional analysis of two studies. BMC Geriatr. 2020, 20, 264. [Google Scholar] [CrossRef] [PubMed]
- Ohmori, Y.; Suzuki, N.; Morita, A.; Aiba, N.; Miyachi, M.; Watanabe, S.; Kikuchi, Y.; Kimira, M. Association of Personality (NEO-Five Factor Inventory) with Eating Behaviors and Physical Activity Levels in Obese Subjects in the Saku Control Obesity Program (SCOP). Anti-Aging Med. 2007, 4, 43–50. [Google Scholar] [CrossRef]
- Gawrych, M.; Cichon, E.; Kiejna, A. COVID-19 pandemic fear, life satisfaction and mental health at the initial stage of the pandemic in the largest cities in Poland. Psychol. Health Med. 2021, 26, 107–113. [Google Scholar] [CrossRef] [PubMed]
- Zhao, S.Z.; Wong, J.Y.H.; Luk, T.T.; Wai, A.K.C.; Lam, T.H.; Wang, M.P. Mental health crisis under COVID-19 pandemic in Hong Kong, China. Int. J. Infect. Dis. 2020, 100, 431–433. [Google Scholar] [CrossRef] [PubMed]


| Variables | Mean ± SD | 25th Percentile | 50th Percentile | 75th Percentile | P for Gender Difference * | |
|---|---|---|---|---|---|---|
| N (% women) | 7472 (46.9%) | |||||
| Residential areas | Kitahiroshima | 154 (52.6%) | <0.0001 | |||
| Niigata | 1477 (47.4%) | |||||
| Tsukuba | 478 (52.6%) | |||||
| Machida | 989 (42.6%) | |||||
| Shiojiri | 145 (49.0%) | |||||
| Shizuoka | 1342 (49.3%) | |||||
| Kosai | 128 (35.2%) | |||||
| Hamamatsu | 1646 (44.8%) | |||||
| Bisan-chiku | 916 (52.4%) | |||||
| Eiheiji | 35 (54.3%) | |||||
| Yabu | 26 (26.9%) | |||||
| Shobara | 36 (52.8%) | |||||
| Mitoyo | 100 (46.0%) | |||||
| Age | 18–29 years | 694 (72.6%) | <0.0001 | |||
| 30–39 years | 1547 (69.4%) | |||||
| 40–49 years | 1977 (46.4%) | |||||
| 50–59 years | 1813 (36.0%) | |||||
| 60–69 years | 995 (25.2%) | |||||
| 70–79 years | 403 (25.0%) | |||||
| 80–89 years | 43 (18.6%) | |||||
| Occupation | Working | 5628 (41.0%) | <0.0001 | |||
| Household manager | 955 (98.1%) | |||||
| Student | 124 (66.9%) | |||||
| Not working | 765 (23.3%) | |||||
| Household income | Less than 2.01 million yen | 747 (60.8%) | <0.0001 | |||
| 2.01–4.00 million yen | 1641 (48.9%) | |||||
| 4.01–6.00 million yen | 1813 (49.4%) | |||||
| 6.01–8.00 million yen | 1447 (44.4%) | |||||
| 8.01–10.00 million yen | 919 (42.3%) | |||||
| More than 10 million yen | 905 (35.7%) | |||||
| Marital status | Single | 2184 (48.6%) | 0.06 | |||
| Married | 5288 (46.2%) | |||||
| Child status | No | 2637 (48.2%) | <0.0001 | |||
| Yes, not living with | 1245 (32.2%) | |||||
| Yes, living with | 3590 (51.1%) | |||||
| Car status (owned cars) | No | 2681 (55.2%) | <0.0001 | |||
| Yes, I own a car that I can use | 4791 (42.3%) | |||||
| Car status (shared family cars) | No | 5027 (46.4%) | 0.1753 | |||
| Yes, my family owns a car that I can use | 2445 (48.1%) | |||||
| Public transportation use (train, bus, taxi) in the past 4 weeks | Never | 6047 (47.9%) | 0.001 | |||
| Used more than or equal to once | 1425 (43.0%) | |||||
| Bicycle riding in the past 4 weeks | Never | 5848 (48.1%) | <0.0001 | |||
| Used more than or equal to once | 1624 (42.6%) | |||||
| Car driving in the past 4 weeks | Never | 1943 (55.2%) | <0.0001 | |||
| Used more than or equal to once | 5529 (44.0%) | |||||
| Car riding as a passenger in the past 4 weeks | Never | 1822 (66.6%) | <0.0001 | |||
| Used more than or equal to once | 5650 (40.6%) | |||||
| Life space score in the past 4 weeks | Total (0–60) | 43.2 ± 12.1 | 36 | 43 | 51 | <0.0001 W < M |
| Level 2 (1–4, discrete variable) | 3.8 ± 0.5 | 4 | 4 | 4 | <0.0001 W < M | |
| Level 3 (1–4, discrete variable) | 3.4 ± 0.8 | 3 | 4 | 4 | < 0.0001 W < M | |
| Level 4 (1–4, discrete variable) | 2.9 ± 1.1 | 2 | 3 | 4 | <0.0001 W < M | |
| Level 5 (1–4, discrete variable) | 1.8 ± 1.4 | 1 | 2 | 3 | <0.0001 W < M | |
| Anxiety about getting infected with the COVID-19 | (1–5, discrete variable) | 3.3 ± 1.2 | 2 | 3 | 4 | <0.0001 W > M |
| Personality | Extraversion (TIPI-J) | 7.4 ± 2.5 | 6 | 8 | 9 | <0.0001 W > M |
| Agreeableness (TIPI-J) | 9.6 ± 2.1 | 8 | 10 | 11 | 0.0006 W > M | |
| Openness (TIPI-J) | 7.7 ± 2.3 | 6 | 8 | 9 | <0.0001 W < M | |
| Conscientiousness (TIPI-J) | 7.9 ± 2.4 | 6 | 8 | 10 | <0.0001 W < M | |
| Neuroticism (TIPI-J) | 8.1 ± 2.4 | 7 | 8 | 10 | <0.0001 W > M | |
| Ego resiliency (ER89) | 34.1 ± 7.0 | 30 | 34 | 39 | 0.009 W < M | |
| Subjective happiness | Subjective Happiness Scale, averaged (1–4) | 2.63 ± 0.61 | 2.25 | 2.75 | 3.00 | <0.0001 W > M |
| General happiness, averaged (1–3) | 1.95 ± 0.39 | 1.67 | 2.00 | 2.22 | <0.0001 W > M | |
| Variables | Mean ± SD/Number | |
|---|---|---|
| Area characteristics for a living environment | Sufficiency rate for daily living services within walking distance (≤0.8 km), % | 25.5 ± 17.8 |
| Coverage of population within walking distance (≤0.8 km) from medical facilities, % | 73.7 ± 18.9 | |
| Coverage of population within walking distance (≤0.8 km) from welfare facilities, % | 74.9 ± 20.2 | |
| Coverage of population within walking distance (≤0.8 km) from commercial facilities, % | 54.9 ± 19.6 | |
| Coverage of population within walking distance (≤0.8 km) from core public transportation routes (≥30 available/daily), % | 34.7 ± 21.2 | |
| Population density in areas around train stations (≤0.8 km) or bus stops (≤0.3 km) for public transportation lines, people/ha | 20.0 ± 18.5 | |
| Insufficiency rate for medical facilities within walking distance (≤0.8 km) from housing occupied by the elderly population (≥65 years), % | 58.4 ± 19.2 | |
| Coverage of the elderly population (≥65 years) within 1 km from elderly welfare facilities, % | 78.9 ± 20.0 | |
| Urban types (number of areas) | A, there are many mountainous areas and road density at hubs is relatively low. | 3 areas |
| B, there are plains and mountains, and road links are concentrated in the plains. | 1 area | |
| C, hubs with high road density are dispersed. | 4 areas | |
| D, there are many plains and road density is almost consistent. | 4 areas | |
| E, the traffic on the roads between plains and mountains is high. | 1 area | |
| Variables | β | SE | Standardized β | p-Value | |
|---|---|---|---|---|---|
| Intercept | 26.35 | 1.75 | <0.0001 | ||
| Gender | Women | 0 (ref.) | <0.0001 | ||
| Men | 2.12 | 0.32 | |||
| Age | 18–29 years | 0 (ref.) | <0.0001 | ||
| 30–39 years | 0.46 | 0.55 | |||
| 40–49 years | 1.79 | 0.55 | |||
| 50–59 years | 2.27 | 0.56 | |||
| 60–69 years | 1.52 | 0.66 | |||
| 70–79 years | 2.40 | 0.86 | |||
| 80–89 years | 0.97 | 1.84 | |||
| Occupation | Not working | 0 (ref.) | <0.0001 | ||
| Working | 7.22 | 0.52 | |||
| Household manager | 1.71 | 0.65 | |||
| Student | 3.32 | 1.21 | |||
| Household income | Less than 2.01 million yen | 0 (ref.) | 0.00 | 0.1768 | |
| 2.01–4.00 million yen | 0.73 | 0.51 | |||
| 4.01–6.00 million yen | 1.13 | 0.52 | |||
| 6.01–8.00 million yen | 1.28 | 0.55 | |||
| 8.01–10.00 million yen | 0.52 | 0.60 | |||
| More than 10 million yen | 0.98 | 0.61 | |||
| Marital status | No | 0 (ref.) | 0.9573 | ||
| Yes | −0.02 | 0.39 | |||
| Child status | No | 0 (ref.) | 0.0059 | ||
| Yes, not living with | 0.42 | 0.47 | |||
| Yes, living with | 1.12 | 0.36 | |||
| Car status (owned cars) | No | 0 (ref.) | 0.0005 | ||
| Yes, I own a car that I can use | 1.48 | 0.43 | |||
| Car status (shared family cars) | No | 0 (ref.) | 0.1955 | ||
| Yes, my family owns a car that I can use | −0.50 | 0.39 | |||
| Public transportation use in the past 4 weeks | Never | 0 (ref.) | <0.0001 | ||
| Used more than or equal to once | 3.11 | 0.36 | |||
| Bicycle riding in the past 4 weeks | Never | 0 (ref.) | <0.0001 | ||
| Used more than or equal to once | 1.45 | 0.32 | |||
| Car driving in the past 4 weeks | Never | 0 (ref.) | <0.0001 | ||
| Used more than or equal to once | 5.05 | 0.35 | |||
| Car riding as a passenger in the past 4 weeks | Never | 0 (ref.) | 0.7587 | ||
| Used more than or equal to once | −0.10 | 0.32 | |||
| Areas | Kitahiroshima | 0 (ref.) | <0.0001 | ||
| Niigata | 0.14 | 0.94 | |||
| Tsukuba | −1.69 | 1.03 | |||
| Machida | −0.73 | 0.96 | |||
| Shiojiri | −1.39 | 1.28 | |||
| Shizuoka | −0.56 | 0.94 | |||
| Kosai | −0.72 | 1.33 | |||
| Hamamatsu | 0.59 | 0.94 | |||
| Bisan-chiku | 1.86 | 0.97 | |||
| Eiheiji | 4.26 | 2.08 | |||
| Yabu | 2.29 | 2.35 | |||
| Shobara | 0.17 | 2.05 | |||
| Mitoyo | 3.48 | 1.43 | |||
| Anxiety about getting infected with COVID-19 | −0.13 | 0.11 | 0.2178 | ||
| Personality | Extraversion (TIPI-J) | 0.64 | 0.12 | 0.06561 | <0.0001 |
| Agreeableness (TIPI-J) | −0.19 | 0.14 | −0.01657 | 0.1635 | |
| Openness (TIPI-J) | 0.00 | 0.13 | −0.00025 | 0.9844 | |
| Conscientiousness (TIPI-J) | −0.32 | 0.12 | −0.03222 | 0.0078 | |
| Neuroticism (TIPI-J) | −0.03 | 0.13 | −0.00252 | 0.8462 | |
| Ego resiliency (ER89) | 0.80 | 0.34 | 0.03314 | 0.0168 |
| Variables | β | SE | Standardized β | p-Value | |
|---|---|---|---|---|---|
| Area characteristics for a living environment | Sufficiency rate for daily living services within walking distance | −0.03457 | 0.008597 | −0.04495 | <0.0001 |
| Coverage of population within walking distance from medical facilities | 0.019669 | 0.013833 | 0.01539 | 0.1551 | |
| Coverage of population within walking distance from welfare facilities | −0.05414 | 0.015113 | −0.03913 | 0.0003 | |
| Coverage of population within walking distance from commercial facilities | 0.006296 | 0.009949 | 0.00700 | 0.5269 | |
| Coverage of population within walking distance from core public transportation routes | −0.03911 | 0.008156 | −0.05302 | <0.0001 | |
| Population density in areas around train stations or bus stops for public transportation lines | −0.01044 | 0.008058 | −0.01481 | 0.1949 | |
| Insufficiency rate for medical facilities within walking distance from housing occupied by the elderly population | 0.038481 | 0.009335 | 0.04530 | <0.0001 | |
| Coverage of elderly population within 1 km from elderly welfare facilities | −0.00931 | 0.016956 | −0.00597 | 0.5829 | |
| Urban types | A, there are many mountainous areas and road density at hubs is relatively low. | 0 | <0.0001 | ||
| B, there are plains and mountains, and road links are concentrated in the plains. | −1.60563 | 1.158558 | |||
| C, hubs with high road density are dispersed. | −1.14805 | 1.16633 | |||
| D, there are many plains and road density is almost consistent. | −2.66032 | 1.141038 | |||
| E, the traffic on the roads between plains and mountains is high. | 1.275508 | 1.576864 |
| Model 1 | Model 2 (Model 1 + Personality) | |||
|---|---|---|---|---|
| LSAtotal | ||||
| Subjective happiness scale | β ± SE | 0.00107 ± 0.00058 | −0.00024 ± 0.00051 | |
| r | 0.0214 | −0.00482 | ||
| p-value | 0.0646 | 0.6353 | ||
| General happiness (SUBI) | β ± SE | 0.00122 ± 0.00038 | 0.00016 ± 0.00031 | |
| r | 0.03762 | 0.00479 | ||
| p-value | 0.0014 | 0.6195 |
Publisher’s Note: MDPI stays neutral with regard to jurisdictional claims in published maps and institutional affiliations. |
© 2021 by the authors. Licensee MDPI, Basel, Switzerland. This article is an open access article distributed under the terms and conditions of the Creative Commons Attribution (CC BY) license (https://creativecommons.org/licenses/by/4.0/).
Share and Cite
Ando, T.; Sato, T.; Hashimoto, N.; Tran, Y.; Konishi, N.; Takeda, Y.; Akamatsu, M. Variability in Human Mobility during the Third Wave of COVID-19 in Japan. Sustainability 2021, 13, 13131. https://doi.org/10.3390/su132313131
Ando T, Sato T, Hashimoto N, Tran Y, Konishi N, Takeda Y, Akamatsu M. Variability in Human Mobility during the Third Wave of COVID-19 in Japan. Sustainability. 2021; 13(23):13131. https://doi.org/10.3390/su132313131
Chicago/Turabian StyleAndo, Takafumi, Toshihisa Sato, Naohisa Hashimoto, Yen Tran, Naoki Konishi, Yuji Takeda, and Motoyuki Akamatsu. 2021. "Variability in Human Mobility during the Third Wave of COVID-19 in Japan" Sustainability 13, no. 23: 13131. https://doi.org/10.3390/su132313131
APA StyleAndo, T., Sato, T., Hashimoto, N., Tran, Y., Konishi, N., Takeda, Y., & Akamatsu, M. (2021). Variability in Human Mobility during the Third Wave of COVID-19 in Japan. Sustainability, 13(23), 13131. https://doi.org/10.3390/su132313131