Abstract
Shoreline protection remains a global priority. Typically, coastal areas are protected by armoring them with hard, non-native, and non-sustainable materials such as limestone. To increase the execution speed and environmental friendliness and reduce the weight of individual concrete blocks and reinforcements, concrete blocks can be designed and implemented as Articulated Concrete Block Mattress (ACB Mat). These structures act as an integral part and can be used as a revetment on the breakwater body or shoreline protection. Physical models are one of the key tools for estimating and investigating the phenomena in coastal structures. However, it does have limitations and obstacles; consequently, in this study, numerical modeling of waves on these structures has been utilized to simulate wave propagation on the breakwater, via Flow-3D software with VOF. Among the factors affecting the instability of ACB Mat are breaking waves as well as the shaking of the revetment and the displacement of the armor due to the uplift force resulting from the failure. The most important purpose of the present study is to investigate the ability of numerical Flow-3D model to simulate hydrodynamic parameters in coastal revetment. The run-up values of the waves on the concrete block armoring will multiply with increasing break parameter () due to the existence of plunging waves until it () reaches maximum. Hence, by increasing the breaker parameter and changing breaking waves () type to collapsing waves/surging waves, the trend of relative wave run-up changes on concrete block revetment increases gradually. By increasing the breaker index (surf similarity parameter) in the case of plunging waves (), the low values on the relative wave run-down are greatly reduced. Additionally, in the transition region, the change of breaking waves from plunging waves to collapsing/surging (), the relative run-down process occurs with less intensity.
1. Introduction
In today’s world, due to the advancement of science and technology, especially marine science and technology, and with the growing population in coastal areas, the protection of beaches and ports is of particular significance. Due to the high cost of construction of coastal protection structures and offshore structures, it is absolutely crucial they are properly and optimally designed in terms of stability and hydraulic performance as well as cost-effectiveness. There are many types of coastal structures and each has its own unique application. Some of the most common coastal structures include breakwaters, seawalls, piers, and groins.
There are various types of breakwaters such as rubble mound, box floating, composite, floating, pile, pneumatic, etc. Contingent on the conditions, each of them can be utilized to build breakwaters connected to the coast or offshore. The choice of breakwater is made according to the following factors: expected function of the breakwater; water depth at the breakwater construction site; bed conditions; environmental conditions; availability of materials; and available and suitable machinery/equipment for construction. Revetments can be divided into two general groups: structural and non-structural. Non-structural armoring can be divided into two categories: vegetation revetment (biological) and soil stabilizers. Structural armoring can be divided into two categories: rigid and flexible. Rigid revetment is primarily reinforced concrete slabs. In this armoring, the effect of uplift force, which is affected by water from underneath, is significant, and its destructive effect should be reduced as much as possible. Hence, required steps should be undertaken for drainage under the slab.
The main feature of ductile armoring is that it has the ability to change shapes such as subsidence and local instability without affecting their performance in slope protection. Common revetments in this group include rip-rap, concrete blocks (single and attached), gabion, asphalt slabs, sand and concrete bags, and geosynthetics. The use of concrete blocks can be economical in areas where it is not possible to procure stone or the stone quarry is not within a reasonable distance. You can lock the concrete blocks together or via utilization of cable and/or rope. To increase the implementation speed and reduce the weight of single concrete blocks and reinforcements, concrete blocks can be designed and implemented as continuous concrete blocks (ACB Mat). These structures are integrated and can be used as a revetment on the breakwater body or to protect the shores. Concrete blocks have healthy flexibility and their stability against waves should be assessed [1,2].
The Articulated Concrete Block Mattress (ACB Mat) is an erosion-resistant cover with particular hydrodynamic performance characteristics formed out of a matrix of unit concrete blocks. Vertical cores and open areas may be integrated throughout the system, allowing vegetation to grow, which is one of the environmental benefits of (ACB Mat) erosion systems. Plant species that are carefully chosen can almost entirely cover the hard surface of the (ACB Mat), allowing them to fit in with the project’s natural appearance while also filtering the water by collecting nutrients and breaking down other contaminants. The revetment layer beneath the plants will protect the soil from scour during peak storm events. The capacity of (ACB Mat) systems to maintain the ecosystem’s habitat is a significant benefit over other erosion control techniques. Sustainability, flexibility, pedestrian safety, serviceability, aesthetics, and cost effectiveness are all advantages of (ACB Mat) systems.
Because of its permeability, (ACB Mat) can be used to protect natural drainage and treatment systems. These revetments are pervious surfaces that minimize water runoff and flooding concerns, enhance water quality, reduce contaminants, recharge aquifers, and avoid erosion and scour when placed over a filter layer. These environmental features allow (ACB Mat) to be used on sustainable developments to conserve or improve existing sites, and it may be used to earn credits in green building grading systems like LEEDTM. Permeable pavers installed in a similar way to the (ACB Mat) (block over a gravel drainage layer) have also been proven to promote aerobic biodegradation of hydrocarbons and reduce nutrient levels [3,4]. They can also produce habitat when they are vegetated. These features make (ACB Mat) an excellent choice for use in sustainable projects where water quantity and quality are critical.
Breaking waves play a major role in all long-shore currents. These waves cause turbulence accompanied by severe energy loss. Under these conditions, wave overtopping is a complex process that includes phenomena such as shoaling, reflection, refraction, and wave turbulence and should be taken into account from the random nature of the waves. The hydrodynamic forces caused by the collision of waves and currents cause various failures in the armoring, which include compression of blocks in the direction of slope (especially towards the heel), local buckling of a part of the revetment due to tensile forces downstream of the slope (buckling), sliding, uplift or displacement of a part due to displacement forces, local wedge slip known as S_profile, under revetment erosion of materials, rupture of joints, etc. [5,6].
In recent decades, studies focused on internally connected concrete blocks have been conducted in Germany and several other countries, such as the Pilarczyk study in 2003 [7]. The Hughes laboratory study in 2008 performed a 1:25 scale model using concrete block mattress to determine the stability behavior against waves and the rate of flow overtopping. According to the laboratory results, in irregular waves in the 1:3 slopes, the instability of the armoring in breakwater toe was observed due to increase displacement [8]. In line with Wouters’ 1991 research, a study was conducted on such armoring by Gier et al., 2012. The results include deformation of revetment, block stability parameter, and pull-out test [9].
Najafi et al., 2012 investigated the phenomenon of run-up and the transmission of waves from rubble mound breakwaters with antifer block armor and performed 365 experiments that revealed if the arrangement pattern changes from regular to irregular, the run-up can be reduced by up to 20%. Moreover, the results of the modeling showed that in a regular arrangement of antifers, the experimental formulas of overtopping prediction respond with better accuracy than the irregular arrangement [10].
Studies by Oumeraci et al., 2010 developed polyurethane bonded aggregate (PBA) for assessment of wave run-up on coastal revetment. In this study, a reducing factor is performed by large-scale experiments in run-up values, were introduced based on the Schüttrumpf 2001 approach (as a function of filter thickness) [11].
Krom 2012 conducted a laboratory study of rubble mound breakwaters with non-deformable rock armor parts and investigated the effect of porosity on the rate of overtopping and showed that porosity has a great effect on the rate of overtopping. The results also showed that in porous structures, the experimental formulas used to predict overtopping are not able to correctly predict overtopping [12,13,14]. Mousavi et al., 2017 conducted tests on the physical model of the breakwater with antifer block armor against the weight loss of the blocks, and with a 10% reduction in the weight of the block, the severity of the damage intensified. Additionally, with a 20% increase in wave height, the damage rate increased by about 5% [15].
The latest laboratory studies and research on interconnected concrete blocks by Yamini et al., 2017 assessed that in laboratory test stages, any instability of the revetment, including sliding of the revetment on the slope, compression of the blocks in each other, displacement of the block position, and buckling were counted as instability in the revetment [16]. Numerical modeling of wave overtopping from rubble mound breakwaters in light of the porosity effect, by Ghasemi et al., 2015, demonstrates that by comparing the results of numerical modeling for non-porous structures, with findings of Owen’s 1980 formula in numerical modeling, the amount of overtopping is slightly higher [17]. According to the results of Nourni 2017 numerical simulation, the maximum possible error of the model for the values of the relative height of the impact waves to the breakwater structure is equal to 7.87% (depending on conditions), the maximum error of the numerical model in determining the values of overtopping compared to laboratory conditions is 7.81%. Furthermore, the average overtopping changes in Xbloc armor compared to Tetrapod armor have decreased by about 31% [18,19].
The most important purpose of the present study is to investigate the ability of numerical Flow-3D model to simulate hydrodynamic parameters in coastal revetment. A review of numerical studies reveals that most numerical models have major weaknesses in determining the hydrodynamic parameters of waves. Therefore, in this study, we tried to measure the ability of the Flow-3D numerical model with the help of a reliable laboratory model.
2. Materials and Methods
Numerical modeling estimates have advantages over laboratory study, such as cost-effectiveness, time-efficiency, and the ability to obtain a range of required data throughout the study area. According to the above, the purpose of this study is to reveal the performance of numerical modeling in comparison with laboratory modeling and to devise more cost-effective measurement criteria in less time and with more freedom of action. This comparison method can also be utilized by considering various conditions and factors in order to facilitate future research. Consequently, initially compliant with Yamini et al., 2019, and utilizing the Flow-3D numerical model, a three-dimensional simulation of impact waves to the breakwater structure was performed. In order to calibrate the numerical model, items such as overtopping, wave height, wave period, and wave energy spectral density and required verification were performed on the numerical model. It is essential to calibrate all model conditions including boundary conditions, numerical model meshing, initial conditions, numerical model solvers, and other parameters in the numerical model and determine the amount of simulation error. In addition, taking into account the placement of the blocks, breakwater slope, wave height, and period, and comparing the results with other numerical codes as well as taking into account the equivalent roughness and permeability coefficient, it was confirmed that VOF method with RANS solution model offers superior results [20,21].
Flow-3D is a CFD software that handles the most difficult free-surface flow problems with accuracy, speed, and reliability. The three-dimensional geometry (*.stl file format) may then be imported into the computational fluid dynamics algorithm to analyze the hydrodynamic interactions. The previous research indicates that computations using Flow-3D were successful. Flow-3D, like other commercial software, uses numerical methods to trace the location of fluid and solid surfaces and apply the proper dynamic boundary conditions; however, it has some unique features, such as the FAVOR (Fractional Area Volume Obstacle Representation) method for defining complex geometric regions within rectangular cells and multiblock meshing. In the fractional area volume obstacle representation approach, a surface is permitted to cut through an element, and its location is recorded in terms of the fractional face areas and fractional volume of the element that is not covered by the solid, rather than repositioning the edges of the element. The mathematical approximation consequences of this fractional area for establishing solid boundaries are the same as those of a deformed (i.e., body-fitted coordinates) mesh technique. The FAVOR method’s most essential feature is that approximations of fluid-dynamic variables are limited to the open areas of components.
The three-dimensional flow field has been solved using the Re-Normalization Group (RNG) turbulence model in all simulations carried out in this work. Yakhot et al. (1992) [22] used RNG techniques to renormalize the Navier-Stokes equations and calculate for the impacts of small scales of fluctuations in the RNG model. The eddy viscosity in the standard k- ε model is estimated from a single turbulence length scale, hence the predicted turbulent diffusion occurs at that scale, although in actuality all scales of motion contribute to the turbulent diffusion. The Re-Normalization Group (RNG) approach, which is a numerical method for obtaining a turbulence model comparable to the standard k-ε, yields a modified variant of the epsilon relation that seeks to account for differing scales of motion by modifying the production term [23,24]. The features and advantages of this turbulence model (RNG) versus other models like k-ε, k-ω, etc. are the reasons for preference. This model has been improved by the addition of one “ε” extra term for evaluating fast stressed flows and flows across surfaces with a wide range of geometric changes, and it is particularly useful in transient flow simulations [25]. In addition, relying on the comparison made between turbulence models over spillways using Flow-3D conducted by Zhan et al. (2010), the Re-Normalization Group turbulence model has had more accurate results than other turbulence models, and it has therefore been used in the present study [26,27]. The fluid is also defined, non-viscous, and incompressible, and the air inlet was considered with a density of 1.24 kg/m3 and a shear stress rate of 0.0731.
2.1. Simulation
In order to model the conditions of the laboratory model, first the three-dimensional geometry of the breakwater is made in SolidWorks software and transferred to the numerical model, then the boundary conditions and initial conditions as well as the appropriate mesh are applied to the numerical model. In Figure 1, the breakwater section selected in the laboratory studies of Yamini et al., 2017 is displayed. Physical modeling in laboratory wave flume is 0.60 m wide and 0.90 m deep in cross section, and 15 m long. The waves are generated irregularly with Jonswap spectrum and has collided with the breakwater section at maximum significant wave height of 12 cm [21]. In the following figures, reinforced concrete with geometric specifications and relevant three-dimensional geometry is shown (Figure 2).
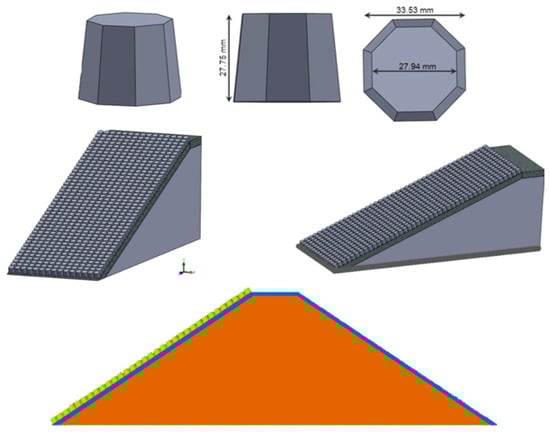
Figure 1.
Armor geometric characteristics and drawing three-dimensional geometry of a breakwater section in SolidWorks software.


Figure 2.
Various Views of Mesh Block & Smaller Computational Cells in Breakwater Cross-Sectional Area.
2.2. Validation of Numerical Model
In laboratory studies, by installing the required equipment at the conclusion of the laboratory modeling, the flow amount due to overtopping from breakwater is measured. In the numerical model, utilizing the output boundary characteristics, the overtopping values of the waves can be extracted from the breakwater. After the physical simulation of the model, it is required to optimize the meshing in order to sensitize the numerical model to the number of computational cells, first by considering the wave characteristics of the laboratory model (Hs = 11 cm, Ts = 1.2 s) and calculating the graph (Figure 3). The nearest JONSWAP spectrum is calculated with the lowest error percentage and utilized to continue the simulation process. Wave reflection was measured using four gauges. The gauges 2, 3, 4, and 5 were positioned at 0, 20, 65, and 100 cm distances from each other. Data AcQuisition systems were used to input these distances (HR DAQ). It should be noted that the above-mentioned gauges were installed 2.5 m away from the building. Throughout all of the tests, the JONSWAP spectrum was allocated to the wave generator. To measure hydrodynamic processes, the water level in the flume was generally 45 cm.

Figure 3.
Diagram (theory) of input spectrum density to a numerical model with significant wave height Hs = 11 cm and Tp = 1.2 s.
Therefore, taking into account the waves similar to laboratory waves, the waves with characteristics closest to the laboratory waves and the lowest error percentage are chosen as the calibrated wave and the meshing process is performed (Table 1).

Table 1.
Sensitivity findings of modeling.
In Figure 4, the energy density spectrum diagram of the impact waves to the breakwater structure is extracted from the numerical model and evaluated with the wave energy density spectrum (in theory).
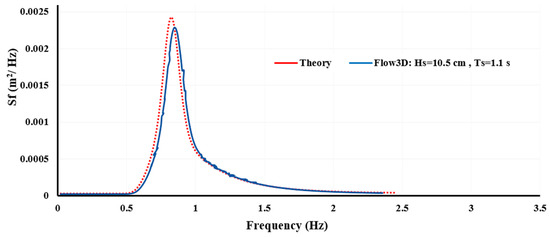
Figure 4.
Comparison of wave energy spectrum density in Flow-3D theory and numerical modeling.
In the Table 2, the values of wave height, period, and maximum energy spectrum density of the waves produced in the Flow-3D numerical model have been calibrated and validated in relation to the theoretical mode. The relative error values of the following equation are used:
where Xexp is the actual value of the parameter (laboratory values) and Xnum is the simulated value of the parameter.
Table 2.
Comparison of validation results and numerical model calibration for hydrodynamic parameters.
As displayed in Table 2, the simulation of the wave overtopping for wave height, period waves, and peak density of the simulated wave spectrum is close to the theoretical conditions. Based on the findings of numerical modeling, the maximum relative error of the numerical model in the parameters of wave height and period is equal to 4.54% and 19.1%, respectively. Additionally, the maximum error of simulating the peak values of the wave energy spectrum density compared to the theoretical state is calculated to be 5.8%.
Wave overtopping on coastal structures is one of the most significant hydraulic reactions taken into account in the design of this type of structure. Wave overtopping occurs when the height of the structure is less than the maximum run-up (Rumax) value on the structure. The overtopping of waves is usually expressed as the overtopping discharge per unit width (). Figure 5 demonstrates the overtopping of waves on the concrete block mattress in both laboratory and numerical modes.

Figure 5.
Wave overtopping on concrete block mattress in (a) laboratory and (b) numerical model.
Waves overtopping the breakwater’s crest create displacement on the revetment, which is formed by pore water pressure on the breakwater’s sides. In some cases, the difference in water level on both sides of the structure causes an internal flow. When a certain hydraulic gradient is formed, the finer grains are extracted through the underlying layers and pass through the larger layers. Consequently, cavities are created inside the structure, which can lead to localized settlements or sliding.
Figure 6 shows the trend of changes in the relative overtopping discharge () from the breakwater with concrete block armor against the relative wave height ( in both laboratory and numerical modes.

Figure 6.
Comparison of relative overtopping rate () on concrete block mattress with the relative freeboard of the structure (.
One of the most popular studies on overtopping discharge has been conducted by Owen (1980). In present research, a general relationship for estimating the relative overtopping rates of estimate the average overtopping volume on coastal structures is proposed in accordance with Equation (2) [28].
In this equation, q represents the values of overtopping discharge per unit width, Hm0 is the significant wave height, Rc is freeboard, is the roughness coefficient is constant, is the wave breaker parameter is a constant coefficient, and the parameter () is a dimensionless parameter. Hence, constant coefficients (a, b, and c) are obtained from a suitable fit with scattered data, which depend on cross-sectional permeability conditions, type of filter layer, and surface roughness of the revetment. The data obtained from the findings of numerical modeling and curve fitting (via nonlinear regression) were plotted using the SigmaPlot model. With suitability performed for the data, Equation (3) is then proposed:
It should be noted that is the coefficient of determination, and based on the findings of the numerical model, the data has satisfactory accurate to determine the overtopping discharge values [21].
In the present study, an attempt was made to validate the numerical model utilizing the findings of numerical model and laboratory results, shown in the following table. In the Table 3, the relative error values between laboratory results and the findings of Flow-3D are calculated for the same conditions.
Table 3.
Comparison of validation and laboratory calibration findings and numerical model in relative wave overtopping.
As evidenced in the Table 3, the maximum error of the simulation for the relative height values of the impact waves to the breakwater structure is equal to a maximum of 10% for different conditions. Accordingly, the maximum error of the simulation in determining the values of overtopping discharge compared to laboratory conditions is 17.3%. Due to the fact that in numerical modeling it is not possible to accurately simulate porosity in the breakwater core as well as the permeability on the grain filter, the wave overtopping rate increases with increasing period and wavelength (compared to laboratory model). It should be noted that the findings of the Table 3 can be considered a calibrated and validated model.
2.3. Mesh Optimization
In numerical modeling, one of the most significant parameters affecting the field of numerical solution is the field meshing conditions. Effects of size on the findings should be carefully evaluated. By changing the amount of mesh and utilizing the FAVOR tab, the quality of the mesh can be assessed in showing the geometry to the extent possible. In the introduced calibration model, it consists of three meshing blocks that have 686,625 cells, which are the largest and smallest dimensions of the meter unit for each coordinate direction (Figure 7).
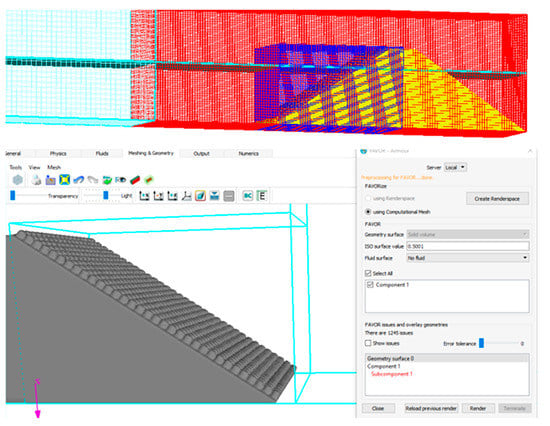
Figure 7.
Mesh block for calibrated numerical model with 686,625 cells and utilization of FAVOR tab to assess figure geometry.
Numerical modeling has been conducted in order to investigate the effect of utilizing a smaller mesh of about 30%, equivalent to 1,995,258 cells, for the same conditions. In this section, the findings in 686,625 cells and 1,995,258 cells are compared. In Flow-3D numerical model, to produce irregular waves, the type of wave spectrum (JONSWAP spectrum), the values of the height and the period of the waves must be applied to the boundary conditions. After determining these specifications, the time series of the waves will be determined by Flow-3D software (Figure 8).
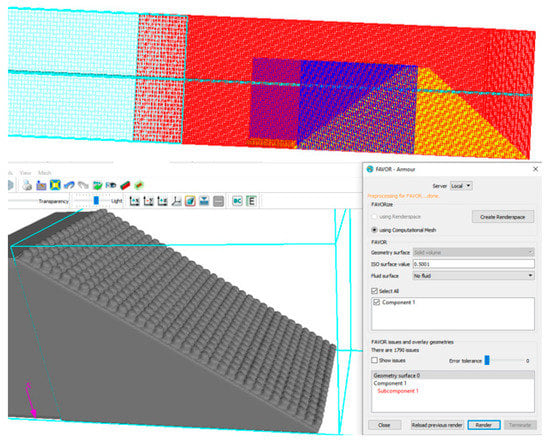
Figure 8.
Smaller meshing of appropriately 30%, equivalent to 1,995,258 cells.
In the Table 4, the values of wave height, period, and maximum density of the energy spectrum of the waves are presented in the Flow-3D simulation for the two mentioned mesh conditions. As delineated in the above table, the difference in results with a 30% increase in the number of computational cells for all hydrodynamic parameters is less than 2.5%. Due to smaller computational cells and the better geometry showing in the FAVOR tab, with a 30% increase in the number of computational cells, no noticeable changes are observed in the results. Therefore, the cells considered for the calibration model are more suitable for cost-effectiveness and time-efficiency. After extracting the results of the numerical model, the overtopping values for both models were simulated for 700 s with a mean flow rate of about 0.005 lit/s for the calibrated numerical model and the mean numerical flow of 0.006 lit/s for the computational cell (30% increase) (Figure 9). The duration of the waves impacting the concrete block revetment was about 10 min, which is why it has been selected in the same range in numerical modeling conditions. The selection has been checked for more than 700 s and will not affect the results.
Table 4.
Comparison of numerical model findings in two mesh modes to investigate the effect of shrinking cell dimensions.
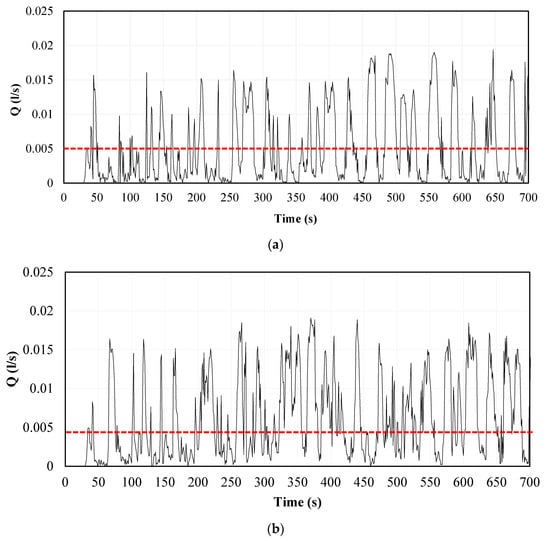
Figure 9.
Outflow discharge changes in terms of time and average outflow discharge: (a) model calibrated; (b) model 30% cell increase.
3. Results and Discussion
3.1. Wave Run-Up
Laboratory studies and numerical modeling were compared to evaluate the hydraulic performance run-up of the waves on concrete block mattress. Figure 10 shows how the concrete block revetment is placed on slope.
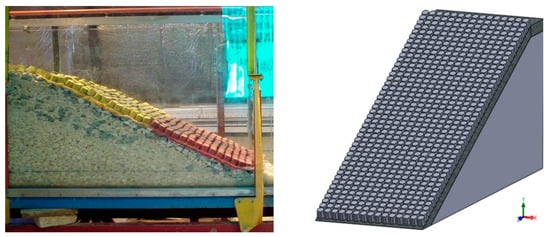
Figure 10.
How to place different layers (core, filter, and revetment) of the structure on slope.
Measuring run-up values on the coastal structure is essential in determining the structure’s height. For designing the revetment of coastal structures, 2% is often considered to be the maximum possible uplift on the revetment [29]. In EurOtop (2016), a precise relationship was proposed for predicting the wave run-up by considering the structural and geometric conditions of the revetment as well as the conditions of the waves. These factors are presented with different coefficients that are related to the effective factors in the wave run-up, including the roughness characteristics of the cover on the slope, the effect of the breakwater crest and also the effect of the collision of oblique waves [30].
The results show that with increasing the slope and decreasing the wave height and period, the wave run-up rate decreases significantly. Additionally, due to the type of regular placement of blocks, the amount of run-up is more than pyramidal and irregular placement [21].
ACB Mat blocks are expected to have acceptable run-up values due to their open area, good permeability, and surface roughness. Figure 11 shows an example of wave run-up in laboratory flume and numerical modeling on ACB Mat block.

Figure 11.
Wave run-up on ACB Mat blocks in (a) laboratory model and (b) numerical modeling.
Waves and currents as primary factors create the force on the revetment pieces, and the weight of the structure also exerts a force on the substructure soil in addition to the natural state. The soil under the structure is in danger of compaction and consolidation or slipping due to this force, and in case of asymmetric subsidence, failure and slipping of a part or the whole structure occurs. Permeability is one of the parameters affecting the run-up phenomenon. Decreasing the permeability of the bed increases the uplift of the waves, and increasing the permeability of the bed reduces the uplift. When a wave breaks on a run-up permeable bed, some of the energy of the wave that is to be dissipated by the run-up wave is lost by penetration into the bed, thus limiting the run-up permeable bed (Figure 12).
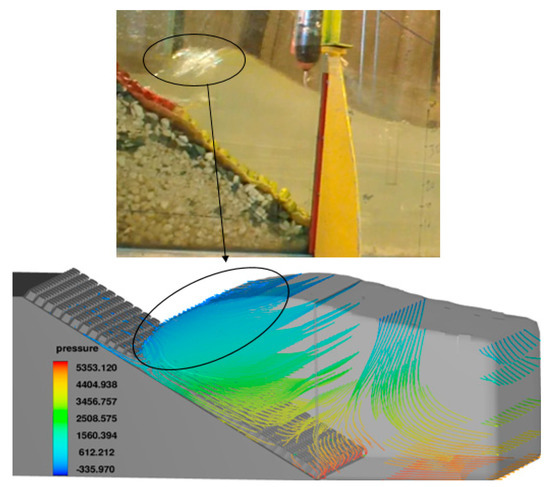
Figure 12.
Formation of breaking wave during run-up.
Breaking waves is nonlinear on the breakwater structure and includes forces of inertia and viscosity. Complex equations govern the process of the internal reaction forces and energy absorption. Reinforcements/armor are designed to withstand drag and uplift forces, but if they are overstressed or improperly arranged, they may fail and displace, leading to failure of the entire structure. According to the figures shown, after continuous wave breaks on the revetment and local elevations, the filter materials are washed and the layer is moved. These displacements gradually change the slope of the breakwater structure and provide sliding instability from the body.
The wave run-up values were the relative run-up of the waves () and the height, period waves, and slope of the structure were the breaker parameter () based on dimensionless analysis. Figure 13 shows a comparison of the relative run-up values of the waves against the breaking wave parameter.
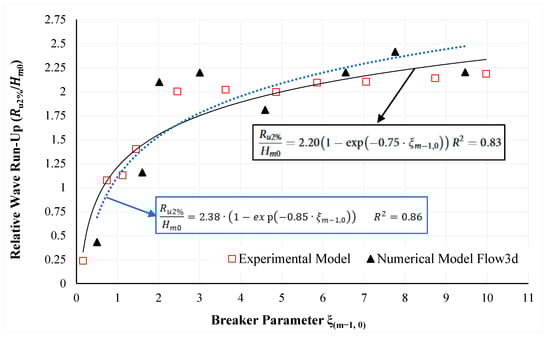
Figure 13.
Comparison of relative wave run-up () values against breaker parameter ( ).
Battjes 1974 presented a quantitative criterion for determining the type of breaking wave utilizing the basic characteristics of a wave in deep water (wave steepness) and the slope of the bed in the form of the dimensionless Iribarren Number () or surf similarity parameter, also known as the break similarity parameter or breakwater parameter. It was presented as the following equation:
where the () surf similarity parameter based on and wave height () in deep water, () is the wavelength in deep water; and () is the slope of the bed relative to the horizon. Zero (0) indicates deep water [31].
Examination of numerical model findings reveal that the run-up values of the waves on the ACB Mat will multiply with increasing breaker parameter () due to the presence of plunging wave conditions and will reach maximum (: surf similarity parameter based on deep water wave length and mean energy period). In plunging waves, the stability of ACB Mat block is affected by the parameters of structural sliding and height and wave period. Hence, by increasing the breaker parameter () and changing the type of breaking wave to collapsing/surging waves, the trend of relative run-up changes in the waves on the ACB Mat increases continuously over time. The increase in wave elevation in the numerical model is due to the decrease in the permeability of the structure and the lack of proper penetration of the wave to the substrates, which leads to higher level waves.
To determine the relationship of the run-up wave estimation on the ACB Mat, the best possible fit to the scattered events is performed. The most appropriate proposed relation with the best possible regression is suggested based on Equation (5), hence:
and coefficients completely depend on geometric conditions, permeability, and surface roughness. In order to determine the exact parameter values and on the ACB Mat continuously (by performing the best possible fit), the curve of estimating the run-up values on the ACB Mat has been calculated. The results of the fitting performed on the data are displayed in the above figure.
The coefficient of determination indicates that the above equation is suitable for wave uplift in these armoring.
3.2. Wave Run-Down
The wave run-down values on the coastal revetment must be determined in order to measure the length of the revetment layer beneath the sea surface. Additionally, wave run-down values are very important due to its effect on the up-lift force induced by onrush of water in the downward direction. The up-lift force on the waves often causes the armatures to be displaced or surge damaged. In the design of coastal protection armoring, the lowest possible value of 2% is used [29]. Figure 14 shows a sample from wave run-down in the laboratory flume and numerical modeling on the ACB Mat.

Figure 14.
Wave run-down on ACB Mat in (a) laboratory and (b) numerical models.
Van der Meer (1988) analyzed wave run-down based on core, filter, and armor materials permeability (P) [32]. The stability of a revetment depends on its slope, the specific gravity of the armoring parts, pore pressures due to motion of the waves, friction, internal adhesion, and length of the mattress. Sliding is very likely in the boundary areas between various materials, because friction is reduced in these areas. Due to the breaking waves and the run-down trend, the friction between the materials and the filter layer and the armor is reduced, and this causes the armor to slip from the breakwater body (Figure 15).
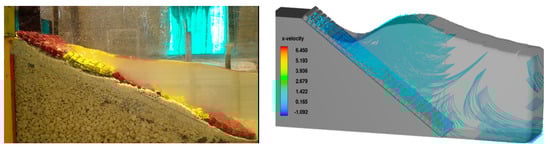
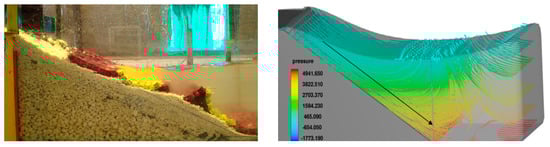
Figure 15.
Localized deformations on revetment due to run-down and sliding of armor from body laboratory model (left) and numerical modeling (right).
The primary reason for failure of the armor layer that is exposed to the wave attack is the hydraulic instability in which the armor is subjected to drag and uplift forces that cause crushing, displacement, and sliding. ACB Mat blocks owe their success largely to the connections of the armor, the porosity and the stability composition of each armor, and inertial mass. The most important goal of armor units is to balance hydraulic and structural stability and proper placement on the slope [33,34]. Maximum destabilizing forces appear at the wave trough; the risk of damage along the slope and the problem of armor placement in the required points should be assessed [35]. On the other hand, due to the pressure lines and the existence of negative velocities in the consecutive run-down, the downward flow force and the simultaneous weight component force provide the most instability conditions. At the moment of applying up-lift force and lifting the revetment from the body, the run-down forces and the weight of the blocks cause complete sliding from the body. There are two distinct probabilities for damage: either damage in the lower corner of the block or damage in the connection between each block. It should be noted that instability has occurred when the block reaches the point of negative stability [36]. The relative wave run-down values on the ACB Mat against the breaking wave parameter are shown in Figure 16.
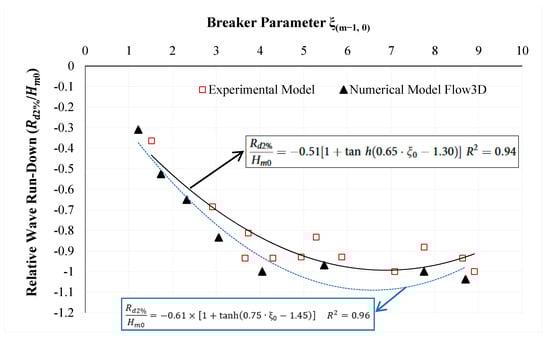
Figure 16.
Comparison of relative wave run-down and breaking wave parameter.
Examination of numerical modeling findings show that with increasing breaker parameter in the case of plunging waves , the values of relative wave run-down decreases sharply. Additionally, in the transition region, the change of waves from plunging waves to collapsing/surging occurs with a lower intensity of relative wave run-down values . In surging, most displacement occurs due to wave run-down on the revetment, which provides sliding instability conditions for ACB Mat.
In order to provide a relationship between the estimation of wave run-down on ACB Mat, the best possible fit to the existing data must be performed. Examination of various relationships shows that Equation (7) will yield the most appropriate fit based on the hyperbolic tangent function.
The data obtained from the findings of numerical modeling and curve fitting (via nonlinear regression) were plotted using the SigmaPlot model.
The relative wave run-down on ACB Mat revetments relationship is displayed Equation (8):
4. Conclusions
Due to the irregularity of the wave, when the larger waves attack and break on the revetment, the velocity changes fluctuate sharply in a short period of time, which indicates armor damage and body sliding. These waves, which cause instability, can consist of storms as well as waves with long wavelengths and periods, which cause localized scour of the revetment, and damage in subsequent collisions with smaller waves. The presence of unstable factors, such as run-up, run-down, and breaking wave, over time cause the armor to slip off the body. The maximum relative error of the numerical model in the parameters of wave height and period is between 4.54% and 19.1%, respectively. Additionally, the maximum error of simulating the peak values of the wave energy spectrum density compared to the theoretical state is calculated to be 5.8%. The maximum error of the numerical model for relative height value is 10% and the maximum error of the numerical model in determining the overtopping value compared to laboratory conditions is 17.3%. The run-up values of the waves on the ACB Mat will increase with increasing breaker parameter due to the break conditions of the plunging waves (reach maximum ). Hence, by increasing the break parameter and changing the type of breaking wave to collapsing/surging (), the trend of relative wave run-up changes on the ACB Mat increases continuously over time. By increasing the break parameter in the case of plunging waves (), the relative run-down values decrease sharply. Additionally, in the transition region, or the change of breaking wave from plunging to surging/collapsing (), the relative wave run-down occurs with less intensity.
Author Contributions
Conceptualization, O.A.Y. and S.H.M.; methodology, O.A.Y., R.S.G. and S.H.M.; software, R.S.G.; validation, O.A.Y., R.S.G. and S.H.M.; data curation, O.A.Y.; writing—original draft preparation, O.A.Y., R.S.G. and S.H.M.; writing—review and editing, O.A.Y. and S.H.M.; supervision, M.R.K. All authors have read and agreed to the published version of the manuscript.
Funding
This research received no specific grant from any funding agency in the public, commercial, or not-for-profit sectors. The author(s) received no specific funding for this work.
Institutional Review Board Statement
Not applicable.
Informed Consent Statement
Not applicable.
Data Availability Statement
All data used to support the findings of the study are included within the article.
Conflicts of Interest
The authors declare that there is no conflict of interests regarding the publication of this paper.
References
- Capobianco, V.; Robinson, K.; Kalsnes, B.; Ekeheien, C.; Høydal, Ø. Hydro-Mechanical Effects of Several Riparian Vegetation Combinations on the Streambank Stability—A Benchmark Case in Southeastern Norway. Sustainability 2021, 13, 4046. [Google Scholar] [CrossRef]
- MarCom Working Group 113. PIANC Report No 113: The Application of Geosynthetics in Waterfront Areas; PIANC: Brussels, Belgium, 2011; p. 113. ISBN 978-2-87223-188-1. [Google Scholar]
- Hunt, W.F.; Collins, K.A.; Hathaway, J.M. Hydrologic and Water Quality Evaluation of Four Permeable Pavements in North Carolina, USA. In Proceedings of the 9th International Conference on Concrete Block Paving, Buenos Aires, Argentina, 18–21 October 2009. [Google Scholar]
- Kirkpatrick, R.; Campbell, R.; Smyth, J.; Murtagh, J.; Knapton, J. Improvement of Water Quality by Coarse Graded Aggregates in Permeable Pavements. In Proceedings of the 9th International Conference on Concrete Block Paving, Buenos Aires, Argentina, 18–21 October 2009. [Google Scholar]
- Chinowsky, P.; Helman, J. Protecting Infrastructure and Public Buildings against Sea Level Rise and Storm Surge. Sustainability 2021, 13, 10538. [Google Scholar] [CrossRef]
- Breteler, M.K.; Pilarczyk, K.W.; Stoutjesdijk, T. Design of alternative revetments. Coast. Eng. 1998 1999, 1587–1600. [Google Scholar] [CrossRef]
- Pilarczyk, K.W. Design of Revetments; Dutch Public Works Department (Rws), Hydraulic Engineering Division: Delft, The Netherlands, 2003. [Google Scholar]
- Hughes, S.A. Combined Wave and Surge Overtopping of Levees: Flow Hydrodynamics and Articulated Concrete Mat Stability; Engineer Research and Development Center Vicksburg Ms Coastal and Hydraulics Lab: Vicksburg, MS, USA, 2008. [Google Scholar]
- Gier, F.; Schüttrumpf, H.; Mönnich, J.; Van Der Meer, J.; Kudella, M.; Rubin, H. Stability of Interlocked Pattern Placed Block Revetments. Coast. Eng. Proc. 2012, 1, Structures-46. [Google Scholar] [CrossRef]
- Najafi, J.A.; Monshizadeh, M. Laboratory Investigations on Wave Run-up and Transmission over Breakwaters Covered by Antifer Units; Scientia Iranica: Tehran, Iran, 2010. [Google Scholar]
- Oumeraci, H.; Staal, T.; Pförtner, S.; Ludwigs, G.; Kudella, M. Hydraulic Performance, Wave Loading and Response of Elastocoast Revetments and their Foundation—A Large Scale Model Study; Leichtweiß Institut für Wasserbau: Braunschweig, Germany, 2010. [Google Scholar]
- Tripathy, S.K. Significance of Traditional and Advanced Morphometry to Fishery Science. J. Hum. Earth Future 2020, 1, 153–166. [Google Scholar] [CrossRef]
- Nut, N.; Mihara, M.; Jeong, J.; Ngo, B.; Sigua, G.; Prasad, P.V.V.; Reyes, M.R. Land Use and Land Cover Changes and Its Impact on Soil Erosion in Stung Sangkae Catchment of Cambodia. Sustainability 2021, 13, 9276. [Google Scholar] [CrossRef]
- Xu, C.; Pu, L.; Kong, F.; Li, B. Spatio-Temporal Change of Land Use in a Coastal Reclamation Area: A Complex Network Approach. Sustainability 2021, 13, 8690. [Google Scholar] [CrossRef]
- Mousavi, S.; Kavianpour, H.M.R.; Yamini, O.A. Experimental analysis of breakwater stability with antifer concrete block. Mar. Georesour. Geotechnol. 2017, 35, 426–434. [Google Scholar] [CrossRef]
- Yamini, O.; Aminoroayaie, S.; Mousavi, H.; Kavianpour, M.R. Experimental Investigation of Using Geo-Textile Filter Layer In Articulated Concrete Block Mattress Revetment On Coastal Embankment. J. Ocean Eng. Mar. Energy 2019, 5, 119–133. [Google Scholar] [CrossRef]
- Ghasemi, A.; Far, M.S.; Panahi, R. Numerical Simulation of Wave Overtopping From Armour Breakwater by Considering Porous Effect. J. Mar. Eng. 2015, 11, 51–60. Available online: http://dorl.net/dor/20.1001.1.17357608.1394.11.22.8.4 (accessed on 21 October 2021).
- Nourani, O.; Askar, M.B. Comparison of the Effect of Tetrapod Block and Armor X block on Reducing Wave Overtopping in Breakwaters. Open J. Mar. Sci. 2017, 7, 472–484. [Google Scholar] [CrossRef][Green Version]
- Aminoroaya, A.O.; Kavianpour, M.R.; Movahedi, A. Performance of Hydrodynamics Flow on Flip Buckets Spillway for Flood Control in Large Dam Reservoirs. J. Hum. Earth Future 2020, 1, 39–47. [Google Scholar]
- Milanian, F.; Niri, M.Z.; Najafi-Jilani, A. Effect of hydraulic and structural parameters on the wave run-up over the berm breakwaters. Int. J. Nav. Archit. Ocean Eng. 2017, 9, 282–291. [Google Scholar] [CrossRef][Green Version]
- Yamini, O.A.; Kavianpour, M.R.; Mousavi, S.H. Experimental investigation of parameters affecting the stability of articulated concrete block mattress under wave attack. Appl. Ocean Res. 2017, 64, 184–202. [Google Scholar] [CrossRef]
- Yakhot, V.; Orszag, S.A.; Thangam, S.; Gatski, T.B.; Speziale, C.G. Development of turbulence models for shear flows by a double expansion technique. Phys. Fluids 1992, 4, 1510–1520. [Google Scholar] [CrossRef]
- Bayon, A.; Valero, D.; García-Bartual, R.; López-Jiménez, P.A. Performance assessment of OpenFOAM and FLOW-3D in the numerical modeling of a low Reynolds number hydraulic jump. Environ. Model. Softw. 2016, 80, 322–335. [Google Scholar] [CrossRef]
- Jin, J.; Meng, B. Computation of wave loads on the superstructures of coastal highway bridges. Ocean Eng. 2011, 38, 2185–2200. [Google Scholar] [CrossRef]
- Yang, S.; Yang, W.; Qin, S.; Li, Q.; Yang, B. Numerical study on characteristics of dam-break wave. Ocean Eng. 2018, 159, 358–371. [Google Scholar] [CrossRef]
- Ersoy, H.; Karahan, M.; Gelişli, K.; Akgün, A.; Anılan, T.; Sünnetci, M.O.; Yahşi, B.K. Modelling of the landslide-induced impulse waves in the Artvin Dam reservoir by empirical approach and 3D numerical simulation. Eng. Geol. 2019, 249, 112–128. [Google Scholar] [CrossRef]
- Zhan, J.M.; Dong, Z.; Jiang, W.; Li, Y.S. Numerical simulation of wave transformation and runup incorporating porous media wave absorber and turbulence models. Ocean Eng. 2010, 37, 1261–1272. [Google Scholar] [CrossRef]
- Owen, M.W. The Hydroulic Design of Seawall Profiles, Proceedings Conference on Shoreline Protection; ICE: London, UK, 1980; pp. 185–192. [Google Scholar]
- Pilarczyk, K.W. Geosythetics and Geosystems in Hydraulic and Coastal Engineering; CRC Press: Balkema, FL, USA, 2000; p. 913. ISBN 90.5809.302.6. [Google Scholar]
- Van der Meer, J.W.; Allsop, N.W.H.; Bruce, T.; De Rouck, J.; Kortenhaus, A.; Pullen, T.; Schüttrumpf, H.; Troch, P.; Zanuttigh, B. (Eds.) Manual on Wave Overtopping of Sea Defences and Related Structures–Assessment Manual; EurOtop.: London, UK, 2016; Available online: www.Overtopping-manual.com (accessed on 21 October 2021).
- Battjes, J.A. Computation of Set-up, Longshore Currents, Run-up and Overtopping Due to Wind-Generated Waves; TU Delft Library: Delft, The Netherlands, 1974. [Google Scholar]
- Van der Meer, J.W. Rock Slopes and Gravel Beaches under Wave Attack; Delft Hydraulics: Delft, The Netherlands, 1988. [Google Scholar]
- Ten Oever, E. Theoretical and Experimental Study on the Placement of Xbloc; Delft Hydraulics: Delft, The Netherlands, 2006. [Google Scholar]
- Flow Science, Inc. FLOW-3D User Manual Version 9.3; Flow Science, Inc.: Santa Fe, NM, USA, 2008. [Google Scholar]
- Lebaron, J.W. Stability of A-Jacksarmored Rubble-Mound Break Waters Subjected to Breaking and Non-Breaking Waves with No Overtopping; Master of Science in Civil Engineering, Oregon State University: Corvallis, OR, USA, 1999. [Google Scholar]
- McLaren RW, G.; Chin, C.; Weber, J.; Binns, J.; McInerney, J.; Allen, M. Articulated Concrete Mattress block size stability comparison in omni-directional current. In Proceedings of the OCEANS 2016 MTS/IEEE Monterey, Monterey, CA, USA, 19–23 September 2016; pp. 1–6. [Google Scholar] [CrossRef]
Publisher’s Note: MDPI stays neutral with regard to jurisdictional claims in published maps and institutional affiliations. |
© 2021 by the authors. Licensee MDPI, Basel, Switzerland. This article is an open access article distributed under the terms and conditions of the Creative Commons Attribution (CC BY) license (https://creativecommons.org/licenses/by/4.0/).