
Study on Feasibility of Photovoltaic Power to Grid Parity in China Based on LCOE


Abstract
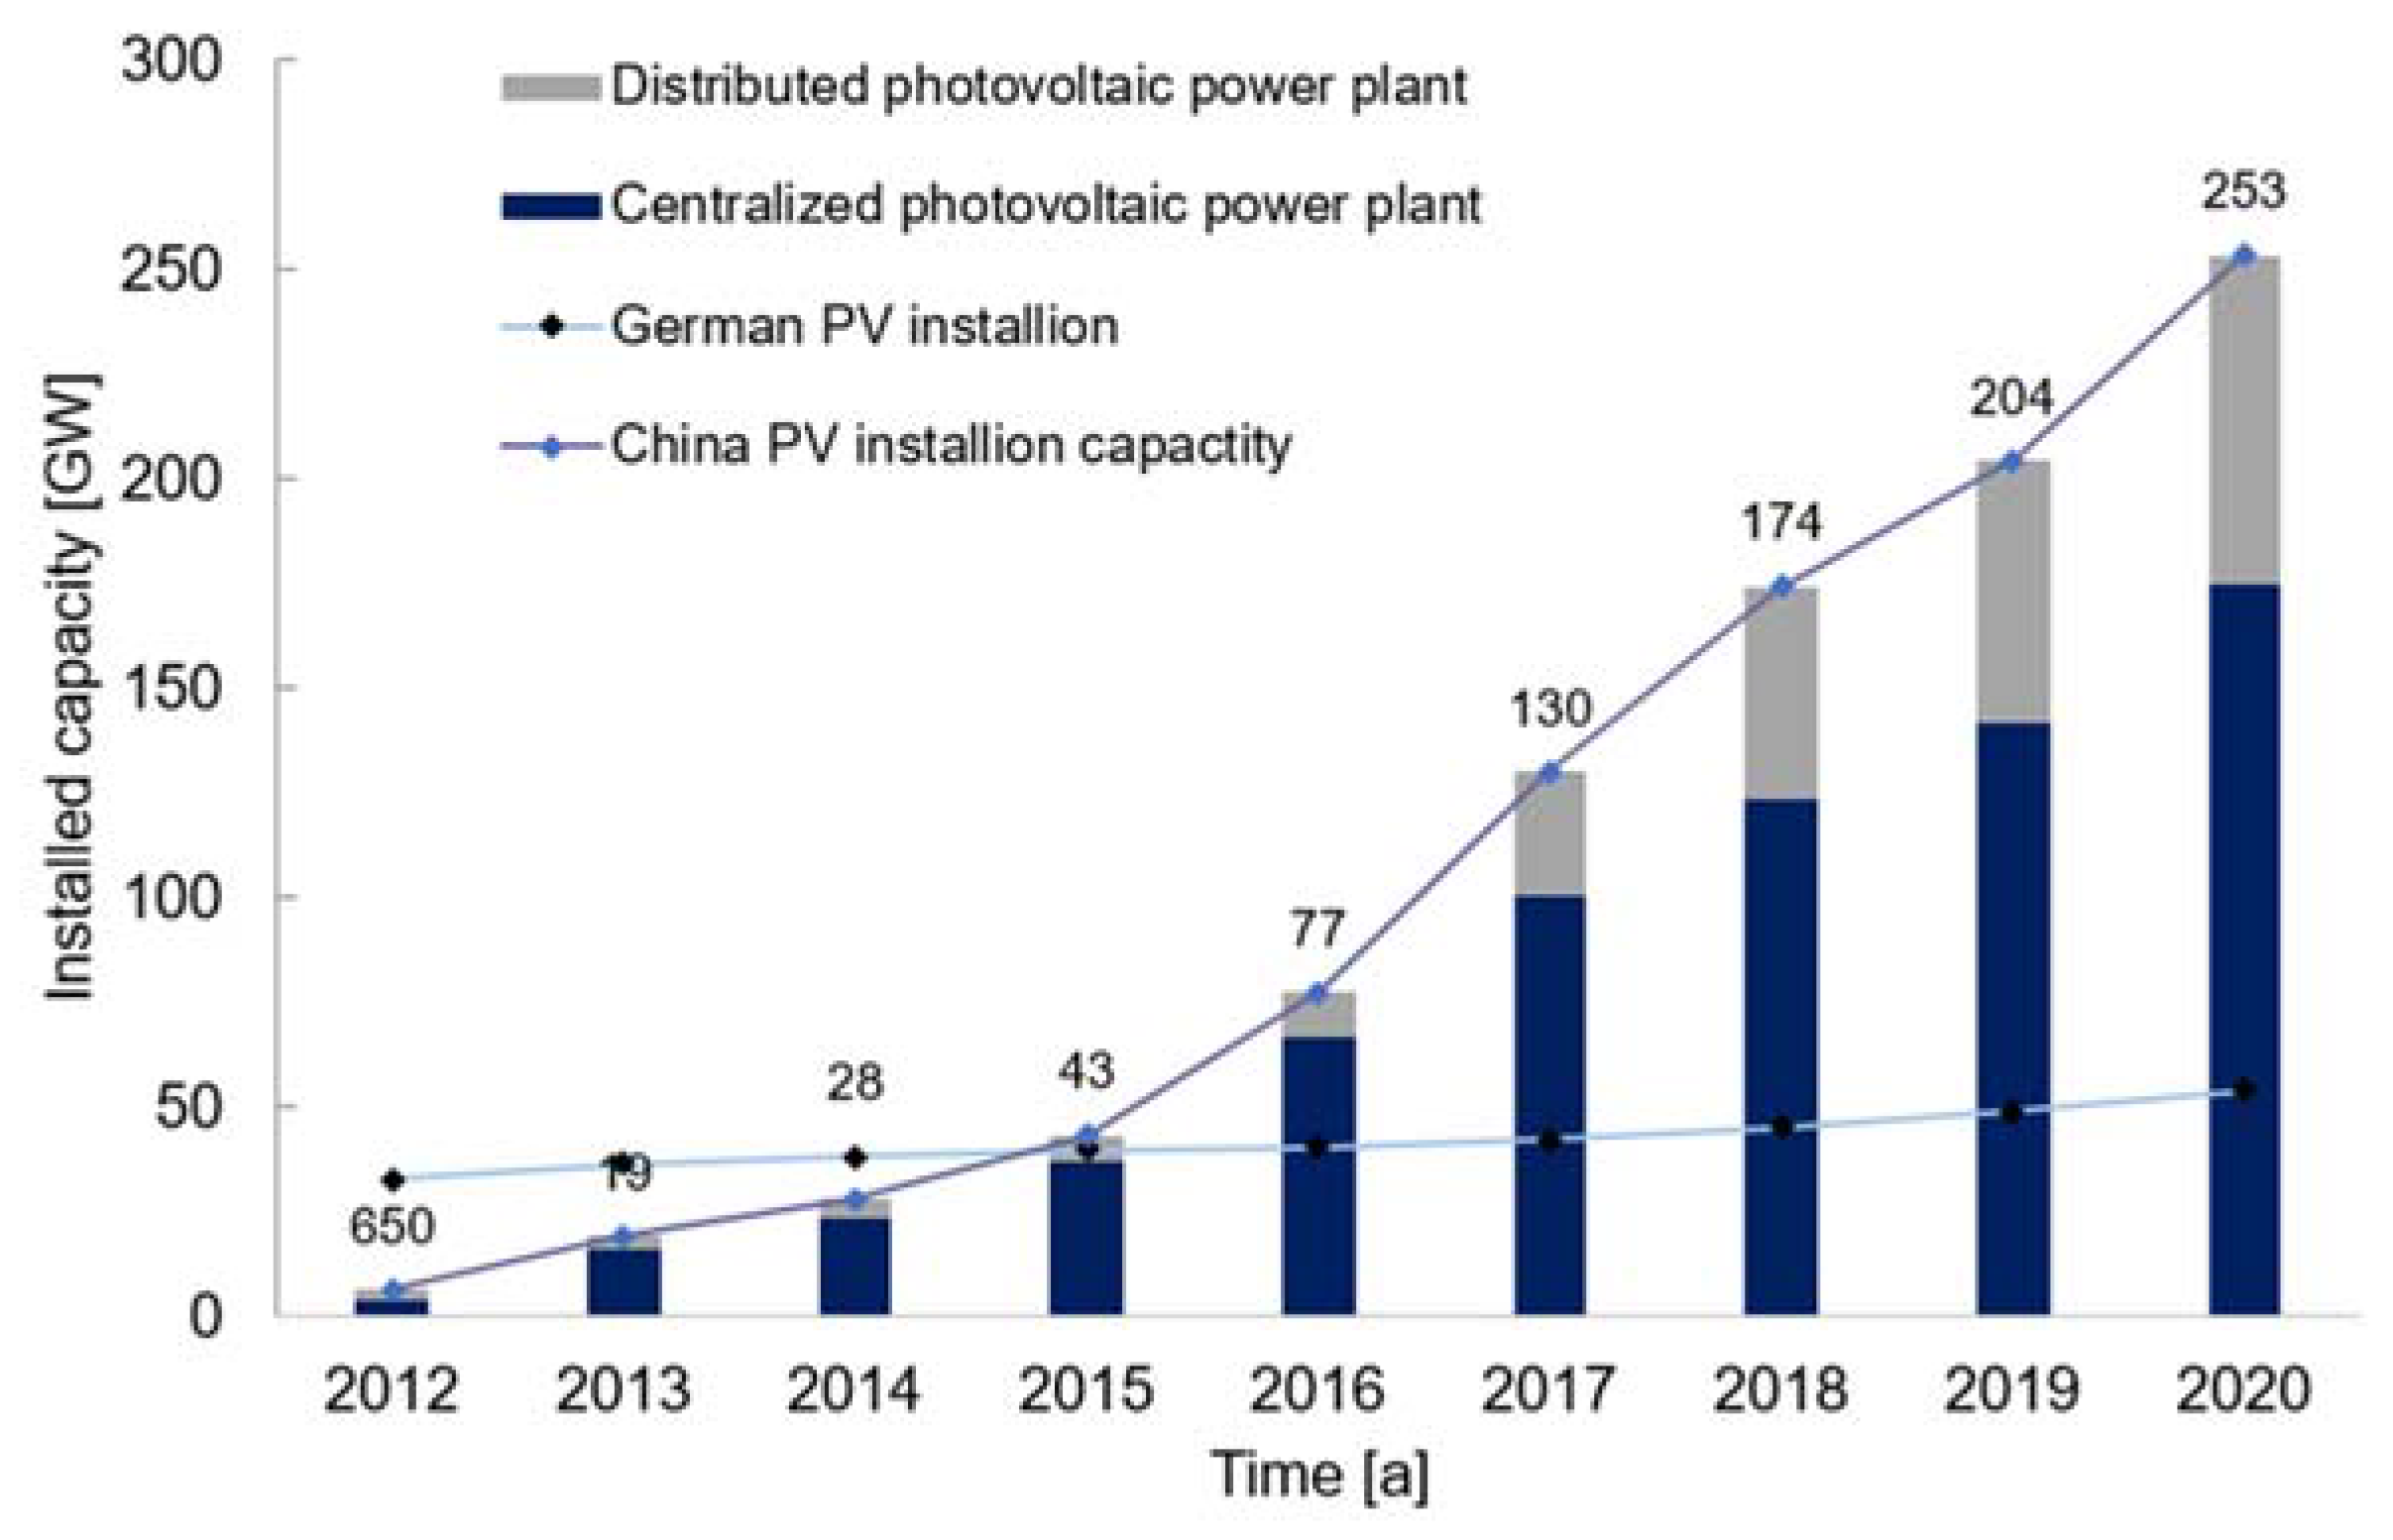
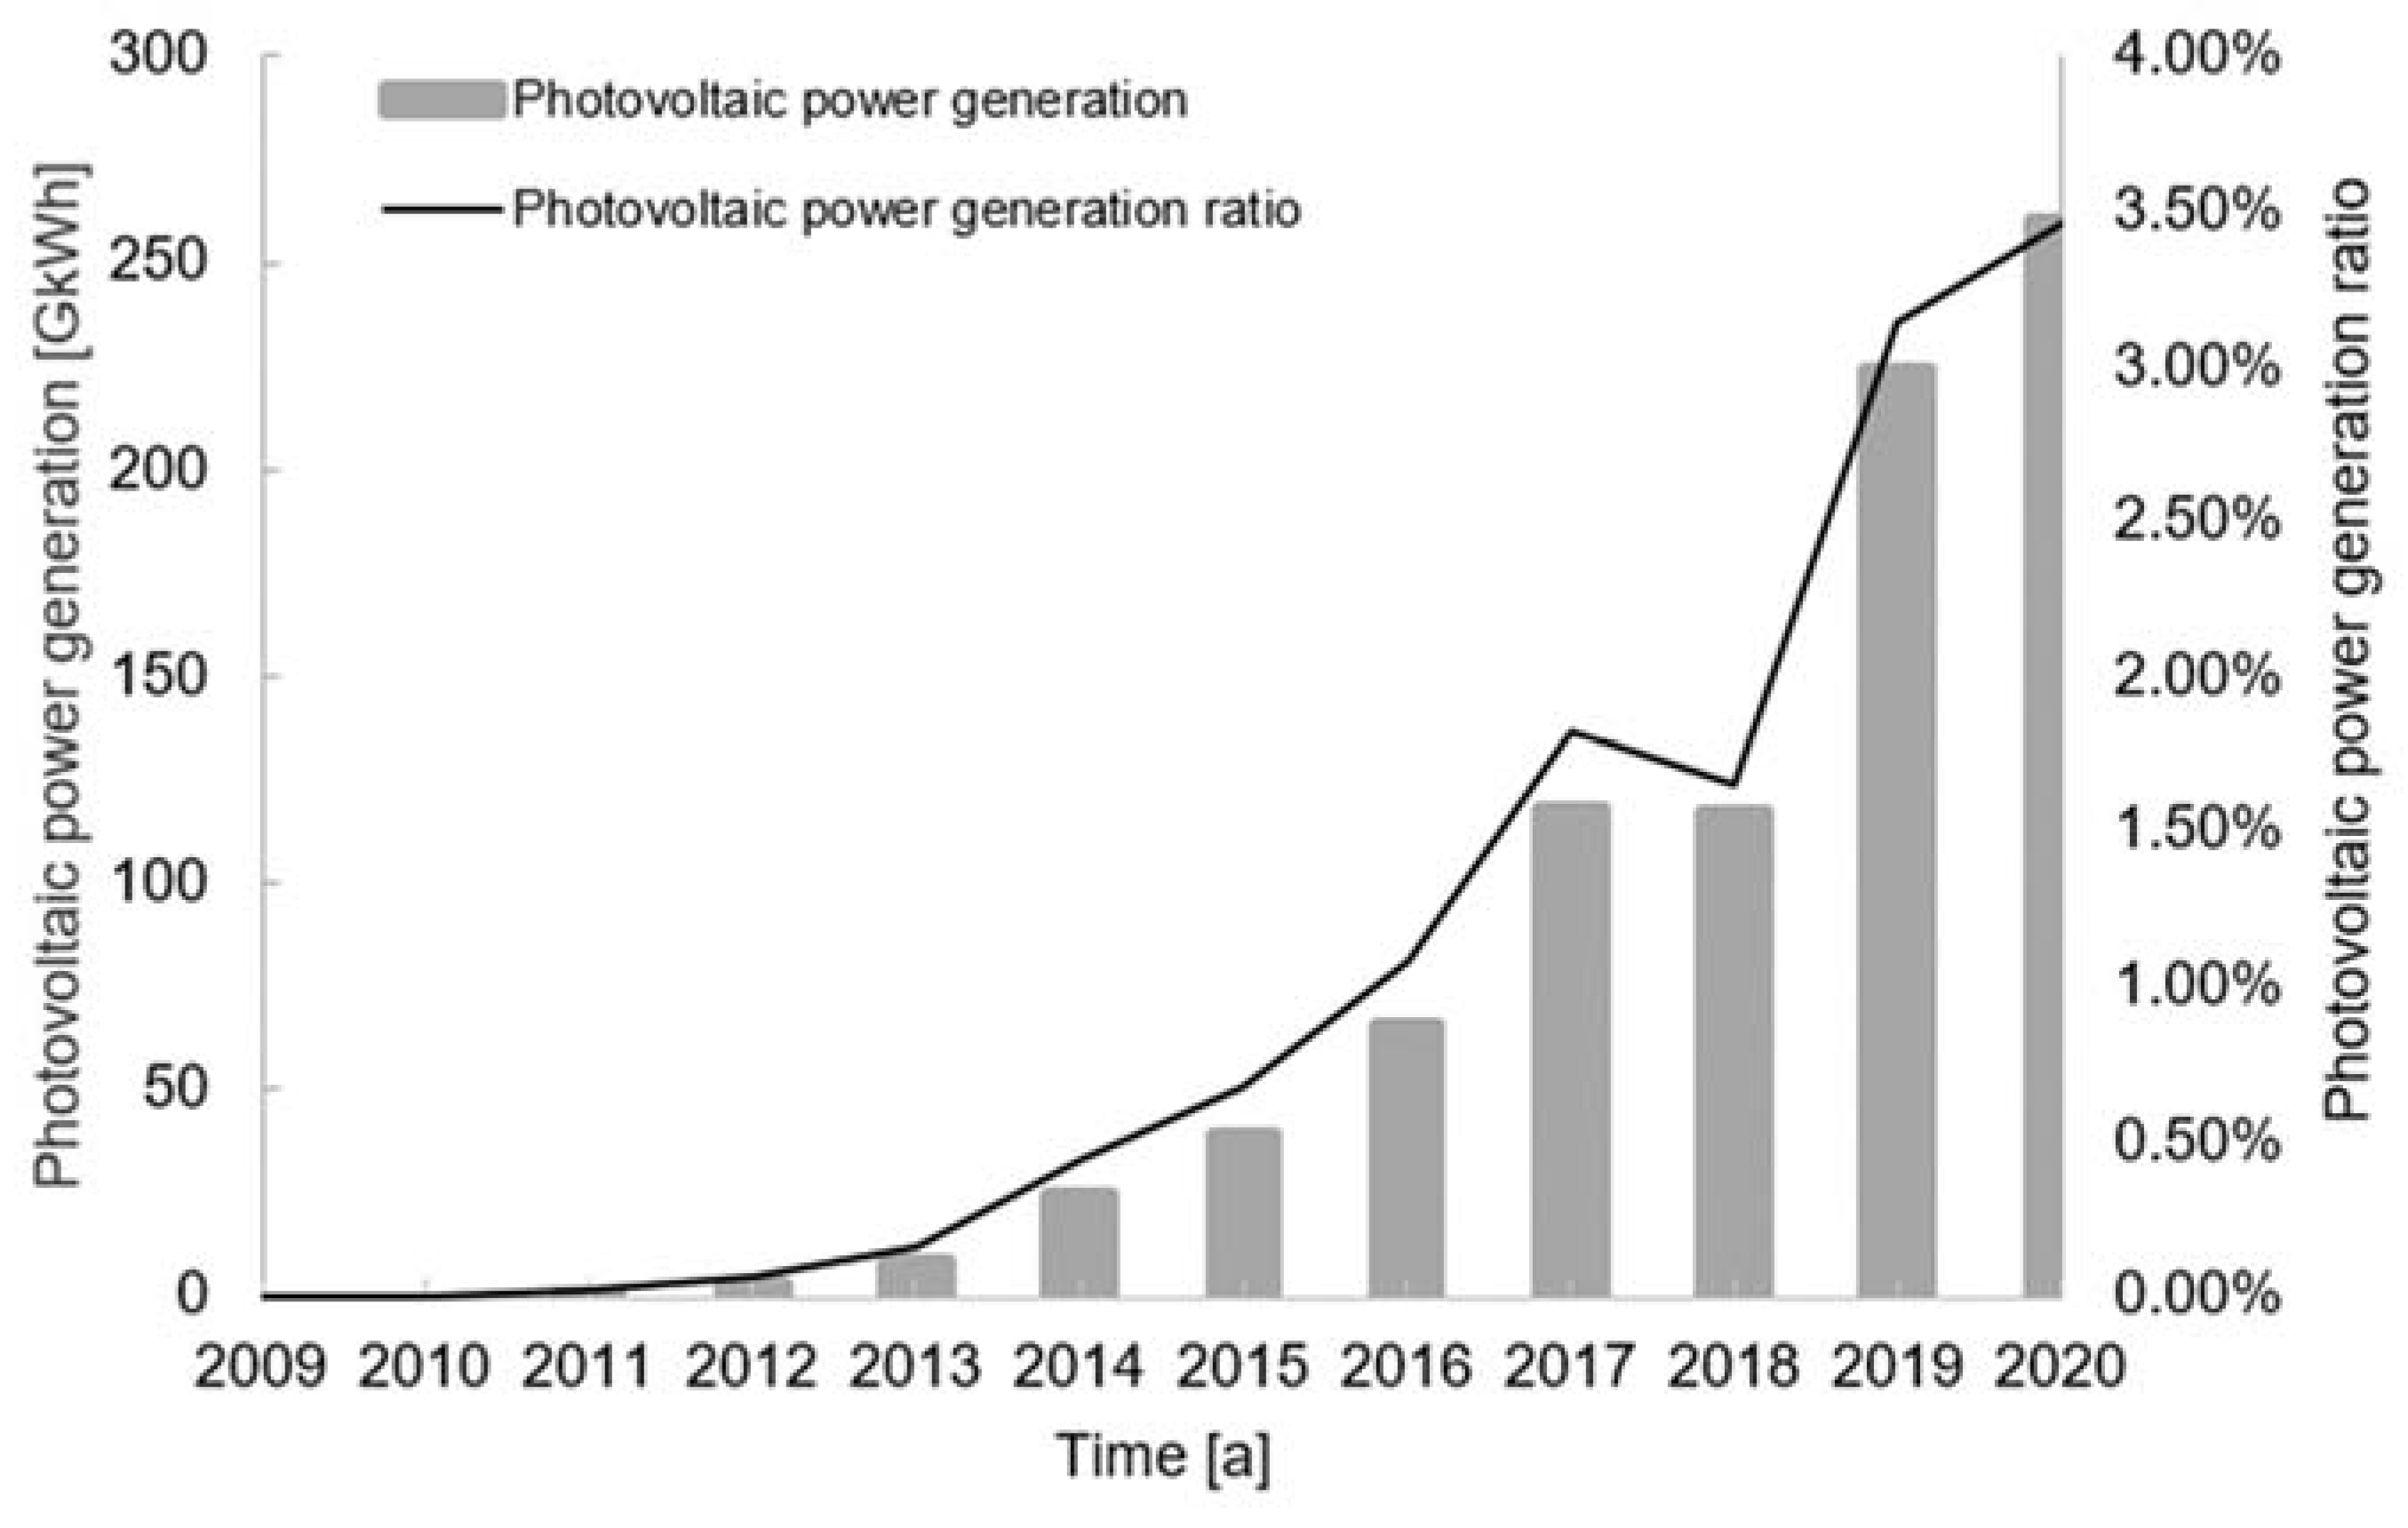
:1. Introduction
2. The Composition of Photovoltaic Power Generation Cost
2.1. Transmission Cost Ctrans
2.2. Operating Cost Cop
2.3. Financial Cost Cfn
2.4. Taxation Cost Ctax
3. LCOE Calculation Model
3.1. Amount of Power Generation Eg
3.1.1. Solar Energy Resources in China
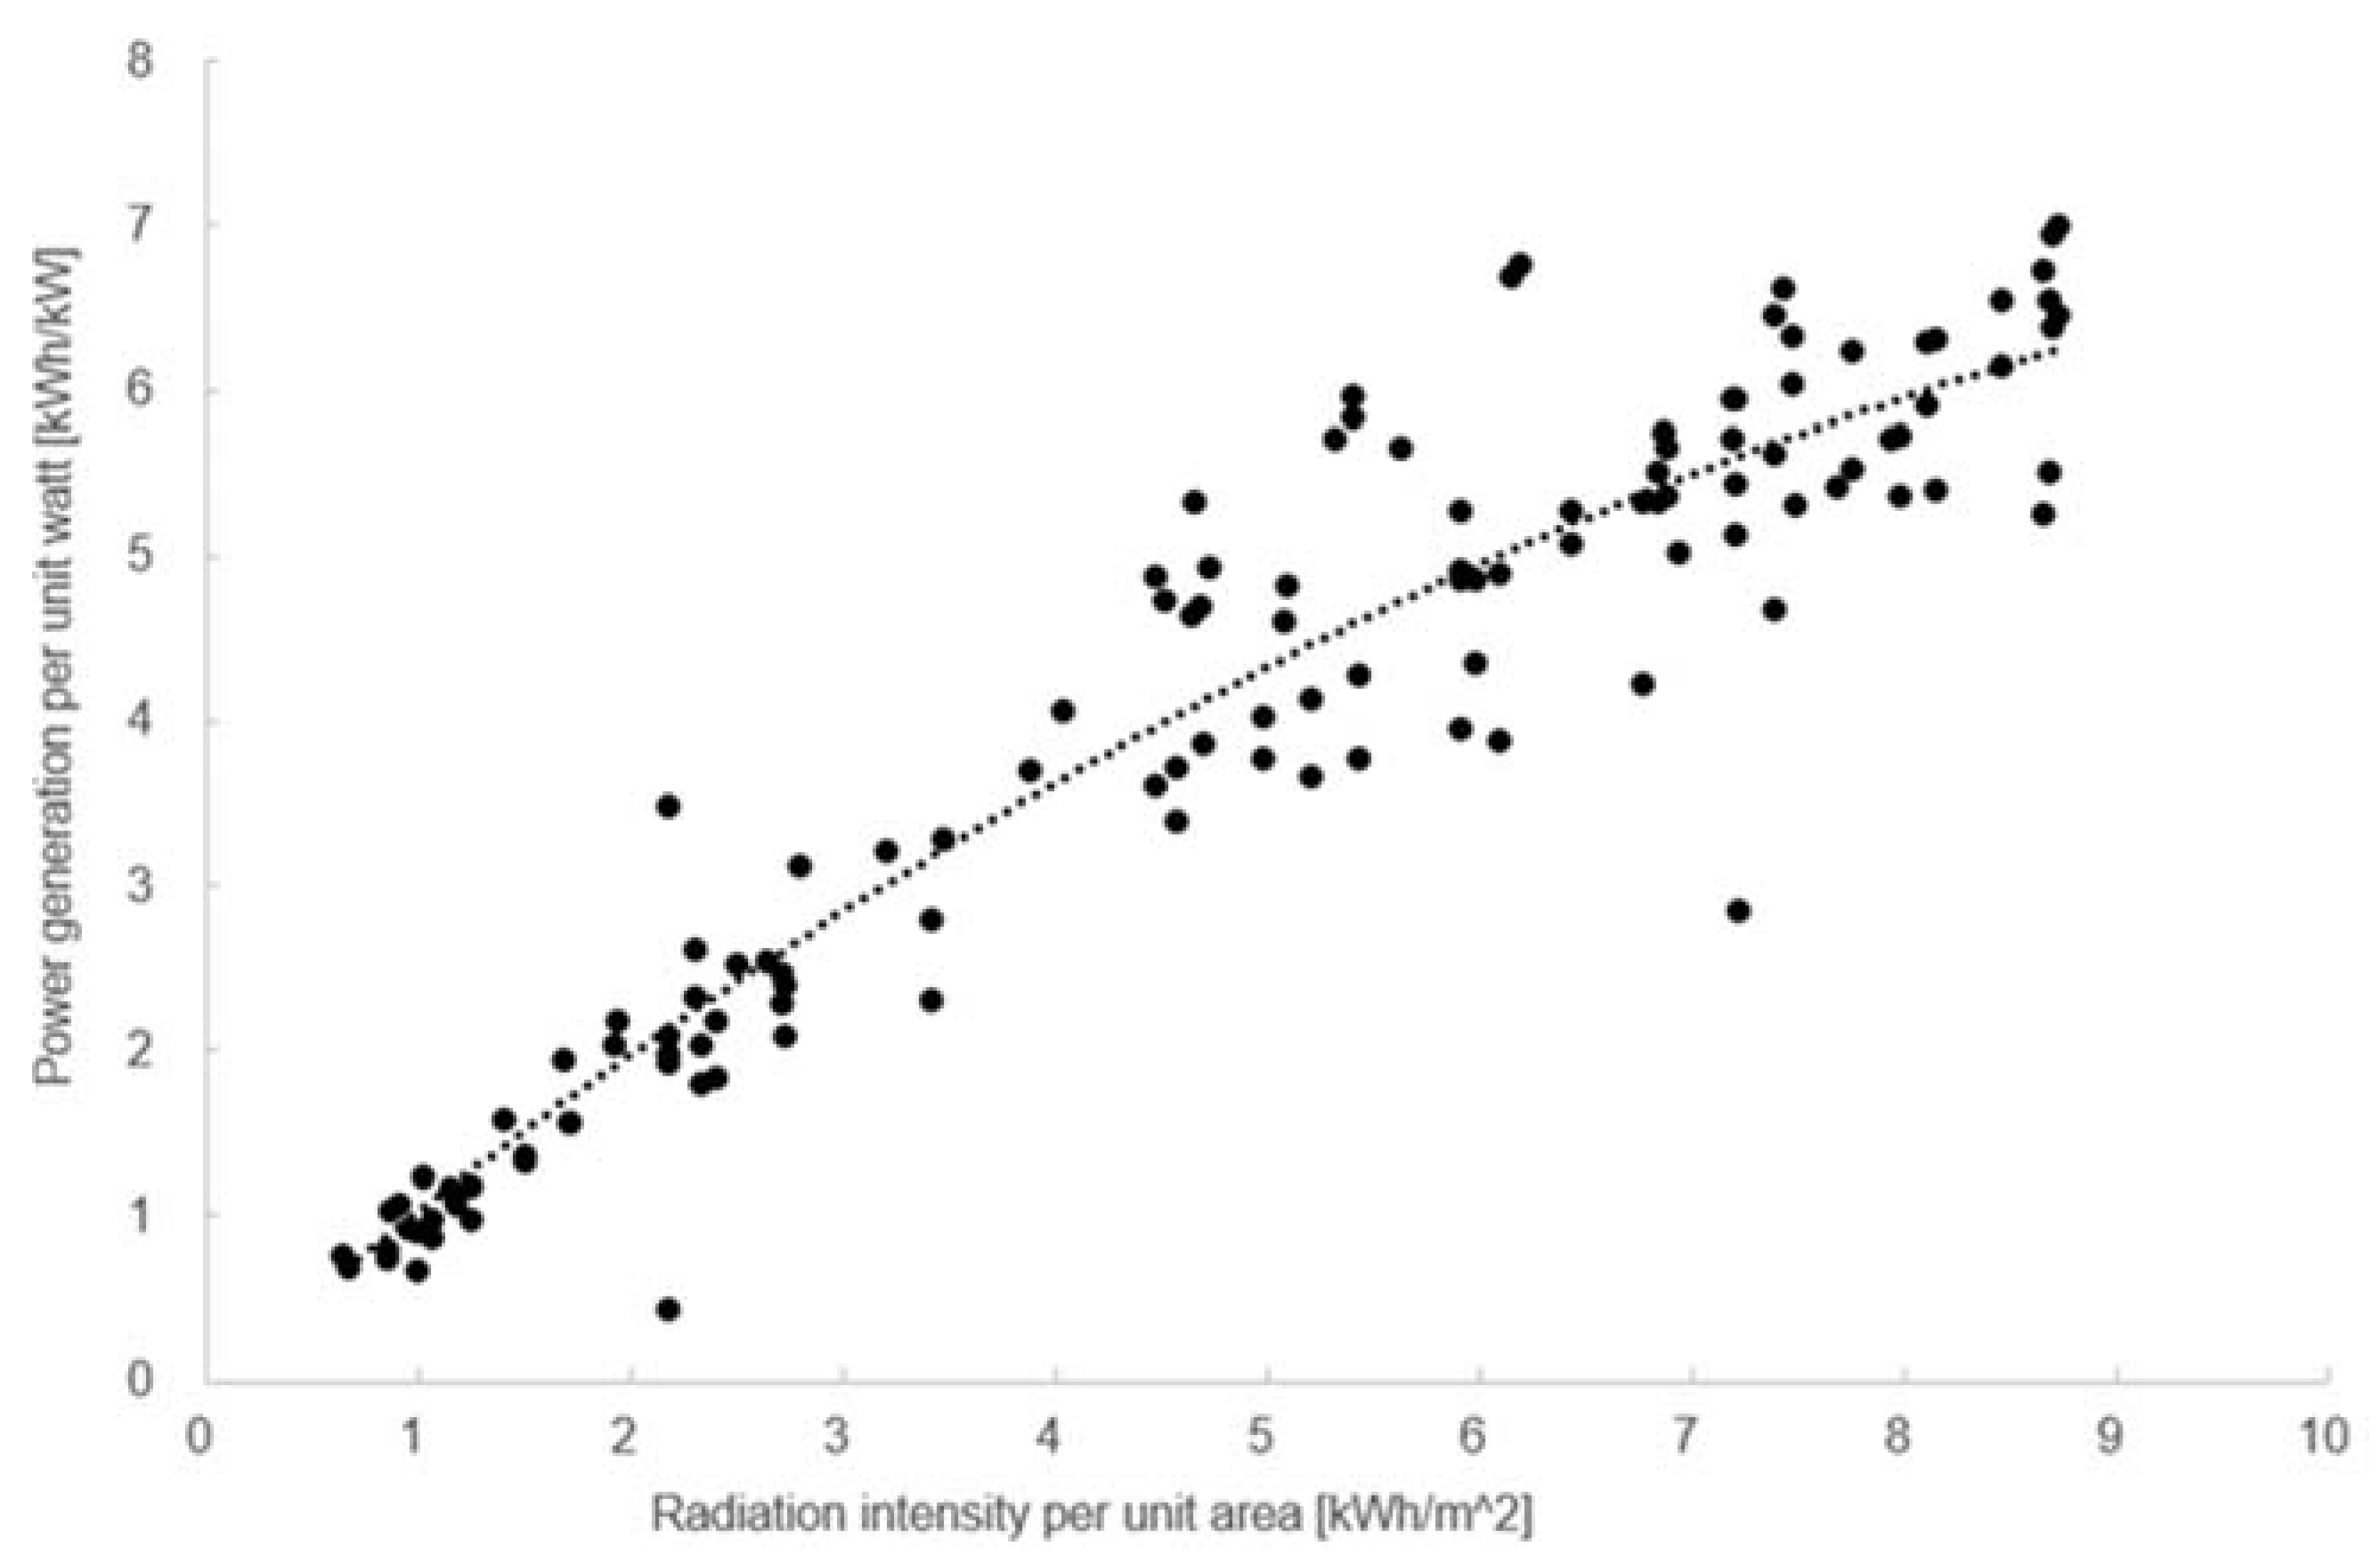
3.1.2. Power Generation Statistical Model
3.1.3. Transmission Loss
3.1.4. Effect of PV Array Inclination
3.2. Annual Income
3.3. Optimized Calculation Model of LCOE
4. Case Study and Analysis
4.1. Case Parameters
4.2. Evaluation Index
4.3. Sensitivity Analysis
5. Discussion on Feasibility of Photovoltaic Power to Grid Parity
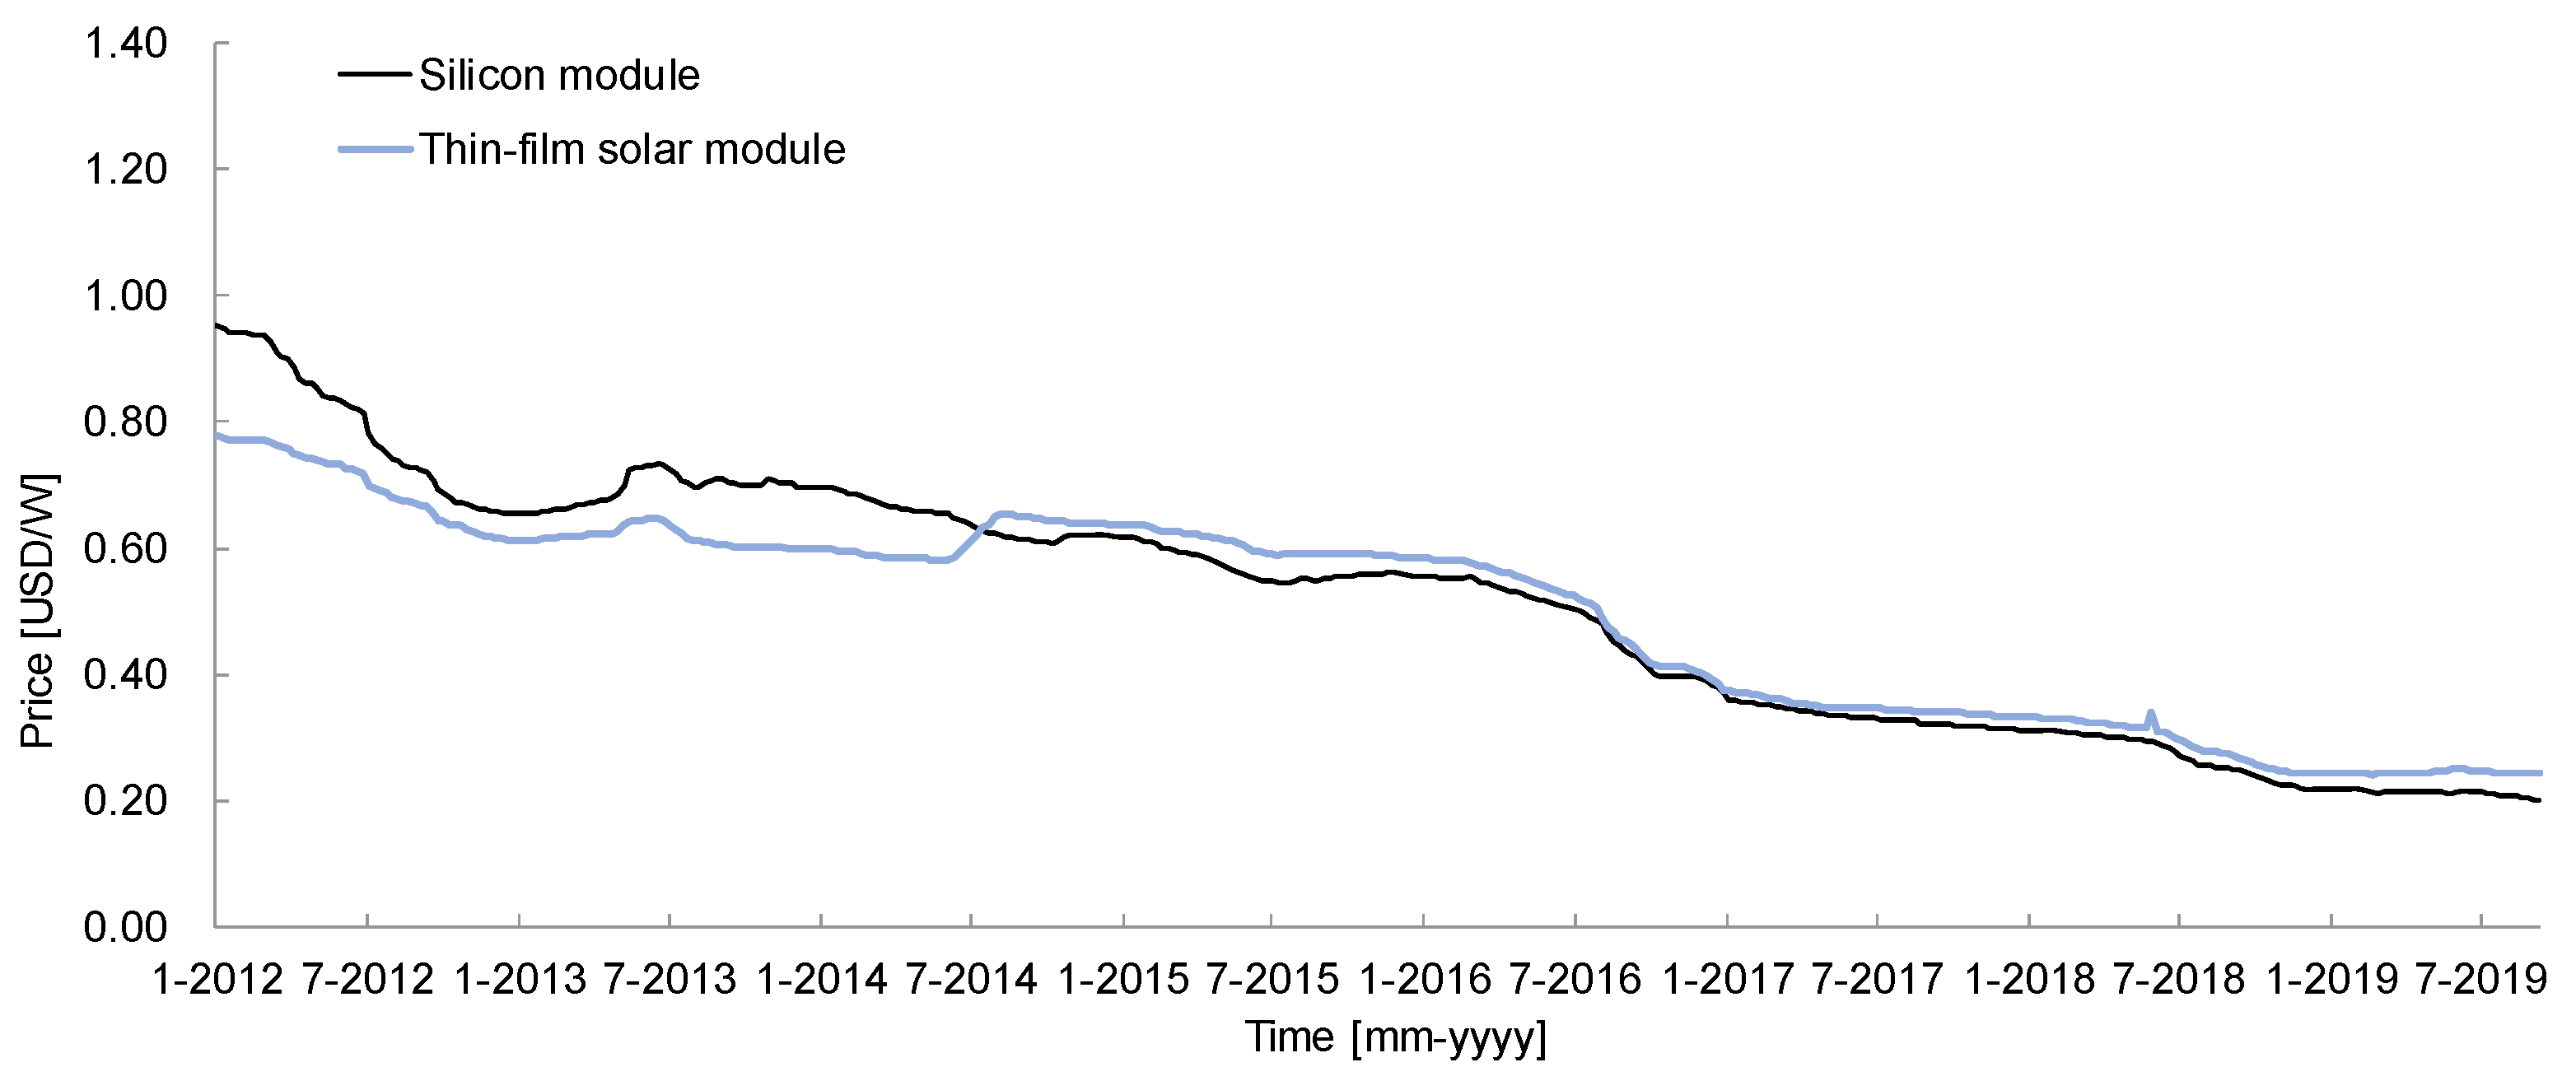
5.1. Lowering the System Unit Cost
5.2. Improving the Efficiency of PV Power Generation
5.3. Limitation Effect of Curtailment
5.4. Acceleration of Financial Leverage on PV Develoepment
6. Conclusions
Author Contributions
Funding
Institutional Review Board Statement
Informed Consent Statement
Data Availability Statement
Conflicts of Interest
References
- Lai, C.S.; Jia, Y.; Lai, L.L.; Xu, Z.; McCulloch, M.D.; Wong, K.P. A comprehensive review on large-scale photovoltaic system with applications of electrical energy storage. Renew. Sustain. Energy Rev. 2017, 78, 439–451. [Google Scholar] [CrossRef]
- Thapar, S.; Sharma, S.; Verma, A. Analyzing solar auctions in India: Identifying key determinants. Energy Sustain. Dev. 2018, 45, 66–78. [Google Scholar] [CrossRef]
- NBS—National Bureau of Statistics of China. National Data—Output of Electricity. Available online: http://data.stats.gov.cn/english/easyquery.htm?cn=A01 (accessed on 1 January 2019).
- Ouyang, X.; Lin, B. Levelized cost of electricity (lcoe) of renewable energies and required subsidies in china. Energy Policy 2014, 70, 64–73. [Google Scholar] [CrossRef]
- Yuan, J.; Sun, S.; Zhang, W.; Xiong, M. The economy of distributed PV in China. Energy 2014, 78, 939–949. [Google Scholar] [CrossRef]
- Atalay, Y.; Kalfagianni, A.; Pattberg, P. Renewable energy support mechanisms in the Gulf Cooperation Council states: Analyzing the feasibility of feed-in tariffs and auction mechanisms. Renew. Sustain. Energy Rev. 2017, 72, 723–733. [Google Scholar] [CrossRef]
- Karneyeva, Y.; Wüstenhagen, R. Solar feed-in tariffs in a post-grid parity world: The role of risk, investor diversity and business models. Energy Policy 2017, 106, 445–456. [Google Scholar] [CrossRef]
- Lüthi, S. Effective deployment of photovoltaics in the Mediterranean countries: Balancing policy risk and return. Sol. Energy 2010, 84, 1059–1071. [Google Scholar] [CrossRef]
- Clò, S.; D’Adamo, G. The dark side of the sun: How solar power production affects the market value of solar and gas sources. Energy Econ. 2015, 49, 523–530. [Google Scholar] [CrossRef]
- Lund, P.D. Boosting new renewable technologies towards grid parity—Economic and policy aspects. Renew. Energy 2011, 36, 2776–2784. [Google Scholar] [CrossRef]
- Ding, L.; Zhang, F.; Shuai, J. How Do Chinese Residents Expect of Government Subsidies on Solar Photovoltaic Power Generation?—A Case of Wuhan, China. Energies 2018, 11, 228. [Google Scholar] [CrossRef] [Green Version]
- Tongsopit, S. Thailand’s feed-in tariff for residential rooftop solar PV systems: Progress so far. Energy Sustain. Dev. 2015, 29, 127–134. [Google Scholar] [CrossRef]
- REN21. Renewables 2018 Global Status Report. Available online: http://www.ren21.net/wp-content/uploads/2016/06/GSR_2016_Full_Report_REN21.pd (accessed on 1 January 2019).
- Biondi, T.; Moretto, M. Solar Grid Parity dynamics in Italy: A real option approach. Energy 2015, 80, 293–302. [Google Scholar] [CrossRef] [Green Version]
- Zhang, H.L.; Van Gerven, T.; Baeyens, J.; Degrève, J. Photovoltaics: Reviewing the European feed-in-tariffs and changing PV efficiencies and costs. Sci. World J. 2014, 2014, 404913. [Google Scholar] [CrossRef]
- Manso-Burgos, Á.; Ribó-Pérez, D.; Alcázar-Ortega, M.; Gómez-Navarro, T. Local Energy Communities in Spain: Economic Implications of the New Tariff and Variable Coefficients. Sustainability 2021, 13, 10555. [Google Scholar] [CrossRef]
- Campana, P.E.; Cioccolanti, L.; François, B.; Jurasz, J.; Zhang, Y.; Varini, M.; Stridh, B.; Yan, J. Li-ion batteries for peak shaving, price arbitrage, and photovoltaic self-consumption in commercial buildings: A Monte Carlo Analysis. Energy Convers. Manag. 2021, 234, 113889. [Google Scholar] [CrossRef]
- Colasante, A.; D’Adamo, I.; Morone, P. Nudging for the increased adoption of solar energy? Evidence from a survey in Italy. Energy Res. Soc. Sci. 2021, 74, 101978. [Google Scholar] [CrossRef]
- Chen, R.; Sun, Y.L.; Chen, S.M.; Shen, H. LCOE analysis of grid-connected photovoltaic power generation project. Renew. Energy Resour. 2015, 33, 731–735. (In Chinese) [Google Scholar]
- Urmee, T.; Harries, D. A survey of solar PV program implementers in Asia and the Pacific regions. Energy Sustain. Dev. 2009, 13, 24–32. [Google Scholar] [CrossRef]
- Zou, H.; Du, H.; Brown, M.A.; Mao, G. Large-scale PV power generation in China: A grid parity and techno-economic analysis. Energy 2017, 134, 256–268. [Google Scholar] [CrossRef]
- Choi, D.G.; Park, S.Y.; Park, N.B.; Hong, J.C. Is the concept of “grid parity” defined appropriately to evaluate the cost-competitiveness of renewable energy technologies? Energy Policy 2015, 86, 718–728. [Google Scholar] [CrossRef]
- Zweibel, K. Should solar photovoltaics be deployed sooner because of long operating life at low, predictable cost? Energy Policy 2010, 38, 7519–7530. [Google Scholar] [CrossRef]
- Andrychowicz, M. The Impact of Energy Storage along with the Allocation of RES on the Reduction of Energy Costs Using MILP. Energies 2021, 14, 3783. [Google Scholar] [CrossRef]
- Said, M.; EL-Shimy, M.; Abdelraheem, M.A. Photovoltaics energy: Improved modeling and analysis of the levelized cost of energy (LCOE) and grid parity—Egypt case study. Sustain. Energy Technol. Assess. 2015, 9, 37–48. [Google Scholar] [CrossRef]
- Jun, S. Mathematical model analysis of photovoltaic power generation cost. Sol. Energy 2012, 2, 53–58. (In Chinese) [Google Scholar]
- Zhang, W.; Zhao, Y.; Huang, F.; Zhong, Y.; Zhou, J. Forecasting the Energy and Economic Benefits of Photovoltaic Technology in China’s Rural Areas. Sustainability 2021, 13, 8408. [Google Scholar] [CrossRef]
- Khan, M.F.; Pervez, A.; Modibbo, U.M.; Chauhan, J.; Ali, I. Flexible Fuzzy Goal Programming Approach in Optimal Mix of Power Generation for Socio-Economic Sustainability: A Case Study. Sustainability 2021, 13, 8256. [Google Scholar] [CrossRef]
- Reichelstein, S.; Sahoo, A. Time of day pricing and the levelized cost of intermittent power generation. Energy Econ. 2015, 48, 97–108. [Google Scholar] [CrossRef]
- Reichelstein, S.; Yorston, M. The prospects for cost competitive solar PV power. Energy Policy 2013, 55, 117–127. [Google Scholar] [CrossRef]
- Abdullah, G.; Nishimura, H. Techno-Economic Performance Analysis of a 40.1 kWp Grid-Connected Photovoltaic (GCPV) System after Eight Years of Energy Generation: A Case Study for Tochigi, Japan. Sustainability 2021, 13, 7680. [Google Scholar] [CrossRef]
- Kumar, K.A.; Sundareswaran, K.; Venkateswaran, P.R. Performance study on a grid connected 20kWp solar photovoltaic installation in an industry in Tiruchirappalli (India). Energy Sustain. Dev. 2014, 23, 294–304. [Google Scholar] [CrossRef]
- Deb, J.; Yohanis, Y.G.; Norton, B. The impact of array inclination and orientation on the performance of a grid-connected photovoltaic system. Renew. Energy 2006, 32, 118–140. [Google Scholar] [CrossRef]
- Yakup, M.A.B.H.M.; Malik, A.Q. Optimum tilt angle and orientation for solar collector in Brunei Durassalam. Renew. Energy 2001, 24, 223–234. [Google Scholar] [CrossRef]
- Klein, S.A.; Theilacker, J.C. An algorithm for calculating monthly-average radiation on inclined surfaces. J. Sol. Energy Eng. Trans. ASME 1981, 103, 29–33. [Google Scholar] [CrossRef]
- Zhang, X.; Liu, W.; Zhang, H.; Yuan, J. Can China Realize the Grid Parity Target of Centralized Photovoltaic Power by 2020? Emerg. Mark. Financ. Trade 2019, 57, 740–756. [Google Scholar] [CrossRef]
- Li, H.; Yu, Y.; Xie, Y.; Zhang, J. Could wind and PV energies achieve the grid parity in China until 2020? Filomat 2016, 30, 4173–4189. [Google Scholar] [CrossRef]


| Types | Solar Radiation Intensity (MJ·m−2) | Areas |
|---|---|---|
| I | 6700~8370 | Qinghai, Gansu, Ningxia, Xinjiang, northwestern Hebei, Shanxi, Inner Mongolia, etc. |
| II | 5400~6700 | Shandong, Henan, Jilin, Liaoning, Yunnan, etc. |
| III | 4200~5400 | Middle and lower reaches of the Yangtze River, Fujian, Zhejiang, Guangdong, etc. |
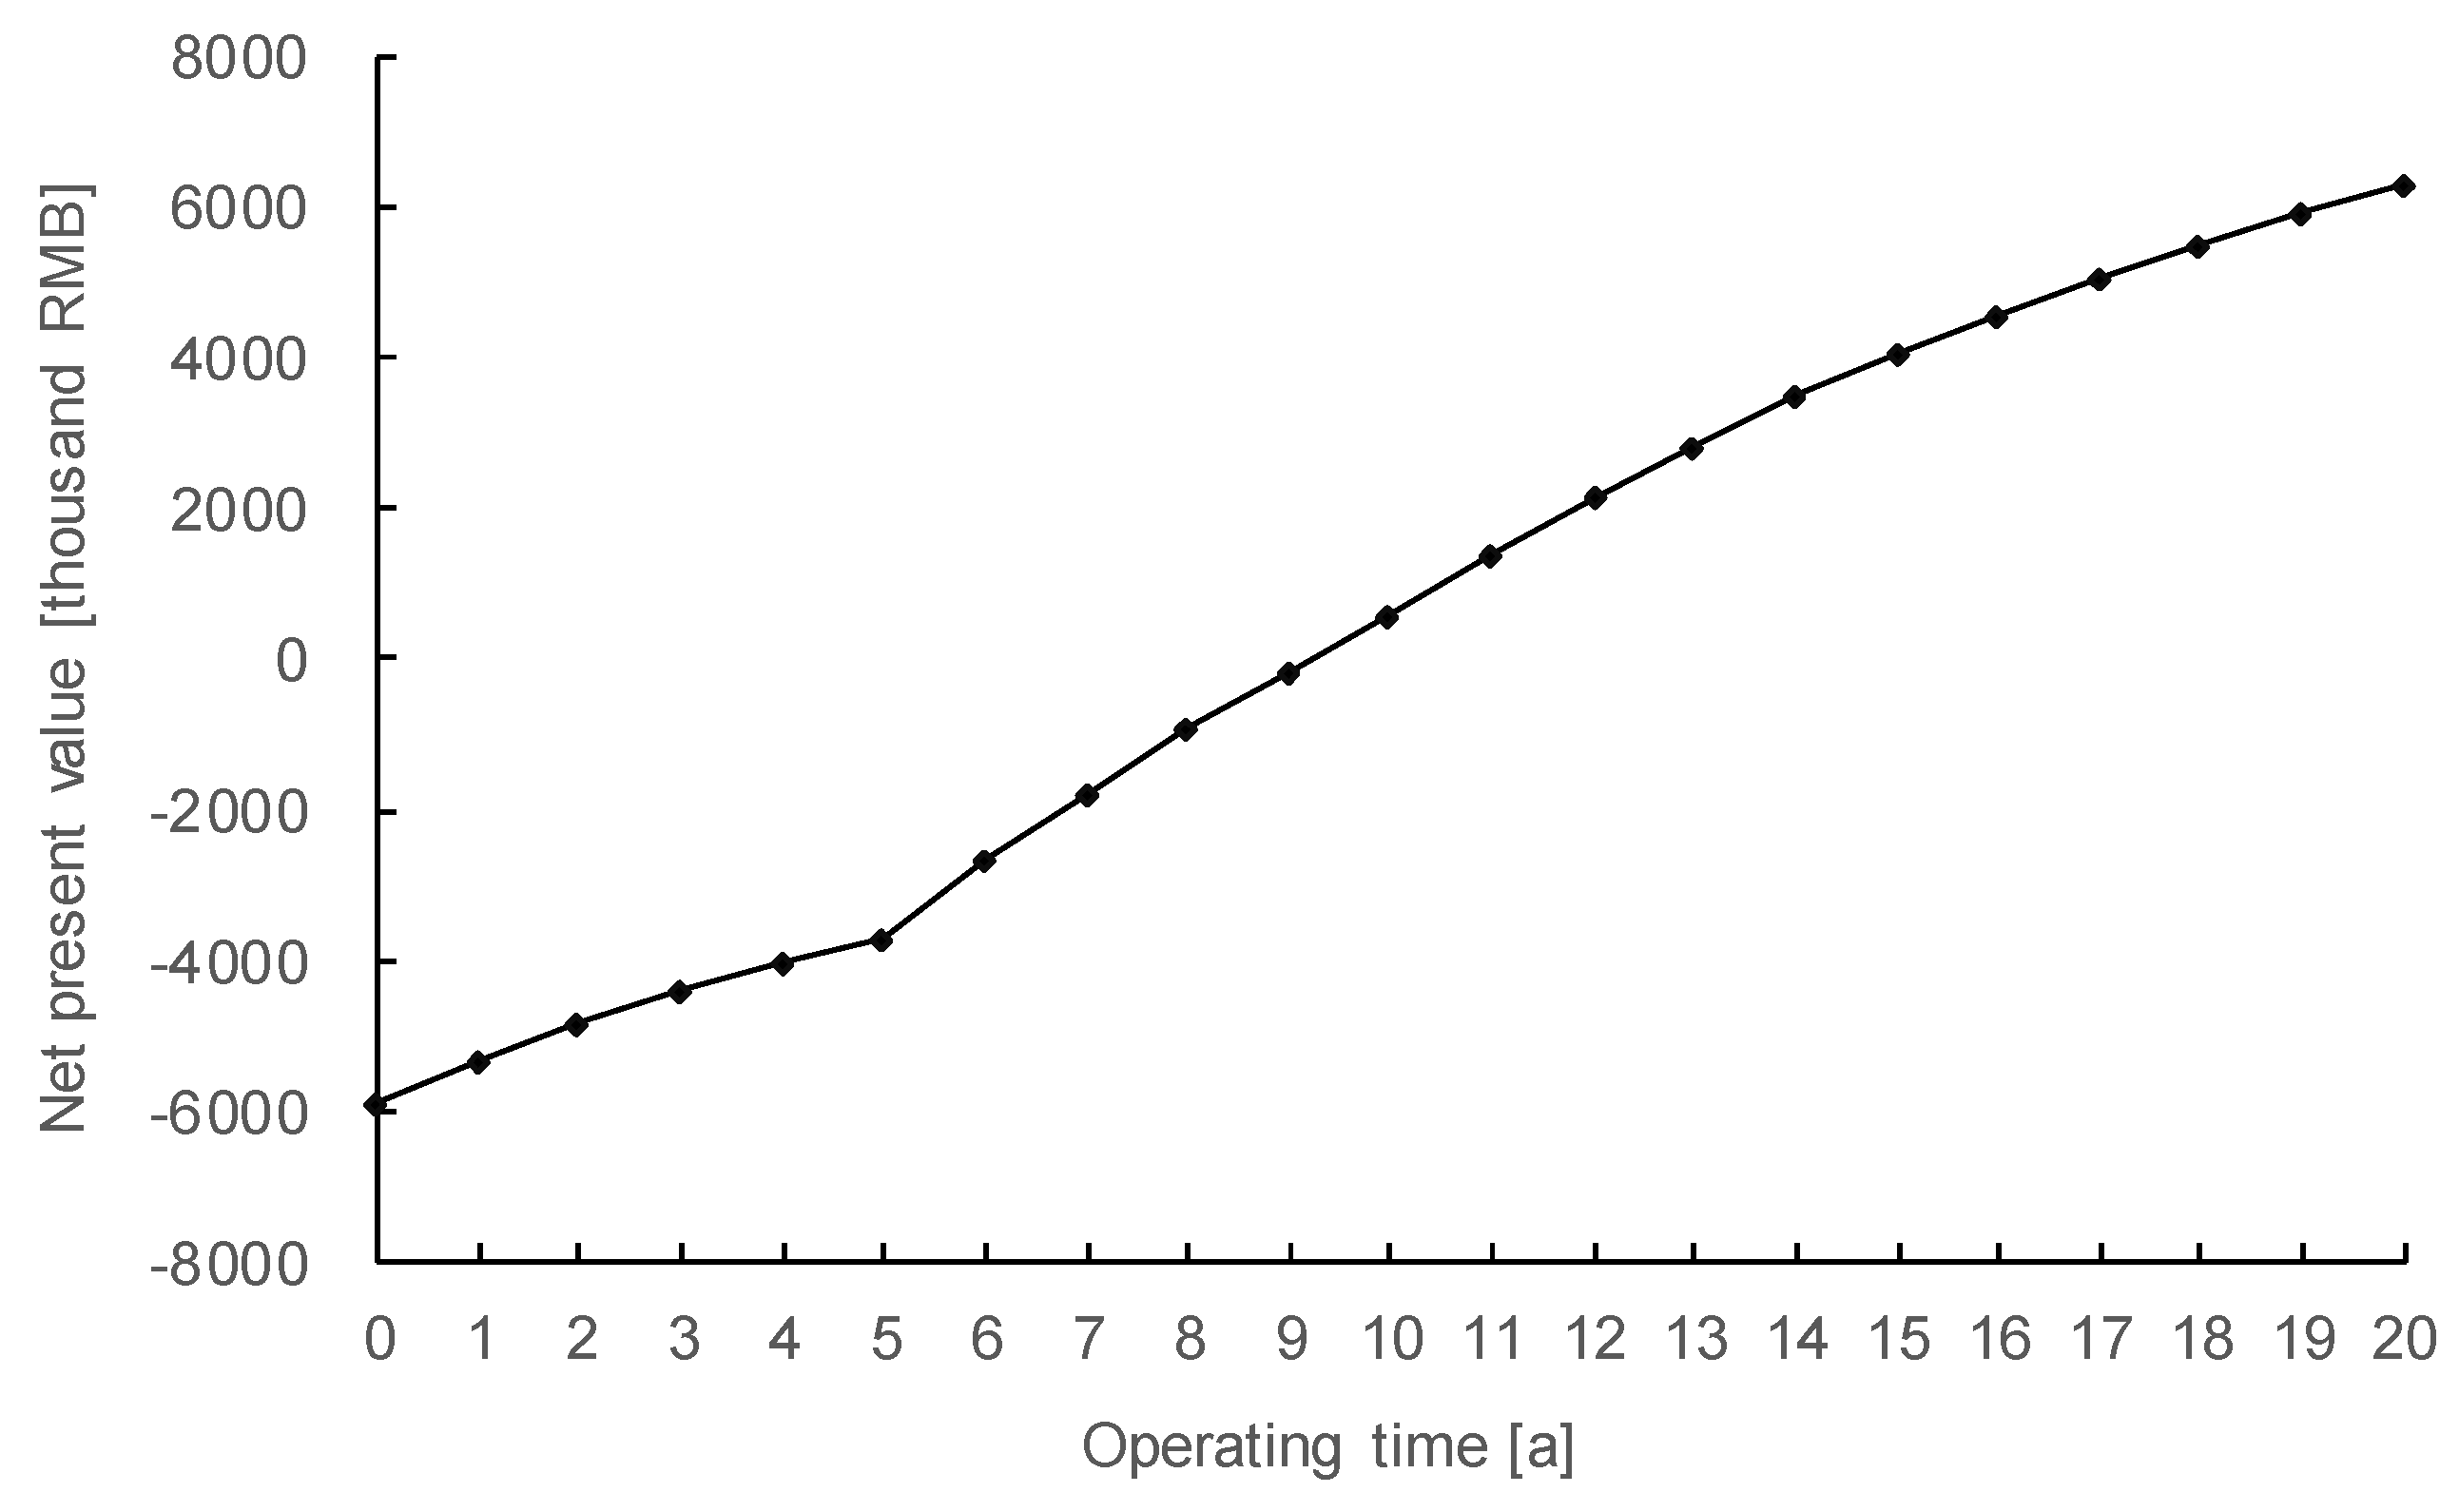
| Year | Annual Power Generation /kWh | Financial Cost /Thousand RMB | Operating Cost /Thousand RMB | Income /Thousand RMB | Taxation/Thousand RMB | Net Profit after Tax /Thousand RMB | Net Present Value /Thousand RMB |
|---|---|---|---|---|---|---|---|
| 0 | 0 | 0 | 0 | 0 | 0 | 0 | −5850.0 |
| 1 | 3,139,602 | 1504 | 80 | 3371.43 | 628.48 | 590.58 | −5303.2 |
| 2 | 3,087,143 | 1504 | 82.4 | 3315.1 | 608.4 | 555.2 | −4827.2 |
| 3 | 3,061,708 | 1504 | 84.87 | 3287.78 | 598.34 | 535.47 | −4402.1 |
| 4 | 3,036,273 | 1504 | 87.42 | 3260.47 | 588.26 | 515.69 | −4023.1 |
| 5 | 30,108,380 | 1504 | 90.04 | 3233.16 | 578.16 | 495.86 | −3685.6 |
| 6 | 29,854,030 | 0 | 92.74 | 3205.84 | 944.04 | 1603.96 | −2674.8 |
| 7 | 29,599,680 | 0 | 95.52 | 3178.53 | 933.9 | 1584 | −1750.6 |
| 8 | 29,345,340 | 0 | 98.39 | 3151.22 | 923.74 | 1563.98 | −905.6 |
| 9 | 29,090,990 | 0 | 101.34 | 3123.91 | 913.55 | 1543.9 | −133.3 |
| 10 | 28,836,640 | 0 | 104.38 | 3096.59 | 903.35 | 1523.75 | 572.5 |
| 11 | 28,582,290 | 0 | 107.51 | 3069.28 | 1032.06 | 1920.35 | 1396.1 |
| 12 | 28,327,950 | 0 | 110.74 | 3041.97 | 1021.81 | 1900.06 | 2150.7 |
| 13 | 28,073,600 | 0 | 114.06 | 3014.65 | 1011.54 | 1879.7 | 2841.8 |
| 14 | 27,819,250 | 0 | 117.48 | 2987.34 | 1001.24 | 1859.26 | 3474.8 |
| 15 | 27,564,900 | 0 | 121.01 | 2960.03 | 990.91 | 1838.75 | 4054.5 |
| 16 | 27,310,560 | 0 | 124.64 | 2932.72 | 980.56 | 1818.16 | 4585.2 |
| 17 | 27,056,210 | 0 | 128.38 | 2905.4 | 970.18 | 1797.49 | 5071 |
| 18 | 26,801,860 | 0 | 132.23 | 2878.09 | 959.77 | 1776.73 | 5515.6 |
| 19 | 26,547,510 | 0 | 136.19 | 2850.78 | 949.34 | 1755.89 | 5922.5 |
| 20 | 26,293,170 | 0 | 140.28 | 2823.46 | 938.87 | 1734.95 | 6294.7 |
| Influence Factor | LCOE | LCOE Sensitivity Coefficient | Internal Rate of Return | Internal Rate of Return Sensitivity Coefficient | Payback Period | Payback Period Sensitivity Coefficient |
|---|---|---|---|---|---|---|
| Feed-in tariffs | 0.8796 | 0.16 | 15.83% | 0.66 | 8.78 | 0.20 |
| Amount of power generation | 0.8438 | 0.56 | 19.89% | 1.73 | 6.82 | 2.39 |
| System unit cost | 0.8413 | 0.59 | 20.11% | 1.86 | 6.84 | 2.36 |
| Loan ratio | 0.8785 | 0.17 | 16.44% | 0.30 | 8.91 | 0.05 |
| Loan interest rate | 0.8978 | 0.04 | 16.76% | 0.12 | 8.92 | 0.04 |
| CERs price | 0.8961 | 0.02 | 16.88% | 0.04 | 8.95 | 0.01 |
Publisher’s Note: MDPI stays neutral with regard to jurisdictional claims in published maps and institutional affiliations. |
© 2021 by the authors. Licensee MDPI, Basel, Switzerland. This article is an open access article distributed under the terms and conditions of the Creative Commons Attribution (CC BY) license (https://creativecommons.org/licenses/by/4.0/).
Share and Cite
Lu, Z.; Chen, Y.; Fan, Q. Study on Feasibility of Photovoltaic Power to Grid Parity in China Based on LCOE. Sustainability 2021, 13, 12762. https://doi.org/10.3390/su132212762
Lu Z, Chen Y, Fan Q. Study on Feasibility of Photovoltaic Power to Grid Parity in China Based on LCOE. Sustainability. 2021; 13(22):12762. https://doi.org/10.3390/su132212762
Chicago/Turabian StyleLu, Zheng, Yunfei Chen, and Qiaoqiao Fan. 2021. "Study on Feasibility of Photovoltaic Power to Grid Parity in China Based on LCOE" Sustainability 13, no. 22: 12762. https://doi.org/10.3390/su132212762
APA StyleLu, Z., Chen, Y., & Fan, Q. (2021). Study on Feasibility of Photovoltaic Power to Grid Parity in China Based on LCOE. Sustainability, 13(22), 12762. https://doi.org/10.3390/su132212762